Influence of Food and Beverage Companies on Retailer Marketing Strategies and Consumer Behavior - MDPI
←
→
Page content transcription
If your browser does not render page correctly, please read the page content below
International Journal of
           Environmental Research
           and Public Health

Review
Influence of Food and Beverage Companies on
Retailer Marketing Strategies and Consumer Behavior
Amelie A. Hecht 1, *, Crystal L. Perez 1 , Michele Polascek 2 , Anne N. Thorndike 3 ,
Rebecca L. Franckle 4 and Alyssa J. Moran 1
 1    Department of Health Policy and Management, Johns Hopkins Bloomberg School of Public Health,
      Baltimore, MD 21205, USA; CPerez20@jhu.edu (C.L.P.); AMoran10@jhu.edu (A.J.M.)
 2    Westbrook College of Health Professions, University of New England, Portland, ME 04103, USA;
      mpolacsek@une.edu
 3    Department of Medicine, Massachusetts General Hospital and Harvard Medical School, Boston, MA 02114,
      USA; athorndike@mgh.harvard.edu
 4    Program in Global Public Health and the Common Good, Department of Biology, Boston College,
      Chestnut Hill, MA 02467, USA; franckle@bc.edu
 *    Correspondence: AHecht3@jhu.edu

 Received: 11 September 2020; Accepted: 3 October 2020; Published: 10 October 2020

 Abstract: The retail food environment plays an important role in shaping dietary habits that
 contribute to obesity and other chronic diseases. Food and beverage manufacturers use trade
 promotion—incentives paid to retailers—to influence how products are placed, priced, and promoted
 in stores. This review aims to: (1) catalogue trade promotion practices that manufacturers use to
 influence retailer marketing strategies, and (2) describe how these retailer marketing strategies affect
 consumer purchasing behavior and attitudes. Researchers searched five databases, Academic Search
 Ultimate, Business Source Ultimate, PsycINFO, PubMed, and Web of Science, to identify literature
 from industry and academic sources published in English through November 2019. Twenty articles
 describing manufacturer trade promotion practices were synthesized and provided insight into four
 types of trade promotion practices: category management, slotting allowances, price discounts,
 and cooperative advertising. Fifty-four articles describing the impact of retailer marketing on
 consumers were synthesized and graded for quality of evidence. While comparison across studies
 is challenging, findings suggest that retailer marketing strategies, such as price promotions and
 prominent placement, lead to increased sales. Results can guide efforts by policymakers, public health
 practitioners, and food retailers to design retail environments that improve healthy eating while
 maintaining retailer financial interests. Additional research should measure the impact of retailer
 marketing strategies on consumer diet quality and retailer outcomes (e.g., return-on-investment).

 Keywords: trade promotion; price; promotion; placement; food and beverage; food retailer; grocery;
 consumer behavior; marketing; chronic disease; choice architecture

1. Introduction
      The retail food environment plays a critical role in shaping dietary habits and is an important setting
for interventions to improve diet quality and prevent diet-related chronic diseases, including diabetes,
obesity, and cardiovascular disease [1]. Evidence suggests that marketing of unhealthy foods and
beverages may be more common and effective at driving sales compared to marketing of healthy foods
and beverages [2–9]. Low-income and racial and ethnic minority populations are disproportionately
targeted by unhealthy food marketing, which may exacerbate disparities in diet quality and diet-related
chronic disease [10]. For example, advertisements for low-cost, high-calorie, and low-nutrition foods

Int. J. Environ. Res. Public Health 2020, 17, 7381; doi:10.3390/ijerph17207381    www.mdpi.com/journal/ijerph
Int. J. Environ. Res. Public Health 2020, 17, 7381                                                 2 of 34

and beverages appear more often in media watched by African Americans [11]; and retailers increase
marketing of sugar-sweetened beverages when Supplemental Nutrition Assistance Program (SNAP)
benefits are issued each month [12].
      Retail food stores, which include both online and brick-and-mortar retailers (see Appendix A
for a list of retail formats), are the primary source of food for many populations in both developed
and developing economies [13]. In the US, consumers acquire the majority of their calories from
supermarkets and superstores [14]. Considering that consumers make an estimated three-quarters of
their purchasing decisions while shopping [15], in-store marketing techniques may play an important
role in shaping purchase attitudes and decisions [9,16].
      Food and beverage manufacturers use trade promotion practices (TPP), or incentives to retailers,
to shape in-store marketing [17]. This paper focuses on how TPP influence three out of the “4Ps” of
marketing: price, place (both the channels through which products are sold and where products are
placed in stores), and promotion (efforts to engage consumers and communicate product features,
such as signs) [18]. The fourth “P” of marketing, “product,” is less frequently shaped by TPP, but rather
by manufacturers in-house, through efforts such as packaging and product formulation. Similarly,
TPP more commonly shapes where items are placed in stores and on shelves (i.e., product placement)
rather than the channels through which products are sold. Food and beverage manufacturers allocate
about $1 trillion annually to TPP—between 50 and 70% of their marketing budgets and nearly 20% of
their total revenue [17,19].
      There is growing interest among policymakers, researchers, advocates, and retailers in creating
policies and corporate practices that promote healthy food retail. To inform efforts to improve the
food retail environment, it is important to understand (1) the types of TPP currently used by food
and beverage manufacturers to influence retailer marketing strategies, and (2) how retailer marketing
strategies, in turn, affect consumers. The first part of this research question—which types of TPP
are used to influence retailers—is understudied, particularly in the public health literature. A 2016
investigative report commissioned by the Center for Science in the Public Interest, which describes TPP
but did not use a systematic approach to gather data or survey the literature, served as a launching
point for this aim [17].
      The second part of this research question—how retailer marketing strategies impact
consumers—has been only partially explored in previous reviews. Specifically, three previous reviews
have focused on price promotions’ impact on consumers; all three concluded that price promotions
were associated with consumer behavior [3,9,20]. In a 2012 integrative review, Glanz et al. synthesized
literature on the impact of price, placement, and promotion on consumer behavior but limited their
search to literature focused on brick-and-mortar grocery stores. They found that all three marketing
strategies were associated with increased product liking and purchasing, with some variation in degree
of impact by strategy [21]. This review serves as an update to and expansion of the Glanz et al. review,
synthesizing literature since 2011 and including other nontraditional retail settings such as online
retailers and convenience stores. This review focuses on identifying, where possible, whether and how
outcomes differ when healthy versus unhealthy products are marketed. Findings from this study can
inform efforts by advocates, policymakers, public health practitioners, and food retailers to design
food retail environments that promote healthy eating while maintaining retailer financial interests.
This study will also identify gaps in the literature and provide directions for future research.

2. Methods
      Two research questions were identified: (1) how do food and beverage manufacturers use TPP to
influence retailer marketing strategies; and (2) how do retailer marketing strategies impact consumer
purchasing behavior and attitudes? Searches were conducted for peer-reviewed and grey literature
(e.g., conference abstracts and proceedings, reports, dissertations) in English. To identify publications
from diverse disciplines including public health, business, economics, marketing, and social sciences,
the following databases were searched: Academic Search Ultimate, Business Source Ultimate, PsycINFO,
Int. J. Environ. Res. Public Health 2020, 17, 7381 3 of 34
PubMed, and Web of Science. Search terms for each research question were developed by the study
authors in consultation with industry and academic experts and a research librarian (Appendix B).
The selection and analysis of the results were carried out under the Preferred Reporting Items for
Systematic Reviews and Meta-Analyses (PRISMA) guidelines [22].
2.1. Research Question 1: Search Strategy and Inclusion Criteria
To answer the first research question, a narrative review was conducted to identify and catalogue
types of trade promotion practices used by food and beverage manufacturers to influence retailer
marketing strategies (Figure 1). Articles published through November 2019 were included. Article titles
and abstracts were independently screened by two authors (AH and CP) for inclusion. Full-text review
was completed by the first author (AH). Any questions about study inclusion were resolved through
discussion with the second author (CP).
Figure 1. Preferred Reporting Items for Systematic Reviews and Meta-Analyses (PRISMA) Diagram
for Research Question 1.
2.2. Research Question 2: Search Strategy and Inclusion Criteria
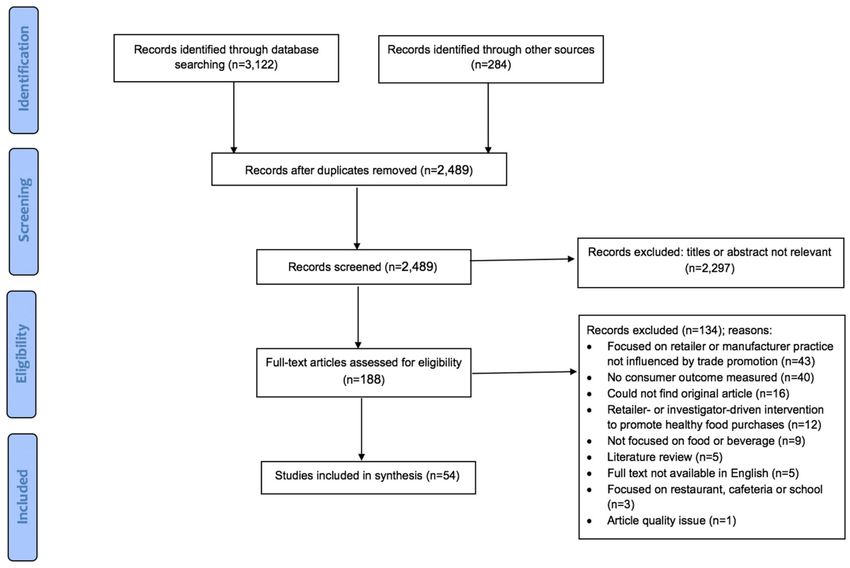
To answer the second research question, a systematic review was conducted to understand the
impact of retailer marketing strategies on consumer behavior and attitudes (Figure 2). Inclusion criteria
were that the article must (1) be published between January 2011 and November 2019 (to capture studies
published since the Glanz et al. review) and (2) measure the impact of retailer marketing strategies
influenced by TPP on consumer purchasing behavior or attitudes. Studies were excluded if they
assessed (1) an investigator-driven healthy retail intervention (review by Karpyn et al., forthcoming);
(2) retailer or manufacturer practices unrelated to TPP (e.g., product labeling); (3) restaurants, vending
machines, cafeterias, or schools, or (4) were not original research (e.g., literature reviews). The excluded
literature reviews were incorporated into the background and discussion section of this review.
Two authors (AH and CP) independently reviewed titles, abstracts, and full texts for inclusion and
met to reconcile differences. Reference lists of included articles were also scanned, and relevant
articles included.Int. J. Environ. Res. Public Health 2020, 17, 7381 4 of 34
Figure 2. PRISMA Diagram for Research Question 2.
2.3. Quality of Studies
The quality of included studies for the second research question was assessed using the
Newcastle–Ottawa quality assessment scale, adapted for cross-sectional studies [23] (Appendix C).
The Newcastle–Ottawa scale assigns studies composite quality scores by awarding a certain number of
stars out of a total of nine possible stars. Similar to an approach used by Bennett et al., amendments were
made to the scale; for articles using aggregate sales data, a “not applicable” option was allowed for
categories of “non-respondents” and “controlling for confounding variables” [3]. The denominator (total
number of possible stars) was reduced appropriately. Two authors (AH and CP) independently graded
the included studies and met to reconcile differences. As described by Takehashi and Hashizume [24],
studies that earned fewer than a third of the possible stars were classified as low-quality studies.
3. Results
3.1. Narrative Review of Trade Promotion Practices
Twenty articles were identified that described TPP used by manufacturers to influence
retailer marketing strategies [25–44]. Of these, 13 articles were published in the peer-reviewed
literature or through conference proceedings and seven articles were published in trade publications.
Of peer-reviewed publications, two were in public health or public policy journals and the remainder
were in journals focused on retail, economics, or marketing. Thirteen articles focused on the US,
six focused on other countries, including Brazil, the United Kingdom (UK), New Zealand, Sweden,
Finland, Italy, and Portugal, and one used a global perspective.
Results indicate that manufacturers use four types of TPP to shape retailer marketing strategies:
(1) category management, (2) slotting allowances, (3) price discounts, and (4) cooperative advertising
(Table 1). These terms may differ across retailers, manufacturers, and countries; for example, in Europe,
slotting allowances are also referred to as listing charges [25]. Certain types of TPP may be used
more often for some product categories and in some retail formats. For example, slotting allowances
are more often used in highly concentrated, processed product categories such as beverages, snacks,Int. J. Environ. Res. Public Health 2020, 17, 7381 5 of 34
and candy [32]. In smaller stores, such as convenience and corner stores, more informal incentive-based
agreements between suppliers and retailers are common [36].
Table 1. Definitions of trade promotion practices.
Trade Promotion Practice (n) Definition
Collaboration between retailers and manufacturers to make decisions regarding
Category management (11)
product assortment, supply, pricing, and promotion for entire categories
Lump-sum fees paid by manufacturers to retailers in exchange for access to the
Slotting allowances (7)
consumer market (e.g., shelf space, prominent placement)
Fixed discounts (merchandise is sold at a set discount for a specified period) or
Price discounts (4) performance-based discounts (discounts are tied to a measure of performance
such as units sold or displayed)
Cost-sharing between retailers and manufacturers to create and distribute
Cooperative advertising (1)
promotional materials
Note: some articles discussed multiple trade promotion practices, so ns sum to greater than the total number of
included articles.
3.1.1. Category Management
Eleven articles focused on category management [27,28,31,34,35,37–39,41,43,44]. Category management
is the collaboration between manufacturers and retailers to make decisions regarding product
assortment, space allocation, pricing, and in-store promotion for entire product categories. Categories
(e.g., ice cream, yogurt) are treated as strategic business units to ensure maximum efficiency and
boost sales for the whole category, rather than for individual brands [27]. Category management
typically uses a shopper-centric and research-based approach to promote consumer satisfaction and
loyalty [39,41,44].
A leading manufacturer in a category often serves as the “category captain,” overseeing category
management and customizing plans on a store-by-store basis. Such an arrangement is often considered
beneficial for both retailers and manufacturers: it allows retailers to concentrate on other aspects of
their business, and manufacturers to focus on increasing category market share and profitability [28].
While some retailers have safeguards in place to ensure category captains are not unfairly advantaged,
critics contend that because category captains have influence over which brands and products within a
category are stocked and promoted, category captains may be able to exclude competitors [28,43].
3.1.2. Slotting Allowances
Seven articles focused on slotting allowances, or lump-sum fees paid by manufacturers to retailers
in exchange for access to the consumer market (i.e., shelf space) [25,29,32,33,36,40,42]. These include
slotting fees to introduce a new product onto shelves, pay-to-stay fees to maintain shelf position,
floor fees to make sales presentations and offer in-store samples, and display fees, which may cover
premium placement, display materials (e.g., wire racks, prefabricated displays), and promotional
signage. Theoretical explanations for why slotting allowances have become widely used include a
market power explanation (i.e., slotting allowances reflect growing power among retailers who control
access to the market) and an efficient market explanation (i.e., slotting allowances enable efficient
allocation of scarce shelf space) [25]. According to the efficient market rationale, slotting allowances
help retailers defray the costs and risks associated with new product introductions in light of an
estimated 70% failure rate for new products [45]. Evidence suggests that slotting allowances in the
US alone total between $6 billion and $18 billion per year [25,46]. Nationwide introduction of a new
product in the US can cost up to $1–2 million in slotting fees [45]. In countries with more independent
retailers, slotting allowances are less common.Int. J. Environ. Res. Public Health 2020, 17, 7381 6 of 34
3.1.3. Price Discounts
Four articles discussed price discounts that manufacturers provide to retailers to incentivize
retailers to stock, display, or provide promotional discounts for their products [26,33,36,47].
Manufacturer discounts may be fixed or performance-based [47]. Fixed discounts are price reductions
offered to the retailer on a per unit or per case basis, often at the time of billing, for a limited period of
time. Performance-based discounts are tied to a measure of retailer performance such as number of units
sold, displayed, or offered on price promotion. Discounts may be passed on to the consumer in the form
of temporary price reductions (TPR) or coupons, affecting final sale prices [33,47]. Manufacturers may
also provide retailers products for free to encourage retailers to stock new products or provide customer
discounts, giveaways, or in-store samples [26,36].
3.1.4. Cooperative Advertising
One article focused on cooperative advertising. Cooperative advertising is the collaboration
between manufacturers and retailers to create and distribute local promotional materials such as
newspaper inserts or direct mail flyers [42]. A cooperative advertising agreement may be initiated by
either a retailer or manufacturer. Typically, the manufacturer will design the promotional materials,
providing product images and templates, and the manufacturer and retailer will share the cost of
printing and distribution.
3.2. Literature Review of Impacts of Retailer Marketing Strategies on Consumers
Fifty-four articles that describe the impact of retailer marketing strategies on consumer behavior
or attitudes were identified (Table 2). These included peer-reviewed literature (n = 44), dissertations
(n = 4), conference proceedings (n = 3), reports from government or industry (n = 2), and trade
publications (n = 1). Studies occurred in the US (n = 17), UK (n = 11), other European countries
(n = 8), Asian and Middle Eastern countries (n = 8), Australia or New Zealand (n = 6), Canada (n = 1),
and Egypt (n = 1); two articles did not specify location. Articles focused on a range of retail formats,
including supermarket/grocery stores (n = 43); convenience/corner stores (n = 9); online retailers (n = 4);
dollar stores (n = 1); other (e.g., organic markets, liquor stores, pharmacies, n = 9); and four articles did
not specify the retail format assessed. Ten articles evaluated multiple retail formats. Data sources used
varied widely; scanner or panel data was the most commonly used data source (e.g., Kantar Worldpanel
data) (n = 26), followed by customer survey (n = 21), direct observation (n = 9), customer interviews or
focus groups (n = 8), marketing data from the manufacturer or retailer (n = 5), retailer loyalty card data
(n = 4), and other data sources (e.g., customer diaries, eye scanner, store audits, bag checks, n = 6);
one article did not specify the data source used. Nearly one third (n = 17) used multiple data sources.
No articles declared conflicts of interest.
TPP influence three categories of retailer marketing strategies: how products are priced,
placed, and promoted. Results below are organized according to these three domains. Notably,
comparison across studies is challenging given they focus on different products, use different study
designs, and employ different outcome measures. The two final sections of the results describe findings
from studies that compare outcomes across two or more retailer marketing strategies and compare the
impact of marketing of healthy versus unhealthy products.
3.2.1. Pricing
Retailers employ a variety of price promotion strategies, including coupons, bundle deals (e.g.,
buy-one-get-one, 2-for-1), and TPR (also called rollbacks). In the US and the UK, an estimated 40% and
34% of all purchases are price promoted, respectively [6,48]. Estimates indicate that between 24% [49]
and 67% [4] of unhealthy foods and beverages are purchased while price promoted, though prevalence
of promotions differ across retailer formats and neighborhood [4]. A review of price promotions among
Scottish retailers found that TPR are the most prevalent form of price promotion, accounting for 74%Int. J. Environ. Res. Public Health 2020, 17, 7381 7 of 34
of promotions, followed by bundle deals, which represent 23% of promotions [9]. Price promotions are
offered more frequently for unhealthy compared to healthy products [2,3,5,7–9,20,50,51].
Thirty-two articles focused on price promotions. Eight presented results separately for coupons,
seven presented results separately for TPR, and the remainder did not specify the type of price promotion
assessed or assessed multiple types of price promotion and did not present results separately.
Coupons
Coupons may be distributed by retailers or manufacturers. In 2017, 302 billion coupons for
consumer packaged goods were distributed in the US [52]. Six studies evaluated coupons and reported
coupons were associated with increases in overall purchase volume, impulse purchase volume,
brand choice, and product trialing (first-time purchase), but not brand loyalty [53–58]. Two studies
assessed customized coupons, which target consumer groups based on demographic characteristics
or past shopping behavior, and found they were associated with increased purchasing of targeted
products [54,56]. Coupons in some product categories may be more impactful than others: one study
found that coupons led to greater product trialing when promoting leading brands and categories that
were popular, easy to store, had fewer products in the category (easier for customers to process less
options), and were frequently on sale [55]. Another study found that while customized coupons led to
increased purchases for both healthy and unhealthy products, they were more effective for unhealthy
products [54].
Temporary Price Reductions
All eight studies that evaluated TPR detected associations with one or more consumer shopping
behaviors, including purchase volume, impulse purchase volume, brand choice, and brand market
share [58–65]. TPR may have a stronger impact on some outcomes compared to others: one study
that assessed wine purchases in the UK found that TPR strongly influenced brand selection,
somewhat influenced purchase volume, but did not influence purchase initiation [61].
Three articles assessed the impact of TPR in online retail [63–65]. Two out of three studies found
that online price promotions were associated with increased purchases [63,64]; the third found no
association [65]. One of the two studies that detected an association reported that because online
purchases were delivered, barriers to stockpiling were eliminated, resulting in increased purchase
volume compared to in traditional brick-and-mortar retail outlets [64]. The other reported that when a
retailer with both online and brick-and-mortar retail outlets offered price promotions online, online sales
increased, but sales in the brick-and-mortar stores decreased [63]. That study also found that high
frequency of online promotions led to diminished effects over time [63].
Other Price Promotions
Thirteen articles on price promotions did not specify the type of price promotion studied or
examined several types of price promotions together [6,8,50,66–75]. Many studies using panel data
were unable to distinguish between types of price promotion used by customers. All studies identified
positive associations between price promotions and one or more outcomes, including purchase
volume, stockpiling purchase volume, purchase initiation, product trialing, and store choice. Within
some studies, however, price promotions were positively associated with some outcomes and not
others. For example, one study assessing Japanese market trends over time found that manufacturer
expenditure on sales promotion was associated with an increase in total purchase volume but a
decrease in manufacturer profits [66]. Another study found that price promotions led to short-term
sales increases, but in more than half of cases, did not increase category revenue due to brand-switching
(substitution) effects within the category [70].
Quantitative estimates on the impact of price promotions are difficult to compare because
researchers used different outcome measures. Three studies, all using data from the Kantar Worldpanel,
illustrate this challenge [6,8,69]. Nakamura et al. estimated that a 1% increase in price discount led to aInt. J. Environ. Res. Public Health 2020, 17, 7381 8 of 34
sales uplift of 1.44% within a given category [6]. Smithson et al. found that approximately one-fifth
of foods and beverages bought on price promotion were purchased in addition to what would be
expected absent a price promotion, leading to an overall increase in food and drink purchase volume [8].
Revoredo-Giha et al. found that the presence of a price promotion increased spending between 2% and
10%, depending on the product category [69].
The effect of price promotions may differ across product categories and consumer characteristics.
For example, one study found that while, price promotions did not, on average, affect beef sales,
they did influence sales for certain cuts of meat and consumer groups (e.g., young families versus older
adults) [68]. Another study found that price promotions were associated with increased soda sales
across all levels of consumer education and retail formats, but the effect was weaker in neighborhoods
with a higher proportion of residents with at least a post-secondary certificate or diploma [71].
Three studies compared differences in the impact of price promotion on healthy and unhealthy
products [67,69,74]. Two of these studies found that purchase volume increased as price decreased for
unhealthy foods but not for healthy foods [67,74]. Another, however, found that price promotions
led to increases in total spending and spending by category for both healthy and unhealthy foods,
though the effect was greater for less healthy foods [69]. Specifically, they found greater increases
in spending for unhealthy categories such as confectionery (10%) and beverages (9%) and smaller
increases for healthier categories such as fruits and vegetables (5%), grains (3%), and dairy (2%).
Perceived Importance of Price Promotions
Eight articles assessed consumer perceptions regarding the importance of price promotions in
shaping their purchasing decisions [67,73,76–82]. Though the populations and contexts assessed
varied across articles, all studies found that shoppers considered price promotions to be an important
factor influencing their shopping behavior. Three of these studies assessed perceived importance
of price promotions within specific cultural and religious contexts. In one study, Egyptian Muslim
shoppers reported that TPR and bundled deals led them to engage in more stockpiling and spending,
but other discount promotions considered not compliant with Shari’ah law, such as sweepstake draws
and scratch-and-win promotions, did not shape their behavior [79]. In a study of Pakistani Muslim
shoppers, participants reported that their intentions to purchase Halal products were shaped by
price promotions [80]. Through interviews with “ethnic” shoppers in the UK, a final study found
that participants reported diverse responses to price promotions, ranging from responsive to hostile,
depending on the perceived “net worth” of the promotion [81].
3.2.2. Placement
Sixteen studies focused on how products were placed within stores, measuring visual attention,
purchase volume, or spending as the primary outcomes [15,46,58,62,83–94]. Through slotting allowances
and category management, manufacturers are able to secure placement in premium store locations,
including on the endcap (i.e., end-of-aisle displays free from direct aisle-based competition), in the
checkout aisle, and on freestanding displays. In 2012, an estimated 60% of products in stores were
cross-promoted, meaning they are were displayed in secondary locations away from their “home”
aisle [15]. Displays may be located anywhere in the store: approximately 42% of displays are located
on the endcap, 28% in the aisle, 23% on the perimeter of the store, and 7% at the front of the store [15].
In an evaluation measuring shoppers’ visual attention, 13% of all eye-fixations were drawn to in-store
displays; of these, 44% were to endcaps, 34% to floor stands, 12% to in-line displays (i.e., gondola,
or freestanding wire or metal shelving), and 10% to power wings (i.e., sidekick displays, or cardboard
displays that attach to shelving) [15].
Endcaps
Five studies focused on placement in endcaps; all found significant positive effects on
purchasing [46,83,85–87]. In a study of UK stores, endcap displays led to increased purchase volume forInt. J. Environ. Res. Public Health 2020, 17, 7381 9 of 34
beer by 23.2%, for wine by 33.6%, for spirits by 46.1%, and for carbonated drinks by 51.7%; sales uplift
was even greater for tea and coffee [85]. Two studies found that endcaps located at the rear of the store
are more impactful than those at the front of the store [47,91]. In an experimental study in Australian
grocery stores, placement of unhealthy products on rear endcap displays generated a 416% uplift in
sales, while placement on front endcap displays generated a 346% uplift in sales [46]. Findings also
suggest that endcaps are most impactful when located away from in-store sampling [87] and in stores
without middle, perpendicular aisles [86].
Shelf Placement and Space
Category management and display fees can also affect where categories are placed within a
store, and where individual products are placed on shelves (e.g., at eye-level for adult shoppers).
Three experimental studies suggest that placement at the front of the store, in central aisles, at eye-level,
and away from other popular categories can have positive effects on sales [88,91,92]. In one study,
moving fruits and vegetables to a prominent location at the front of a grocery store led to an increase in
sales volume and spending on fruits and vegetables [92]. In another, placement of dairy products in a
central aisle was associated with increased product sales and purchase incidence, while placement
next to popular categories had an “attention stealing” affect, leading to decreased sales [88]. In a
laboratory-based study of college students, junk food items placed at eye-level received more visual
attention than those on higher or lower shelves [91]. However, an observational study in New York City
bodegas found no association between unhealthy beverage purchases and the placement of healthy
products in prominent locations (i.e., water at eye-level and produce in at the front of the store) [89].
Total amount of dedicated shelf and display space (measured in feet) was associated with increased
sales in two studies [84,90]. In one study, Minneapolis stores with more shelf space dedicated to fruits
and vegetables had healthier purchases (i.e., more fruits and vegetables, more whole grains, and higher
healthy eating index scores) [84]. Similarly, in a study of Hispanic shoppers in San Diego tiendas,
each additional square foot of display space for fruits and vegetables was associated with a $0.02
increase in weekly amount spent on fruits and vegetables [90].
Other Placement Strategies
Four additional studies evaluated the impact of placement but did not specify how or where
evaluated products were displayed [58,62,93,94]. All four studies found that presence of displays was
positively associated with impulse purchase volume, spending, or brand choice. One of these studies
was an industry report that assessed a multifaceted marketing campaign, however, and it is unclear
what proportion of the sales uplift was attributed to placement [93].
3.2.3. Promotion
Sixteen articles focused on promotion [53,73,76,80,82,84,87,89,90,95–101]. Manufacturers use
cooperative advertising and display fees to secure promotional signage, in-store sampling (i.e.,
taste tests), loudspeaker announcements, games, and other giveaways.
Signs
All three studies that measured the relationship between signs on shelf facings (called shelf-talkers
or aisle violators) and purchase behavior focused on promoting healthy products; none detected a
significant association [84,89,90]. In tiendas in San Diego, the number of signs promoting fruits and
vegetables was not associated with fruit and vegetable purchases among Hispanic consumers [90].
In Minnesota stores, healthy advertising inside stores was not associated with purchasing, and, in fact,
healthy advertising outside stores was associated with less healthy purchases [84]. In New York
City bodegas, neither signs advertising water nor signs advertising sugar-sweetened beverages were
associated with sugar-sweetened beverage purchases [89].Int. J. Environ. Res. Public Health 2020, 17, 7381 10 of 34
One study assessed “feature advertising“ in two competing grocery stores, but did not describe
components of “feature advertising” [73]. This study found that feature advertising led customers to
choose to shop at the store with featured advertising over another store.
In-Store Sampling
In-store sampling was found to be associated with greater brand loyalty and purchase volume in
three studies [53,87,99]. Several factors may moderate the impact of in-store sampling on purchases:
studies suggest that benefits are maximized when the product being offered on sample matches the
product displayed on the closest endcap [87,99]. One study also found a sales increase when in-store
samples were offered close to the weekend compared to earlier in the week, when store personnel were
present to offer the sample (24.3% increase compared to without store personnel present), when there
was a sign promoting the product (90.8% increase compared to no sign), and when a commercial for
the product is played on an in-store TV (36.3% increase compared to no commercial) [99].
Games, Giveaways and Limited-Time Offers
Findings on the impact of games, giveaways, and limited-time offers differed across studies [53,82,100].
In one study, customers reported that in-store games and lotteries led to greater customer loyalty
and stronger relationships with promoted brands [53]. In another study, giveaways of collectible
items increased the probability of brand choice and category purchase incidence, particularly when
paired with a price discount, but did not change the purchase volume decision [100]. In a final study,
both limited-time and membership deals were found to increase purchase incidence in an organic
market [82].
Perceived Importance of Promotions
Seven articles assessed consumer perceptions regarding the importance of promotional activities
in shaping their purchasing decisions [76,80,95–98,101]. Studies investigated different types of
promotions and used different methods to assess customer perceptions, and found varying levels
of perceived importance. Five studies found that consumers reported high levels of perceived
importance of marketing on their attitudes toward purchasing [80,96–98,101]. Two studies, however,
found promotional offers to be less persuasive: in a survey of Australian shoppers, 41% said they were
influenced by promotional offers, but, in focus groups and interviews, many said that while promotional
offers engaged them initially, trust and emotional connection to the brand was the primary driver
of their purchase decisions [95]. In a survey of Vietnamese urban shoppers, participants described
merchandise display and promotion as the least important factor from a list of seven factors influencing
impulse purchase behavior [76].
3.2.4. Comparison of Marketing Healthy versus Unhealthy Products
As previously described, a small number of studies compared marketing of healthy versus
unhealthy products [54,67,69,74,84,89,90]. Of these, four focused on price, three on placement,
and three on promotion. Half of price-focused studies found that price promotions led to increased
purchasing of unhealthy but not healthy products, [67,74] whereas the other half of studies found that
while the effect was stronger for unhealthy products, price promotions led to increased purchasing
of both healthy and unhealthy products. One of the three studies focused on placement found no
association between prominent placement of healthy products and purchasing [89]. The other two
studies, however, found that stores with more shelf and display space dedicated to fruits and vegetables
had healthier sales [84,90]. Notably, both of these studies were cross-sectional and thus were unable to
determine causality. Finally, none of the three studies focused on signs promoting healthy products
detected a relationship with purchasing [84,89,90].Int. J. Environ. Res. Public Health 2020, 17, 7381 11 of 34
3.2.5. Comparison across Marketing Strategies
A small number of articles directly compared one retailer marketing strategy to another. Four of
these asked participants to rank factors that shape their purchasing; in all four, participants reported
that price promotions were the most or one of the most influential factors shaping their attitudes
toward purchasing. Vietnamese shoppers reported that price promotions influenced their spontaneous
purchase tendencies more than displays [76]. Taiwanese organic market shoppers reported that
discounts and free giveaways impacted their shopping behavior more than membership or limited-time
offers [82]. Two other studies focused on Muslim shoppers: in one [80], shoppers reported being equally
influenced by Halal marketing promotions and pricing, while in the other [79], shoppers reported
price discounts influenced their purchase intention more than giveaways, games, and in-store samples.
One study compared different types of price promotions, finding that sensitivity to coupons was
greater than sensitivity to TPR [58]. The remaining studies quantitatively compared price promotions
to either promotion or placement; results largely indicated that price promotions are more impactful
than other types of marketing strategies [53,59,73,85]. Specifically, one study found that price was a
stronger driver of stockpiling purchases than feature and display promotion [73]. Another found that
a 20% TPR increased fair trade coffee sales more than providing information or a moral appeal [59].
Another study found that the effect size for endcap placement was equivalent to a price decrease for
alcohol categories of between 4% and 9% per volume, and a price decrease for non-alcohol categories of
between 22% and 62% per volume [85]. One study, however, found that price promotion and in-store
sampling produced different benefits: in-store sampling helped nurture consumer loyalty more than
coupons, but coupons resulted in more purchases [53].
3.2.6. Quality of Evidence Grading
On average, included studies received 65% of total possible stars (Appendix D). Only three of the
54 studies included in this review were of low-quality, having earned less than a third of all possible
stars. The two categories in which studies most often earned zero stars were sample size (n = 27)
and non-respondents (n = 28). Nearly half of the included articles omitted sample size calculations
or justification; this was particularly common among studies using questionnaires or published in
non-peer-reviewed sources. Only one study compared respondents and non-respondents or reported
their response rate, though for 25 articles, this information was considered not applicable due to use
of panel data. More than half of all studies earned the maximum number of stars in the assessment
of outcome category by linking records or using an independent blind assessment to determine
the outcome.Int. J. Environ. Res. Public Health 2020, 17, 7381 12 of 34
Table 2. Study design, marketing strategy, retailer format, country, study duration, data source, objectives, outcomes, and key findings for studies included in research
Question 2 (n = 54).
Marketing
Reference Retail Format Country Study Duration Data Source Objective Outcome Key Findings
Strategy
Scanner/panel
To identify how information,
data Purchase - A 20% TPR had a positive effect on
5 mo (5 March, price, and moral considerations
Andorfer, et al. Supermarket/ Customer volume coffee purchase volume when
Price Germany 2012–29 July influence consumers’
(2015) [59] grocery store surveys Purchase compared to the effects of information
2012) purchases of fair trade (FT)
Direct frequency and moral appeal.
coffee products.
observation
- Price promotions had a positive effect
To evaluate the differential
on purchases made in-person but not
Arce-Urriza, Supermarket/ 6 mo (15 May effect of price promotions on
Scanner/panel on purchases made online.
et al. (2017) Price grocery store Spain 2007–15 brand choice when shopping at Brand choice
data - Frequent customers were more
[65] Online retailer November 2007) a grocery store’s online outlet
responsive to price promotions than
vs. brick-and-mortar store.
infrequent customers.
- Customers were influenced by Halal
marketing and branding practices (e.g.,
sales promotions and celebrity
To identify which factors affect
Awan, et al. Price Customer Purchase endorsements).
Not specified Pakistan Not specified consumers’ decisions to
(2015) [80] Promotion surveys attitude - Customers were willing to spend
purchase Halal food.
considerable effort and money to
purchase Halal food as a result of
Halal marketing.
To determine the relationships
- Halal marketing promotion was
Aziz, et al. Other (shopping Customer between factors, including Purchase
Promotion Malaysia Not specified positively related to purchase
(2013) [101] mall) surveys Halal marketing, and intention attitude
intention.
to purchase Halal products.
- Marketing efforts led to an increase
To describe the impact of Purchase
in shoppers’ basket size (two-fold
Banks et al. Convenience endcap placement and volume
Placement UK Not specified Marketing data increase), spending (£3 increase), and
(2016) [93] store shelf-ready cases for cookies Spending
market size (increased to £3.8bn) for
sales. Market share
cookies.
- The most common factor that
3 years Interviews/focus
Bogomolova Product trialing prompted first-time brand purchases
Supermarket/ (2 February groups To assess reasons for first-time
et al. (2019) Price Australia Impulse and impulse purchases was an item
grocery store 2012–31 Loyalty card and impulse purchases
[50] purchasing being placed on price promotion or
December 2014) data
having a special offer.Int. J. Environ. Res. Public Health 2020, 17, 7381 13 of 34
Table 2. Cont.
Marketing
Reference Retail Format Country Study Duration Data Source Objective Outcome Key Findings
Strategy
- Price promotions had positive effects
on purchasing decisions and degree of
impact varied based on customer
brand loyalty.
- Promotions in one channel decreased
To examine the cross-channel Purchase
Breugelmans Supermarket/ 78 weeks (July category purchases in the other
Scanner/panel effects of price promotions incidence
and Campo Price grocery store UK 2006–December channel during the promotion period
data (online vs. offline) on category Purchase
(2016) [63] Online retailer 2007) (online price promotions had a
purchase decisions. volume
stronger impact on offline purchase
decisions than vice versa).
- High promotion frequency had
negative effects on future promotion
effectiveness.
- Customer loyalty is linked to low
prices and discount sales.
- 44% of respondents said prices were
To determine which activities
one of the factors that compel them to
are associated with customer
2 months make all their purchases in only one
Čábelková et Supermarket/ Czech Customer store loyalty and differential Customer
Price (October 2013– supermarket chain.
al. (2015) [78] grocery store Republic surveys effects by customer loyalty
November 2013) - Probability of ranking prices and
socio-demographic
sales promotions as important factors
characteristics.
was higher among older respondents
and respondents who spent more
monthly at supermarkets.
56 hours
Australia, To assess how foot traffic and - Back-of-store endcaps had 24% more
Caruso et al. Supermarket/ (December 2008 Direct Foot traffic
Placement New visual reach of endcaps differ foot traffic and 30% more visual reach
(2018) [83] grocery store and December observation Visual attention
Zealand by location. than front-of-store endcaps.
2015)
- Controlling for individual
characteristics and store type, HEI
scores for purchases were higher in
To examine whether customers
Dollar store Healthy eating stores with greater shelf space for
Customer who shop at
Convenience 5 months (July index-2010 fruits and vegetables.
Caspi et al. Placement surveys small/non-traditional food
store US 2014–November (HEI) score of - Healthy advertisements on the store
(2017) [84] Promotion Direct stores with more health
Other 2014) products exterior were associated with lower
observation promotions make healthier
(pharmacy) purchased purchase HEI scores.
purchases.
- The presence of interior healthy
advertisements were not associated
with purchase HEI scores.Int. J. Environ. Res. Public Health 2020, 17, 7381 14 of 34
Table 2. Cont.
Marketing
Reference Retail Format Country Study Duration Data Source Objective Outcome Key Findings
Strategy
- Price discounts and buy-one-get-one
To measure to what extent
were associated with self-reported
compliance with Shariah
stockpiling and spending more.
moderates the relationship
- Price discounts had the strongest
between sales promotion
impact on consumer behavior
methods (price discount,
(compared to sweepstakes/ lucky
Farrag (2012) Supermarket/ Interviews/focus product sampling, buy one get Purchase
Price Egypt Not specified draw, scratch-and-win, free samples).
[79] grocery store groups one free, sweepstakes/ lucky attitude
- The relationship between price
draws, scratch and win offers)
discounts and consumer behavior was
of convenient products and
moderated by Shariah law because
consumer behaviors (product
some practices (e.g., scratch-and-win
trial, stockpiling, spending
and sweepstake draws) were not
more).
compliant with Shariah law.
- Promotions accounted for 14% of the
variance in sales of beef.
To assess how supermarket
86 weeks (29 Spending by - While overall impact of promotion on
Felgate et al. Supermarket/ Scanner/panel loyalty card data can be used
Price UK May 2006–21 product sales of beef was insignificant, there
(2012) [68] grocery store data to analyze the effect of price
January 2008) subgroup was variability by cut of meat,
promotions on spending.
customer group, and price
promotions.
- Findings suggest partial support for
price promotion increasing market
share.
- A significant presence on shelves, in
To assess the impact of
Fornari et al. Supermarket/ Scanner/panel Purchase width (increase in the number of
Price Italy 2011 different retailing-mix levers
(2013) [60] grocery store data volume product categories) and depth
on private label market share.
(increase in the number of SKUs in
each product category) increased sales,
suggesting that assortment is more
important than price promotion.
To investigate the effects of
cross-market promotions (e.g., - Offering cross-market discounts on
Purchase
Goić et al. Supermarket/ grocery store purchases that gas for grocery purchases led to an
Price US Not specified Not specified volume
(2011) [75] grocery store lead to price discounts for gas) increase in both price and quantity of
Sales price
on purchase volume and sales groceries purchased.
price.Int. J. Environ. Res. Public Health 2020, 17, 7381 15 of 34
Table 2. Cont.
Marketing
Reference Retail Format Country Study Duration Data Source Objective Outcome Key Findings
Strategy
- Being exposed to coupons resulted in
an increase in the rate of purchase as
compared to those without coupons.
To compare the effects of
- People responded more to targeted
individually-targeted coupons
Guan et al. Supermarket/ 2 years Scanner/panel Purchase coupons than to untargeted coupons.
Price US for less healthful and more
(2018) [54] grocery store (2003–2005) data volume - Targeted coupons significantly
healthful foods on consumer
increased purchases of both healthy
purchasing patterns.
and less healthy items, with greater
increases in the purchases of less
healthy items.
To examine whether the
- Consumers were less likely to
assortment or placement of one
Scanner/panel purchase from a category of a given
category affects purchase
Hong et al. Supermarket/ data Purchase assortment when it was presented
Placement UK Not specified incidence in a different
(2016) [94] grocery store Direct incidence with another category assortment of
category that shares a common
observation greater variety and this effect was
display space (e.g., frozen
driven by the display proximity.
meals and ice cream).
To identify shopper trip-level
Customer - An impulse purchase was more likely
and point-of-purchase-level Purchase
Huang et al. Supermarket/ surveys if a shopper viewed fewer product
Price US Not specified drivers of unplanned incidenceImpulse
(2012) [57] grocery store Direct shelf displays, stood closer to the shelf,
consideration and purchase purchases
observation and referenced external information.
behavior.
- “Ethnic” customers reported a range
Perceived
To investigate “ethnic” of responses to sales
Jamal et al. Supermarket/ Interviews/focus importance for
Price UK Not specified consumers’ responses to promotion—some were responsive,
(2012) [81] grocery store groups purchase
different sales promotions. some hostile—depending on the “net
decisions
worth” of the sales promotion.
To examine how customized - The customization of discounts by
Purchase
temporal discounts influence time and value yielded an increase in
Johnson et al. Supermarket/ Scanner/panel incidence
PlacementPrice US Not specified consumers’ decisions to profits of 18–40% relative to a model
(2013) [58] grocery store data Brand choice
purchase products and overall that optimizes the value of the
Profit
profit of the retailers. discounts.
- Products on sale and on display in a
high–low pricing store increased the
probability of an impulse buy to 7%.
To assess the effect of retailing - A product had a 13.3% likelihood of
Kacen et al. Placement Supermarket/ Customer factors on the likelihood that a Impulse being purchased if it was not on sale
US Not specified
(2012) [62] Price grocery store surveys consumer will make an purchasing but a 17.6% likelihood if it was on sale.
impulse purchase. - A product had a 13.3% likelihood of
being purchased if it was not on
display, but a 20% likelihood if it was
on display.Int. J. Environ. Res. Public Health 2020, 17, 7381 16 of 34
Table 2. Cont.
Marketing
Reference Retail Format Country Study Duration Data Source Objective Outcome Key Findings
Strategy
To understand how changes
among manufacturers in - Expenditure on sales promotion was
Scanner/panel Purchase
Kim et al. 32 years budget allocation from associated with an increase in total
Price Not specified Japan data volume
(2011) [66] (1976–2008) advertising to sales promotion volume sales but a decrease in
Marketing data profit
affects sales volume and profitability.
profitability.
- Half of all price promotions
expanded revenues for that category,
especially for categories with deeper
To determine the impact of supported discounts.
Purchase
Leeflang et al. Supermarket/ Scanner/panel price promotions in one - There was a 61% probability that a
Price Spain 1 year volume
(2012) [70] grocery store data category on the revenues of price promotion affected sales of at
Sales revenue
other categories. least one other category.
- Cross-promotional effects between
categories more closely located in a
store existed.
To understand how consumer
Levy and
characteristics are correlated - Advertising was positively correlated
Gendel- Supermarket/ Not Customer Impulse
Promotion Not specified with advertising and the to the tendency to engage in impulse
Guterman grocery store specified surveys purchasing
tendency to impulse buy store buying.
(2012) [98]
brands.
To understand organic food - Consumers preferred the programs
consumers’ preferences for in the discount category and the free
Liang et al. Other (organic Customer Purchase
PromotionPrice Taiwan 2 month (2012) specific promotional programs giveaway category.
(2017) [82] market) surveys attitude
(e.g., discounts, giveaways, - Limited time offers reduced purchase
limited time offers). intention.
- Across all levels of education and
types of store, discounting was
Supermarket/ positively associated with soda sales.
To assess whether there was a
grocery store 6 years (January - The modification of the effect of price
Mamiya et al. Scanner/panel differential impact of price Purchase
Price Convenience Canada 2008–December discounting by education was most
(2018) [71] data discounting of soda on sales by volume
storeOther 2013) prominent in pharmacies, where the
store-neighborhood education.
(pharmacy) average log sales associated with
discounting increased as education
decreased.Int. J. Environ. Res. Public Health 2020, 17, 7381 17 of 34
Table 2. Cont.
Marketing
Reference Retail Format Country Study Duration Data Source Objective Outcome Key Findings
Strategy
- Instant giveaway of collectible
premiums resulted in increased brand
Shopping
and category choice probability, but no
tripsCategory
To examine the effectiveness of change in purchase quantity.
purchase
Minnema et al. Supermarket/ Scanner/panel instant reward programs with - Consumers were more likely to
Promotion Netherlands 20 weeks (2010) incidence
(2017) [100] grocery store data bonus premiums (i.e., choose the promoted brand if it was
Brand choice
collectible giveaways). promoted with both the bonus
Purchase
premium and price discount
volume
compared to when it was promoted
with just a price discount.
- The mean score for how consumers
To examine how price rate the importance of promotional
information is differentially pricing on their shopping decisions
Mortimer and
Supermarket/ Customer considered by men and women Purchase was 4.41 out of 5.
Weeks (2011) Price Australia Not specified
grocery store surveys in an Australian grocery store attitude - Men considered price attributes of
[77]
and how this affects grocery products and promotional tactics as
shopping behavior. being significantly lower in
importance than did women.
- Samplings, in-store games, lotteries
nurtured consumer loyalty and
To explore in-store sales
relationships with brands.
Mussol et al. Promotion Supermarket/ Customer promotions as a tool in Purchase
France Not specified - Price-based promotions should be
(2019) [53] Price grocery store surveys developing in-store attitude
used to trigger purchases, whereas
relationships with consumers.
non-monetary promotions should be
used to nurture brand relationships.
- End-of-aisle display increased sales
volumes by 23.2% for beer, 33.6% for
wine, and 46.1% for spirits, by 51.7%
for carbonated drinks, 73.5% for coffee,
and 113.8% for tea.
Nakamura et Supermarket/ Scanner/panel To estimate of the effect of Purchase
Placement UK Not specified - The effect size was equivalent to a
al. (2014) [85] grocery store data end-of-aisle display on sales. volume
decrease in price of between 4% and
9% per volume for alcohol categories,
and a decrease in price of between 22%
and 62% per volume for non-alcohol
categories.Int. J. Environ. Res. Public Health 2020, 17, 7381 18 of 34
Table 2. Cont.
Marketing
Reference Retail Format Country Study Duration Data Source Objective Outcome Key Findings
Strategy
- After controlling for the reference
price, price discount rate, and
To investigate if consumers are
Supermarket/ brand-specific effects, the sales uplift
more responsive to promotions
grocery store arising from price promotions was
Nakamura et Scanner/panel on less-healthy products; and if Purchase
Price Convenience UK 1 years (2010) larger in less-healthy than in healthier
al. (2015) [6] data there are socioeconomic volume
storeOther categories.
differences in food purchases in
(various) - A 1% increase in the depth of price
response to price promotions.
discount led to a sales uplift by 1.44%
within a given category.
- In-store demonstrations increased
sales, particularly when: closer to the
weekend, the product was displayed
next to the demonstration (235.07%
increase), there was personnel offering
Scanner/Panel
Nordfält and 2 weeks (April To investigate when and how the demonstration (24.31% increase),
Supermarket/ data Purchase
Lange (2013) Promotion Sweden 2008 and in-store demonstrations work there was signage promoting the
grocery store Customer volume
[99] March 2009) best. product (90.76% increase), and a
surveys
commercial was run on an in-store TV
(36.32%).
- There was no significant change
when in-store demonstrations were
offered in a higher traffic area.
- To entice customers to buy in new
categories, coupon redemption rates
were higher for leading brands and
To explore how targeted categories that are popular, easy to
Coupon
Osuna et al. Supermarket/ Not 2 years Loyalty card coupons influence the uptake store, have a low number of SKUs, and
Price redemption
(2016) [55] grocery store specified (2008–2009) data of new category and brand are frequently on sale.
Product trialing
purchases. - To increase incremental purchases,
coupons should be in categories that
have low purchase frequency and high
number of SKUs.
- Overall use of endcaps in the store
with a middle aisle was lower than
that in the store with standard layout.
To explore the shopper traffic - In a standard store, 2.2% of all
Shopper traffic
Page et al. Supermarket/ Direct entering and exiting the observed shoppers were interacting
Placement Australia 24 hours Endcap use
(2019) [86] grocery store observation middle aisle, and interaction with an endcap (48% at rear, 52% at
Basket size
with endcap promotions. front of store), while in the store with
the middle aisle, 1.6%, (24% at the rear,
38% at the front, and 39% in the
middle).You can also read