New Mobility in the Right-Of-way - MARCH 2019 - urbanism next center - Carbon ...
←
→
Page content transcription
If your browser does not render page correctly, please read the page content below
New Mobility in the
Right-Of-way
MARCH 2019

                          urbanism next center
                                                    @urbanismnext
                                                  urbanismnext.com

             city of Portland, or|city of seattle, wa |city of vancouver, bc
ACKNOWLEDGEMENTS
                The Urbanism Next Center would like to thank the Advisory
                Committee members: Peter Hurley, Portland Bureau of Transportation;
                Shannon Walker, Seattle Department of Transportation; Evan Corey
                Costagliola, Lime; Joanna Clark, City of Vancouver, BC; and Johanna
                Partin and Susanna Sutherland of the Carbon Neutral Cities Alliance/
                Urban Sustainability Directors Network for their guidance. We would
                also like to thank all of the representatives from the cities of Portland,
                Seattle, and Vancouver who attended the one-day workshop on
                November 5, 2018. In addition, we would like to thank representatives
                at Fehr & Peers, Lyft, the City of Chandler, AZ, and the San Francisco
                Municipal Transportation Agency for providing useful background
                information for this report. Finally, we extend our gratitude to Neelima
                Shah and the Bullitt Foundation for providing the grants that funded
                this work.

                The Urbanism Next Team are the primary authors of this report:
                • Amanda Howell, Urbanism Next Project Manager
                • Nico Larco, AIA, Professor, Urbanism Next Center Director and
                  Sustainable Cities Institute Co-Director
                • Rebecca Lewis, PhD, Assistant Professor and SCI Research
                  Director
                • Becky Steckler, AICP, Urbanism Next Program Director

                Graphic design was done by Michelle Montiel and Marsie Surguine.

Urbanism Next | University of Oregon
About the Urbanism Next Center
The Urbanism Next Center is a research center housed within the
Sustainable Cities Institute at the University of Oregon. It is a leading
source for information about the potential impacts of emerging
technologies — autonomous vehicles, new mobility, e-commerce, and
the sharing economy — on city development, form, and design and
the implications for equity, health, the economy, the environment, and
governance.

About the Sustainable Cities Institute
The Sustainable Cities Institute (SCI) is a cross-disciplinary
organization at the University of Oregon that promotes education,
service, public outreach, and research on the design and
development of sustainable cities. We are redefining higher education
for the public good and catalyzing community change toward
sustainability. Our work addresses sustainability at multiple scales
and emerges from the conviction that creating the sustainable city
cannot happen within any single discipline. SCI is grounded in cross-
disciplinary engagement as the key strategy for improving community
sustainability. Our work connects student energy, faculty experience,
and community needs to produce innovative, tangible solutions for the
creation of a sustainable society.

                                                   New Mobility in the Right-of-Way | March 2019
Urbanism Next | University of Oregon
TABLE OF CONTENTs
01| Introduction                                       3
02| Why Cities Should Manage the                     11
    Curb
03| Portland, Seattle, And Vancouver’s 17
    Desired Climate And Equity
    Outcomes
04| Keeping Mobility Equity at the                   23
    Forefront of Curb Management
05| Curb Management Planning                         27
    and Implementation Examples,
    Resources, and Research
06| Emerging Themes and Research                     53
    Gaps
  | Conclusion                                       61
  | Works Cited                                      63

                        New Mobility in the Right-of-Way | March 2019 | 1
Urbanism Next | University of Oregon
01 | INTRODUCTION

          New Mobility in the Right-of-Way | March 2019 | 3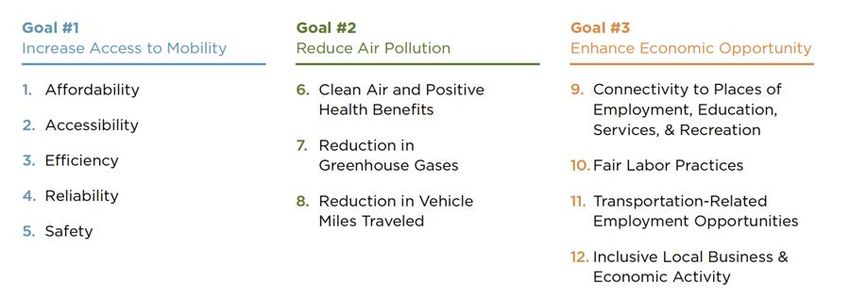
Background
                                             Streets and sidewalks, together known as the public right-of-way
                                             (ROW), are often compared to arteries and veins in a body. They
                                             transport people and goods, and just as with arteries, problems
                                             can occur when they are clogged. The function of a street is not
                                             limited to movement, of course. Streets are places for recreation and
                                             entertainment, for commerce, and for some people, it is where they
                                             live. Streets are also the workbench for utilities and public works. They

“
                                             host vertical infrastructure and serve as the conduit to underground
                                             infrastructure. Streets are the circulatory systems that are critical
                                             for livable cities. In short, the functions of the right-of-way can be
       The curb is                           summarized as the following: movement, access, loading, storage,
                                             activation, and greening. (See Figure 1-1 for a description of the
     the new urban                           primary right-of-way functions as identified by the Seattle Department
                                             of Transportation). These activities occur in three different “zones” of
        frontier                             the street, which the Seattle Department of Transportation (SDOT)

                                     ”
            - Donald Shoup at                have defined as the pedestrian realm, the “flex” or curb zone, and the
            LACoMotion, Nov. 2018            travelway (Figure 1-2). The curb zone is where many of these uses
                                             intersect and “where movement meets access”(Mitman, Davis, Armet,
                                             & Knopf, 2018, p. 4). Traditionally, this zone has been used by private
                                             vehicles, taxis, pedestrians, cyclists, high-capacity transit, and freight
                                             and delivery vehicles.

                                             Over the past eight years, however, demand for curb access is
                                             noticeably changing. This increase in demand is related to the
                                             introduction of transportation network services (TNCs) like Uber and
                                             Lyft. It is also driven by the growth in docked and dock-less shared
                                             mobility, including the introduction of shared electric scooters. It is
                                             influenced by a significant rise in e-commerce with the growth of
                                             Amazon and other online retailers. Finally, the ease of in-app ordering
                                             combined with low-cost or even free delivery, often provided by courier
                                             network services like GrubHub and Postmates is impacting demand
                                             for the curb. These technological innovations have fueled the growth of
                                             the gig economy,1 enabling many people to use their personal vehicles
                                             to ferry passengers—as well as make package and food deliveries.

                                             Cities are only just beginning to understand how these services are
                                             impacting the demands placed on the right-of-way, including the curb.
                                             For instance, the growth of TNCs and courier services is contributing
                                             to an increased demand for short-term loading zones to enable safe
                                             and efficient passenger and goods loading. At the same time, demand
                                             for parking is decreasing in certain areas, such as nightlife corridors
                                             and airports (International Parking Institute, 2018; Walker Consultants,
                                             2018).

                                             Cities are also anticipating the near-future commercial deployment of
                                             fleets of autonomous vehicles (AVs), which will likely function similarly
                                             to how TNCs do today. AVs will be used to move both passengers

                                             1 The gig economy generally refers to the broad swath of jobs that “use app-based
                                             platforms to dole out work in bits and pieces — making deliveries, driving passengers or
                                             cleaning homes…” (Kobie, 2018)

4 | New Mobility in the Right-of-Way | March 2019 | Section 1                                     Urbanism Next | University of Oregon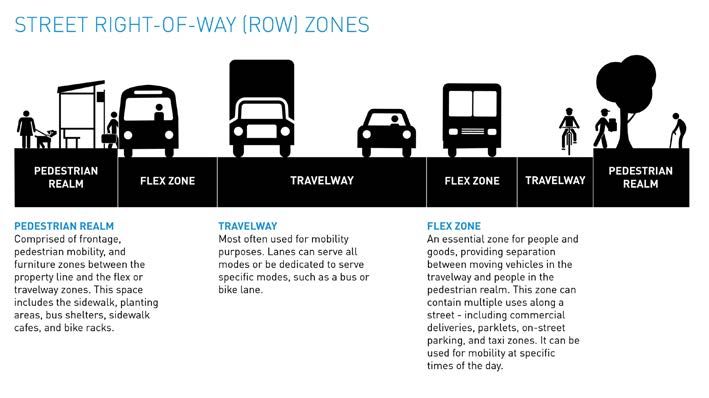
Figure 1-1. Primary Functions of the Right-of-Way (ROW) as Defined by the Seattle Department of Transportation
ACCESS FOR ACCESS FOR
FUNCTION STORAGE GREENING ACTIVATION MOBILITY
COMMERCE PEOPLE
Provides storage Enhances Offers vibrant Goods and People arrive at Moves people
for vehicles or aesthetics and social spaces services their destination, and goods
equipment environmental reach their or transfer
DEFINITION health customers between different
and markets ways of getting
around
Bus layover Plantings Food trucks Commercial Bus or rail stops Sidewalks
Long-term -Boulevards Parklets and vehicle load
parking -Street trees streateries zones Bike parking Bus or
-Planter boxes streetcar lanes
Reserved Public art Curb bulbs
spaces (e.g. for Rain gardens Truck load Bike lanes
Passenger load
USES police or other and bio-swales Street festivals zone
zones General
government use) purpose travel
Short-term lanes
Construction parking
Right or left
Taxi zone turn-only lanes
Source: Seattle Right-of-Way Improvements Manual, Seattle Department of Transportation, 2016. Accessed
at http://streetsillustrated.seattle.gov/street-types/row-allocation/
and goods, providing point-to-point service, and placing additional
demands on curbside access. While questions remain about how soon
fully autonomous vehicles will be commercially deployed, as well as
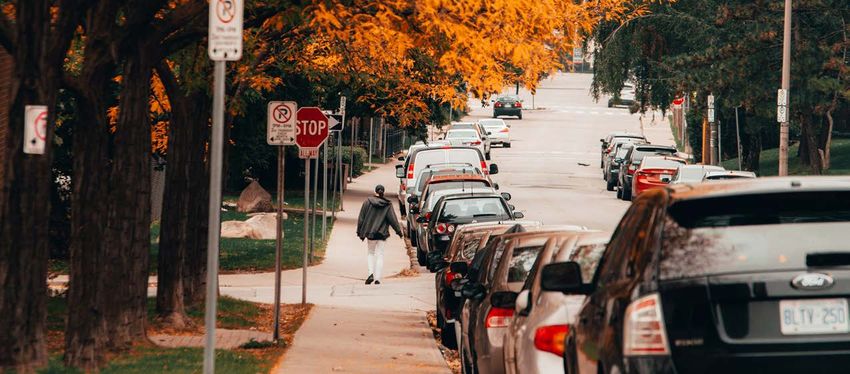
how widespread they will be, AVs are already on streets. For instance,
Fry’s, which is owned by grocery giant Kroger, recently partnered with
the delivery-bot maker Nuro to pilot autonomous grocery delivery in
Scottsdale, Arizona (Metz, 2018). These grocery delivery vehicles travel
on public roads alongside traditional vehicles.
The curb has long been in high demand with multiple users vying
for limited space, especially for the purposes of parking personal
vehicles. However, TNCs and other services have helped to usher in
a new age that involves an increased demand for short-term loading
and micromobility2 device parking. Multiple issues can arise when
the curb zone is not well allocated or managed, including increased
congestion, double-parking and circling for parking, all of which
2 Micromobility refers to “small, human- and electric-powered transportation solutions
such as bikes, scooter, and mopeds”(Populus, 2018.)
Delivery robot Nuro operating in Scottsdale, AZ; Source: Nuro
Urbanism Next | University of Oregon Section 1 | New Mobility in the Right-of-Way | March 2019 | 5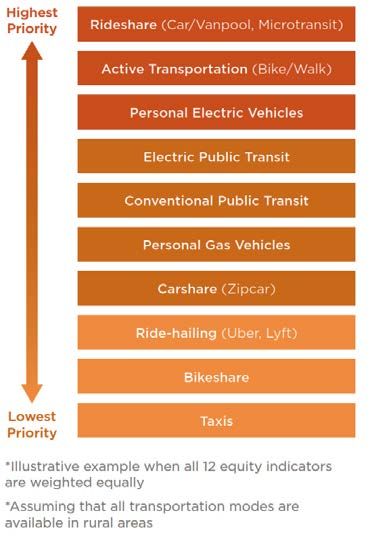
NEW MOBILITY                                    result in an increase in GHG emissions. Failure to consider the curb
                                                comprehensively has often resulted in the prioritization of parked
“New mobility is the term
                                                vehicles over other uses, which not only contributes to mode conflicts,
favored by many jurisdictions
                                                but also has considerable ramifications on mobility equity. For
across the country to describe
                                                instance, curb space dedicated to the storage of private vehicles might
transportation that is newly
                                                otherwise be used for dedicated transit. In doing so, users who can
enabled      by      technology,
                                                afford to access a private vehicle are often prioritized over users who
primarily the use of smart
                                                are transit-dependent. AVs will likely exacerbate existing issues with
phones.     This      technology
                                                the right-of-way and the curb, which is why it is important that cities
includes         transportation
                                                tackle curb management in new ways.
network companies (like Uber
and Lyft), micro-transit (like                  The cities of Portland, OR; Seattle, WA; and Vancouver, BC recognize
bikeshare, electric scooter                     the importance of innovative curb management. In 2017, the three
share, and potentially other                    cities partnered with the Carbon Neutral Cities Alliance at the Urban
modes of transportation that                    Sustainability Directors Network (CNCA/USDN) on a project to better
are enabled by smart phones                     understand how each city is individually addressing policy issues
or other electronic devices.                    related to AVs. CNCA/USDN, with support from the Bullitt Foundation,
Autonomous vehicles (AVs) are                   provided a grant to the Urbanism Next Center to conduct research
expected to be included in the                  and lead three workshops with the cities between June and November
suite of technologies covered                   2018. The first two workshops focused on the potential impacts of
by new mobility when they are                   AVs on GHG emissions, and Urbanism Next produced an associated
deployed in cities.”                            report, “AVs in the Pacific Northwest: Reducing Greenhouse Gas
                                                Emission in a Time of Automation.” During the first phase of the
– AVs in the Pacific Northwest:
                                                project, the cities broadly identified the right-of-way and specified
Reducing Greenhouse Gas
                                                the curb as an area of keen interest. The group collectively decided
Emissions in a Time of
                                                that the impacts of new mobility on the curb would be the focus of
Automation (Urbanism Next,
                                                the second phase of research. The final workshop in November 2018
Aug. 2018)
                                                brought together representatives from the three cities for an in-depth
                                                discussion about curb management, and this report catalogs the
                                                findings from the second phase of the project.

                                                Figure 1-2. Street Right-of-Way (ROW) Zones as Designated by the Seattle Department
                                                          of Transportation

                                                Source: Seattle Right-of-Way Improvements Manual, Seattle Department of Transportation,
                                                2016. Accessed at http://streetsillustrated.seattle.gov/street-types/row-allocation/.

   6 | New Mobility in the Right-of-Way | March 2019 | Section 1                                   Urbanism Next | University of Oregon
Purpose of this Report The purpose of this report is to categorize and summarize efforts that are already underway in cities across the world to rethink curb management, to outline the key takeaways from the one-day workshop that involved city staff from Portland, Seattle, and Vancouver, and to identify major research gaps. Methods The Urbanism Next Center at the University of Oregon used the following methods to complete this report: Literature Review Urbanism Next conducted a brief literature review on curb management and how it is directly linked to impacts on climate and mobility equity. The literature review informs Section 2. Policy and Pilot Project Analysis Urbanism Next reviewed curb management policies and pilot projects in ten cities, including Washington, D.C., San Francisco, CA, Seattle, WA, New York, NY, London, U.K., and others. Additionally, Urbanism Next reviewed research to rethink curb management, especially pertaining to data collection. The policy and pilot project analysis helped identify promising practices, important takeaways, and existing research gaps. The policy and project analysis inform Section 5. Interviews Urbanism Next conducted four interviews with representatives of the San Francisco Municipal Transportation Authority, Lyft, Fehr & Peers, and the City of Chandler, Arizona in order to better understand efforts underway by these agencies and jurisdictions to respond to changes in curbside demand. These discussions provided additional clarity on issues pertaining to curb management and further highlighted research gaps. The interviews inform Section 5. Facilitated Workshop Urbanism Next facilitated a one-day workshop with representatives from the three cities in November 2018 to discuss preliminary research findings and to identify areas of opportunity for the cities work together to advance curb management understanding and policymaking. The workshop discussions inform Section 6. Urbanism Next | University of Oregon Section 1 | New Mobility in the Right-of-Way | March 2019 | 7
Report Scope
                                              Management of the curb is the primary focus of this report. While curb
                                              management requires thinking about the interactions between the
                                              various zones of the ROW (Figure 1-2), management of the full ROW is
                                              not the primary focus of this research effort. This report also does not
                                              provide specific guidance or research about the management of the
                                              pedestrian realm or the travelway.

                                              Additionally, this report did not conduct data analysis about ROW
                                              use. Limited data are available in terms of passenger trips made with
                                              transportation network services. Furthermore, no publicly available
                                              data about the impacts of courier network services appear to exist.

                                              Figure 1-3. Multiple uses of the right-of-way (ROW)
                                                                        GREENING

                                           personal vehicles                                 puBLIC TRANSPORTATION

                     bikeshare/e-scooter                                                                    active transportation
                           storage
                                                                               TNC

                                                          FREE

                                                          PARKING

                                                                 of
                                                      The Cost
                                                      High Parking
                                                      Free SHOUP
                                                      DONALD

                                                                                       TNC

              electric car charging                                                                                     ride-hailing

                            parking                                                                             COURIER SERVICES

                                               utilities                                        freight/goods
                                                                                                   delivery
                                                                      Streeteries
                Source: Michelle Montiel

8 | New Mobility in the Right-of-Way | March 2019 | Section 1                                         Urbanism Next | University of Oregon
BIKESHARE e-SCOOTER SHARE MOPED SHARE CARSHARING
Services providing fleets Services providing fleets Services providing fleets Services providing access to
of bicycles for short-term of electric scooters for of mopeds for short-term shared vehicles for trips
rental. Pay at kiosk/ short-term rental within a rental. Typically dockless: where users only pay for
smartphone app. Docked: defined service area. pick-up/return anywhere time used. Stationary:
pick-up/return at fixed Pick-up/leave anywhere within a defined area. pick-up/return to same
stations. Dockless: within a defined area. parking spot. Free-floating:
pick-up/leave anywhere pick-up/leave anywhere
within a defined area. within a defined area.
Peer-to-peer: rent from
individuals.
moving people
moving people
RIDE-HAILING MICROTRANSIT PUBLIC TRANSIT AUTONOMOUS VEHICLE
Use of smartphone apps Privately operated Use of public transit as it Vehicles use sensors and
to connect passengers passenger vans and currently exists, but using advanced control systems
with drivers who provide shuttle buses offer newer technologies like to operate independently
rides in their personal transit-like service on a smartphone apps to look from a human driver and
vehicles. Also known as smaller scale. Routes may up routes and/or pay for may be used to transport
transportation network be fixed or dynamic, but ride. passengers as well as
companies (TNCs). Can typically use freight.
be single or shared predetermined pick-up
occupancy. and drop off points for
passengers.
moving GOODS
moving GOODS
COURIER SERVICES AUTONOMOUS DELIVERY SELF-DRIVING ROBOTIC AERIAL DROne DELIVERY
The use of an app to The delivery of goods by Not a focus of report/or in
connect people using their driverless autonomous DELIVERY the scope of Urbanism
personal vehicles to make vehicles, from larger Fleets of small autonomous Next... but a technology
restaurant, grocery, or freight vehicles to smaller delivery vehicles that may on the near horizon.
other package deliveries. passenger vehicles. be used on sidewalks or on
roads depending on size
and speed.
New Mobility in the Right-of-Way | March 2019 | 9Urbanism Next | University of Oregon
02 | Why cities
     should manage
     the curb

          New Mobility in the Right-of-Way | March 2019 | 11
Source: Ravi Patel on Unsplash
Free Curbside Parking Impacts Travel
Behavior
For years, curb space has been primarily allocated to the storage of
private vehicles through the provision of short- and long-term on-
street parking. Many cities, especially in the U.S., have historically not
charged for on-street parking. According to Donald Shoup, U.S. drivers
park free at the end of 99 percent of their trips (Shoup, Appendix B,
2011). The widespread availability of free and cheap parking impacts
travel behavior and induces vehicle travel. Researchers have inferred
that a causal relationship exists between parking and citywide
automobile use (McCahill, Garrick, Atkinson-Palombo, & Polinski,
2016). However, roadway space is finite and as vehicle use increases,
congestion may increase, especially in highly trafficked corridors
during peak travel periods. Free on-street parking not only induces
vehicle use, it also encourages drivers to circle or “cruise” for parking,
contributing to a string of negative externalities. As Shoup writes in
Parking and the City, cruising not only wastes the time of the driver,
it also “congests traffic, pollutes the air, endangers pedestrians and
cyclists, and creates CO2 emissions” (Shoup, 2018, p. 24). Even just a
small amount of time spent searching for a parking space can increase
traffic and VMT/VKT.
Vehicle Miles/Kilometers Traveled and
Congestion can Increase Greenhouse Gas
Emissions
An increase in VMT/VKT in gasoline-powered vehicles is directly linked
to increased GHGs (VMT/VKT is a proxy measurement for GHGs,
though fuel efficiency is a factor). Increased congestion results in cars
accelerating, decelerating, and idling more frequently, which can in
turn result in increased tailpipe emissions. For instance, researchers
12 | New Mobility in the Right-of-Way | March 2019 | Section 2 Urbanism Next | University of Oregonat Texas A&M’s Transportation Institute attempted to quantify the
additional amount of emissions generated by urban congestion in 498
urban areas in the U.S. and found that “56 billion pounds of additional
CO2 were produced at the lower speeds under congested conditions”
(Eisele, et al., 2014, p. 73).
The presence of free or cheap on-street parking can encourage
circling, increasing VMT/VKT and contributing to increased congestion.
As a result, comprehensive curb management is an important
component in any citywide effort to reduce VMT/VKT and GHGs.
Comprehensive Curb Management Can
Encourage Mode Shifts
Just as the presence of free or cheap on-street parking can induce
driving, allocating curb space to other modes can help promote mode
shifts. Price, safety, and reliability are all important factors in mode
choice, and the prioritization of private vehicles at the curb can impact
both the reliability and safety of other modes. For instance, drivers
searching for parking may increase congestion, thereby slowing transit
and reducing its reliability. Vehicles entering and exiting the travel
lane can pose safety risks to cyclists and other non-motorized users.
However, making space at the curb for other users can impact mode
choice. Research has shown that there is a clear correlation between
bike lanes, increased rates of cycling, and reduced risk for riders
(NACTO, 2016). People who do not feel safe riding in the street due
to a lack of infrastructure may choose to ride on the sidewalk, or not
to ride at all as is the case of the “interested but concerned” cyclist
(Dill & McNeil, 2013). Both are problematic since sidewalk riding can
endanger pedestrians, but choosing not to ride may mean that the trip
is made by private vehicle instead.
In terms of transit usage, “speed, reliability and frequency are
critical dimensions of service quality that discretionary riders value”
(Chakrabarti, 2017, p. 87). Congested streets can greatly reduce
the speed and reliability of transit, thereby impacting mode choice.
Amazon Prime Fleet; Source: Daimler Mercedes Benz
Urbanism Next | University of Oregon Section 2 | New Mobility in the Right-of-Way | March 2019 | 13However, dedicated bus lanes can increase the speed of travel, making
it more predictable and reliable. Seattle, for instance, has seen transit
ridership increase after giving buses priority on some heavily trafficked
corridors (Small, 2017), among other improvements. Using curb lanes
for dedicated transit, bike lanes, and uses other than the storage of
private vehicles can encourage important mode shifts.
Demand for Curbside access is increasing
The number of multiple and competing curb demands is increasing
with the introduction of new mobility technologies such as TNCs and
e-scooters, and the continued growth of e-commerce. TNCs offer
A note on GOODS passengers door-to-door service with the ability to be picked up
and dropped off at their desired destinations. This is increasing the
DELIVERY demand for short-term curbside uses like passenger loading zones,
There are a variety of especially in areas with concentrated nightlife. Multiple reports have
terms being used to refer also linked TNCs to increased congestion (Gehrke, Felix, & Reardon,
to local goods delivery, 2018; San Francisco County Transportation Authority, 2018; Schaller,
including urban delivery, 2018). Though congestion is certainly not a new phenomenon, TNCs
goods delivery, and urban may be exacerbating it in part by spending time circling and idling
freight. Some cities are while waiting for passengers.
also referring to services
like UberEats, Grubhub, Package deliveries are also on the rise. According to José Holguín-
Postmates, Amazon Veras, a researcher at Rensselaer Polytechnic Institute, “the number
Flex and others, which of freight deliveries per person in America has doubled over the last
primarily use couriers to decade…with almost all of that growth attributable to internet buying”
make food and package (Humes, 2018). If current growth continues, that number could double
deliveries, as courier again by 2023 (Humes, 2018). The growth in goods delivery is putting
network services (CNS). additional pressure on demand for short-term loading zones.
This report uses urban
goods delivery to refer The growth of the shared micromobility market with the introduction of
to deliveries made e-scooters is also placing increased demands on the curb. The shared
by carriers directly to devices are meant to be ridden in the street, but many cities are
consumers. The term struggling to keep riders off the sidewalk. The City of Portland received
courier network services 1,622 reports of sidewalk riding during the city’s four-month e-scooter
refers specifically to pilot program (Portland Bureau of Transportation, 2019, p. 24).
services that enable However, instances of sidewalk riding were also directly related to the
app-based ordering and posted speed of traffic and/or the lack of bike infrastructure, according
delivery via couriers. to the Portland Bureau of Transportation’s report findings. This
supports research findings that allocating curb space for nonmotorized
modes could impact mode shift. Additionally, questions about where
shared micromobility devices should be stored when not in use are
spurring conversations about the curb. Some cities like Santa Monica,
CA are experimenting with replacing parking spaces with e-scooter
corrals (Linton, 2018).
Finally, the growth of the electric vehicle market is also placing
increasing demands on the curb. EV charging infrastructure is another
important consideration in the discussion about curb space allocation.
The right-of-way may become increasingly electrified through EV
charging stations, as well as, eventually, inductive charging.
14 | New Mobility in the Right-of-Way | March 2019 | Section 2 Urbanism Next | University of OregonPotential Curbside Impacts of Autonomous Vehicles Early research findings about the potential transportation impacts of AVs suggest that they may increase VMT/VKT (Fagnant & Kockelman, 2014; Greenblatt & Shaheen, 2015) as it is anticipated that AVs will function similarly to TNCs. New research also suggests that AVs could exacerbate congestion by circling endlessly while waiting for a passenger in order to avoid parking charges even during periods of lower demand (Millard-Ball, 2019). TNC drivers, on the other hand, are more likely to pull over and park during slow periods. However, unlike human drivers who may choose to pull up in front of a bus stop or stop in a travel lane, AVs are expected to be programmed to follow all laws and regulations. This means AVs will need to access designated passenger zones in order to pick up and drop off passengers. Anticipating and planning for the commercial deployment of AVs requires comprehensive curb management and a consideration about how curb space is currently allocated and priced. Mobility Equity and the Curb The prioritization of curb space for the storage of private vehicles privileges those who can afford to drive. Lower income communities are less likely to own a private vehicle and are more reliant on transit (Blumenberg & Pierce, 2012; Giuliano, 2005). Prioritizing space for parking over transit, for instance, can reduce reliability, frequency, and efficiency of transit. This in turn can diminish both mobility and access to opportunity. Rates of cycling are also linked to income, as well as race and ethnicity. In 2014, PeopleForBikes reported that people making less than $20,000 per year are twice as likely to rely on bicycles for to meet their daily transportation needs, and people of color are more likely to be regular riders (Andersen, 2015). Allocation of curb space is an important factor in mobility equity that should not be overlooked. Source: Zach Inglis for Unsplash Urbanism Next | University of Oregon Section 2 | New Mobility in the Right-of-Way | March 2019 | 15
Urbanism Next | University of Oregon
03 | PORTLAND,
SEATTLE, AND
VANCOUVER’S
DESIRED CLIMATE
AND EQUITY
OUTCOMES
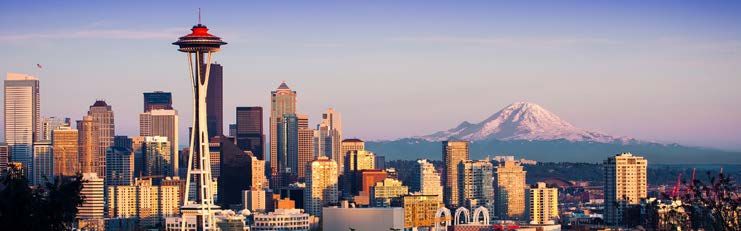
New Mobility in the Right-of-Way | March 2019 | 17Source: Aditya Chinchure on Unsplash
Focusing on desired outcomes is an important starting point for any
project. In the case of curb management, Portland, OR; Seattle, WA
and Vancouver, BC are interested in the ways that effective curb
management can help them achieve the desired outcomes of reducing
greenhouse gas emissions and advancing equity. The three cities’
goals related to greenhouse gas emissions and equity are outlined
in plans that have been adopted by the cities, as well as city-led
initiatives, which are described here.
Reduce Greenhouse Gas
Emissions
Each of the three cities have ambitious goals to significantly reduce
GHG emissions from the transportation sector. According to the U.S.
Environmental Protection Agency, the transportation sector accounts
for the largest portion of GHG emissions compared to all other sectors:
28% in 2016 (United States Environmental Protection Agency, 2018).
In Canada, the transportation sector accounted for 25% of total GHG
emissions in 2016 (Government of Canada, 2018). Total vehicle miles
or kilometers traveled (VMT/VKT) is directly related to GHG emissions,
as gasoline-powered vehicles emit carbon, and all three cities have
established goals to reduce total VMT/VKT. Effective curb management
policies can help reduce total VMT/VKT, which in turn reduces GHG
emissions.
18 | New Mobility in the Right-of-Way | March 2019 | Section 3 Urbanism Next | University of OregonTable 3-1. Overview of Climate Action Plans for Portland, Seattle, and Vancouver
2020 2030 2050
40% 80% Reduction in GHG
Portland
City of Portland and
Multnomah County
Climate Action Plan
from 1990 levels from 1990 levels
Adoption Date:
2015 reduction in daily
30% per capita VMT
from 2008 levels
Reduction in GHG
58% 100%
sEATTLE
Seattle Climate
Action Plan
Adoption Date: from 1990 levels Carbon neutral
2013
20% reduction in VMT
from 2008 levels
100% 80% Reduction in GHG
VANCOUVER
Greenest City 2020
Action Plan
Adoption Date: energy from from 2007
2015 renewable levels
sources reduction in VkT
20% per resident
from 2007 levels
Urbanism Next | University of Oregon Section 3 | New Mobility in the Right-of-Way | March 2019 | 19Advance Equity Initiatives
Each of the three cities have adopted important equity initiatives with
the aim of mitigating historic disparities in access and opportunity.
Effective curb management policies that prioritize the needs of
underserved users can help advance these important equity initiatives.
Portland
Source: Andrey Yachmenov for Unsplash
The City of Portland adopted the 2035 Comprehensive Plan in 2018
and it explicitly outlines equity as one of its five guiding principles:
Promote equity and environmental justice by reducing disparities,
minimizing burdens, extending community benefits, increasing the
amount of affordable housing, affirmatively furthering fair housing,
proactively fighting displacement, and improving socio-economic
opportunities for under-served and under-represented populations.
Intentionally engage under-served and underrepresented populations in
decisions that affect them. Specifically recognize, address and prevent
repetition of the injustices suffered by communities of color throughout
Portland’s history (City of Portland, 2018, p. 17).
The Bureau of Transportation also adopted a 5-Year Racial Equity
Plan 2017-2021 and the first long-term goal it lists is to “provide
equitable City services to all residents” (City of Portland, Bureau of
Transportation, 2016, p. 1).
Seattle
Source: Milkovi for Unsplash
The City of Seattle has established several equity initiatives to guide
city policymaking and planning efforts, including the Equity and
Environment Initiative, and the Race and Social Justice Initiative.
Seattle also adopted race and social equity as one of its four
core values in the Comprehensive Plan: “Limited resources and
opportunities must be shared and the inclusion of under-represented
communities in decision-making processes is necessary” (Office of
Planning & Community Development, 2018, online).
20 | New Mobility in the Right-of-Way | March 2019 | Section 3 Urbanism Next | University of OregonThere are also several equity initiatives specifically housed under the Seattle Department of Transportation. In January 2018, Seattle’s City Council adopted a Transportation Equity Resolution to establish the Transportation Equity Program, managed by SDOT. The Transportation Equity Program “provides safe, environmentally sustainable, accessible, and affordable transportation options that support communities of color, low-income communities, immigrant and refugee communities, people with disabilities, people experiencing homelessness or housing insecurity, LGTBQ people, women and girls, youth, and seniors to thrive in place in vibrant and healthy communities, and mitigate racial disparities and the effects of displacement” (Seattle Department of Transportation, 2018, online). Additionally, one of the key principles of the New Mobility Playbook, published by SDOT in 2017, is to “Advance Race and Social Justice” (Seattle Department of Transportation, 2017, p. 32). Vancouver Source: Aditya Chinchure for Unsplash In 2014 Council approved the City of Vancouver’s Healthy City Strategy, which recognizes that the social determinants of health and well-being are interconnected and that “a ‘for all’ lens will help ensure that the city pursues initiatives that are both universal for all citizens and focused on specific populations most vulnerable to health inequities” (City of Vancouver, 2015, p. 6). One of the goals outlined in the strategy is that “Vancouverites enjoy safe, active, and accessible ways of getting around the city” (City of Vancouver, 2015, p. 11). This policy direction is also reflected in Vancouver’s Transportation 2040 Plan, adopted in 2012, which is underlined by traditional sustainability goals of Economy, People (Society) and Environment (City of Vancouver, 2012). The plan’s “people” goal leads to numerous equity- related policies and strategies throughout the plan and focuses on mobility for all. Urbanism Next | University of Oregon Section 3 | New Mobility in the Right-of-Way | March 2019 | 21
Urbanism Next | University of Oregon
04 | KEEPING
     MOBILITY
     EQUITY AT THE
     FOREFRONT
     OF CURB
     MANAGEMENT

           New Mobility in the Right-of-Way | March 2019 | 23
MOBILITY EQUITY
Understanding the needs of the community is an important first
step in any pilot project or planning process. A robust community
needs assessment should inform decision-making and guide policy
development. For instance, in 2018, Portland State University
partnered with OPAL Environmental Justice Oregon to conduct a
“Community-Based Assessment of Smart Transportation Needs in
the City of Portland.” One research question they set out to answer
on behalf of the City of Portland was: “How can smart mobility
technologies address the current and future needs of transportation
disadvantaged communities?” (Golub, Serritella, Satterfield, &
Singh, 2018, p. 1). The research team found that “by lowering costs
and improving service for public transit, ridesharing and active
transportation, smart mobility technologies could potentially address
many of the transportation needs of transportation disadvantaged
communities” (Ibid, p. 1). Information like this should be used to inform
decision-making related to the right-of-way and curb management.
Researchers at the Greenlining Institute have outlined twelve mobility
equity indicators that can be used to conduct a mobility equity analysis
(Figure 4-1). As they suggest, “Decision-makers and communities can
use these indicators and their metrics to assess the equity outcomes
of individual transportation projects or entire transportation modes or
plans” (Creger, Espino, & Sanchez, 2018, p 11).
This framework provides three examples of how a mobility equity
analysis can inform prioritization of various of transportation modes
(Figure 4-2). In their analysis they assume that all mobility equity
indicators are weighted equally, and that all modes are available in
each hypothetical place type (urban, suburban, and rural). In urban
and suburban settings, for instance, their analysis suggests that active
transportation should be the first priority in a mode hierarchy. Rural
areas, however, may prioritize rideshare given the longer distances
between destinations1.
Figure 4-1. Mobility Equity Indicators from the Greenlining Institute’s Mobility Equity Framework
Source: Mobility Equity Framework, The Greenling Institute, 2018, p. 5.
1 Note that the Greenlining Institute differentiates rideshare from ridehail, which
encompasses TNC services like Uber and Lyft.
24 | New Mobility in the Right-of-Way | March 2019 | Section 4 Urbanism Next | University of OregonThis type of analysis is applicable to curb prioritization, as it helps SAN FRANCISCO’S GUIDING
guide decision-making about which pilot projects to implement and PRINCIPLES FOR EMERGING
how to allocate limited space. Using Greenlining’s example, if a city
wants to prioritize active transportation and electric public transit first
MOBILITY SERVICES AND
and foremost, then curb space and related policies should support TECHNOLOGIES
that prioritization by making room for pedestrian, cyclists, and transit. The San Francisco Municipal
Implemented, this could be bus-only lanes in the flex (or curb) zones, Transportation Agency (SFMTA)
as opposed to parking—since personal vehicles appear at the bottom and San Francisco County
of the prioritization scheme (Figure 4-2). A different jurisdiction Transportation Authority (SFCTA)
could also choose to weight some factors more heavily than others, established the Guiding Principles
depending on the goals or outcomes desired. While resources like for Emerging Mobility Services
the Greenlining Institute’s Mobility Equity Framework can provide and Technologies to “provide a
guidance, there is no one size-fits-all approach. Each community consistent policy framework to
should conduct its own transportation needs assessment. evaluate new mobility services”
(SFMTA, p. 1). The 10 Guiding
The next section highlights research, pilot projects, and other efforts
Principles were crafted to support
pertaining to curb management, though equity outcomes were
the City of San Francisco’s goals
not necessarily the impetus of these projects. Some pilot projects
of “providing for safe, reliable,
simply respond to existing conditions. However, this report strongly
sustainable, and equitable
recommends that mobility equity be a prioritization factor for cities as
transportation choices now and in
they choose what pilots to implement, as well as a key consideration
the future” (p. 1). This framework
in pilot project design and other efforts undertaken related to curb
is a useful resource that can be
management.
used in evaluation processes of
new mobility services.
Figure 4-2. Transportation Mode Breakdown Applied to Urban, Suburban, and Rural Areas Using the Mobility Equity Indicators (The
Greenlining Institute, 2018)
URBAN SUBURBAN RURAL
Source: Mobility Equity Framework, The Greenling Institute, 2018, p. 15-17.
Urbanism Next | University of Oregon Section 4 | New Mobility in the Right-of-Way | March 2019 | 25Urbanism Next | University of Oregon
05 |CURB
    MANAGEMENT
    PLANNING AND
    IMPLEMENTATION
    EXAMPLES,
    RESOURCES, AND
    RESEARCH

         New Mobility in the Right-of-Way | March 2019 | 27
Urbanism Next reviewed policies, plans, and pilot projects related
to curb management from the following cities: Seattle, WA; London,
U.K.; Washington, D.C.; Ft. Lauderdale, FL; Los Angeles, CA; West
Hollywood, CA; San Francisco, CA; Portland, OR; New York, NY;
and Chandler, AZ. Additionally, Urbanism Next reviewed research
conducted by the International Transport Forum, the transportation
consulting firm Fehr & Peers, and the University of Washington’s
Urban Freight Lab, as well as resources published by the Institute of
Transportation Engineers (ITE) and the National Association of City
Transportation Officials (NACTO). Finally, Urbanism Next reviewed
services provided by Coord, a private sector curb mapping resource,
and the data sharing platform SharedStreets. This section presents
brief introductions to all of the reviewed policies, plans, pilot projects,
research, and resources. They are organized according to four primary
categories:
Visioning and Planning
This covers how cities are connecting management of the right-of-way
to larger goals. Visioning includes efforts to think comprehensively
about the ROW and its primary purposes. Planning covers efforts to
develop actions that will help achieve city goals.
Data Collection
This covers gathering baseline data about the right-of-way, including
efforts to map and inventory the curb. Data collection also entails
efforts to understand ROW usage to inform decision-making and
regulations.
Space Allocation
This covers different ways of allocating the right-of-way depending on
desired outcomes. It includes information about how to prioritize transit
and different ways of implementing passenger and goods loading zone
pilot projects.
Regulation and Policy
This covers different ways that pricing and zoning mechanisms can be
used for right-of-way management.
Each reference is classified as either a planning example, an
implementation example, a resource, or relevant research. The
planning and implementation examples highlight jurisdictions that have
adopted plans and policies and/or have implemented a pilot project.
The resources are briefly described and included for reference, and
research efforts are summarized with important findings highlighted.
Key takeaways as identified by Urbanism Next are presented for each
category. The takeaways are informed by interviews conducted with
representatives from Fehr & Peers, Lyft, the San Francisco Municipal
Transportation Agency, and the City of Chandler, AZ, as applicable.
28 | New Mobility in the Right-of-Way | March 2019 | Section 5 Urbanism Next | University of OregonSource: Fred Joe for Urbanism Next VISIONING AND PLANNING An important step in any planning process is to establish a vision of the future that reflects community values. Using the visioning document as a guide, cities develop goals that pertain to the vision and then develop actions that will help achieve those goals in the form of city plans. Strategic Vision Not every street can serve every function, so it can be helpful to engage in a visioning process about the various functions that should be prioritized on different streets—and how those functions connect to overarching goals and other adopted plans. Thinking about the different functions of the curb also helps break away from the notion that the curb lane is primarily a space for on-street parking. A parking lane automatically defines the use and is limiting in scope, but re- framing the curb as a flex zone shifts the conversation and connotes far more opportunity for how that space can be used. A strategic vision can also help guide decision-making across the various departments that manage the curb. Urbanism Next | University of Oregon Section 5 | New Mobility in the Right-of-Way | March 2019 | 29
Visioning
               Establishing a Strategic Vision for the Function of London’s Streets

    London adopted a “Street Types”                                 Places prioritize place (Figure 5-2).
    matrix in 2014, resulting from                                     According to Transport for London

                                             “
    a 2-year project launched in                     [Street Types]      (TfL), “The aim of Street Types is
    2012 and involved more than                  recognizes the role       to help planners work together
    400 experts from Transport                                              to ensure customers get a
    for London, Greater London                  of the street network        consistent level of service
    Authority,     and     London’s              in civic life but also      on TfL and borough roads,
    boroughs. “The Street Types                                              whether they are travelling
    matrix serves as planning
                                             highlights where areas are      by foot, bicycle, bus or car.”
    input for street interventions…”           under intense pressure       “It [Street Types] recognizes

                                                                     ”
    and balances the movement                    to help people move.     the role of the street network in
    and place functions of the street       - Transport for London      civic life but also highlights where
    (International    Transport   Forum,                              areas are under intense pressure
    2018, p. 32). Core/Arterial Roads, for                         to help people move.” (Transport for
    instance, prioritize movement whereas City                 London, n.d., online).

     Source: Mavis for Unsplash

30 | New Mobility in the Right-of-Way | March 2019 | Section 5                    Urbanism Next | University of Oregon
Figure 5-1. Street Types for London Matrix (Transport for London)
Source: Transport for London
Figure 5-2. Aims of London’s Street Types Matrix
Source: London’s Street family: Theory and Case Studies (Chapters 1-2),
Transport for London
Urbanism Next | University of Oregon Section 5 | New Mobility in the Right-of-Way | March 2019 | 31Visioning
Identifying and Prioritizing the Functions of the “Flex Zone” in
Seattle
In 2017, as part of their Comprehensive Plan, of streets based on the surrounding land use
Seattle adopted the term “flex zone” to refer to (Figure 5-4). Mobility is identified as the primary
the curb space component of the right-of-way. function for all street types, but it is important
They also defined the six overarching functions to note that the framing is “support for modal
of the right-of-way: mobility, access for people, plan priorities.” This helps to connect the
access for commerce, activation, greening, and prioritization scheme to other existing plans and
storage (Figure 5-3). From there, they determined acknowledges that different street types have
how they would prioritize the various functions different modal priorities.
Figure 5-3. Primary Functions of the Right-of-Way (ROW) as Defined by the Seattle Department of Transportation
ACCESS FOR ACCESS FOR
FUNCTION STORAGE GREENING ACTIVATION MOBILITY
COMMERCE PEOPLE
Provides storage Enhances Offers vibrant Goods and People arrive at Moves people
for vehicles or aesthetics and social spaces services their destination, and goods
equipment environmental reach their or transfer
DEFINITION health customers between different
and markets ways of getting
around
Bus layover Plantings Food trucks Commercial Bus or rail stops Sidewalks
Long-term -Boulevards Parklets and vehicle load
Bike parking Bus or
parking -Street trees streateries zones
streetcar lanes
-Planter boxes Curb bulbs
Reserved Public art
Truck load Bike lanes
spaces (e.g. for Rain gardens Passenger load
USES police or other and bio-swales
Street festivals zone
zones General
government use) purpose travel
Short-term
lanes
Construction parking
Right or left
Taxi zone
turn-only lanes
Source: Seattle Right-of-Way Improvements Manual, Seattle Department of Transportation, 2016. Accessed
at http://streetsillustrated.seattle.gov/street-types/row-allocation/
Figure 5-4. Flex Zone Prioritization Based on Surrounding Land Use (SDOT)
Source: Seattle Department of Transportation
32 | New Mobility in the Right-of-Way | March 2019 | Section 5 Urbanism Next | University of OregonPlanning
Once a city has a vision, the next step is to incorporate it into policies
and implementation measures. They should also identify actions that
will be taken to achieve goals. If a city has adopted a people-first
vision of mobility, the plans for streets and curb need to support that
vision.
Planning
Increasing People-Moving Capacity on Streets in Central Portland
In 2018 the Portland Bureau of Transportation The main idea that serves as the backbone
drafted “Transportation for Everyone: Central City in of Central City in Motion is that the amount of
Motion Implementation Plan,” which recommends land devoted to the right-of-way is constant, but
18 key projects that are designed to “increase the how that space is allocated will shift. Currently,
people moving capacity…by an average of over only 1% of the ROW is dedicated to transit and
60%” (Portland Bureau of Transportation, 2018, p. 3% is dedicated to bicycle and new mobility
5). Two years of community engagement preceded infrastructure (Figure 5-5). Implementation of the
the final draft of Central City in Motion, which is 18 key projects is designed to increase space for
intended to help the City of Portland achieve goals transit, and space for bicycles and new mobility by
outlined in two other plans—Central City 2035 1% each. In order to accomplish this, some curb
Plan and the Transportation System Plan. Both of space will be reallocated from parking and loading
those plans call for transit, walking, and bicycling to other use designations. Portland’s City Council
to account for 85% of all Central City trips in 20 unanimously approved the plan in November 2018
years (Ibid, p. 10). (Portland City Council Resolution 37395).
Figure 5-5. Portland’s Central City in Motion Implementation Outcomes
Source: Transportation for Everyone: Central City in Motion Implementation Plan, Portland Bureau of Transportation, 2018, p. 4.
Urbanism Next | University of Oregon Section 5 | New Mobility in the Right-of-Way | March 2019 | 33Takeaways for Visioning and Planning
Adopting a strategic vision about the street is a good way to connect
the street back to larger goals. Prioritizing the “place” function of the
street over “movement” on some streets can help reinforce goals of
creating walkable communities.
Thinking of the curb as a flex zone is gaining traction and Seattle in
particular is regularly being cited for their work in this regard. (Seattle’s
functions of the right-of-way have been cited in the Institute of
Transportation Engineers’ Curbside Management Practitioner’s Guide,
the International Transport Forum’s report on the Shared Use City, as
well as in the curb studies completed by consulting firm Fehr & Peers.)
The two years of community engagement that contributed to the
formulation of the Central City in Motion Plan in Portland provided
residents with multiple opportunities to weigh in on the future of
streets downtown. This may have contributed to why the plan was
unanimously passed by City Council.
Source: Aditya Chinchure on Unsplash
34 | New Mobility in the Right-of-Way | March 2019 | Section 5 Urbanism Next | University of OregonDATA COLLECTION
In order to manage and regulate the curb, it is necessary to have a
complete picture about it—how much space there is, where it is, where
regulations are applied currently, and how the space is actually being
used.
Gathering Baseline Data
Many cities do not have comprehensive information about the curb
outside of metered locations. Many cities are recognizing that this is
an important gap and are working to gather baseline data through
mapping, coding, and inventorying efforts. Private companies also
recognize the value of this information, and several companies have
started mapping curbs in order to meet the demand for data.
GATHERING BASELINE Data
Implementation: Commercial Loading Zones in Washington, D.C.
In an effort to ease congestion stemming from zone lane on a busy commercial thoroughfare.
double-parked trucks on busy commercial The pilot was considered a success and
corridors, the District of Columbia’s Department DDOT subsequently implemented the citywide
of Transportation (DDOT) undertook a project to Commercial Loading Zone Management
inventory and map all of its Commercial Loading Program. The end result of their inventorying
Zones (CLZs). They used ArcGIS Collector to efforts was the creation of interactive map that
gather data and worked with the Golden Triangle displays different loading zones where users can
Business Improvement District, carriers, and access information about what address each
downtown receivers on the project. In 2015 they loading zone is closest to, what the operating
launched a pilot that involved installing parking hours are, etc. (Figure 5-6).
meters in a designated commercial loading
Figure 5-6. Snapshot of District Department of Transportation’s Interactive Truck and Bus Map
Source: DC Truck and Bus Map, District Department of Transportation, 2018. Accessed at http://godcgo.
com/dc-truck-and-bus-map/ on 11/1/2018.
Urbanism Next | University of Oregon Section 5 | New Mobility in the Right-of-Way | March 2019 | 35GATHERING BASELINE Data
Implementation: Gathering Baseline Data about Curb in Los Angeles, CA
The Los Angeles Department A subsequent attempt to 2018). However, as Stephen
of Transportation (LADOT) digitally code the curb relying Goldsmith noted in Governing,
announced an initiative in 2016 solely on video footage “In the spirit of rapid iteration,
to map more than 7,500 miles “generated too many errors the city is already undertaking
of streets. “Code the Curb” is “a to be reliable enough as a new approach utilizing
digital undertaking to inventory a source of data for traffic promising technologies”
more than 1 million signs, curb enforcement and third-party (Goldsmith, 2018). The project is
paint, and other regulatory app development” (Goldsmith, ongoing.
tools along the 7,500 miles of
Los Angeles streets. When
complete, the digital inventory
will make parking regulations
easier to understand and will
help LADOT improve sign
design and policy” (Los Angeles
Department of Transportation,
2018, p. 7). Initially, the data
collection plan was to have
city workers manually record
information about curbside
signage, but the city moved
towards digital data collection Source: Nathan Dumlao on Unsplash
methods soon thereafter.
GATHERING BASELINE Data
Research: Gathering Baseline Data Private Loading Bays and Docks
in Seattle, WA
The University of Washington’s
Urban Freight Lab launched
a research initiative called the
“Final 50 Feet” with two goals
related to goods delivery:
reduce dwell time and reduce
failed first deliveries. The
Urban Freight Lab is working
with the Seattle Department
of Transportation to geocode
the locations and features of
all private truck load/unload
bays and loading docks in
Seattle’s Center City, not just
city curbs. This is the first time
that a major U.S. city has had
this kind of information (Urban Source: Hannes Egler for Unsplash
Freight Lab, 2018).
36 | New Mobility in the Right-of-Way | March 2019 | Section 5 Urbanism Next | University of OregonGATHERING BASELINE Data
Resource: Private Sector Tool for
Gathering Baseline Data
The need for highly detailed maps of the curb has created a
marketplace for third-party vendors to fill the gap, and Coord
is one company doing this work. Coord is a part of Sidewalk
Labs, which is under the umbrella of Alphabet, Google’s parent
company. Coord has undertaken pilot projects in San Francisco
and Toronto with the goal of documenting all curbside uses and
parking restrictions (Mitman et al., 2018, p. 33). Coord employs
surveyors who use cell phone video technology to inventory
parking signs, curb colors, and other regulated uses. They also
measure the length of loading zones, no parking zones, etc. to
create as complete a picture as possible of how curb space is
currently designated.
Source: COORD, Curb Explorer. Accessed at https://coord.co/explorer/
sf#37.79307263237486,-122.40564174272345@15.
Understanding Usage
While gathering baseline data about the curb is an important first
step, that information alone does not tell cities how the curb is actually
being used. For instance, cities need to know if no-parking zones
are routinely being used for passenger loading or unloading or if
bus stops are being block by non-designated users. They need to
know where double-parking occurs most frequently, contributing to
congestion and possible safety conflicts. Some of this information
can be gathered by manual counts and other forms of municipal
observational data collection. Getting a full picture of how the curb
is used requires cooperation between public and private entities,
however. For instance, transportation networks companies and courier
service networks have important data about hotspots, occupancy,
average dwell times, and other useful data points that help cities gain
needed information.
Urbanism Next | University of Oregon Section 5 | New Mobility in the Right-of-Way | March 2019 | 37Understanding Usage
Implementation: Creating a Platform to
Facilitate Data Collection in Los Angeles
The Los Angeles Department of Transportation has created a
Mobility Data Specification (MDS), which is a “data standard and API
specification for mobility as a service providers, such as dockless
bikeshare, e-scooters, and shared ride providers who work within
the public right of way” (Los Angeles Department of Transportation,
2018, online). It is intended to facilitate “real-time data sharing,
measurement and regulation for municipalities and mobility as
a service providers” and “to ensure that governments have the
ability to enforce, evaluate and manage providers” (Los Angeles
Department of Transportation, 2018). Mobility service providers who
receive permits to operate in the City of Los Angeles must agree to
create a data sharing API that is compatible with MDS (Los Angeles
Department of Transportation, 2018a, online).
Understanding Usage
Resource: Creating a Shared Data Standard with open
platform Software
The Open Transport Figure 5-7. How SharedStreets Data Exchange Compares to GIS-Based Data
Exchange
Partnership and the
National Association of City
Transportation Officials
(NACTO) have created a shared
data standard using open
platform software, which they
have called SharedStreets.
It is designed to facilitate
collaboration between public
and private entities by using
a linear referencing system
that enables different datasets
to be shared while also
Source: SharedStreets, 2018. Accessed at https://github.com/sharedstreets/
being anonymized. As it is sharedstreets-ref-system.
described in a report by the to share proprietary base map an agreement to share data via
International Transport Forum, information and...privacy- the platform in September 2018
“SharedStreets addresses a sensitive un-anonymised data” (National Association of City
confounding issue that has (International Transport Forum, Transportation Officials, 2018).
limited the willingness of 2018, p. 35). In a sign that However, some questions
commercial operators to provide SharedStreets may indeed help remain about whether or not the
curb- and street-use data they to facilitate greater data sharing, data is granular enough to be
collect—namely, the necessity Ford, Uber, and Lyft announced helpful to cities.
38 | New Mobility in the Right-of-Way | March 2019 | Section 5 Urbanism Next | University of OregonYou can also read