Floating Solar Photovoltaic (FSPV): A Third Pillar to Solar PV Sector? - TERI
←
→
Page content transcription
If your browser does not render page correctly, please read the page content below
Floating Solar Photovoltaic (FSPV): A Third Pillar to Solar PV Sector?
Floating Solar Photovoltaic (FSPV): A Third Pillar to Solar PV Sector?

   © The Energy and Resources Institute 2019
   The material in this publication is copyrighted. Content from this policy brief may be used for non-commercial purposes, provided
   it is attributed to the source. Enquiries concerning reproduction should be sent to the address:

   The Energy and Resources Institute

   Darbari Seth Block, India Habitat Centre, Lodhi Road, New Delhi – 110 003, India

   Authors
   Mohit Acharya, Associate Fellow, Renewable Energy Technologies, TERI

   Sarvesh Devraj, Associate Fellow, Renewable Energy Technologies, TERI

   Reviewers
   Dr. Ashvini Kumar Senior Director, Renewable Energy Technologies, TERI

   Mr. Amit Kumar, Senior Director, Rural Energy and Livelihoods, TERI

   Acknowledgments
   This report has been produced by The Energy and Resources Institute (TERI) as a part of the Energy Transmission Commission (ETC)
   India progrgamme.
   We are grateful for the supports of the sponsors of ETC India: Bloomberg Philanthropies, Hewlett Foundation, Shakti Foundation,
   Oak Foundation, the Children›s Investment Fund Foundation, and Growald Family Fund.
   This work has benefited from the insights of numerous stakeholder with whom we consulted, notably Solar Energy Corporation of
   India Ltd (SECI), NHPC Ltd, The World Bank, and Yellow Tropus Pvt Ltd, among others.

   Citation
   Mohit Acharya and Sarvesh Devraj (2019),»Floating Solar Photovoltaic (FSPV): A Third Pillar to Solar PV Sector ?, TERI Discussion
   Paper:Output of the ETC India Project (New Delhi: The Energy and Resources Institute).

   Editorial and design: Ipshita Mitra, Sudeep Pawar

   PUBLISHED BY
   The Energy and Resources Institute (TERI)

   FOR MORE INFORMATION
   Mr. Mohit Acharya

   TERI, Darbari Seth Block, IHC Complex, Lodhi Road, New Delhi 110 003, India Tel.: +91 11 2468 2100 or 2468 2111 |
   Fax: +91 11 2468 2144 or 2468 2145

   Email: mohit.acharya@teri.res.in | Web: www.teriin.org

    2
Floating Solar Photovoltaic (FSPV): A Third Pillar to Solar PV Sector?

Disclaimer
The Energy and Resources Institute (TERI) has taken adequate precautions to ensure that the data/information presented
in this report is accurate, reliable, and complete; however, it is limited to the extent of quality of data/information available
with the sources, which have been cited all along the report. It is, therefore, imperative on the part of the readers/users of
this report to take commercial decisions based on their own verification and due diligence, and TERI owns no responsibility
for the inadvertent errors and omissions of whatever kind that could emerge during this process.
By reading this report, the users confirm their awareness and agreement to this disclaimer and associated terms referred
elsewhere.

                                                                                                                                            3
Floating Solar Photovoltaic (FSPV): A Third Pillar to Solar PV Sector?

    4
Floating Solar Photovoltaic (FSPV): A Third Pillar to Solar PV Sector?

Contents
Executive Summary .................................................................................................................................................................. 9
1.      Floating Solar PV – Understanding the Need............................................................................................................. 13
        Why Floating Solar PV? ........................................................................................................................................................................14
        What is Floating Solar PV?...................................................................................................................................................................15
        Floating Solar PV – Benefit...................................................................................................................................................................15
2.      Global Market Overview................................................................................................................................................. 19
        Global Scenario.......................................................................................................................................................................................20
        Indian Scenario.......................................................................................................................................................................................24
        Cost of Floating Solar PV Plants..........................................................................................................................................................24
        Supporting Frameworks for FSPV.......................................................................................................................................................26
3.      Floating Solar PV as Technology Overview................................................................................................................. 29
        PV Modules...............................................................................................................................................................................................30
        Inverters....................................................................................................................................................................................................30
        Floating Platform...................................................................................................................................................................................31
        Anchoring and Mooring System: .......................................................................................................................................................33
        Cabling......................................................................................................................................................................................................34
        Unconventional Concepts in FSPV.....................................................................................................................................................34
4.      Floating Solar PV – India Potential................................................................................................................................ 39
        Potential Assessment Tool....................................................................................................................................................................40
        Setting Priorities.....................................................................................................................................................................................43
5.      Floating Solar PV – Potential Environment and Social Impact................................................................................ 45
6.      Floating Solar PV – Project Design Guidelines............................................................................................................ 47
        Initial Site Assessments.........................................................................................................................................................................49
        Bathymetry/Hydrography and Soil Testing.....................................................................................................................................49
        Environmental and Social Impact Assessment ..............................................................................................................................51
        Project Design..........................................................................................................................................................................................51
        Installation and Commissioning........................................................................................................................................................54
        Technical Specification and Standards.............................................................................................................................................54
7.      Challenges......................................................................................................................................................................... 59
        Technology Challenges.........................................................................................................................................................................60
        Environmental and Social Aspects ....................................................................................................................................................60
        Installation Challenges.........................................................................................................................................................................61
        Operation and Maintenance (O&M) Challenges ...........................................................................................................................61
        Quality.......................................................................................................................................................................................................61
8.      Conclusion......................................................................................................................................................................... 63

                                                                                                                                                                                                                           5
Floating Solar Photovoltaic (FSPV): A Third Pillar to Solar PV Sector?

List of Figures
Figure 1:          Schematic representation of a typical large-scale floating PV system with its key components.................. 15
Figure 2:          Major components of floating solar PV............................................................................................................................... 30
Figure 3:          (A) Central inverter placed on floating platform at China. (B) String inverter...................................................... 31
Figure 4:          Hydrelio design............................................................................................................................................................................ 31
Figure 5:          Floating platform........................................................................................................................................................................ 32
Figure 6:          Seahorse technology................................................................................................................................................................. 32
Figure 7:          Stingray technology .................................................................................................................................................................. 33
Figure 8:          Floaters design............................................................................................................................................................................. 33
Figure 9:          Floaters design............................................................................................................................................................................. 33
Figure 10: A–200 kWp grid-connected single axis based floating solar PV plant in Suvereto, Italy.................................. 34
Figure 11: Dual-axis-tracking Technology............................................................................................................................................... 35
Figure 12: Phase I of 4MWp floating solar PV plant at wastewater treatment facility, Jamestown Australia................. 35
Figure 13: A pilot installation in Colignola (Pisa) on an artificial basin by Koine Multimedia.............................................. 36
Figure 14: A pilot installation based on liquid solar array technology by Sunengy in hydro dam in India..................... 36
Figure 15: Floating platform........................................................................................................................................................................ 36
Figure 16: Floating platform........................................................................................................................................................................ 37
Figure 17: Schematic of forces on submerged FSPV plant............................................................................................................... 37
Figure 18 : 0.57 kWp submerged floating solar PV based plant...................................................................................................... 37
Figure 19: Potential impact of deploying large-scale floating solar PV....................................................................................... 46
Figure 20: (A) A historical bathymetric map of Bellandur Lake. (B) Sediment accumulation in Bellandur Lake........... 49
Figure 21: Impact of improper bathymetry and/or hydrography surveys.................................................................................. 50
Figure 22: Instruments for conducting bathymetric/hydrographic surveys............................................................................. 50
Figure 23: Drag forces in ground-mounted solar PV (only for representational purpose).................................................... 52
Figure 24: Schematic of drag forces developed in floating solar PV plant.................................................................................. 53
Figure 25: Japan’s 13.7MWp floating solar PV plant before (A) and after (B). The red circle indicates that the
           anchoring and mooring line remained intact.................................................................................................................. 53
Figure 26: Drag forces on floating solar PV plant (a representational image)........................................................................... 54

     6
Floating Solar Photovoltaic (FSPV): A Third Pillar to Solar PV Sector?

List of Charts
Chart 1:         State-wise estimated potential of Floating Solar PV...................................................................................................... 11
Chart 2:         Year-on-Year installation of grid-connected solar PV.................................................................................................... 14
Chart 3:         Global installations of Floating Solar PV............................................................................................................................. 21
Chart 4:         Project developers-wise installed capacity in China ..................................................................................................... 22
Chart 5:         Project developers-wise installed capacity in Japan ..................................................................................................... 22
Chart 6:         Project developers-wise installed capacity in the Republic of Korea....................................................................... 22
Chart 7:         Project developers-wise installed capacity in Taiwan, China...................................................................................... 22
Chart 8:         Project developers-wise installed capacity in the UK.................................................................................................... 23
Chart 9:         Floating solar PV installations in India................................................................................................................................. 24
Chart 10: Global investment cost for floating solar PV plants........................................................................................................ 25
Chart 11: Investment cost for floating solar PV projects in India.................................................................................................. 25
Chart 12: Cost break up for floating solar PV plants.......................................................................................................................... 26
Chart 13: Flow chart of the steps followed for assessing the floating solar PV potential ................................................... 40
Chart 14: Floating Solar PV locations across the country .............................................................................................................. 41
Chart 15: State wise estimated potential of FSPV.............................................................................................................................. 42
Chart 16: Priority-wise Floating Solar PV potential – Priority I (A), Priority II (B), and Priority III (C).................................. 44
Chart 17: A flow chart of floating solar PV project design.............................................................................................................. 48
Chart 18: A flow chart of steps in floating solar PV project design.............................................................................................. 51

List of Tables
Table 1:         Type of waterbodies on which floating solar PV is installed in top five leading countries.............................. 23
Table 2:         Percentage for calculating usable area............................................................................................................................... 41
Table 3:         Angle of tilt with respect to wind speed ........................................................................................................................... 52
Table 4:         Technical standards for various components of floating solar PV plants .............................................................. 55

                                                                                                                                                                                                7
Floating Solar Photovoltaic (FSPV): A Third Pillar to Solar PV Sector?

    8
Floating Solar Photovoltaic (FSPV): A Third Pillar to Solar PV Sector?

Executive Summary

                                                                                   9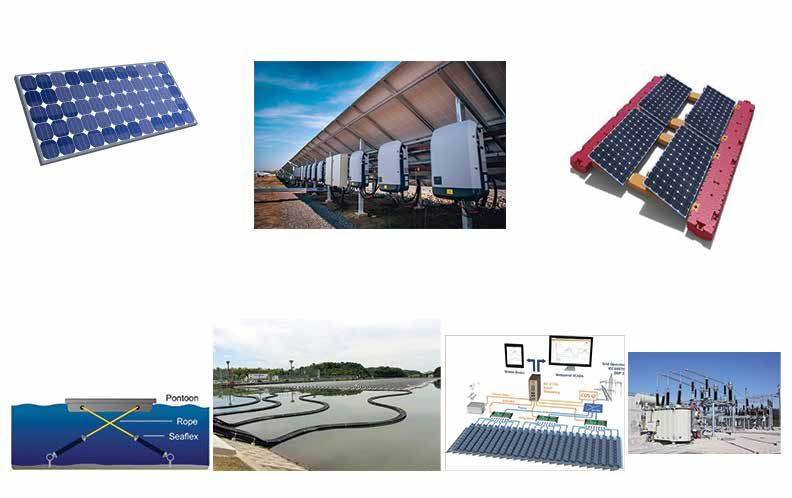
Floating Solar Photovoltaic (FSPV): A Third Pillar to Solar PV Sector?

India has done a remarkable job in terms of deployment                            large-to-medium size man-made inland waterbodies seems
of renewable energy-based installations, growing almost                           to have attracted initial interest to install FSPV based power
3.5 folds in the last 5–6 years, with most of the capacity                        plants, but all these waterbodies were created to serve
coming from onshore wind and solar photovoltaic (PV)                              various purposes like – irrigation, water supply, fishing,
based installations. At present India’s grid-connected                            hydroelectric, navigation, etc., and this warrants great
solar PV sector is majorly dominated by the ground-based                          deal of diligence to balance out various usages of these
installations (93%1) while the balance is contributed by                          waterbodies on the basis of accurate information.
rooftop the based solar PV installations. The installation                        The Energy and Resources Institute (TERI), New Delhi, India
cost of utility-scale solar PV in the country has declined by
                                                                                  with support from the Energy Transitions Commission (ETC),
84%2 between 2010-2018, making India world’s topmost
                                                                                  India, has undertaken a study to analyse data on country’s
country in achieving the lowest installation cost for utility-
                                                                                  medium and large reservoirs to estimate the potential of
scale solar PV. It is well know that solar PV deployment
                                                                                  FSPV in the country. It is observed that about 18,000 km2
is quite land intensive and scaling up the project sizes
                                                                                  water surface area spreading across various states and UTs
requires large chunk of contiguous land parcels, which
                                                                                  is suitable for the installation of FSPV plants. The overall
becomes challenging in many situations. In order to keep
                                                                                  potential is a strong indication of the extent of the surface
pace of development commensurate with the national
                                                                                  area than can be made available for setting up these
targets for solar capacity additions, alternatives are
required to be explored and established. Floating solar PV                        projects, and even a capacity of about 280 GW is possible.
(FSPV) or floatovoltaics is one such alternative, which has                       The various factors determining the overall potential
started getting traction worldwide and is expected to grow                        include percentage of water surface area coverage, water
strongly over the coming years. It is estimated that the                          level variations, the purpose of the water body, and
annual capacity addition may rise from the current installed                      proposed plant location. The reports presents state-wise
of 1.314 GWp in 2018 to 4.6 GWp by 2022. Presently, China                         details of the potential in the form of a web-based user
is the leading international market followed by Japan and                         interactive tool – India Floating Solar PV-Tool. State-
South Korea. India also has very bright prospects to develop                      wise summary of FSPV potential along with the number
FSPV projects due to availability of large water bodies.                          of identified reservoirs and reservoir area is presented in
As a technology, FSPV is in a very early stage of development                     Chart 1. The tool developed under this study also provides
in India. Till now, only a few projects with cumulative                           details regarding the historical changes in the waterbody,
capacity of 2.7 MW have been installed. However, over 1.7                         and is likely to be quite useful to stakeholder such as policy
GW capacity projects are reported to be in various stages                         developers (viz. MNRE, NITI Aayaog, state governments),
of development. FSPV market appears to inch forward to                            projects developers, implementing agencies, investors,
make its presence felt in India and the tariffs discovered                        and financing institutions. The report also covers the best
through bids have already shown rapid reductions. So far                          practice guidelines for installing FSPV projects.

1
    MNRE, Physical achievements (November 2019). Details available at - https://mnre.gov.in/physical-progress-achievements
2
    IRENA (2019), Renewable Power Generation Costs in 2018, International Renewable Energy Agency, Abu Dhabi

     10
Floating Solar Photovoltaic (FSPV): A Third Pillar to Solar PV Sector?
2556 86
Uttarakhand
429 25
Jammu 41 4
and 18122 1157
Kashmir Uttar Pradesh
21 3
5109 56
2647 379
3315 354
Himachal Pradesh
Jharkhand
1324 5
1160 31
525 96
1377 46
Punjab Bihar
219 12
229 13
160 16
Nagaland
5 1
80 1
Haryana
98 10
2 1
Assam
19711 1228
49 2
Rajasthan
6041 106
30779 2484
Madhya
Pradesh
8800 328
27044 1247 3 0.60
Gujarat Manipur
5318 223 1 1
57891 3173 171 17
Maharashtra Meghalaya
15561 568 86 4
2327 120
18529 1928
West Bengal
Telangana
450 7
6130 116
17755 877
187 24
Odisha
Goa
4104 142
56 3 9 1
33513 2147 Andaman and
Karnataka Nicobar Island
5 1
10553 171
11577 589
Chhattisgarh
2860 167
6090 434 17266 1020
Kerala Andhra Pradesh
2167 40 4962 67
8027 472
Tamil Nadu
Legend
2286 78
Scenario I
FSPV potential (in MW)
Scenario II
No. of reservoirs
Cumulative reservoir area (in km2)
Chart 1: State-wise estimated potential of Floating Solar PV
Source: TERI analysis
11Floating Solar Photovoltaic (FSPV): A Third Pillar to Solar PV Sector? 12
Floating Solar Photovoltaic (FSPV): A Third Pillar to Solar PV Sector?

1. Floating Solar PV – Understanding
   the Need

                                                                                      13
Floating Solar Photovoltaic (FSPV): A Third Pillar to Solar PV Sector?
Why Floating Solar PV? power by the year 2022, which was later revised in the year
2015. The new targets under the mission are to achieve 175
The total installed electricity generation capacity of
GW RE capacities of which 100 GW is from solar by 2022.
the country has reached over 366 GW3. Out of which Out of this, 40 GW of the target is for installation of solar
renewable energy share (RE) is 23.60% (84.4GW4) rooftop and 60 GW is for large-scale solar plants. To achieve
and with recent cabinet approval of the addition of its targets the Government of India has also taken various
large hydro power plants (45 GW) as an RE source, the innovative policy measures such as viability gap funding
current share of RE in the total installation will become (VGF), development of solar parks, and solar renewable
35.18%. India has done a remarkable job in terms of purchase obligation (RPO), etc.
deployment of RE-based installation, growing almost 3.55 At present India’s grid-connected solar PV sector is majorly
folds in the last 5-6 years, most of which have occurred dominated by the ground-based installations (93%6) and
in the onshore wind (37.27 GW) and solar PV (32.53 rest is contributed by rooftop based solar PV installations.
GW) sector. The majority of this growth in solar has been The installation cost of utility-scale solar PV in the country
triggered by the launch of Jawaharlal Nehru National Solar has declined by 84% between 2010-2018, making India the
Mission (JNNSM) on January 11, 2010. The target set under world’s topmost country in achieving the lowest installation
the mission was to achieve 20 GW of grid-connected solar cost for utility-scale solar PV.
Cumulative Net Additions
40
35
Installed Capcity (in MWp)
30
25
20
15
10
5
0
2019*
2005
2006
2007
2008
2009
2010
2011
2012
2013
2014
2015
2016
2017
2018
Years
Chart 2: Year-on-Year installation of grid-connected solar PV
Sources: TERI’s compilation based on various sources
3
Central Electricity Authority (CEA). Details available at http://www.cea.nic.in/monthlyinstalledcapacity.html
4 MNRE Physical achievements till November 2019. Details available at https://mnre.gov.in/physical-progress-achievements
5 IRENA country statistics (not accounting additions in renewable hydropower). Details available at - https://www.irena.org/Statistics/View-Data-by-Topic/
Capacity-and-Generation/Statistics-Time-Series
6
MNRE Physical achievements, November 2019. Details available at https://mnre.gov.in/physical-progress-achievements
14Floating Solar Photovoltaic (FSPV): A Third Pillar to Solar PV Sector?
However, the pace of utility scale solar PV deployment in the (refer to Figure 1 for more details). Recently there has been
country has been reducing refer to Chart 2. Among several an interest in FSPV globally as well as in India. Further,
reasons, challenges related to the availability of land and, it is also seen that if the capacity of FSPV deployment is
delay in land acquisition are considered as one of the key scaled up, the tariff may also come down closer to the tariff
reasons behind this slow pace. Hence, in order to achieve discovered for ground-mounted solar PV.
the targets set under the JNNSM, it is a must to explore the
other alternatives. Deployment of solar PV at distribution Floating Solar PV – Benefit
transformer (DT) level and floating solar PV (FSPV) are some
Some of the reported benefits of FSPV are as follows –
of the alternative solutions that are emerging to boost solar
installation. FSPV has an advantage in deploying solar PV as »» Higher gains in energy production: Correlations
it is not dependent on land availability. There are more than between the solar PV array yield, solar PV array
400,000 km2 of the reported man-made reservoirs in the temperature, and local weather conditions such as
world7 out of which India has a share of about 70,000 km2. ambient temperature, wind speed, solar irradiance,
This shows a vast potential that can be trapped for clean etc. are well known8,9. These correlations indicate that
energy generation. reduction in ambient temperature and higher wind
speed reduces the solar PV array temperature which
What is Floating Solar PV? in turn results in higher energy yield. As the ambient
FSPV also known as floatovoltaics is a solar PV application temperature at the vicinity of a waterbody is generally
in which PV panels are designed and installed to float lower than the ambient temperature at land and wind
on waterbodies such as reservoirs, hydroelectric dams, speed tends to be higher over open water surfaces as
industrial ponds, water treatment ponds, mining ponds, compared to on land, it resulting in an evaporative
lakes, and lagoons. In this, solar panels are usually mounted cooling effect. This effect results in lower operating
upon a pontoon-based floating structure and to keep its temperatures of the PV cell, which in turn improves
location fixed, floating structure is anchored and moored, the energy yield. The improvement as much as by 10%
Figure 1: Schematic representation of a typical large-scale floating PV system with its key components.
Source: World Bank Group, ESMAP and SERIS. 2019. Where Sun Meets Water: Floating Solar Market Report. Washington, DC: World Bank
7
Shiklomanov, I (1993) world water resources. In: Gleick, P., Ed., Water in Crisis. Oxford, New York
8
Duffie, J.A. and Beckman, W.A. (1991) Solar Engineering of Thermal Processes. Wiley, Hoboken.
9
Skoplaki E, Palyvos JA. On the temperature dependence of photovoltaic module electrical performance: A review of efficiency/power correlations Solar Energy
2009;83:614-24
15Floating Solar Photovoltaic (FSPV): A Third Pillar to Solar PV Sector?
as compared with land-based PV systems had been »» Possibility of sharing existing electrical
reported in a few studies10,11. However, it is important infrastructure: Many inland waterbodies especially
to note here that this improvement in energy yield reservoirs used for various purposes like irrigation,
closely depends on the design of a floating platform, water supply, reservoirs of hydroelectric plants, etc.
a gap between the water surface and the PV array, etc. have gird connections that are already available.
»» Land neutral: Since FSPV plants are installed on water Hence deploying FSPV plants in such cases may save
surfaces, the land requirement is none or greatly investment cost by utilizing the already existing
reduced as compared to ground-mounted solar PV infrastructure.
plants and hence FSPV is termed as land neutral. This »» Complementary operation with hydroelectric
is particularly of importance for developing countries power plants : As of August 2019, India has 45 GW16
like India, where land is scarce and land acquisition of installed capacity of hydroelectric power plants.
creates hurdles for deployment of solar PV projects. Since most of these plants are seasonal, their output
»» Reduction in water evaporation: Loss of water decreases particularly during dry seasons when
resources due to evaporation is a well-known water flow is less and solar radiations are high. Thus
phenomenon, reported as high as 40%12 worldwide, deploying FSPV plants in combination with already
and its effect is more significant particularly in dry existing hydroelectric power plants would not only
and aired regions. As per an estimate by Central Water improve power production in lean seasons but also acts
Commission (CWC) India, the evaporation loss in the as energy storage, using solar power during the day
country varies from 150-30013cm per km2 per annum. and hydropower during the night. Since the response
Since FSPV plants are deployed on the water surfaces, time of the hydro turbine is fast, the combination of
they provide shade to the water surfaces, thus hydroelectric–FSPV plant can be used for supplying
power during peak demand.
reducing the amount of solar radiation reaching the
water surface and also limiting the interaction of wind However in some cases, hydroelectric plants having
on the water surfaces. The combined benefit of these large variations in water level, pose difficulties in
may results in reduction in the water evaporation designing of anchoring and mooring for supporting
losses14,15. However, it is extremely difficult to exactly the floating platform. Hence it is suggested to conduct
quantify the net effect on water evaporation loss a detailed study considering the effect of waterlevel
due to deployment of FSPV plants since in general variation on the viability of deploying the FSPV plants
FSPV plants are installed on some fraction of a total at any particular hydroelectric plant.
water surface. Hence more studies are needed for »» Reduction in algae growth: Among several other
quantification of this claim. factors the growth in algae mainly depends upon
10
Choi Y-K, N-H Lee N-H, and K-J Kim. 2013. Empirical research on the efficiency of floating PV systems compared with overland PV systems. Detail available at
-https://www.semanticscholar.org/paper/Empirical-Research-on-the-efficiencyof-Floating-PV-Choi-Lee/a38910b49973d099603974c24cd55f43a8b0f64c
11
Yadav, N., M. Gupta M, and K. Sudhakar K. 2016, Energy assessment of floating photovoltaic system in 2016 International Conference on Electrical Power and
Energy Systems (ICEPES).
12
Helfer, F., C. Lemckert, and H. Zhang. 2012. “Impacts of Climate Change on Temperature and Evaporation from a Large Reservoir in Australia.” Journal of
Hydrology 475: 365–78.
13
CWC report on evaporation control in reservoirs. Details available at -http://cwc.gov.in/sites/default/files/evaporation-control-in-reservoirs.pdf
14
Santafé, M. R.; Ferrer Gisbert, P. S.,Sánchez Romero, F. J.,Torregrosa Soler, J. B.; Ferrán Gozálvez, J. J.; Ferrer Gisbert, C. M.2014. Implementation of a Photovoltaic
Floating Cover for Irrigation Reservoirs. J. Cleaner Prod., 66: 568−570.
15
Ferrer-Gisbert, C.,Ferrán-Gozálvez, J. J.,Redón-Santafé, M., Ferrer-Gisbert, P., Sánchez-Romero, F. J.,Torregrosa-Soler, J. B. 2013,A New Photovoltaic Floating
Cover System for Water Reservoirs. Renewable Energy, 60:63−70.
16
CEA monthly reports. Details available at - http://www.cea.nic.in/monthlyinstalledcapacity.html
16Floating Solar Photovoltaic (FSPV): A Third Pillar to Solar PV Sector?
light intensity and temperature of the water. Since for cleaning purposes. However, the quality of the
FSPV plants provide shade to the water surface, they water needs to be checked and should be under the
reduces the amount of sunlight reaching the water permissible limit as described by PV manufacturers.
surface, which may cause a reduction in algae growth17. »» Easy installation and deployment: In general,
However, the effect of deploying the FSPV plants on installation of a typical FSPV plant is simpler and
the local water environment is still not well understood easy as compared to land-mounted solar PV plants.
and would require further studies to understand the This is because of –(a) no civil work is required to
related issues.
prepare the site; (b) floating platform used to float
»» FSPV as a new source of revenue: Deploying FSPV solar PV arrays on a water surface are made in form
plants can provide an additional source of revenue to of a modular individual floats which are prefabricated
a waterbody owner by–either utilizing the electricity and are interconnected to form a large section, (c)
generated via self-consuming, thereby reducing floating platforms are assembled on land by adding
their own consumption or via selling the electricity rows of these modular interconnecting floats. Each of
generated to the grid. In either way, FSPV creates an these rows is pushed into water as the next row being
economic value of a waterbody. For example, Jinko18 added to form a large platform. Once completed, the
has installed 120-MW FSPV-based plant on a fishing
entire platform is towed to the exact location on the
farm at Poyang Lake in China, spread over 2000
waterbody with the help of boats. As per discussions
acres of water surface and generating 137.70 GWh
with India-based FSPV developer, the typical rate of
of electricity. Till now there are very few studies that
FSPV plant installation, provided other supply chain
provide some information on the potential impact of
is in place, varies from 2.5 kWp/person/h to 3.0 kWp/
deploying FSPV on local ecology, hence it is suggested
person/h.
to conduct a detailed study before deploying large-
scale FSPV plants. However, FSPV has its fair share of challenges like higher
capital costs, the potential for contamination of water,
»» Less soiling loss: Since wind blowing over water
limited understanding of the technology, unavailability/
surfaces contains less dust as compared to wind blow
limited knowhow of appropriate quality standards,
over land, FSPV plants are subjected to less dust as
technical specifications, etc. These issues are presented in
compared to land-mounted solar PV installations.
detail in Chapter 7 of this report.
»» Ease of cleaning: In case of FSPV plants deployed
on inland waterbodies, water is readily available
17
Sahu A., N.Yadav, and K. Sudhakar. 2016. Floating photovoltaic power plant: a review. Renew Sustain Energy Rev. 66 (Supplement C): 815–824
18
Jinko Solar company profile, year 2018. Details are available at - https://www.jinkosolar.com/ftp/company%20profile%202018.pdf
17Floating Solar Photovoltaic (FSPV): A Third Pillar to Solar PV Sector? 18
Floating Solar Photovoltaic (FSPV): A Third Pillar to Solar PV Sector?

2. Global Market Overview

                                                                                     19
Floating Solar Photovoltaic (FSPV): A Third Pillar to Solar PV Sector?
Global Scenario installations are coming up in Asia, particularly in Japan,
China, and South Korea. The FSPV technology has been
In 2007, the National Institute of Advanced Industrial able to gather a lot of traction in the past 3 years (2016,
Science and Technology (AIST) built the world’s first FSPV 2017 and 2018) globally, which is evident from the increase
plant of 20-kWp capacity in Aichi, Japan. Later in 2008, the in the installation presented in Chart 3. The total installed
first commercial-scale installation of capacity 175 kWp came capacity now stands at 1314 MWp, which is further going
up at Far Niente Winery, California, USA. Most of these early to increase substantially in the years to come and expected
projects are small-scale systems with a purpose of research to reach 4600 MWp by 2022, thanks to the recent increase
and demonstration. From early 2013, megawatt scale FSPV in the activities in the sector in countries like China.
plants started to appear in Japan and South Korea. Since Majority of installations till date are deployed on man-made
then installations have increased many folds from few waterbodies such as irrigation dams, industrial basins,
megawatt-peak (MWp) to more than 1300 MWp by the end water treatment plants, and unused mining ponds. More
of 2018. information on the current status of the FSPV projects in the
The technology is currently deployed in more than 24 top five countries is provided in detail in Chart 3.
countries across the entire world with the majority of
20Floating Solar Photovoltaic (FSPV): A Third Pillar to Solar PV Sector?
Others, 26 MWp
China,
960 MWp The EU*, Thailand,
8 MWp 1 MWp
Japan,
210 MWp United States, Italy,
6 MWp 1 MWp
Korea, 79
MWp Cambodia, Malaysia,
3 MWp 0.5 MWp
Taiwan,
26 MWp India, The Republic
2.7 MWp of Maldives,
UK, 13 0.2 MWp
MWp Singapore,
1.5 MWp Australia,
Others, 0.1 MWp
26 MWp Brazil,
1.5 MWp Israel,
0.05 MWp
3000
2400
2500
Installed capacity (in MWp)
2000
1314
1500
1086
1000
786
528
359
500
169
101
0.5
0.5
0.5
1.5
0.7
2.2
1.2
3.4
2.3
5.7
5.3
68
57
11
1
0
te 9
07
08
09
10
11
12
13
14
15
16
17
18
ec 01
20
20
20
20
20
20
20
20
20
20
20
20
d)
xp 2
Year
(e
Yearly installed capacity (in MWp) Cumulative installed capacity (in MWp)
Chart 3: Global installations of Floating Solar PV
Source: TERI’s analysis based on a compilation of publicly available sources
*Excluding the UK
21Floating Solar Photovoltaic (FSPV): A Third Pillar to Solar PV Sector?
China was the first country to install a tracking-based FSPV plant
having a capacity of 465 kW in 2014. Recently, the Ministry
China is a leading country in terms of highest installation of Trade, Industry, and Energy (MOTIE) has announced
capacity accounting for more than 960 MWp out of global its plans for developing 2.1 GW of FSPV-based projects at
total of 1314 MWp. The country is also home to the world’s
Saemangeum Seawall Dyke located on the southwest coast
largest FSPV plant of 150 MW capacity installed at Huainan,
of the country. The project will be built in two stages . The
south Anhui province. Most of the FSPV plants in China are
first stage with a capacity of 1.2 GW is to be completed by
installed at unused mining ponds. (refer Table 1 for more
2022 and the remaining 900 MW by 2025 in the second
details)
stage. Upon completion, the project will be 14 times larger
Xiamen Mibet than the present world’s largest 150-MW FSPV-based
New Energy Co.,
20 MWp project of China.
20+ projects Ciel & Terre,
960 MWp + NorthMan Energy 120 MWp
Technology,
150 MWp Other, 16 MWp Scotra Co.
30+ projects Ltd, 37 MWp
Jintech New
Sungrow, 79 MWp + Techwin, 0.7 MWp
450 MWp
Energy, 220 MWp Ciel &
500 MWp + LS Industrial Terre, 6 MWp
Systems Co.,
3 MWp LG-CNS, 6 MWp
k-Water, 2.5 MWp
Seafelx, 5 MWp
Chart 4: Project developers-wise installed capacity in China 2300 MWp + Solkiss, 3 MWp
Source: TERI’s analysis based on a compilation of publicly available sources
Chart 6: Project developers-wise installed capacity in the
Japan Republic of Korea
Source: TERI’s analysis based on a compilation of publicly available sources
With more than 210 MWp of installed capacity, Japan is a
leading country in terms of total numbers of installation Taiwan, China
and home to 73 of the world’s 100 largest FSPV plants.
With more than 26 MWp of installed capacity and more than
The majority of these plants are installed on man-made
180 MWp in pipeline, Taiwan is among the fastest-growing
waterbodies having main purpose to retain rainwater or
FSPV markets and the fourth largest country in the world in
irrigation. (refer Table 1 for more details)
terms of total installed capacity. The majority of these plants
West Energy are installed on water retention reservoirs and irrigation
Solutions, 4 MWp others, dams (Refer Table 1 for more details). The country’s largest
Takiron 40 MWp
90+ projects Engineering, FSPV plant of 9.9MW capacity is installed at the Agongdian
210 MWp + 10 MWp reservoir covering 9.19 hectares of water surface area.
Sumitomo Mitsui Ciel & Terre,
Construction, 118 MWp
6 MWp
Ibiden Ciel & Terre,
20 MWp
155 MWp + Engineering, 2 MWp
Kyoraku Co., 10+ projects
30 MWp 26 MWp +
Sungrow, 5 MWp
Chart 5: Project developers-wise installed capacity in Japan
Source: TERI’s analysis based on a compilation of publicly available sources Other, 1 MWp
The Republic of Korea 180 MWp +
Korea was among the early mover to have adopted FSPV.
Chart 7: Project developers-wise installed capacity in Taiwan,
Till date the country has installed more than 79 MWp of China
FSPV plants and more than 2300 MWp are in pipeline. Korea
Source: TERI’s analysis based on a compilation of publicly available sources
22Floating Solar Photovoltaic (FSPV): A Third Pillar to Solar PV Sector?
The UK
With more than 13 MWp of installed capacity, the UK is the 10+ projects Ciel & Terre,
10.35 MWp
fifth largest country in terms of FSPV installation. Like many 13 MWp +
other Asian countries, lack of space for land-mounted PV
Other, 3MWp
in the country is the main reason for going towards FSPV
plants. The majority of the plants in the UK are installed on
15 MWp +
irrigation and water treatment ponds. In March 2016, the
world’s first deep water reservoir (maximum depth of 18.4
m) based FSPV plant of 6.4 MWp was installed at the Queen Chart 8: Project developers-wise installed capacity in the UK
Elizabeth II reservoir in the UK. Source: TERI’s analysis based on a compilation of publicly available sources
Table 1: Type of waterbodies on which floating solar PV is installed in top five leading countries
Country Water body type Typical range of % of Typical range of depth Typical range of
water surface area of water body on which water level variation
covered by FSPV FSPV plants are installed (in meters)
plants (in meters)
China Irrigation ponds 10%–30% 3.5–14.1 3.5– 8.0
Industrial ponds No information No information No information
Large waterbodies 10%–40% No information No information
Mining ponds 10%–20% 3–12.5 4.8
Japan Irrigation ponds 10%–70% 1.8–15.1 1.8–15.1
Industrial ponds No information No information No information
Water storage reservoirs 15%–86% 3.0–5.0 3.0–5.0
Taiwan Irrigation ponds 11%–28% 3.6–4.6 2.4–4.6
Industrial ponds 15% 14 5
Water storage reservoirs 7%–10% No information No information
UK Irrigation Ponds 2% –15% 4.0–18.4 4.0–18.4
Water treatment plant 48% 10 10
Source: TERI’s analysis based on a compilation of publicly available sources
23Floating Solar Photovoltaic (FSPV): A Third Pillar to Solar PV Sector?
Indian Scenario
2050
1721
1800
1550
1300
1050
Capacity (in MW)
800
550
2.5
2
2
1.5
1
0.5
0.5
0.01 0.01 0.1 0.1
0
2014-Kolkata 2016- 2016- 2017-Wayanad 2018-Panipat 2018- till Oct 2019
Chandigarh Kayamkulam Visakhapatnam tender
announcements
Chart 9: Floating solar PV installations in India
Source: TERI’s analysis based on a compilation of publicly available sources
The FSPV as a technology is still in the nascent stages of in the numbers of tenders that are released in the past 2
development in India. The journey started with a 10kW FSPV years. At the moment there is more than 1700 MW worth
plant on a pond in Rajarhat, Kolkata in 2015. The project of projects, which are in various stages of development and
was part of a research activity sponsored by the Ministry of more are in pipeline making the outlook very positive for this
New and Renewable Energy (MNRE). In 2016, NTPC installed new segment.
country’s largest 100kW plant on a reservoir of its combined
cycle power plant situated in Kerala’s Kayamkulam district. Cost of Floating Solar PV Plants
Later in December same year, Kerala State Electricity Board This section describes the investment cost trends of the
started its operation of 500kW plant at Banasura Sagar recent FSPV projects, which are purely based on the publicly
reservoir in Wayanad district replacing NTPC’s 100kW as a available data. Since FSPV technology has just started
largest FSPV-based plant. The plant is actually a scaled-up getting tractions, accurate data related to project capital
version of the 10kW plant commissioned in January 2016 and operating cost are not disclosed in the public domain.
at the same location. The plant was able to bring some Hence it is suggested to take the data presented as indicative
confidence to FSPV promoters by successfully surviving the and not as a generalized cost for the technology. Also at
recent flood ravage in the state. The recently commissioned present, as there are a few projects that are installed and are
2MW project at Visakhapatnam, Andhra Pradesh has now in operation, it is very difficult to calculate their operations
the largest FSPV-based plant commissioned in the country and maintenance cost. Thus only capital costs are used to
till date and with this the total installed capacity of FSPV has showcase the investment cost trends in Chart 10. This is
becomes 2.7 MW. The FSPV sector is now getting a lot of important to note that some amount of approximations19
attention in the country, which can be seen via an increase is applied on the publicly available data.
19
Assumptions used –
Dollar prices
2014, 1.00 US$ = INR 62.33
2015, 1.00 US$ = INR 62.97
2016, 1.00 US$ = INR 66.46
2017, 1.00 US $ = INR 67.79
2018 1.00 US $ = INR 70.09
1 MWp of FSPV plant would generate 1.5–1.65 million units under typical conditions in India
24Floating Solar Photovoltaic (FSPV): A Third Pillar to Solar PV Sector?
₹ / Wp
0.00 50.00 100.00 150.00 200.00 250.00
UK – 0.2 MWp Sheeplands (2014) 71.06
Japan - 2 MWp Shiroishi Saga (2015) 196.47
Portugal - 0.2 MWp EDP Hydro (2016) 153.52
China - 20 MWp Anhui Xinyi (2016) 98.36
UK - 6.3 MWp Queen Elizabeth II (2016) 81.08
India - 2 MW Visakhapatnam (2016) 54.00
Japan -2.4 MWp Noma Ike (2017) 198.62
Japan - 1.5 MWp Mita Kannabe (2017) 198.62
India - 0.5 MWp Kerala (2017) 192.52
China - 40 MWp Anhui Sungrow (2017) 76.60
India - 3 MW Visakhapatnam (3MW) (2017) 49.00
India - 4 MW Tirupati (2018) 82.35
Japan - 13.7 MWp Yamakura Dam (2018) 67.99
India - 2 MWp Andhra Pradesh (2018) 64.48
China - 150 MWp Three Gorges (2018) 69.39
India - 5 MWp West Bengal auction lowest price. 58.17
India - 10 MW Kerala (2018) 40.60
India -22 MW Kayamkulam phase I (2018) 39
India -70 MW Kayamkulam phase II (2018) 35
Chart 10: Global investment cost for floating solar PV plants
Source: TERI’s analysis-based on a compilation of publicly available data
It is interesting to see how the cost had decreased in the expect it to go down further, as more projects are about to
past 2 years. Especially the country like India has already come in the near future. More details on cost trends in India
started getting the lowest cost in the world and one can are presented in Chart 11.
₹ / Wp
0.00 50.00 100.00 150.00 200.00 250.00
India - 2 MW Visakhapatnam (2016) 54.00
India -500 kWp Kerala (2017) 192.52
India - 3 MW Visakhapatnam(3MW) (2017) 49.00
India - 2 MWp Andhra Pradesh (2018) 64.48
in cost
~ 45 % decrease
India - 5 MWp West Bengal auction lowest. 58.17
India - 10 MW Kerala (2018) 40.60
India -22 MW Kayamkulam phase I (2018) 39
India -70 MW Kayamkulam phase II (2018) 35
Chart 11: Investment cost for floating solar PV projects in India
Source: TERI’s analysis-based on a compilation of publicly available data
25Floating Solar Photovoltaic (FSPV): A Third Pillar to Solar PV Sector?
Recent bids results indicate a sharp decline in the investment »» Depth of waterbody
cost for FSPV. In the latest tender result of the country’s first »» Waterlevel variation
large-scale FSPV plant of 70MW capacity, cost as low as INR »» Site conditions – wind speed and its direction, solar
35 per Wp has been quoted by developers. This is the lowest irradiations, ambient temperature, humidity levels, etc.
cost achieved in the entire world so far. Further considering
»» Size of the plant
last year’s trends, one can see the 45% reduction in the cost,
Chart 12 presents component-wise cost breakup share of a
which is significant. Even though the costs have decreased,
typical megawatt scale FSPV-based project. Just like ground-
it is still very early to come to any generalization, since the
mounted solar PV plants, the PV module has a major share
FSPV as a technology is still in its early stage of market
in overall cost breakup. The main difference lies in the cost
penetration. The reduction in costs, particularly in India
of the floating platform and anchoring and mooring system,
may be linked to many factors like – decrease in the cost of
representing approximately 38% of overall cost.
floaters because of improvement in manufacturing process,
reduction in the material cost, reduction in thickness of Supporting Frameworks for FSPV
floaters, aggressive biddings by project developers to get
The FSPV sector is becoming popular day by day but
some experience in FSPV sector seeing the high growth
still, there are very few countries that are providing any
in national as well international markets etc. However, it
kind of support/incentives exclusively for FSPV. Unlike
is very early to arrive at any conclusion. While falling cost
ground- mounted solar PV, there are no specific standards
is a welcome trend, it is also important to check whether
or policy for FSPV technology as of now. A few Asian
this is not impacting the overall quality of the projects,
countries like Japan, Malaysia, Vietnam, etc., are following
since degradation in the quality of FSPV projects has higher
preferential feed-in tariffs for FSPV. Till now most of the
potential to impact local biodiversity compared to ground-
FSPV projects in these countries are small in size (less
mounted solar PV. Hence it is essential to form proper
than 5 MW) and financed by local/national banks in local
guidelines/standards to keep the things in check from the currencies. However, large international commercial banks
initial stage of market development of FSPV technology. as well as multilateral developments banks which were
In general, the cost for setting megawatt scale FSPV plants only supporting small-scale studies, now moving towards
depends upon the following : financing FSPV projects resulting in the development of
»» Project location large-scale projects. In general, in some countries like China,
BoS, 4%
Cabling, 10–12%
Floating Platform, 28–35%
Inverter, 8–12% Anchoring and mooring, 2%
Installation, 2%
Module, 35–40%
Chart 12: Cost break up for floating solar PV plants
Source: TERI’s analysis based on a compilation of publicly available data
26Floating Solar Photovoltaic (FSPV): A Third Pillar to Solar PV Sector?
Japan, Korea, and India existing initiatives like RE targets 2040. In order to accelerate the country’s RE deployment
set under the national policies are driving the demand for and to create a competitive market environment, in 2012
development of the new projects (size >2–5 MW) while FiTs was replaced by Renewable Portfolio Standard with an
in some other countries financial support is provided for aim to steadily increase RE mix in the total power generation
pilot-scale demonstration projects. For projects having size in the period 2012–2024. Under this, power producers
> 2-5 MW, tenders and auctions are the chief ways which having installed capacity greater than 500 MW are required
are being used to implement FSPV projects. The analysis of to generate minimum percentage (also know as obligatory
policy and other supporting frameworks are discussed as renewable service supply ratio) of generation from a new and
below: renewable energy source. Based on the energy generated
from RE sources, Renewable Energy Certificates (RECs) are
China
provided to power generators. These RECs are calculated
Presently, China is a leading country in terms of total based on the weighing scheme under which weights are
installed capacity in FSPV and accounting for 73% of global applied to various RE sources. A weightage of 1.5 is applied
installations. The majority of these projects are installed to FSPV as compared to 0.7 for land-based solar PV.
on flooded mines and having a capacity of greater than 5
MW. Most of these large-scale FSPV projects in China are India
developed under the country’s Top Runner Programme,
As highlighted in this report, until now the cumulative
which is targeting 201–270 GWp solar PV installations by
installed capacity of FSPV-based projects has reached
the year 2020.
to 2.7 MW. However, it is going to increase many folds by
Japan the end of 2019, as projects 1721 MW are in the various
stages of development at the moment. The majority of
As highlighted in this report, Japan is the second-largest
these projects are developed through a tendering process.
country accounting for 16% of the total global installations
The Solar Energy Corporation of India (SECI) is the leading
of FSPV. Japan developed the world’s first floating pilot
organization followed by NTPC Ltd, NHPC, state-level
project of 20 kWp in 2007. Mostly all solar projects in Japan
distribution companies (like Kerala State Electricity Board
have been implemented based on preferential feed-in tariffs
Limited), and city development authorities such as the
(FiTs). But 2017 onwards FiTs benefits are not applicable
Greater Visakhapatnam Smart City Corporation Limited
to larger projects (≥2 MWp) and electricity tariff is now
(GVSCCL), etc.
calculated by competitive bidding process.
Taiwan, China – The Netherlands
With over 26 MWp of installed capacity and more than 180 In 2017, the Ministry of Infrastructure and Water
MWp worth projects are in various stages of development, Management, Netherlands had created a consortium called
Taiwan, China is the fourth largest country in the world. It ‘Zon op Water’ to develop 2 GWp of FSPV by 2023. The
is among the few countries that are offering a specific FiTs consortium aims to install many demonstrations of FSPV
to FSPV projects. As per the Ministry of Economic Affairs, projects. Under the government subsidies scheme of SDE+,
FiTs for FSPV projects in the first half of 2019 vary from 1.8MWp FSPV plant at Gelderland was financed through a
NT$4.5016/kWh (for an off-grid project) to NT$4.345/kWh non-recourse loan from ING.
(for grid-connected projects), about 10% higher than the
land-based solar PV of the same size.
The USA
In some places in the USA, like Massachusetts, special
The Republic of Korea compensation rates (location based) for FSPV projects
The Republic of Korea has set an ambitious target of are given. In 2018, Solar Massachusetts Renewable
achieving 30.8 GW of installed capacity by 2030 from solar Target (SMART) programme was launched, which offers
and 35% of energy generation from RE-based sources by compensation rate add-on of $0.03/kWh for FSPV projects.
27You can also read