Belgian Institute for Postal Services and Telecommunications - BIPT
←
→
Page content transcription
If your browser does not render page correctly, please read the page content below
Belgian Institute for Postal Services and Telecommunications

           Impact study of 26 June 2018
        regarding a fourth mobile network
          operator on the Belgian mobile
                      market

                               Belgian Institute for Postal Services and Telecommunications
                             Ellipse Building - Building C - Koning Albert II-laan 35 - 1030 Brussels
         Tel. 02 226 88 88                                   Fax 02 226 88 77                         http://www.bipt.be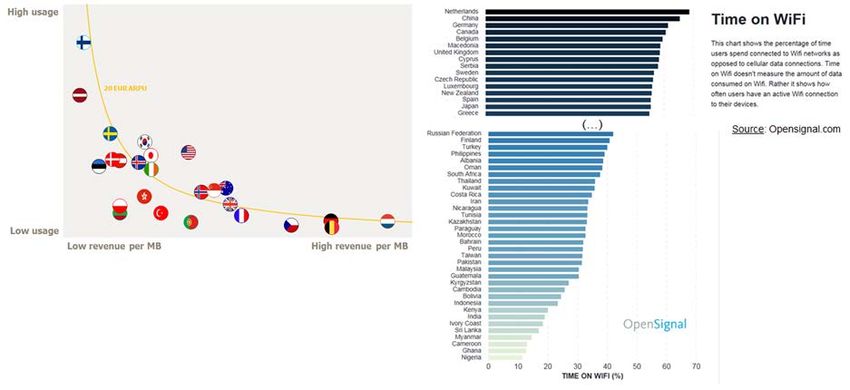
TABLE OF CONTENTS

INTRODUCTION .............................................................................................. 4

1.               DYNAMICS IN THE BELGIAN MOBILE MARKET ............................... 6
     1.1     Market shares and convergence ........................................................................................... 7
     1.1.1   Conclusion market shares and convergence ....................................................................... 11
     1.2     Churn and ARPU .................................................................................................................. 11
     1.2.1   Conclusion Churn and ARPU ............................................................................................... 14
     1.3     Price evolution on the mobile market and international price comparison ....................... 15
     1.3.1   Price evolution in Belgium ................................................................................................... 15
     1.3.2   International price comparison ........................................................................................... 17
     1.3.3   Conclusion of the price analysis .......................................................................................... 21
     1.4     Qualitative aspects .............................................................................................................. 22
     1.4.1   Coverage .............................................................................................................................. 22
     1.4.2   Speed and quality ................................................................................................................ 23
     1.4.3   Take-up ................................................................................................................................ 25
     1.4.4   Consumption ....................................................................................................................... 26
     1.4.5   Conclusion qualitative aspects ............................................................................................ 28

2.               SPECTRUM ...................................................................................30
     2.1     Introduction concerning spectrum use ............................................................................... 30
     2.2     Future technological evolution of 5G .................................................................................. 32
     2.3     Reserved spectrum .............................................................................................................. 36
     2.4     Impact in terms of availability of spectrum for the existing operators............................... 38
     2.5     Distribution at 700 MHz ...................................................................................................... 42
     2.6     Pylons and antennas ........................................................................................................... 43
     2.7     Aspects related to environmental issues ............................................................................ 46
     2.8     Conclusion spectrum ........................................................................................................... 48

3.               POSSIBLE OPTIONS FOR THE MOBILE TELEPHONY MARKET..........50
     3.1     Status quo of the existing playing field ............................................................................... 50
     3.1.1   Existing regulation regarding transparency ........................................................................ 50
     3.1.2   Market regulation in the related wholesale markets ......................................................... 51
     3.1.3   Market regulation of mobile tariffs for call termination ..................................................... 53
     3.2     New regulation in the mobile market ................................................................................. 54
     3.3     Entry of a fourth MNO......................................................................................................... 55
     3.3.1   Conditions for a fourth MNO .............................................................................................. 56
     3.4     Conclusion on options in the mobile market ...................................................................... 57

Impact Study fourth MNO on the Belgian mobile market 2/92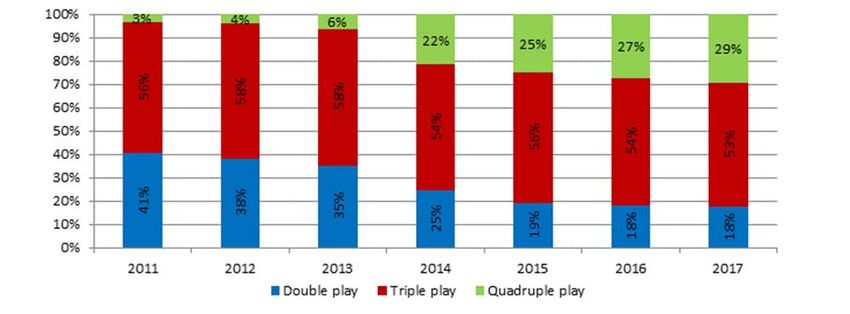
4.                EFFECTS OF A POSSIBLE FOURTH MOBILE OPERATOR ..................59
     4.1 Summary of trends in Europe ............................................................................................. 59
     4.2 Impact of a fourth operator in terms of price ..................................................................... 59
     4.2.1 Ex-ante analysis of the mergers from 4 to 3 operators....................................................... 59
     4.2.2 Post-merger analyses and entries: impact on price levels and products............................ 62
     4.2.3 Concrete examples of entry of a fourth operator in the market ........................................ 65
     4.2.3.1    Market entry of a fourth operator in France .............................................................. 65
     4.2.3.2    Market entry of a fourth operator in Italy .................................................................. 66
     4.3 Impact on quality and investments ..................................................................................... 66
     4.4 Stability of a fourth operator in the long term.................................................................... 69
     4.4.1 Impact on the entire Belgian telecom market .................................................................... 71
     4.4.2 Comparison with previous entries in the Belgian mobile market ....................................... 72
     4.5 Conclusion about the effects of a possible fourth operator ............................................... 73

5.                CONCLUSION OF THE IMPACT ANALYSIS ......................................74
     Annex 1: Summary of historic granting of mobile licences ........................................................... 78
     Annex 2: Overview of the decisions of the European Commission concerning recent
     concentrations of mobile network operators ............................................................................... 79
     Annex 3: Commercial strategies concerning multiplay offers with a mobile component ............ 82
     Annex 4: Study of Market Entry and Fighting Brands: The Case of the French Mobile
     Telecommunications Market ......................................................................................................... 84
     Annex 5: Comparison quality of networks Belgium and France.................................................... 87
     Annex 6: OECD price comparison mobile telephony and Internet ............................................... 91

Impact Study fourth MNO on the Belgian mobile market 3/92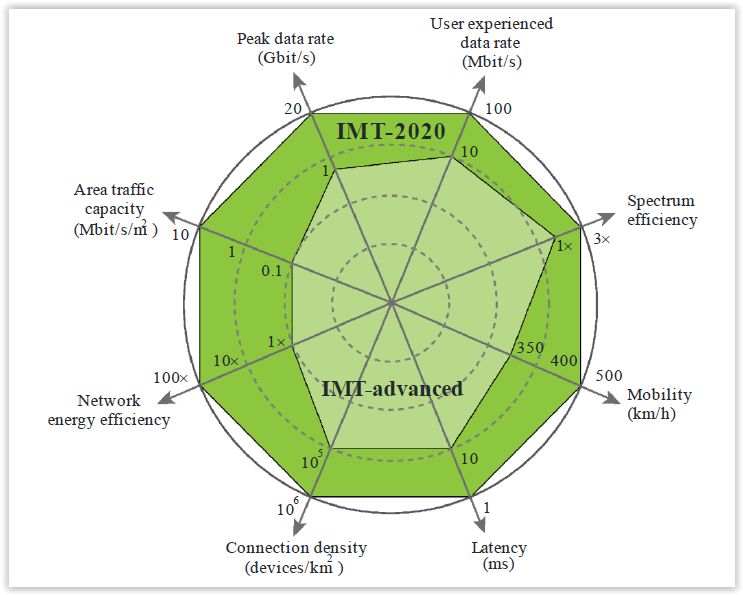
INTRODUCTION
          1.      The Belgian government wishes to maximise consumer welfare, in terms of price,
                  quality and diversity of the supply in the telecom market. The government intends
                  to take the most suitable measures to achieve this goal.

          2.      To that end, Vice-premier Alexander De Croo requested the BIPT, in a letter
                  received on 15 June 2018, "to draw up a report on the status quaestionis of
                  consumer welfare in the Belgian telecom market".

          3.      In his lettrer, the Vice-premier asked the following in particular:

                  "The report should also provide a summary of the major difficulties regarding
                  consumer welfare and of any possible measures to solve them. It is also important to
                  identify the advantages and disadvantages and the side-effects of the various
                  measures. The government wishes to understand the pros and cons of the various
                  measures."

                  "The report should provide a clear answer as to how the government can provide
                  spectrum, in the very best possible way, for the benefit of users (consumer welfare
                  maximisation) and, in particular, address the organisation of the auction and the
                  telecom sector."

          4.      This report answers the above-mentioned requests. It investigates whether
                  allowing the entry of a fourth operator in the Belgian mobile telephony market, by
                  allocating additional spectrum, might have positive, and possibly negative effects
                  on competition in that market.

          5.      Therefore, this report focusses on the government’s request, based on the once-
                  only possibility 1,offered by the spectrum policy, of allowing a new player to enter
                  the market.

1 A spectrum auction such as is now on the table, will not take place again in the next 20 years, given the fact that licences have a
duration of 20 years and that there is little or no more room within this period for a redistribution of the spectrum portfolios. It is
therefore impossible or very difficult to enter the market via spectrum within this period, unless the operators were to voluntarily
trade spectrum.

                                                                  4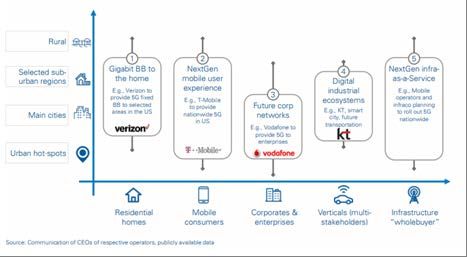
6.      It should be emphasised that the potential entry depends on the mechanisms of the
                  mobile telephony market. Therefore, the government does not get to decide on the
                  entry of a new player on the market. The spectrum policy restricts itself purely to
                  the creation of opportunities in this market, in a context in which a level playing
                  field is ensured by the way spectrum is allocated.

          7.      Furthermore, this report is not a general analysis of the telecom market and of all
                  the possible measures to maximise consumer welfare. This would certainly require
                  a much more extensive study. Several aspects of this matter have already been
                  explicitly studied in the various analyses regularly carried out by BIPT (in
                  cooperation with the Community regulators for media) 2.

          8.      The following is therefore a study on the relevant aspects of the Belgian mobile
                  telephony market, including the competitive dynamics, the possibility to allocate
                  additional spectrum and the possible impact of a fourth mobile network operator.
                  Where this affects these questions, the impact on associated markets is also taken
                  into consideration.

2 See, for example, the recent proposal of the CRC market analysis for the broadband internet and television broadcasting markets,
by    CRC.     http://www.bipt.be/en/operators/press-release/161-notification-by-the-crc-to-the-european-commission-of-draft-
decisions-regarding-the-broadband-internet-and-television-broadcasting-markets

Press release, 29 May 2018: “The European Commission authorises the CRC to finalise the analysis of the broadband Internet and
television broadcasting markets", http://www.bipt.be/en/operators/press-release/162-the-european-commission-authorises-the-
crc-to-finalise-the-analysis-of-the-broadband-internet-and-television-broadcasting-markets

                                                                5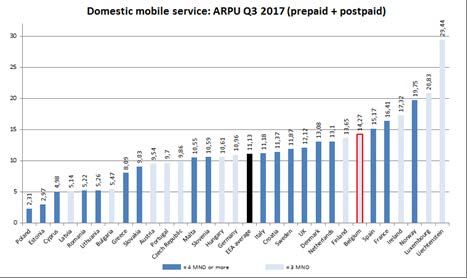
1. DYNAMICS IN THE BELGIAN MOBILE MARKET
             10.   There are both MNO operators (Mobile Network Operator) and MVNO operators
                   (Mobile Virtual Network Operator) active in the mobile market. An MNO has its
                   own radio access network and spectrum licence. There are three mobile operators
                   in Belgium: Proximus, Orange Belgium and Telenet Group 3. These three
                   operators have each rolled out three technologies: 2G, 3G and 4G 4.

             11.   An MVNO does not have its own network, as opposed to an MNO. MVNOs are
                   therefore dependent on the network of one of the three MNOs. The most advanced
                   MVNOs (known as "Full MVNOs") do have their own fixed network elements, but
                   not their own radio network. Consequently, they are able to significantly
                   differentiate their services from those of the operator whose network they are
                   using. This means they can strongly influence the market's competitive dynamics.

             12.   Since Telenet's take-over of BASE, Lycamobile is currently the only remaining full
                   MVNO of any significant size 5. In 2017, this category of full MVNOs represented a
                   market share of 4.8% of the number of SIM cards. In addition, there are another
                   ten light MVNOs and mobile service providers taking a market share of 7.5% 6.

3 Telenet provided mobile services until 2017 over Orange's network (formerly Mobistar) as a full MVNO. On 3 February 2016,
Liberty Global, owner of Telenet, received approval from the European Commission to take over mobile operator BASE. Telenet
became then an MNO. The sale of MVNO Mobile Vikings to Medialaan was then a condition to ensure competition in the Belgian
market.

4 A summary of the history of the allocation of mobile licences is shown in Annex 1.

5 By the end of 2017, Lycamobile had achieved a total of 571,051 active SIM cards. There are also smaller full MVNOs on the market,
such as Vectone Mobile and Join Experience. From 2019, Medialaan will also function as a new full MVNO (see marginal15).

6 BASE Turk, Belgian Telecom, Carrefour Mobile, EDPnet, Ello mobile, L-Mobi Mobile, Scarlet, Dommel, United Telecom, Voo and
Transatel.

                                                                  6
1.1 Market shares and convergence
          13.      The table below shows the evolution of the market shares of the various MNOs and
                   full MVNO Lycamobile 7.

           60%

           50%
                                                40,9%
           40%

           30%                                                                                                                                                                      24,4%

           20%                                                                                16,9%
                                                                                                                                         13,0%

           10%                                                                                                                                                                                                             4,8%

            0%
                 2012
                        2013
                               2014
                                      2015
                                             2016
                                                    2017

                                                           2012
                                                                  2013
                                                                         2014
                                                                                2015
                                                                                       2016
                                                                                              2017

                                                                                                      2012
                                                                                                             2013
                                                                                                                    2014
                                                                                                                           2015
                                                                                                                                  2016
                                                                                                                                         2017

                                                                                                                                                 2012
                                                                                                                                                        2013
                                                                                                                                                               2014
                                                                                                                                                                      2015
                                                                                                                                                                             2016
                                                                                                                                                                                    2017

                                                                                                                                                                                            2012
                                                                                                                                                                                                   2013
                                                                                                                                                                                                          2014
                                                                                                                                                                                                                 2015
                                                                                                                                                                                                                        2016
                                                                                                                                                                                                                               2017
                  Proximus (incl light MVNO)                 Ex-Base (incl light MVNO)                  Telenet ( incl light MVNO)                 Orange (incl light MVNO)                 Lycamobile (full MVNO)

              Figure 1: market shares in the mobile market based on SIM cards (source: BIPT)

          14.      Based on the number of active clients, Proximus is the market leader with a market
                   share of 41%. BASE/Telenet follows (joint market share of 30%) and then Orange
                   Belgium (24.4%). In terms of turnover, Proximus has a market share of 44%,
                   Orange 31% and Telenet 25%. It should be mentioned here that the impact of the
                   BASE/Telenet merger will not be fully felt until early 2019.

          15.      From 2019, Medialaan will also function as a new full MVNO. Their roughly
                   365,000 clients 8 will then migrate from BASE's network to Orange Belgium. This
                   will give Medialaan, as a future MVNO, a virtual market share of 3%, in terms of
                   number of active clients.

          16.      The aforementioned evolution of market shares therefore shows that there was an
                   initial increase to be seen in recent years in the competitive dynamics. Full MVNOs

7 The market shares of BASE and Telenet are given separately for the clarity purposes. Up till 2017, Telenet was a full MVNO (on
Orange's network) and BASE was an MNO. The takeover of BASE by Liberty Global made Telenet an MNO, and BASE now only a
brand name.

8 Medialaan provides the mobile brands Mobile Vikings and Jim Mobile.

                                                                                                         7
such as Telenet have acquired a significant market share since the arrival in the
                  market of the mobile offer “King & Kong” in 2013. This caused the rather high
                  prices for mobile data to drop (see section “1.3 Price evolution on the mobile
                  market”).

          17.     A consolidation is currently taking place. Due to its takeover of BASE, Telenet will
                  become the second largest MNO in terms of number of SIM cards, but remains the
                  third operator in terms of turnover. Following this takeover, the market share of
                  full MVNOs will fall from 15.3% to 4.8%.

          18.     Moreover, further consolidation cannot be ruled out. Telenet has already started
                  the acquisition of operator SFR, which provides fixed broadband and broadcast
                  services in the Brussels Capital Region.. Telenet has also reached an agreement
                  with VOO, the brand under which the Walloon intermunicipal company Nethys and
                  network operator Brutélé market their telecommunication products. To this day,
                  VOO has been providing its mobile services over Orange's network. Thanks to this
                  agreement, the Walloon brand will provide its mobile service from 2019 over
                  Telenet's network. This will result in an estimated 200,000 mobile clients
                  migrating from Orange's network to Telenet. A complete takeover of VOO by
                  Telenet and/or Orange cannot be ruled out either. Both Telenet and Orange have
                  already publicly shown their interest in such a takeover.

          19.     The market for telecommunications services is characterised by an increasing
                  convergence. The end user purchases more and more different
                  telecommunications services within the co-called multi-play offers or 'packs' 9. This
                  increases the popularity of multi-play products with mobile components. In 2017,
                  "quadruple-play offers" (broadband, television, fixed telephony and mobile
                  services) represented 29% of service sales, versus only 4% in 2012.

9 Bundled products combining mobile products are sold together with other telecom products (broadband Internet, television
and/or fixed telephony) by the same operator.

                                                            8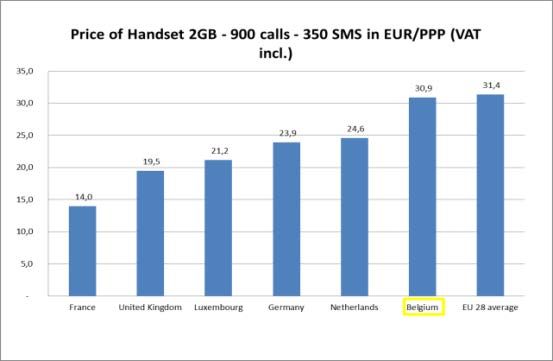
Figure 2: share of fixed broadband subscribers with broadband in a bundle (source: BIPT)

20.    However, it should be noted that, despite this increasing trend towards bundled
       offers, mobile telephony is still largely purchased alone: 71% of clients purchase
       mobile telephony separately. Concerning other telecommunications products, such
       as broadband Internet and broadcasting services, for example, the trend towards
       bundled offers is further developed, as shown in the figure below. This means that
       the evolution towards bundled products is only just beginning, concerning
       telephony, and that it will further develop in coming years.

      Figure 3: share of clients for bundled and separate services among the total number of
                         clients for various telecom services (source: BIPT)

21.    The volume of SIM cards sold in a bundle with a fixed service grew by 36.4% in
       2017, from 1,614,706 clients to 2,202,673 clients. The major part of the net growth

                                           9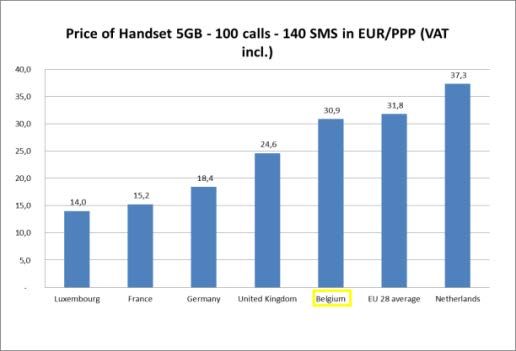
of around 588,000 was realised by BASE/Telenet (58%). Orange's share of the net
               growth was 30% and Proximus grew by 12%.

       22.     That means that Telenet achieved the biggest increase for these products,
               increasing its market share for bundles with a mobile component by 8 percentage
               points to 19%. Thanks to its entry in the fixed markets for broadband Internet and
               broadcasting 10, Orange achieved a market share of 8%.

             Figure 4: share in the volume of residential bundles combining fixed and mobile services
                   (2-play, 3-play and 4-play bundles with a mobile component) (source: BIPT)

       23.     This increasing popularity of multi-play offers among end users is making it
               necessary for mobile operators to offer bundled products in order to remain
               competitive in the mobile market. To illustrate this, Annex 3 contains a few
               examples of commercial strategies making it more difficult for operators offering
               only mobile products (mobile-only players) to compete in the end user market for
               mobile telephony.

10 Orange provides these fixed products via the regulated offer on Telenet's network; see also section
“3.1.2 Market regulation in the related wholesale markets”.

                                                  10
24. Getting access to the associated fixed networks is therefore essential to mobile
players. Only Proximus and cable operators Telenet and VOO 11 have a fixed
network at their disposal. Without regulation of these networks for fixed products,
it is likely that a mobile operator who has no fixed network will no longer be able
to offer combinations of fixed and mobile products. The existing and future
regulation of these associated fixed wholesale markets is therefore extremely
relevant for competitiveness on the mobile market. It will be further discussed in
section “3.1.2 Market regulation in the related wholesale markets”.
1.1.1 Conclusion market shares and convergence
25. The mobile market is characterised by competition through infrastructure
between three mobile operators. The Belgian mobile market is therefore not
characterised by significant competition problems. Up till now, the MNOs have
made commercial access agreements with the MVNOs.
26. There is however a consolidation movement going on. The merger between
Telenet and BASE has meant the disappearance of an important full MVNO, which
represented between 8% and 10% of the market, and which had made the market
more dynamic with its entry.
27. In addition, the mobile telephony market is characterised by a rising convergence,
in which mobile telephony is increasingly purchased in a bundled offer, together
with broadband Internet, fixed telephony and/or broadcasting products. Access for
mobile operators to the associated fixed networks (whereby only Proxiums and
cable operators Telenet and VOO have a fixed network at their disposal) is
therefore necessary if mobile operators are to remain competitive in the mobile
market.
1.2 Churn and ARPU
28. The churn observed, the percentage of the average number of disconnected SIM
cards, amounted to 18.4% of the average number of SIM cards in 2017 12. This is a
11 VOO is the brand under which network operators Nethys and Brutélé market broadband Internet and broadcasting products.
VOO also acts as an MVNO, over Orange's mobile network. In 2019, this mobile product will be provided over Telenet's mobile
network.
12 The mobile churn rate is calculated as the percentage of the number of SIM cards disconnected from the mobile network annually,
compared to the average number of active SIM cards for the same period.
11slight rise compared to 2017 13. This churn is significantly higher than that of
broadband Internet services (8.5% in 2016) 14 and of multi-play offers. 15 The
higher churn can be explained by lower switching costs for mobile telephony. For
example, when switching broadband Internet services, a change of modem is
needed.
30,0%
25,0%
20,0%
15,0%
10,0%
5,0%
19,3%
16,7%
17,7%
18,4%
0,0%
2014 2015 2016 2017
Figure 5: churn rate SIM cards (source: BIPT)
Figure 6: churn comparison between European operators (source:
Tefficient – March 2017)
13 It is worth noting that both prepaid (subject to stronger fluctuations) and postpaid SIM cards are included in this calculation.
14 Source: operators data, BIPT
15 An average of 12% of the households that purchased unbundled services cancelled these services in 2016. The frequency with
which 2-play households cancel services is, with 11%, lower than for the households that purchased unbundled services. Regarding
triple-play and quadruple-play, the churn rate is the lowest, at 8% and 5% respectively.
1229. The average yield per client from mobile retail services, the mobile ARPU, has
remained relatively stable in recent years. It slightly rose , from 17.4 to 17.7 euros
per month for Proximus and Telenet/BASE in 2017, due to an increase in use.
Figure 7: mobile retail ARPU per month, not including interconnection (source: BIPT)
30. A report drafted by BEREC 16reveals that the ARPU in the Belgian mobile market is
higher than the European average (by a little more than 3 euros), in line with that
of the Netherlands and between that of Germany (lower ARPU) and France (higher
ARPU). The figures below show that there is no clear-cut connection between the
level of the ARPU in a market and the number of mobile operators in that market.
16 International Roaming BEREC Benchmark Data Report April 2017 - September 2017
13Figure 8: comparison mobile ARPU in EU (source: BEREC)
31. The average yield per user has remained stable in recent years and is in line with
that of our neighbouring countries, despite the presence of a fourth operator in the
Netherlands and France. It is important to mention that not only the price effect,
but also the volume effect, is relevant to the level of the ARPU.
Figure 9: ARPU evolution in Belgium, France and the Netherlands (source: European Commission)
1.2.1 Conclusion Churn and ARPU
32. The churn for mobile telephony is greater than for other telecommunications
services such as broadband Internet and bundled products. This is an indication
that mobile clients switch providers more easily. The higher churn can be
explained by lower switching costs.
1433. The average yield per user has remained stable in recent years and is in line with
our neighbouring countries.
1.3 Price evolution on the mobile market and international price comparison
1.3.1 Price evolution in Belgium
34. Prices of mobile telephony services in Belgium have been showing a downward
trend for many years and across all profiles, as illustrated in the graph below (-
16% compared to Jan. '14) 17. This is in contrast to the price evolution of the fixed
products, in which the price rise is significantly to substantially higher than the
evolution of the general consumer price index. However, prices of mobile
telephony services stabilised in the period from mid-2015 to mid-2017.
Evolution consumption price index vs telecom prices
January 2014 = 100
130,00
Consumption Price Index General
Telefoon-en faxdiensten
125,00
Fixed telephony
Mobile telefphony
120,00 Internet
Telecommunication packs
115,00
110,00
105,00
100,00
95,00
90,00
85,00
80,00
Figure 10: price evolution in telecom compared to the consumer price index (source: FPS
Economy, Price observatory)
17 Since 2006, prices of mobile services in Belgium have fallen by roughly 60%.
1535. In the period from January 2014 to May 2018, prices in the Netherlands and
Germany fell by 45% and 6% respectively 18. The current price level in France is
more or less the same as it was in 2014. However, since 2012, the year in which a
fourth mobile operator entered the market, the price level in France has fallen by
27%. The biggest fall was in 2013, compared to 2012.
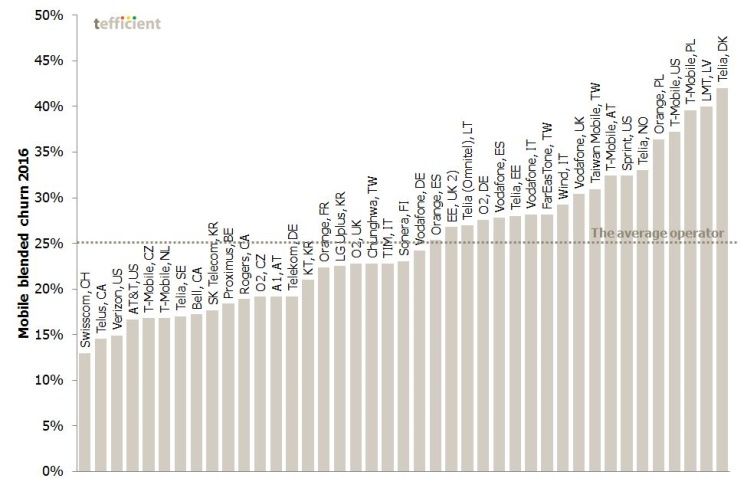
36. Based on BIPT's international price comparison study (see below), it is reasonable
to conclude that the prices of profiles with a data component of 1 or 2 GB are
characterised by a downward trend in Belgium and the neighbouring countries.
The costs linked to a profile with a usage of 1 GB data have fallen more
significantly in Belgium since 2012 than in neighbouring countries. Compared to
2016, the Belgian prices for the profile in question have however risen again by
19%.
37. The costs of a profile including a usage of 2 GB data have fallen less significantly in
comparison (certainly compared to the situation in Germany), which has led to a
deterioration of our country's position. Belgium's ranking has consequently fallen
from the penultimate position in 2016 to the last position in 2018 19.
18. Source: Eurostat. The method used to calculate the index figures varies from one country to another. Since 2014 in Belgium, for
mobile telephony, the most consumed products per profile and per provider are considered. The actual client numbers and
migration percentages from old to new tariffs are also used in Belgium. This means that the method used in Belgium is more in line
with the consumer's actual expenditure.
In the Netherlands, only the tariffs of new, still to be taken out, subscriptions are monitored, whereby the cheapest rate is
considered, in principle (taking into account the duration of the contract). In France too, the cheapest rate per profile and per client
is monitored. In these neighbouring countries, it is assumed that the consumer will immediately switch to cheaper tariff plans. The
fall in Germany is measured against the year 2015, since there are no records for that country from before that time.
19 It is worth noting that this study does not take into account any offers serving a restricted client base, which could be less
expensive. However, their extremely limited market share makes their effect on the general price level negligible.
16300 min., unl. SMS, 1 GB data 300 min., unl. SMS, 1 GB data
70 € Price evolution (2012 = 100)
110
Weighted average price (EUR PPP)
60 €
100
50 € 90
BE
BE
80
40 € NL
70 NL
30 € FR
60 FR
DE
20 € 50 DE
UK 40 UK
10 €
30
0€ 20
2012 2013 2014 2015 2016 2018 2012 2013 2014 2015 2016 2018
400 min., unl. SMS, 2 GB data 400 min., unl. SMS, 2 GB data
70 € Price evolution (2014=100)
Weighted average price (EUR PPP)
110
60 €
100
50 €
BE 90 BE
40 € NL
80 NL
30 € FR
70 FR
DE
20 € DE
60
UK UK
10 € 50
0€ 40
2014 2015 2016 2018 2014 2015 2016 2018
Figure 11: mobile offers compared by profile to neighbouring countries (source: BIPT
benchmark price study - data June 2018)
1.3.2 International price comparison
38. A benchmark study, in which the BIPT compares Belgian postpaid tariffs with
those of neighbouring countries 20 reveals that as far as 'light profiles'
(characterised by no or very low data use) are concerned, Belgium is in third or
fourth place in the group of six countries that were the subject of the analysis.
Belgium is the second most expensive country when it comes to the very lightest
profile.
39. Concerning the heaviest profiles, with a data component of 2 GB and 10 GB (which
has only been included in the analysis since 2018), Belgium is at the last and
penultimate position in the ranking, as illustrated in the graph below. For the
profile with a data component of 1 GB, Belgium joins the Netherlands and Germany
in the group of countries in which the price is significantly higher than in the other
20 Data collected in June 2018. Results calculated according to the method used in the BIPT's benchmark price study as applied in
the period 2012-2016.
17two frontrunners. Belgium is the penultimate country for this profile. The prices
per country in the BIPT comparison are based on the average of each operator's
cheapest tariff plan, weighed according to their market share. A PPP 21correction
was then applied. The figures below show the results per country for each profile.
Mobile telephony Postpaid Mobile telephony Postpaid
60 min. calls, 50 SMS 120 min. calls, 100 SMS
€25 € 25 € 22,59
€ 19,76
Weighted monthly cost
€20
Weighted monthly cost
€ 20
€ 15,43 € 15,91
€15 € 13,63
€ 11,43 € 12,36 € 15 € 12,36
€ 11,35
€10 € 8,25 € 8,37
€ 10 € 8,25
€5
€5
€-
FR LU NL UK BE DE €0
FR LU UK BE NL DE
Country
Country
Mobile telephony Postpaid Mobile telephony Postpaid
100 min. calls, 100 SMS, 50 MB data 120 min. calls, 200 SMS, 200 MB data
€25 €25 € 23,59
€ 22,59 € 22,59
€20 €20 € 18,59
Weighted monthly cost
Weighted monthly cost
€ 16,76
€ 15,43
€ 14,27
€15 €15
€ 12,36 € 12,36
€ 11,35 € 11,35
€ 10,34
€10 €10
€5 €5
€- €-
FR LU UK BE NL DE LU UK BE FR DE NL
Country Country
Mobile telephony Postpaid Mobile telephony Postpaid
300 min. calls, unl. SMS, 1 GB data 400 min. calls, unl. SMS, 2 GB data
€ 30 €35 € 32,34 € 32,73
€ 26,61
Weighted monthly cost (EUR PPP)
€ 29,67
Weighted monthly cost (EUR PPP)
€ 24,75 € 24,93
€ 25 € 23,78 €30
€25 € 23,78
€ 20
€ 16,28
€20 € 17,96
€ 15 € 14,94
€ 11,35 €15
€ 10
€10
€5 €5
€0 €-
LU UK FR DE BE NL LU UK FR NL DE BE
Country Country
21 Purchasing Power Party, a benchmark which compares purchasing power between countries.
18Mobile telephony Postpaid
300 min. calls, unl. SMS, 10 GB data
€70
Weighted monthly cost (EUR PPP) € 63,12
€60
€50
€ 42,80
€40 € 34,48
€30 € 25,56
€ 22,01
€20 € 13,89
€10
€-
LU UK FR NL BE DE
Country
Figure 12: price comparisons with neighbouring countries in the mobile market (source:
BIPT)
40. The "Mobile Broadband Prices in Europe 2017" study, based on data collected in
February 2017 and commissioned by the European Commission, shows that as far
as mobile telephony with a data component is concerned, Belgium is significantly
cheaper than the EU-28 average for the two lightest profiles with data components
of 100 and 500 MB. For baskets with a data component of 1 to 2 GB, the price level
in our country is roughly the EU-28 average. This study takes only into account the
cheapest offers in the market and only from the 3 main network operators.
41. The table below gives an overview of the selected Belgian offers as compared to
the EU-28 average. Since this study compares only the cheapest offers per country
in a certain cluster, it is less representative of the market as a whole. This can be
seen in the figure below, in which not a single offer by Proximus appears, even
though this operator has the largest market share. The result of the study is a
snapshot, based on tariff plans that were in place in the first quarter of 2017. Since
then, new products are available in the fast-evolving mobile market which contain
larger, or unlimited, data components.
Figure 13: selected offers from data set for Belgium in comparison to the EU-28 average in
2017 (source: European Commission)
1942. The numbers below can also be derived from the study commissioned by the
European Commission. It shows Belgium's position compared to neighbouring
countries. Regarding the heavier profiles, Belgium positions itself as being
relatively expensive compared to those same countries.
Figure 14: selected offers from data set for Belgium in comparison to the EU-28 average
in 2017 (source: European Commission).
2043. The OECD also carried out an international benchmark price study concerning
mobile telephony and Internet 22. Belgium was ranked most expensive for all three
profiles studied (low, medium and high). It should be noted that the three profiles
contained an extremely heavy telephony component, bearing in mind that multiple
minutes are charged per call (between 2 and 8 minutes, depending on the
destination). The absolute amounts can therefore be higher per country than in
other studies. This OECD price comparison is further discussed in Annex 6.
44. Despite a fall in unit prices for data in recent years, Belgium is still lagging in the
field of offers with high data allowances. It is therefore hardly surprising to see
that the price per gigabyte (price/GB) in Belgium is one of the highest in the
European Union.
45. This does mean that the Belgian mobile operators still have enough room for
growth towards offers of 'unlimited data' and have the opportunity to compete in
this area with other operators. The Dutch telecom regulator ACM confirmed in
early 2018 that offers of unlimited data seem to strengthen competition in the
mobile sector, and also that the growth of mobile data use in the Netherlands is
speeding up 23.
1.3.3 Conclusion of the price analysis
46. In general, prices of mobile telephony services have been showing a downward
trend in Belgium for years now, as they have in many other European markets.
Despite this downward trend in prices, Belgian prices are not always low in an
international context, not least where consumption profiles containing a heavy
data component are concerned. There is certainly room for Belgian operators to
grow towards offers with a very heavy data component or 'unlimited data'.
47. However, based on the BIPT study, it appears that Belgium is positioned as
average to rather expensive, compared to neighbouring countries as far as the
lighter profiles are concerned (those with no, or a relatively limited data
component). Concerning the heaviest profiles with a data component of 2 GB and
22 OECD (Organisation for Economic Cooperation and Development), Mobile broadband basket
http://www.OECD.org/sti/broadband/broadband-statistics/. For Belgium, these consist solely of the tariff plans of Proximus and
Orange, which makes the result less representative compared to the BIPT and EU studies.
23 https://www.acm.nl/en/publications/accelerated-growth-mobile-data-consumption-unlimited-data-plans
2110 GB, Belgium occupies the last and penultimate position in the rankings of the
six benchmark countries (closely followed by Germany). In the context of this
study, the results were determined on the basis of the average of the cheapest
tariff plan of each operator, weighed according to their market share, what aids
representativeness. The conclusion of this BIPT study, regarding prices, has the
biggest influence on the manner prices should be evaluated.
48. The "Mobile Broadband Prices in Europe 2017" study determined in a broader
European context that Belgium comes out as cheap in the lightest profile
category. Concerning the consumption baskets for mobile telephony with a data
component of 1 to 5 GB, our country positions itself around the EU-28 average.
This study takes only the cheapest offer of the market, per country, into account. It
can also be deduced from this report that Belgium, concerning heavier profiles,
positions itself as being relatively expensive compared to the neighbouring
countries.
49. Belgium was ranked most expensive for all three profiles studied (low, medium
and high) in the OECD study. It took account of only the tariff plans of the two
largest operators in each country.
1.4 Qualitative aspects
1.4.1 Coverage
50. Concerning LTE 24 coverage, Belgium scores excellently with a third place.
Although Belgium dangled around the middle group until not so long ago, it has
risen in just a few years to be one of the frontrunners in Europe.
24 Long Term Evolution, the fourth generation of mobile Internet.
22Figure 15: 4G mobile coverage per country (source: European Commission, Digital Agenda
Scoreboard, key indicators)
51. Combined with three strong results in terms of percentage of fast to very fast
connections, on the basis of the fixed networks, this good 4G coverage puts
Belgium in third place in Europe concerning the "connectivity" aspect of the DESI.
52. In recent years, the operators have made substantial investments, stimulated
partly by the transparency measures carried out by the regulator regarding the
quality of the networks and partly by the effective spectrum management, in
particular the management of the 800 MHz band. For example, Telenet was obliged
to catch up in the last two years, after BASE had put investments low on the agenda
for some years.
1.4.2 Speed and quality
53. The three Belgian mobile operators are calling upon the Commsquare company to
carry out tests along the road, to compare the quality of client experience with
their networks. Among the quality indicators measured are the percentage of
uninterrupted calls, the average download speed, the average transmission speed
and the percentage of streaming videos that can be watched without interruption.
2354. The graphs in Annex 5 illustrate the experienced quality with the three Belgian
operators, compared to that established in the French market, where there are
four mobile operators 25. These studies of the experienced quality in Belgium
showed a high level of quality. Unlike France, the regulator in Belgium has not yet
carried out these studies. Nevertheless, the three operators are calling upon the
same company and the regulator will organise a measurement campaign along the
road, aided by this company around September 2018.
55. The results are confirmed by a study carried out by OpenSignal 26, which identified
Belgium as a country with both good download speed and good coverage,
compared to other EU Member States. The same OpenSignal study shows in the
graph below that the latency on Belgian G4 networks is lower than in other
Member States. The lower the latency (the speed of response to setting up a
connection), the better the network. This will become even more important in the
future, with the rolling out of 5G networks (see section "2.2 Future technological
evolution of 5G").
Figure 16: 4G quality in Belgium (source: OpenSignal)
25 Given that the tests are being carried out by two different companies, a complete comparability of the indicators must be ruled
out. Nevertheless, the definition of the indicators is the same for both countries. Source for Belgium: Commsquare, 2018. Source for
France: Arcep, Les mesures de 4GMark, 2018.
26 https://opensignal.com/reports/2017/02/global-state-of-the-mobile-network
2456. Belgium has managed to fall behind somewhat regarding mobile broadband
Internet access compared to the other EU Member States. However, the figures
from 2017 clearly show that Belgium has now closed that gap. That is particularly
the case concerning the coverage of the 4G networks, for which Belgium now holds
the third place in the European benchmark. Based on these figures on the
experienced quality, and in combination with the figures on coverage at present,
we can conclude that Belgium currently has 4G networks that offer its inhabitants
Internet access which is experienced as being of a high quality, more or less
throughout the entire territory. The comparison above shows that the quality is
better than the one experienced by the French consumer.
57. Belgium is still lagging behind in terms of subscriptions to mobile broadband,
although they did increase by 10% between 2006 and 2017. In addition to price
per GB and availability of Wi-Fi, which are both greater in Belgium, these lower
mobile broadband sales can be partly explained by the relatively lower numbers of
smartphones users in Belgium (75%) compared to other European countries
(European average: 80%).
58. Lastly, the 2017 survey shows that concerning the consumer's perception of the
Belgian electronic communications market, 67% is satisfied with the tariffs offered
by their mobile operator and 80% is reasonably to very satisfied with the quality of
the service. Nevertheless, the average scores in 2017 are slightly lower than those
of 2016.
1.4.3 Take-up
59. Remarkably, since 2018, Belgium has continued to lag behind the rest of the EU
when it comes to the take-up of mobile Internet. The most recent numbers from
2017 show that subscriptions including mobile Internet represent 72% of the total
registrations, whereas in France and The Netherlands it amounts to 88%.
25Figure 17: take-up of mobile broadband (source: European Commission)
60. It should be noted that the take-up of mobile broadband has increased by 10% in
Belgium since 2017, as opposed to 4% at a European level. This means that
Belgium can catch up.
1.4.4 Consumption
61. In the table below, we can see that the average Belgian had a mobile data
consumption of 0.73 GB in the third trimester of 2017. This is significantly less
than the European average (2.31 GB) 27.
27 International Roaming BEREC Benchmark data report April 2017 - September 18 (BoR (18) 31)
26Figure 18: comparison of data consumption EU (source: BEREC)
62. This can be partly explained by the fact that Wi-Fi networks are available
throughout almost all of our country, due to the extremely good coverage of fixed
Internet and because the prices for mobile data are rather high for large users (see
section "1.3 Price evolution on the mobile market"). This encourages users to use
Wi-Fi connections instead of mobile data.
63. That extensive Wi-Fi coverage may also partly explain why Belgium may never be
a frontrunner in mobile data consumption. The Netherlands, for example, where
there is also an excellent Wi-Fi coverage, is similarly placed in this ranking. This
situation is in contrast to that in a country like Finland, where only 75.1% of
households have access to 30 Mbps (as opposed to 99% in Belgium), where much
less time is spent on Wi-Fi networks and where the consumption of mobile data is
higher (see figure 17 above). Large cities in Finland may have good Wi-Fi coverage
but that is not at all the case in more rural areas where only 8.3% of households
have access to an NGA network (as opposed to 91.5% in Belgium). It is therefore
best not to put Belgium's position with regard to average consumption of mobile
data first as a stand-alone objective. Neither can the consumption of Wi-Fi be
found in the ARPU figures, since the use of Wi-Fi is mostly free.
64. We do however see that there is a positive link between the use of Wi-Fi and the
price level. This means that the price per MB is probably higher in the countries
where a lot of Wi-Fi is used, such as Belgium, the Netherlands and Germany.
27Figure 19: international comparison of revenue per MB (left) and Wi-Fi use (right) (source:
OpenSignal)
1.4.5 Conclusion qualitative aspects
65. Belgium may have fallen behind in terms of coverage of the networks facilitating
access to mobile broadband between 2010 and 2016, but the figures for 2017
show that Belgium has now caught up. That is particularly the case concerning the
coverage of the 4G networks, for which Belgium now holds the third place in the
European benchmark. The figures show that Belgium currently has at its disposal
4G networks which make Internet access possible across more or less the entire
territory, and with a very good quality of client experience.
66. Moreover, studies show that the quality of client experience with mobile networks
in high in Belgium. The download speed in Belgium is estimated at 43 Mbps on
average, and an estimated 98% of video streaming is launched without
interruption. Moreover, the level of quality established in Belgium is higher than in
the French market 28, which has four mobile operators.
28 An important difference with the situation in France is also that, apart from there being 4 players in the market, the average
monthly volume of downloads is significantly higher than in Belgium.
2867. In 2017, 72% of the population had subscribed to mobile Internet, which is a lower
percentage than in other Member States. The take-up of mobile broadband
however rose in Belgium by 10% in 2017, as opposed to 4% at a European level.
This would suggest that Belgium can catch up, even if the excellent finely-meshed
Wi-Fi network in Belgium continues to take up part of the volume of consumption.
Measures need to be taken to further stimulate the obstacle-free take-up of this
service. That might mean measures regarding the supply, such as an expansion of
the data included and a reduction in the prices, together with measures regarding
the demand, such as raising awareness in the population about the benefits of
mobile Internet. It should be noted that the latter measures have had merely a
marginal impact on usage up till now.
292. SPECTRUM
2.1 Introduction concerning spectrum use
68. Mobile operators use a number of frequency bands. Not all frequency bands have
the same propagation characteristics. The lower the bands, the better the
propagation of the waves and the greater the zone a transmission site can cover.
69. The low bands (below 1000 MHz) are used to realise a coverage of the entire
territory. The high bands (above 1000 MHz) are mostly only used where additional
capacity is needed.
70. It is therefore important for a mobile operator to have frequencies in both the low
and the high bands at their disposal.
71. The figure below shows the current distribution of the spectrum among the 3
existing operators. A historic summary of allocated licences can be found in Annex
1.
800 Proximus Orange Telenet/Base
MHz 2 x 10 MHz 2 x 10 MHz 2 x 10 MHz Until 2033
900 Proximus Orange Telenet/Base
MHz 2 x 12,4 MHz 2 x 11,6 MHz 2 x 10,2 MHz Until 2021
1800 Proximus Orange Telenet/Base
MHz 2 x 25 MHz 2 x 25 MHz 2 x 25 MHz Until 2021
2000 Proximus Orange Telenet/Base AVAILABLE
MHz 2 x 15 MHz 2 x 14,8 MHz 2 x 14,8 MHz 2 x 14,8 MHz Until 2021
2600 Proximus Orange Telenet/Base AVAILABLE
MHz 2 x 20 MHz 2 x 20 MHz 2 x 15 MHz 2 x 15 MHz Until 2027
Figure 20: summary of the current user rights (source: BIPT)
3072. Spectrum is still available in the 2000 and 2600 MHz bands. Very little use is made
in Belgium of the 2600 MHz band, even the part allocated to the mobile operators.
Therefore, the arrival of a fourth operator does not have to cause problems
regarding the availability of sufficient spectrum above 1 GHz 29 (see below).
73. The table below shows which technologies are being rolled out in which bands.
Technology Bands used for coverage Bands used for capacity
2G 900 MHz 1800 MHz
3G 900 MHz 2000 MHz
800 MHz 1800 MHz
4G 2000 MHz
2600 MHz
Figure 21: technology per band (source: BIPT)
74. It should be noted that 2G and 3G technologies will disappear in time 30. The 900
MHz band can then be used for 4G and 5G. In the Netherlands, for example,
Vodafone has announced the end of its 3G network by January 2020.
75. It should also be noted that a fourth player would not roll out a priori 2G and 3G
networks. However, a fourth player would a priori be obliged to roll out a 4G and a
5G network.
76. Regarding the licence situation of each band, the following distinctions should be
made:
• Ongoing licences:
o 800 MHz (30 MHz duplex 31 for the three MNOs) till 2033;
o 2600 MHz (55 MHz duplex for the three MNOs) till 2027.
29 1 GHz = 1000 MHz.
30 There is at present no consensus about when 2G and 3G will disappear. 3G will most likely disappear before 2G.
31 1 MHz duplex is equal to 2 x 1 MHz. Paired spectrum is used for the FDD modus (Frequency Division Duplex); one band for the
downlink and one band for the uplink.
31• Bands that will be auctioned again until 2041:
o 900 MHz (35 MHz duplex);
o 1800 MHz (75 MHz duplex);
o 2000 MHz (60 MHz duplex).
• New bands for 20 years:
o 700 MHz (30 MHz duplex);
o 1400 MHz (90 MHz SDL 32);
o 3600 MHz (400 MHz TDD 33).
77. Citymesh and Gridmax are the only operators who have been allocated a band in
the 3600 MHz band. This refers to the 40 MHz which is applicable in some
municipalities.
2.2 Future technological evolution of 5G
78. 5G is the extension of earlier standards for mobile technology, such as 3G, LTE 34
(4G), LTE advanced (4G+) and 4.5G. 5G can also be said to be a trend breaker 35.
This technology is not merely a continuation of earlier standards, it can make
possible new kinds of mobile data use that were previously impossible.
79. This technology ensures not only more performing and broadband speech and
data connections, it can also digitise and interconnect various economic and social
sectors 36. 5G technology will therefore bring us heterogeneous solutions. This
could be important in the event of a new player entering the market. It will enable
new players to develop innovative and differentiated products not yet present on
the market.
32 An SDL band (Supplementary Downlink) is a non-paired band, combined with a paired band, for additional downstream capacity.
33 Non-paired bands are used for TDD modus (Time Division Duplex); the same band for both the downlink and the uplink.
34 Long Term Evolution.
35 5G will be standardised on an international level by the ITU and 3GPP. In principle, the 3GPPP will work out the technical norms
which answer the objectives established by the ITU. In Europe, the CEPT should be mentioned, since it has also established a
roadmap for 5G. The European Commission is also very involved and has developed a 5G Action Plan.
36 In the context of 5G, these sectors are referred to as "verticals". This applies to the automotive industry, security services, the
energy sector, healthcare sector, the media, etc.
3280. A study by Arthur D. Little 37 emphasises these new possibilities offered by the roll-
out of 5G. That will be in relation to new use cases/business models:
“The potential for success is also high – driven not just by possible differentiation and
market share gains, but also by rolling out successful use cases and being pioneers and
trusted partners in the building of new ecosystems.
We expect 5G to support the strategic shift of telecom operators from being predominantly
providers of high-speed connectivity, to becoming true enablers of next-generation
ecosystems. Some telecom operators are taking a strategic lead in 5G deployment –
announcing their future plans with “big bets”, which will impact the course of future 5G
roll-out and the development path for the technology.”
81. The study illustrates how operators can develop differentiated and innovative
products thanks to 5G technology, each with their own business model and specific
target group. The figure below shows a few examples of existing roll-out
possibilities.
Figure 22: the possibilities of 5G technology for differentiated mobile products (source:
Arthur D. Little)
37 Arthur D. Little: 5G deployment models are crystallizing, Opportunities for telecom operators to facilitate new business
ecosystems – June 2017.
3382. The development of 5G standardisation is currently in full flow. In an opinion 38
adopted on 9 November 2016, the RSGP 39 considers that the 700 MHz, 3600 MHz
and 26 GHz bands are essential bands to introduce 5G in Europe and this before
2020. The RSPG believes that the 3400 - 3800 MHz band has the potential to give
Europe a vanguard role in the roll-out of 5G.
83. At an international level, 5G is being standardised by the ITU 40and 3GPP 41, a
consortium of high-tech companies. On 14 June, 3GPP defined the standard and
carried out an initial and successful interoperability test, reaching a downlink
speed over 1.3 Gbps 42. Finally, in Europe, the CEPT 43 and the European
Commission are collaborating on the development of a 5G action plan 44. All this
significantly speeds up the entry of 5G technology.
84. Eight KPIs (key performance indicators) were established to specify, quantify and
measure the features of the 5G systems. The figure below shows the anticipated
improvements, between 4G+ (IMT-advanced) and 5G (IMT-2020) for these eight
indicators.
38 RSPG (Radio Spectrum Policy Group) Opinion on spectrum related aspects for next-generation wireless systems (5G).
39 Advisory group on radio spectrum policy set up by the Commission Decision 2002/622/EC of 26 July 2002 establishing a Radio
Spectrum Policy Group.
40 International Telecommunication Union.
41 3rd Generation Partnership Project.
42 See the following website: https://www.computable.nl/artikel/achtergrond/technologie/6386701/5182002/eerste-standalone-
5g-nr-interoperabiliteitstest-slaagt.html
43 European Conference of Postal and Telecommunications Administrations
44 https://ec.europa.eu/digital-single-market/en/5g-europe-action-plan
34Figure 23: key performance indicators 5G (source: ITU IMT2000)
85. The eight indicators determine together the envelope of the maximum
performance of 5G. However, not a single usage demands that these extreme
values be simultaneously achieved for all indicators. That is the principle of
network slicing: each layer (slice) has its own envelope, which is a compromise of
the targeted usage. It enables an operator to provide services aimed at specific
users, based on a single network infrastructure 45.
86. For the consumer, 5G will therefore lead to significantly better mobile
communication, ultra-reliable networks for the Internet of Things and applications
for which a very low latency is important 46.
87. A more efficient use of the spectrum will allow the arrival of 5G technology to
partly absorb the possible competitive effects of the distribution of the available
spectrum among 4 operators. A new fourth MNO in the market could enable an
acceleration in the development and differentiation opportunities of these
technologies, and their maximum use.
45 network for emergency services, such as ASTRID, or the army where gsm-R can be implemented this way... Or gaming networks
(low latency) or hospital networks (medical assistance with highly-reliable connection and low latency), etc.
46 For example, self-driving cars, virtual reality applications, mobile gaming, etc.
352.3 Reserved spectrum
88. The entry of a new operator often goes hand in hand with "reserving" spectrum for
the newcomer. By reserving spectrum, the newcomer has the opportunity of being
the first to be able to purchase spectrum. Only after that do other (existing)
operators get the chance to bid on the remaining lots. Reserving spectrum for a
newcomer is essential in order to avoid existing operators locking down the
market by purchasing all the spectrum to prevent entry of a newcomer. On the
other hand, the reserved spectrum and the associated conditions for the newcomer
must maintain a level playing field (for example, enough available spectrum in all
bands relevant to traditional and future technologies) to allow them to compete
with the existing operators.
89. It should be noted that a fourth player must absolutely have a portfolio of at least 2
blocks of 5 MHz duplex under 1 GHz in order to be able to roll out 4G and 5G
networks across the entire territory.
90. Spectrum can also be reserved for existing players in order to guarantee a certain
stability and continuity in the market. In that sense, it was proposed to reserve
spectrum for the existing players in the bands for which they already have licences,
that is to say in the 900 MHz, 1800 MHz and 2000 MHz bands.
91. The table below gives a summary of the spectrum cap (maximum capacity an
operator may own) and the spectrum reserved in the absence of a fourth player.
Reserved spectrum
Frequency For each
Total capacity Spectrum cap For a
band existing
newcomer
operator
900 MHz 35 15 10 -
1800 MHz 75 30 20 -
2000 MHz 60 25 10 -
700 MHz 30 10 - -
1400 MHz 90 35 - -
3600 MHz 400 100
Figure 24: reserved spectrum in the absence of a fourth player (source: BIPT)
92. The table below gives an overview of the spectrum cap and the spectrum reserved
in the presence of a fourth player. This table indicates which spectrum should be
36You can also read