ENERGY SERVICES MARKET INTELLIGENCE REPORT - GreenCape
←
→
Page content transcription
If your browser does not render page correctly, please read the page content below
2021
ENERGY
SERVICES
MARKET

                  ENERGY SERVICES: MIR 2021
INTELLIGENCE
REPORT

                   1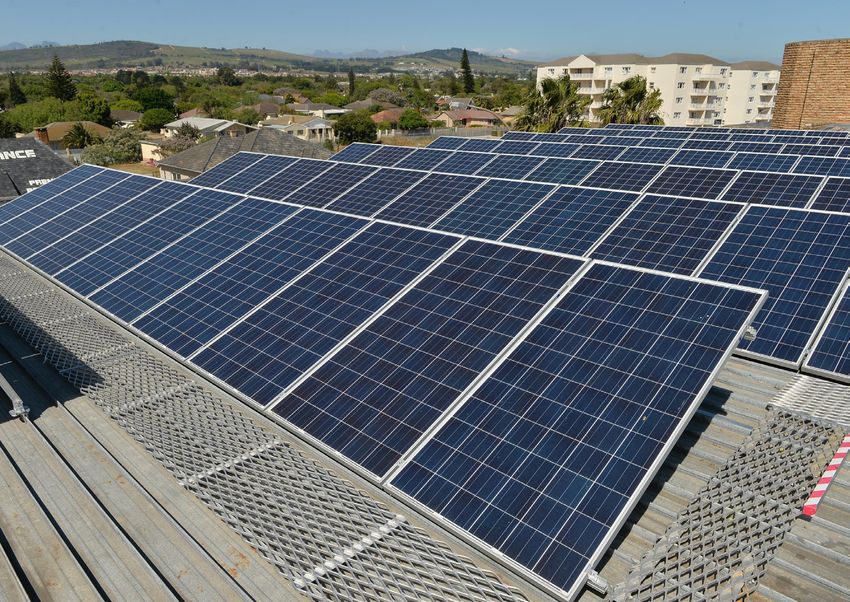
GreenCape
                GreenCape is a non-profit organisation that works at the interface of business, government,
                    and academia to identify and remove barriers to economically viable green economy
               infrastructure solutions. Working in developing countries, GreenCape catalyses the replication
                and large-scale uptake of these solutions to enable each country and its citizens to prosper.

                                                    Acknowledgements
       This market intelligence report was produced in partnership with the Western Cape Government Department of
    Economic Development and Tourism. We thank Argon Poorun (lead author), Jack Radmore, Bruce Raw, Reshmi Wolvers
         and Johan Strydom for the time and effort that they have put into compiling this market intelligence report.

                                                           Disclaimer
                        While every attempt has been made to ensure that the information published
                        in this report is accurate, no responsibility is accepted for any loss or damage
                      to any person or entity relying on any of the information contained in this report.

                                                Copyright © GreenCape 2021

                       This document may be downloaded at no charge from www.greencape.co.za.
                                                 All rights reserved.

                               Subscribe to receive e-mail alerts or GreenCape news, events,
                     and publications by registering as a member on our website: www.greencape.co.za

                                       Cover image courtesy of New Southern Energy

                         2nd Floor, North Wharf, 42 Hans Strijdom Ave, Foreshore, Cape Town, 8001

                                                                                                                                ENERGY SERVICES: MIR 2021
             Authors:                                            Argon Poorun and Jack Radmore
 Editorial and review:                                           Cilnette Pienaar, Jack Radmore.
		                                                               Lauren Basson and Nicholas Fordyce
              Images:                                            GreenCape, City of Cape Town, New Southern Energy, Solar MD,
		                                                               Pxhere and Nicholas Fordyce
  Layout and design:                                             Tamlin Lockhart

                                                                                                                                 i
CONTENTS
                                                                                                               Policy, legislation, and governance 35
                                                                                                               3.1. Governance 37
                                                                                                                    3.1.1. National government 37
                                                                                                                    3.1.2. Local government 37
                                                                                                                    3.1.3. Industry bodies 37
                                                                                                               3.2. Legislation and regulation 37
                                                                                                               3.3. Policy and white papers 39
                                                      Introduction and purpose 9

                              0                                                2
                                                      1                                                     3
                                                                               Sector overview 11
                                Executive summary 1
                                                                               2.1. International energy services market 14
                                What’s new? 7
                                                                               2.2. South African market context 14
                                                                                    2.2.1. South African electricity landscape 14
                                                                                    2.2.2. The development of the energy services market in South Africa 14
           2020 MIR 2021

                                                                               2.3. Energy Services market drivers 16
                                                                                    2.3.1. Rising electricity costs 16
                                                                                    2.3.2. Falling costs of renewable energy technologies 17
       SERVICES:

                                                                                    2.3.3. Supportive energy policies and regulations by the local and national government 19
                                                                                    2.3.4. Energy finance – facilitating the right type of finance into the sector 27
WATER: MIR

                                                                               2.4. Key players 28
ENERGY

                                                                               2.5. Energy Services market size 30
                                                                                    2.5.1. Small-scale embedded generation – rooftop solar photovoltaic (PV) market size 31
                                                                                    2.5.2. Energy storage market size 32
                                                                                    2.5.3. Energy efficiency market size 32
 03
 ii
Funding and incentives 55
                                  5.1. General funding opportunities 55
                                       5.1.1. Green Finance Database 55
                                       5.1.2. Government funding and incentives database 55
                                       5.1.3. Finfind database 56
                                       5.1.4. AlliedCrowds database 56

                                                                                                          GreenCape’s support to
                                                                                                          businesses and investors 61

4                                                              6                                                                        8
                                5                                                               7
                                                                       The Western Cape: Africa’s green
                                                                       economy hub 57

Emerging opportunities, drivers and barriers 41
4.1. Small-scale embedded generation 44
     4.1.1. C&I rooftop PV diversification 44
     4.1.2. Solar Power Purchase Agreements 45
     4.1.3. PV for energy resellers 46
     4.1.4. In-house capacity building 47
4.2. Battery energy storage 47
     4.2.1. Backup power and UPS 48
4.3. Energy efficiency 49
     4.3.1. Smart metering and demand-side management 50
     4.3.2. Aggregated interventions for commercial new builds and retrofits 51                                                         References 65
LIST OF FIGURES

                           Figure 1:    Energy Services interlinked market segments                                                                       13
                           Figure 2:    Global Energy Services Market Share                                                                               14
                           Figure 3:    Energy Services sector overview                                                                                   15
                           Figure 4:    Average Eskom tariff versus inflation (CPI) projected to 2022                                                     16
                           Figure 5:    Levelised cost of electricity (LCOE) per renewable energy technology in South Africa’s utility-scale programme,
                                        and Eskom average tariff trajectory 2010-2020 (Rand/kWh)                                                           18
                           Figure 6:    South African small scale solar PV price in 2018-2022                                                              18
                           Figure 7:    Uptake of SSEG processes in municipalities                                                                         21
                           Figure 8:    Western Cape municipalities allowing SSEG to connect to the grid                                                  25
                           Figure 9:    Western Cape municipal SSEG feed-in tariffs                                                                       26
                           Figure 10:   Western Cape municipal SSEG fixed tariff portion                                                                  26
                           Figure 11:   Energy Services market value chain                                                                                29
                           Figure 12:   Distribution of solar PV installations across end-user segments in South Africa                                    31
                           Figure 13:   ESCos market for energy efficiency in South Africa                                                                32
                           Figure 14:   Energy consumption in South Africa by source (TWh)                                                                33
                           Figure 15:   Energy consumption in South Africa by sector (TWh)                                                                34
                           Figure 16:   Behind-the-meter energy storage cost trajectory per technology 2014-24                                            48
                           Figure 17:   Number of energy efficiency projects by sector in South Africa                                                    49
                           Figure 18:   Average capital cost of energy efficiency projects in South Africa                                                50
ENERGY
 03
 iv        2020 MIR 2021
       SERVICES:
WATER: MIR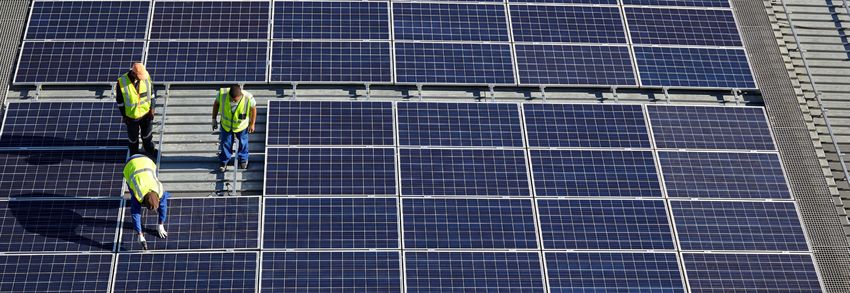
LIST OF TABLES

Table 1:    Eskom price increases 2010-2020                                                                                             17
Table 2:    South African solar PV price in 2020                                                                                       19
Table 3:    Provincial SSEG uptake summary                                                                                             22
Table 4:    List of municipalities allowing SSEG to connect to the grid                                                                23
Table 5:    Roles of key players in the Energy Services value chain                                                                    30
Table 6:    Total energy savings opportunities and capital leveraged for small and large businesses identified by the PSEE programme   33
Table 7:    Licensing and registration for different SSEG system sizes                                                                 38
Table 8:    Emerging Energy Services opportunities                                                                                     43
Table 9:    Barriers and drivers of the Candi rooftop PV diversification opportunity                                                   45
Table 10:   Barriers and drivers of the Solar PPAs opportunity                                                                         45
Table 11:   Barriers and drivers of the solar PV for energy resellers opportunity                                                      46
Table 12:   Barriers and drivers of the in-house capacity building opportunity                                                         47
Table 13:   Battery technology comparison                                                                                              48
Table 14:   Barriers and drivers of the energy storage opportunity                                                                     49
Table 15:   Barriers and drivers of the smart metering and demand-side management opportunity                                           51
Table 16:   Barriers and drivers of the aggregated commercial opportunity                                                              52

                                                                                                                                             ENERGY SERVICES: MIR 2021
                                                                                                                                              v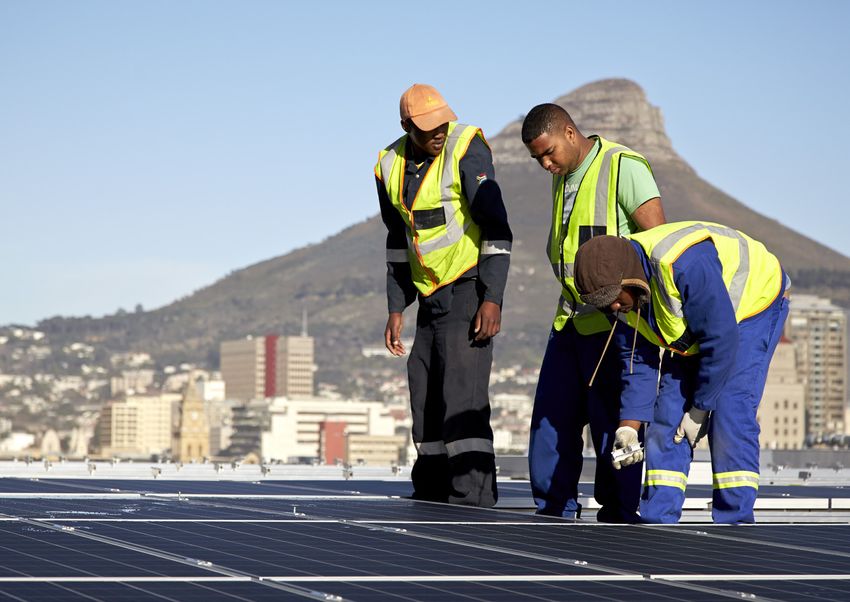
LIST OF ABBREVIATIONS AND ACRONYMS

                           AEEE    Alliance for an Energy-Efficient Economy                ESCo      Energy services company
                           BEE     Bureau of Energy Efficiency                             GOF       Green Outcomes Fund
                           BTM     Behind the meter                                        GW        Gigawatt
                           CAGR    Compound annual growth rate                             GWh       Gigawatt-hours
                           Candi   Commercial and industrial                               HVAC      Heating Ventilation and Cooling
                           Capex   Capital expenditure                                     IEA       International Energy Agency
                           CCT     City of Cape Town                                       IEP       Integrated Energy Plan
                           CMVP    Certified measurement and verification personnel        IFC       International Finance Corporation
                           CO2e    Carbon dioxide equivalent                               IPP       Independent Power Producer
                           COTS    Commercially available off-the-shelf                    IRENA     International Renewable Energy Agency
                           CPI     Consumer price index                                    IRP       Integrated Resource Plan
                           CSIR    Council for Scientific and Industrial Research          kW        kilowatt
                           CSP     Concentrated solar power                                kWh       kilowatt hours
                           DFI     Development Finance Institution                         kWp       kilowatt peak
                           DMRE    Department of Mineral Resources and Energy (National)   LCOE      Levelised cost of electricity
                           DoE     Department of Energy (National)                         MIR       Market Intelligence Report
                           DPE     Department of Public Enterprises                        Mt        Megatonnes
                           dti     Department of Trade and Industry                        MW        Megawatt
                           EAF     Energy availability factor                              MWh       Megawatt hours
                           EE      Energy efficiency                                       MWp       Megawatt peak
                           EEMS    Energy Efficient Monitoring System                      MYPD      Multi-year price determination
           2020 MIR 2021

                           EG      Embedded generation                                     NBI       National Business Initiative
                           EOI     Expression of interest                                  NCPC-SA   National Cleaner Production Centre South Africa
       SERVICES:

                           EPC     Engineering Procurement Construction                    NEES      National Energy Efficiency Strategy
                           EPCM    Engineering Procurement Construction Management         NERSA     National Energy Regulator of South Africa
WATER: MIR

                           ERA     Electricity Regulation Act                              O&M       Operation and maintenance
ENERGY

                           ES      Energy services                                         OEM       Original equipment manufacturer
                           ESC     Energy supply contracting                               PACE      Property Assessed Clean Energy
                           ESt     Energy storage                                          PAYS®     Pay As You Save®
 03
 vi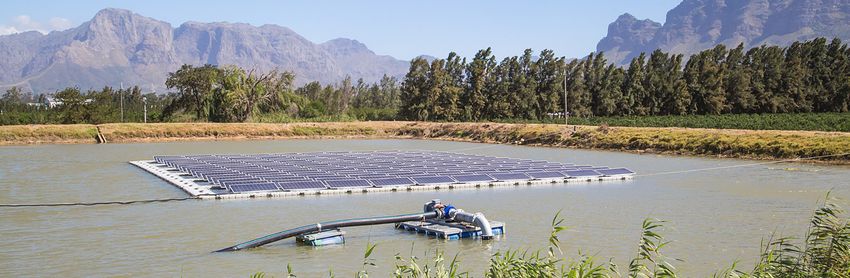
PPA        Power purchase agreement
PQRS       Power quality and renewable services
PSEE       Private sector energy efficiency
PV         Photovoltaic
RE         Renewable energy
REIPPPP    Renewable Energy Independent Power Producers
           Procurement Programme
RFP        Request for Proposal
SABIA      South African Biogas Industry Association
SAESA      South African Energy Storage Association
SALGA      South African Local Government Association
SANEDI     South African National Energy Development Institute
SAPVIA     South African Photovoltaic Industry Association
SASGI      South African Smart Grid Initiative
SAWEA      South African Wind Energy Association
SMEs       Small- and medium-sized enterprises
SMME       Small-, medium- and micro-sized enterprises
SONA       State of the Nation Address
SSEG       Small-scale embedded generation
StatsSA    Statistics South Africa
TOU        Time of use

                                                                 vii ENERGY SERVICES: MIR 2021
TWh        TerraWatt hour
UNIDO      United Nations Industrial Development Organization
UPS        Uninterruptable power supply

Exchange rates used: 1 US Dollar = R16.23 (October 2020)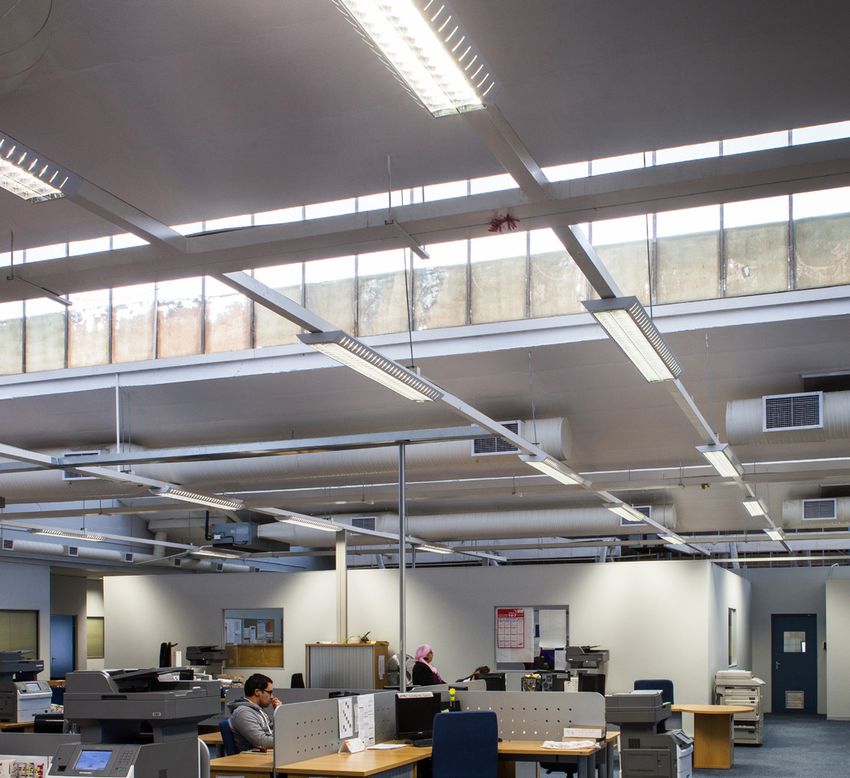
EXECUTIVE
                           SUMMARY

                           This market intelligence report is compiled for foreign direct and local investors that are looking to invest
                           directly in the South African green economy through project development, asset management, equity, debt,
                           equipment manufacturing, or support services. It highlights investment opportunities in embedded generation
                           and energy efficiency, created by South Africa’s diversifying energy services market.

                           The term ‘energy services’ is         There are five main factors           Despite the systemic shocks            It showed remarkable resilience
                           used to describe two key energy       driving growth in the energy          caused by the COVID-19 economic        with full development pipelines
                           market segments in the South          services market:                      lockdown, the well-established         holding the expected growth
                           African energy space, namely (i)                                            South African Energy Services          trajectory through 2020 close to
                           small-scale embedded generation       South Africa’s above-inflation        market continues to grow at            the saturation point of 500 MWp
                           (SSEG), which includes rooftop        electricity price rises; national     an increasing rate.                    annual installed capacity. As such,
                           solar photovoltaic (PV) systems       energy insecurity; decreasing                                                the market is still expected to
                           and energy storage, and (ii) energy   technology costs; supportive          The national embedded                  reach a total capacity of 7.5 GW by
           2020 MIR 2021

                           efficiency. These market segments     policies, regulations, and tariffs;   generation market for installations,   2035 at an estimated market value
                           are increasingly bolstered by         and well-adapted finance options,     operation and maintenance              of R75 billion.
       SERVICES:

                           offerings in the energy finance       have all played an important role     of rooftop solar PV has been
                           sector, which in and of themselves    in driving the growth of the energy   identified as an important part
WATER: MIR

                           also present opportunities to         services market.                      of the country’s immediate
ENERGY

                           financial investors.                                                         efforts towards energy security.
 103
This steady growth, which The flexibility of application Energy efficiency was the hardest Significant untapped potential
translates to the potential use-cases and the increasing hit by the economic shutdown still lies in this market for investors
creation of ~1 250 jobs, is relevance of load-shedding- period of the lockdown. Unlike the and businesses, as it serves as an
significant, considering the related risk will lead to an embedded generation segment, important, favourable option
national expanded unemployment increasingly prevalent role of the decreased demand appetite and going forward in optimising energy
level reaching 42.0%. in 2 storage segment in energy service access to stockpiled equipment led costs. The estimated market by
020. provision. The market is expected to a market contraction, with many 2035 is ~ R21 billion.
In 2020 the SA energy storage to rise to ~ R31 billion, with 6.5 GWh companies being forced to limit
market saw a surge in demand installed energy capacity by 2030. their workforce.
from the commercial and
agricultural sectors.
ENERGY SERVICES: MIR 2021
Solar PV installation
in Cape Town CBD.
©GreenCape
2Within the embedded There is significant opportunity This allows them to circumvent Within the energy efficiency
generation market segment, in partnering with engineering, contractual arrangements with market segment, there are
there are four emerging procurement and construction EPCs and reduce project costs. two emerging opportunities
opportunities for investors: companies (EPCs) to back the The growth potential of this for investors:
investment in meeting this demand. opportunity is highly attractive for
Rooftop PV model diversification early-funding partners who can Smart metering and demand-
for the commercial and industrial Solar PV for energy resellers: assist in backing such projects. side management: Development
(Candi) sectors: A strong business In traditional resale, property in smart metering technologies
case is driving increasing maturity, development owners (residential Within the energy storage market and increasing awareness of
concentration, and competition in estates or shopping malls, for segment, there is an emerging the opportunity to both reduce
the market. Hence, developers are example) can benefit from bulk opportunity for investors: commercial and residential
extending the types of offerings, electricity, discounted from electricity bills and improve
such as O&M-only contract rebuys municipalities. They can then sell Behind-the-meter (BTM) battery revenue collection result in
and system bundling. This provides it to their tenants at the retail storage: The need for energy growing penetration over standard
attractive, alternative access to rate instead of the potentially less independence and resilience, in prepaid meters in municipalities.
the market for new entrants and preferential individual unit tariffs. light of on-going load shedding, is
smaller players. Similarly, the property developer driving demand in back-up power Aggregated interventions for
can install a solar PV system, and uninterruptible power supply commercial new builds and
Solar power purchase agreements benefiting from a reduced power (UPS) applications, particularly retrofits: The end of the private
(PPAs): Although access to purchase agreement rate. They in commercial, industrial and sector energy efficiency (PSEE)
finance has improved with can then ‘on-sell’ the electricity agricultural applications programme in 2015, growth of
commercial banks having generated by the PV system where the opportunity costs of the rooftop PV market, and tight
developed dedicated solar to tenants at a rate equivalent energy insecurity are high. This margins against operational
portfolios and spesific financial to the higher residential or opportunity is still small due to the and contracting costs have led
mechansims, corporate and commercial tariff, depending on prohibitive high cost of batteries, to a decline in energy-efficiency
capital-constrained customers the development. though it is expected to grow market participation, despite this
2020 MIR 2021
are opting to transfer the significantly as lithium-ion battery being an attractive intervention
performance and investment risk In-house capacity building: prices continue to decrease over for consumers. However, there has
SERVICES:
onto the service provider, whilst Property development owners the next 5 to 10 years. been a resurgence in centralised
also ensuring a long-term fixed who have identified the significant solutions for medium to large
WATER: MIR
reduced tariff. potential for rooftop PV across commercial buildings, particularly
ENERGY
their available portfolio are in water heating, which presents
entering the market by developing the opportunity to aggregate
in-house delivery capacity. benefits and project return.
03
3ENERGY SERVICES: MIR 2021
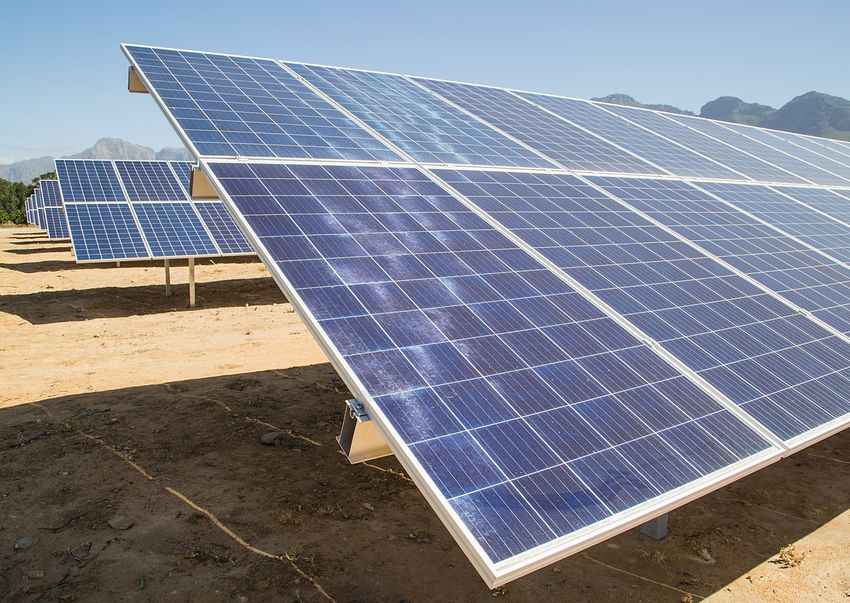
Ground mounted
solar PV installation
at Marlenique Estate.
©New Southern Energy
4SUMMARY OF MARKET OPPORTUNITIES
Opportunity Key drivers Requirement and barrier Expected Macro-environment
timeframe
Candi rooftop PV • Smaller rooftop PV projects are bundled • Competition can drive instances 1-5 years • Load shedding and security of supply
diversification together to reach a scale where they of cost-cutting and installations are major concerns
become attractive to larger investors of sub-par systems • Eskom and municipal electricity tariffs
• Renewal of O&M contracts after 2-5 • Regulatory uncertainty on the rise
years (project dependent)
• Enables international project developers
and investors to establish a footprint in
South Africa
Solar PPAs • Energy user does not need to raise • Offered at a premium in comparison 1-5 years • COVID-19 economic contraction has led
upfront capital to buy-own model to businesses being conservative with
• Long-term future energy cost stability • Complexity in negotiating PPA their balance sheets
• Transfer performance and maintenance contracts • Eskom and municipal electricity tariffs
risk to the installer on the rise
• Option to buy system can be negotiated
at a later stage
PV for energy • PPA financing • Regulatory uncertainty 5-10 years • 3-5 solar PV tenders per month
resellers • Wheeling frameworks are emerging • Lack of standardisation nationally in the last year — green
in PPA contracts building industry on the rise
• Reduction of carbon footprint
• Home-owners association approval • Eskom and municipal electricity tariffs
on the rise
• National energy insecurity
• The carbon tax bill currently in effect at
R120/tCO2 with increases scheduled from
2022 onwards
2020 MIR 2021
In-house • Easy access to commercial finance • Regulatory uncertainty 5-10 years • Increasing awareness of strong PV
capacity building • Access to a large portfolio of properties • Bridging the gap in technical expertise business case on medium to large
SERVICES:
and available roof space commercial properties
• Circumvent PPAs • Eskom and municipal electricity tariffs
WATER: MIR
on the rise
ENERGY
• The carbon tax bill currently in effect at
R120/tCO2 with increases scheduled from
2022 onwards
03
5Opportunity Key drivers Requirement and barrier Expected Macro-environment
timeframe
Behind the • Easy access to commericial finance • Regulatory uncertainty 5-10 years • Increasing awareness of strong PV
meter (BTM) • Access to a large portfolio of properties • Bridging the gap in technical expertise business case on medium to large
battery storage and available roof space commercial properties
– 1.5 GWh • Eskom and municipal electricity tariffs
• Circumvent PPAs
on the rise
• The carbon tax bill currently in effect
at R120/tCO2 with increases scheduled
from 2022 onwards
Smart metering • Complex time-of-use tariffs • Willingness to transition from standard 1-5 years • Utilities lose between 10 and 45%
and demand-side • Developments in technology for wider prepaid meters of revenue to tampering and copper
management accessibility and ease-of-use • Privacy concerns cable theft
• Standardisation of smart meter • Uncertainties in municipality-wide • Eskom and municipal electricity
regulations (NRS 049) implementation tariffs on the rise
• Monitoring and bill reduction as a • The carbon tax bill currently in effect
service
• Reduces rates of tampering and theft
through real-time alerts
Aggregated • Legislative and regulatory changes for • Target market education and business 1-5 years • COVID-19 economic contraction has led
interventions green buildings (SANS10400-XA) development to the businesses being conservative
for commercial • The requirement of a 50% limit with their balance sheets
new builds and on electricity used for water heating • Eskom and municipal electricity tariffs
retrofits is driving the shift to centralised on the rise
energy solutions particularly in
building retrofits.
ENERGY SERVICES: MIR 2021
• 12L tax incentive
• Falling cost of energy-efficient
technologies
6WHAT’S CLICK HERE
NEW? TO WATCH A
SUMMARY OF THE
2021 ENERGY
SERVICES MIR
OPPORTUNITIES
This MIR provides an update on the opportunities, barriers, and regulations discussed in the
2020 Energy Services MIR. It also outlines emerging opportunities and barriers in small-scale
embedded generation, energy efficiency, and energy storage.
What happened in 2020 • March: Amendments to Schedule be in charge of registering the • July: The City of Cape Town
2 of the Electricity Regulation installations and report to NERSA. (CCT) launched a Small Scale
• Feburary: The new draft Act 4 of 2006 were gazetted Embedded Generation Feed-in
Energy Efficiency Standards on 26 March 2020. It exempts • May: Draft low voltage wiring code Incentive (R0.25/kWh)
(SANS10400-XA 2nd edition) were certain power generation SANS 10142-1-2 – Part 1-2: Specific
published for public comment. facilities of less than 1 MW in requirements for embedded • January – December: Rolling
size from the requirement to generation installations blackouts (load shedding)
• March: Phased national have a generation licence. If an connected to the low voltage continued with Eskom unable
2020 MIR 2021
lockdown in response to the installation meets the criteria distribution network in South to match current demand with
COVID-19 pandemic led to a halt as stipulated in the amended Africa were released for public available supply.
SERVICES:
in economic activity and the schedule, the installation can be comment. It stipulates additional
delivery of energy projects from registered with NERSA, instead of special requirements for low
WATER: MIR
26 March 2020 to 31 May 2020 requiring a licence. It is expected voltage small-scale embedded
ENERGY
(2 months). that distribution operators, i.e. generator installations connected
municipalities or Eskom, would to the electricity grid.
03
7State of the Nation Address 2020 • Procuring emergency power This MIR updates the 2020 report • Energy Services market drivers
from projects that can deliver and highlights the following: and barriers;
In the State of the Nation Address electricity into the grid within 3
(SONA 2020), President Cyril to 12 months of approval. • updates on the state of small- • COVID-19 lockdown and its
Ramaphosa announced measures scale embedded generation in impact on the Energy Services
that the government would take to • Generating own-use power. South Africa; market; and
rapidly and significantly change NERSA will continue to register
the trajectory of energy generation small-scale distributed generation • updates on the state of energy • the influence of changes in policy
in the country, including: for own use of under 1 MW, for storage in South Africa; and regulations such as the IRP
which no licence is required. on future opportunities.
• Bringing more renewable energy, • updates on the state of energy
natural gas, hydropower and • Enabling municipalities to efficiency in South Africa;
battery storage into the energy produce their power directly or
mix through the Integrated procure from independent power • opportunities for players within
Resource Plan 2019. producers (IPPs). the Energy Services market;
ENERGY SERVICES: MIR 2021
Gouda Wind Farm.
©Nicholas Fordyce
8INTRODUCTION
AND PURPOSE
In response to changing demands, energy service providers are broadening their
2020 MIR 2021
market offerings. The South African Energy Services market holds opportunities for
SERVICES:
equipment suppliers, project developers, technical advisors, and financial investors.
WATER: MIR
ENERGY
03
9Over the past 10 years, the concept The report is compiled for • In Section 4, emerging
of energy services (ES) and energy foreign direct and local investors opportunities and their related
services companies (ESCos) has (persons or organisations) that drivers and barriers are CLICK HERE
evolved and matured in several are looking to invest directly in highlighted, followed by sections TO EMAIL
markets around the world, the South African green economy that outline various finance GREENCAPE’S
including South Africa. through project development, and investment incentives
ENERGY SERVICES
asset management, equity, debt, (Section 5), present the case for
SECTOR DESK
This market intelligence report equipment manufacture, or the Western Cape as a potential
provides potential investors support services. greentech hub for Africa
in the small-scale embedded (Section 6), and explain
generation, energy storage, and In what follows: GreenCape’s work within the
energy efficiency markets with a green economy (Section 7).
greater understanding of market • The sector overview (Section 2)
opportunities in South Africa, provides a national economic
taking into account the size of overview of the ES market, Manufacturing job
the opportunities, the level of risk including: opportunities in
the SSEG market.
involved, and current barriers. • the market context (small- ©GreenCape
scale embedded generation,
energy storage, and energy
The global energy as a service efficiency);
market is projected to reach • four major market drivers in
USD 86.9 billion by 2024 from the South African ES market;
an estimated USD 52.0 billion in • market sizing (small-scale
2019/20, at a compound annual embedded generation, energy
growth rate (CAGR) of 10.8%. storage, and energy efficiency);
This growth can be attributed • key players in the South
to factors such as new revenue African ES market.
generation streams for utilities,
ENERGY SERVICES: MIR 2021
increasing distributed energy • This is followed by an overview
resources, decreasing cost of and update of policies,
renewable power generation legislation, and governance
and storage solutions, and the (Section 3) that guide and affect
availability of tax benefits for the ES market.
energy efficiency projects.
(MarketsandMarkets 2019)
10SECTOR
OVERVIEW
Rising electricity prices, national energy insecurity, dropping technology costs,
2020 MIR 2021
supportive energy policies, and incentives are prompting consumers to explore
SERVICES:
alternative energy options driving the growth of the Energy Services (ES)
market in South Africa, and creating a thriving value chain.
WATER: MIR
ENERGY
03
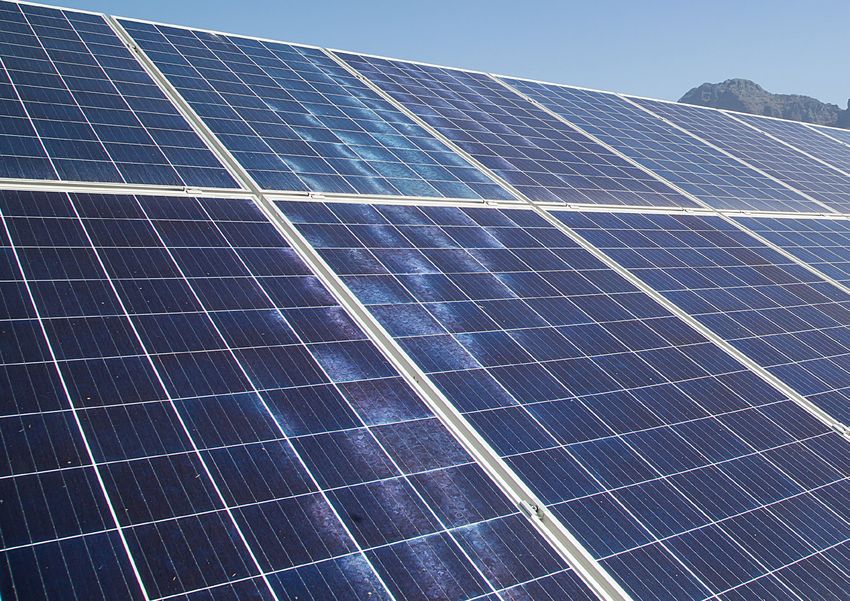
11ENERGY SERVICES: MIR 2021
Solar PV installment
in Cape Town
©GreenCape
12This section provides an overview energy space, namely small-scale Figure 1: Energy Services interlinked market segments
of the national ES context, embedded generation, which is
covering market developments, currently dominated by rooftop
key industry players, and the size solar photovoltaic (PV) systems, Small-scale embedded generation
of the market. The term ”energy energy storage, and energy
services” is used to describe efficiency. Figure 1 (to the right)
three interlinked energy market breaks down the three interlinked
● Generation facilities of less than 1 MW.
segments in the South African energy market segments. ● Located at residential, commercial or
industrial sites, where electricity is
generally consumed.
● Installed on the customer’s side of the
Energy efficiency electricity meter.
improvements – street
light retrofitting.
©City of Cape Town
Energy storage
● Energy storage systems are
technologies in which electric energy is
loaded and, when needed, discharged
for consumption.
2020 MIR 2021
Energy efficiency
SERVICES:
● Implementation of behaviour
WATER: MIR
change or technology to reduce
ENERGY
energy consumption, while producing
the same or greater outputs.
03
132.1. International Energy 2.2. South African versus 79% in 2019) (Wright &
Services market market context Calitz, 2020). However, a historic
imbalance of supply and demand
The global ES market is projected When breaking this down into Within a global landscape context, in South Africa’s single buyer
to reach USD 86.9 billion by 2024 specific services, the market for the South African ES market energy model over more than 10
from an estimated USD 52.0 billion energy services is divided into remains nascent; however, each years has resulted in intensive load
in 2019, at a compound annual supply, demand, and optimisation of these global trends can be shedding experienced country-
growth rate (CAGR) of 10.8 per services, as seen in Figure 2. With a observed in the local market. wide during 2019 and the first half
cent (MarketsandMarkets 2019). global focus on renewable energy of 2020. An estimated 1.3 TWh was
This growth can be attributed (lower costs, reduced carbon 2.2.1. South African loadshed during these periods
to factors such as new revenue footprint), it is projected that the electricity landscape (Wright & Calitz, 2020). Load
generation streams for utilities, supply portion of the market will shedding has been driven by a
increasing distributed energy dominate market growth over the South Africa’s electricity supply combination of factors, including:
resources, decreasing costs of next five years. On a sector basis, is currently dominated by coal-
renewable power generation the commercial, agricultural, and fired power generation. The • delayed commissioning and
and storage solutions, and the industrial segments are projected country has coal-fired generation underperformance of newly built
availability of tax benefits for to register the fastest growth over stations with an installed capacity coal generation capacity;
energy-efficiency projects. the next five years. of between 36.5 GW and 40 GW. • degradation of the existing
This represents more than 80% Eskom coal fleet energy
of the country’s total installed availability factor (EAF)
capacity, amounting to 48 GW declining from ~94% in 2002
(The Department of Energy 2019). to 67% in 2019/20.
45+15+40L
Figure 2: Global Energy Services Market Share These stations are primarily
(MarketsandMarkets 2019) owned and operated by Eskom, 2.2.2. The development of the
the national power utility. Eskom Energy Services market in
45% supplies ~95% of South Africa’s South Africa
40% total electricity demand. The
remaining 5% is met through As detailed above, the South
ENERGY SERVICES: MIR 2021
municipalities, imports, and African electricity market is
independent power currently managed on a single
15% producers (IPPs). operator model by Eskom, a state-
owned entity. Eskom is responsible
There has been distinct demand for generation and transmission,
DEMAND flattening since 2010, resulting and also controls a minority share
SUPPLY in reduced dependence on coal- of the distribution market.
OPTIMISATION SERVICES based electricity (87% in 2010
14This single operator model is South Africa’s dependence on small-scale embedded generation scale embedded generation,
designed to support developing this single operator model has and energy storage markets. energy storage, and energy
electricity markets in need decreased over the past 10 years Continual increases in the cost efficiency), four major
of structured long-term with the introduction of new of traditional electricity supply market drivers in the South
infrastructure investments technologies, which are cheaper, have also led to improved demand African Energy Services
(with 10 to 15-year construction capable of being decentralised, efficiencies (energy efficiency). market, and key players in
timelines), and diverse demand and more low-carbon. The growth the South African Energy
balancing of centralised of this decentralised market is The sections that follow detail Services market, as shown
generation facilities. evidenced by the evolution of the the market context (small- in Figure 3 below.
Figure 3: Energy Services sector overview
Energy Services
Small-scale embedded
generation (SSEG) Energy efficiency
Numbers
refer to
sections
Rooftop solar PV Energy storage in the
document
4.1.1. 4.1.3. 4.2.1.
C&I deversified PV for energy resellers Behind-the-meter backup
4.1.2. 4.1.4.
2020 MIR 2021
4.3.1. 4.3.2.
Solar PPAs In-house capacity building Smart metering and demand- Aggregated commercial
side management retrofits
SERVICES:
WATER: MIR
ENERGY
2.3.
Drivers: Electricity price, RE price, supportive regulations (wheeling; SSEG) and tariffs,
innovative finance, and service provider accreditation.
03
152.3. Energy Services • falling costs of renewable energy investors and businesses, in Figure 4 compares Eskom price
market drivers technologies such as rooftop particular equipment suppliers, increases to the more conservative
solar PV; project developers, technical increase in South Africa’s inflation
Five major developments are • supportive energy policies and advisers, installers, and rate as reflected by the consumer
transforming South Africa’s energy regulations by the local and financial investors. price ndex (CPI). The average
market from a monopoly model national government; and standard Eskom tariffs have
to a distributed generation model • energy financing programmes 2.3.1. Rising electricity costs risen by almost 300% since 2007.
made up of multiple smaller and incentives. Historical data from both Eskom
generators, buyers, and sellers: Rapidly rising Eskom electricity (2019) and StatsSA (2019), shown in
In turn, these developments, prices have created a sizeable Figure 4, reveal that while inflation
• rising energy prices; discussed in more detail demand for viable alternative has almost doubled since 2009,
• national energy insecurity; below, create significant energy sources in South Africa. Eskom prices have tripled over
opportunities for energy services the same period.
Figure 4: Average Eskom tariff versus inflation (CPI) projected to 2022
Sources: Statistics South Africa (StatsSA) and Eskom (2019)
800
700
Normalised index (2012 = 100)
600
500
400
ENERGY SERVICES: MIR 2021
300
200
100
3
4
5
6
07
8
9
0
1
2
13
4
15
16
7
18
19
20
1
2
1
2
1
1
2
0
0
0
0
0
0
1
1
20
20
20
20
20
20
20
20
20
20
20
20
20
20
20
20
20
20
20
20
Year
INFLATION (CPI) ESKOM TARIFF
16Table 1: Eskom price increases 2010-2020
Inflation-
Furthermore, as can be seen 2.3.2. Falling costs of renewable
Average price in Table 1, the National Energy energy technologies
Year Inflation (%) adjusted price
increase (%)
(c/kWh) Regulator of South Africa (NERSA)
has approved an above CPI Renewable energy technology
2010 24.80 4.26 67.18
increase for Eskom for the past prices have been dropping
2011 25.20 4.99 80.45 10 years. steadily since 2010. For example,
the global average price for solar
2012 24.80 5.62 88.90 The average standard Eskom tariff PV in 2018 was R1.22 kWh, down
will increase from 116.72 c/kWh to from R5.33 kWh in 2010 (IRENA
2013 16.00 5.76 90.25
128.24 c/kWh in 2021— an increase 2019). It represents a ~77% drop
2014 8.00 6.09 91.65 of 9.8%. This is on top of the 5.22% in eight years.
tariff increase the power utility has
2015 8.00 4.58 94.30 already negotiated for the same The most significant decreases
year, which will bring the total in average cost have been in
2016 8.00 6.34 96.08
price hike to about 15%. solar PV and wind technologies.
2017 8.20 5.27 99.23 Figure 5 shows the levelised
cost of electricity (LCOE) per
2018 5.20 4.62 99.32 renewable energy technology
in South Africa’s utility-scale
2019 13.90 4.13 108.79
Renewable Energy Independent
2020 3.90 2.43* 116.72 Power Producer Procurement
Programme (REIPPPP)1, and
Eskom average tariff trajectory
2010-2020 (Rand/kWh).
WATER: MIR
ENERGY 2020 MIR 2021
SERVICES:
1
For more information on the REIPPPP, please see the GreenCape Utility Scale Renewable
03
Energy Market Intelligence Report
17Figure 5: Levelised cost of electricity (LCOE) per renewable energy Figure 6: South African small-scale solar PV price in 2018-2022
technology in South Africa’s utility-scale programme, and Eskom
average tariff trajectory 2010-2020 (Rand/kWh)
250 2
1,8
200 Round 1 1,6
Round 4 (b) 1,4
Rand
150 1,2
c/kWh
Round 2
1
100
Round 3 0,8
0,6
Round 5 (estimate)
50 0,4
Round 4 (a) 0,2
0 0
2010 2015 2022 2018 2019 2020 2021 2022
Year and REIPPPP bid windows Year
REIPPPP blended LCOE (c/kWh) ESKOM TARIFF (c/kWh) < 100 kWp < 500 kWp > 500 kWp
This trend of falling technology Currently, the South African SSEG Figure 6 shows the trajectory of Technological maturaty, improved
prices is also present in the South market is dominated by rooftop falling prices for small-scale solar finance, reduced costs of metering,
African small-scale embedded solar PV, given the competitive PV installations from 2018 – 2020 and professional sign-off will be
generation (SSEG) market. price, technical maturity, and (real) and 2021 — 2022 (estimates). the main drivers of cost reductions
ease of implementation of over the next two years.
ENERGY SERVICES: MIR 2021
this technology.
18In 2020, the small-scale solar PV levelised cost of energy is already less Section 3 (legislation, regulation, 1. The Department of Mineral
than R1 kWh, as seen in Table 2 below. and policy) and Section 5 (funding Resources and Energy (DMRE)
opportunities and incentives) has approved the capacity
Table 2: South African solar PV price in 2020 discuss these in more detail. for municipalities to buy
Regulatory developments as electricity from independent
Capital cost of the described in Section 3 facilitate power producers (IPPs). In
System size (kWp) PPA tariff (LCOE)
system (R/kWp) the growing uptake of renewable the Amendment of Electricity
energy options, particularly in Regulation Act 4 on New
< 100 kWp R12 000 – R15 000 0.90c – R1.20
the 500 kWp R8 000 – R12 000 0.60c – 0.90c
wind energy installations, to the in good financial standing will
uptake of bioenergy. Similar to now be allowed to formulate an
the amendments to licensing energy plan that does not rely
regulations and guidelines from solely on the government-run
As these prices continue to 2.3.3. Supportive energy the Department of Mineral Eskom. A specific ministerial
drop across a variety of ES policies and regulations by Resources and Energy (DMRE) determination, like the one
technologies, the financial case local and national government and NERSA, changes in municipal that enabled the various IPP
for investment into ES regulation of SSEG installations programmes, may still be
interventions improves. The regulatory environment has have contributed to increasingly needed to allow municipalities
a direct impact on investment conducive market conditions to purchase directly from IPPs.
This financial case is also opportunities, market growth, and for investors, project developers, Currently, there is no precedent
supported by national energy job creation. To lower demand equipment suppliers, and technical for this.
insecurity, as it is expected that on the national grid, and to advisers. Three major changes
load shedding will continue for reduce carbon emissions, the are taking place on the local However, the City of Cape Town
the next three to five years as new national government has put in government level: (CCT) has requested such a
generation capacity is procured place several energy policies and determination2, and Ekurhuleni
and brought into operation. incentives to encourage energy- municipality released a Request
efficiency interventions and for Proposal (RFP) for IPP
2020 MIR 2021
alternative energy generation. generation in the second half
of 2016, followed by Buffalo
SERVICES:
City in 2019.
WATER: MIR
ENERGY
2
The City of Cape Town has committed to purchasing ±520 MW of renewable energy over the next 15 years, with the majority of the other metro-municipalities also having committed
03
to purchases of a similar scale.
19More recently, Merafong a. Electricity wheeling3, as There is currently In addition to enabling renewable
municipality in October 2020 allowed by the National only one licensed energy energy technologies, the off-
published an Expression of Regulator and implemented trader in South Africa, but take options detailed above
interest (EOI) for solar PV by local municipalities, will there are numerous other would provide a platform for
clusters. The success of such a allow generators to wheel entities currently applying to municipalities to engage and
programme would ultimately rest their electricity to a willing the National Energy Regulator retain customers. Through
on a ministerial determination buyer anywhere in the of South Africa (NERSA) for offering an additional avenue
being made. Accordingly, the municipality or country. This trading licences. It is expected to prosumers5, municipalities
ongoing changes in legislation is currently being implemented that in 2021 there will be would propose a new service to
around generation licensing and by City of Tshwane, Nelson multiple electricity traders electricity generators as well as
own-use present opportunities Mandela Bay Metropolitan operating in South Africa. consumers interested in procuring
for municipalities to increase Municipality, the City of Cape clean energy.
their participation in the Town, Stellenbosch, These new off-take options
generation sector, and thus their Drakenstein and Eskom. present an opportunity for high 3. The country-wide rollout of
energy autonomy. and medium voltage commercial national small-scale embedded
b. The release of regulations and industrial customers with generation rules, regulations, and
2. Increasing off-take agreement that allow private sector high energy bills, and buildings tariffs to promote the safe and
options under third party energy trading4 has opened that currently are not able to legal uptake of SSEG for own use6.
grid access regulations the market to private sector install rooftop PV. The associated
for small-scale embedded power purchase agreements costs for making use of a local
electricity generators and on-sales to private distribution utility network remain
consumers using the national high (30 c/kWh – 90 c/kWh off-
and local distribution networks. peak vs peak time).
ENERGY SERVICES: MIR 2021
3
Wheeling is the transportation of electrical energy from a generator to a separate electrical load, by making use of municipal or Eskom grid infrastructure and power purchase
agreements (PPAs).
4
Electricity trading is the transportation of electrical energy from a generator to a separate electrical load, by making use of municipal or Eskom grid infrastructure and power purchase
agreements (PPAs). The difference is that a private sector electricity trader or third party will purchase the electricity, pay the local municipality/Eskom to wheel it over their network, and
sell it to a willing customer.
5
A prosumer is an entity or person who produces and consumes a product, in this case electricity.
6
The generation of electricity on the load site where it will also be consumed.
20Figure 7 shows the upward trend of municipalities adopting SSEG processes from 2016 to 2020.
Figure 7: Uptake of SSEG processes in municipalities
Source: SALGA 2020
60
56
50
Number of municipalities
41 44
40
34 31
30
29
25 21
25
20
17 18
10
10 12
5
3
0
Feb 2016 Nov 2016 Oct 2017 Oct 2018 Jun 2020
ALLOW SSEG OFFICIAL APPLICATION PROCESS SSEG TARRIFF
2020 MIR 2021
SERVICES:
More and more
businesses are
installing rooftop
WATER: MIR
solar PV systems
ENERGY
with municipalities
allowing SSEG.
©GreenCape
03
21Table 3 represents the best level have a formal application process,
of information obtained by the and those that have NERSA-
South African Local Government approved SSEG tariffs. This allows
Association (SALGA) on the uptake them to credit customers for excess
of SSEG processes in municipalities electricity exported onto their
by October 2020. It gives a regional distribution networks. The table
breakdown of municipalities that also shows the percentage of the
allow SSEG installations on their national registered SSEG systems
distribution network, those that in each province.
Table 3: Provincial SSEG uptake summary
Source: SALGA 2020
Number of
Number of municipal Number of Number of Percentage of
municipalities with
Provinces electricity distributors municipalities allowing municipalities with national registered
official application
in the province SSEG installations SSEG tariffs SSEG systems
processes
Eastern Cape 22 6 6 2 4
Free State No data
Gauteng 9 4 3 2 46
KwaZulu-Natal 25 3 2 1 13
Limpopo 16 6 5 1 1
Mpumalanga 14 4 4 3 6
Northern Cape 24 9 4 3 2
ENERGY SERVICES: MIR 2021
North West 13 2 2 0 6
Western Cape 25 24 18 19 23
TOTAL 165 58 44 31 –
% of licensed
38 28 20 – –
distributors:
22Table 4 gives a more detailed overview of the municipalities that allow SSEG installations within their municipalities, either on a case-by-case basis
or through an application process.
Table 4: List of municipalities allowing SSEG to connect to the grid
Source: SALGA 2020
Have an official SSEG Have a NERSA approved
Province Municipality Allow SSEG onto the network?
application process? SSEG tariff?
Buffalo City Yes Yes Yes
Dr Beyers Naude Yes Yes No
Eastern Cape King Sabata Dalindyebo Yes Yes No
Kouga Yes Yes No
Makana Yes Yes No
Nelson Mandela Bay Yes Yes Yes
Ekurhuleni Yes Yes No
Johannesburg Yes Yes Yes
Gauteng
Tshwane Yes Yes Yes
Rand West City Yes No No
Umhlathuze Yes No No
KZN eThekwini Yes Yes Yes
Greater Kokstad Yes Yes No
Ba-Phalaborwa Yes Yes No
2020 MIR 2021
Elias Motswaledi Yes Yes No
SERVICES:
Ephraim Mogale Yes Yes Yes
Limpopo
Greater Tzaneen Yes Yes No
WATER: MIR
ENERGY
Polokwane Yes Yes No
Thaba Chweu Yes No No
03
23Table 4: Continued...
Have an official SSEG Have a NERSA approved
Province Municipality Allow SSEG onto the network?
application process? SSEG tariff?
Mbombela Yes Yes Yes
Emalahleni Yes Yes Yes
Mpumalanga
Govan Mbeki Yes Yes Yes
Msukaligwa Yes Yes No
!Kheis Municipality Yes No No
Gamagara Yes Yes Yes
Hantam Yes No No
Kai!Garieb Yes No data Yes
Northern Cape Karoo Hoogland Yes Yes No
Nama Khoi Yes No No
Sol Plaatjie Yes No data Yes
Thembelihle Yes Yes No
Ubuntu Yes Yes No
Matlosana Yes Yes No
ENERGY SERVICES: MIR 2021
North West
JB Marks Yes Yes No
24Figure 8 gives a more detailed While the average tariff remains low, Municipalities are moving tariffs In 2020 the City of Cape Town
overview of the Western Cape there is still a viable business case, to be more cost-reflective7, with implemented a 25c/kWh
municipalities that allow built on the value of self-consumed the bulk of their costs accounted SSEG feed-in tariff incentive
SSEG installations within their electricity. Figure 9 below details for by energy time-of-use above the existing feed-in tariff.
municipalities, either on a case- the current feed-in tariffs across the purchases from Eskom. Figure 10 This is available for a year for
by-case basis or through an municipalities in the Western Cape. below details the current fixed all new customers, and means
application process. There is a There is currently no guarantee on portion of Western Cape the feed-in tariff would be
large range of SSEG tariffs across the structure and cost of municipal municipal SSEG tariffs. as high as R1/kWh.
the municipalities listed in Table 4 consumption and feed-in tariffs
and Figure 8. from year to year.
Figure 8: Western Cape municipalities allowing SSEG to connect to the grid
Matzikama
Cederberg Beaufort
West
Bergrivier
Witzenberg
Saldanha Prince Albert
Bay Laingsburg
Swartland Breede
2020 MIR 2021
Oudtshoorn George
Valley
Drakenstein
Stellenbosch Langeberg
SERVICES:
Theewaterskloof Mossel
City of Cape Town Hessequa Bay Bitou
WATER: MIR
Cape
ENERGY
Knysna
Agulhas
Swellendam
7
Two part tariffs with both variable and fixed portions. Overstrand
03
25Rand Rand
Be Be
au au
fo fo
r tW rt
W
R-
R0,20
R0,40
R0,60
R0,80
R1,00
R1,20
es es
R-
R500
R1 000
R1 500
R2 000
R2 500
R3 000
R3 500
R4 000
R4 500
Be tL Be tL
rg oc rg oc
riv al r iv al
ie ie
r Lo rL
Bi c al Bi
oc
al
Br to Br to
ee u ee u
de Lo de Lo
Va ca Va ca
C lle l C l l
ap ap le
e y e y
Ag Lo Ag Lo
ul ca
l u lh
ca
l
RESIDENTIAL FEED-IN TARIFF 2019/20
RESIDENTIAL FEED-IN TARIFF 2019/20
ha
C s C as
ed Lo ed Lo
er ca er ca
C
be l C
be l
ity r g ity rg
of L oc of Lo
C al C ca
D ap D ap l
ra e ra e
ke To ke To
ns w ns w
te n te n
in in
Lo Lo
G ca G ca
eo eo
rg l rg l
Figure 9: Western Cape municipal SSEG feed-in tariffs
H e H e
es Lo es Lo
se ca se ca
qu l qu l
Figure 10: Western Cape municipal SSEG fixed tariff portion
Ka a Ka a
nn L oc nn L oc
al al al al
an an
d d
Lo Lo
Kn ca Kn ca
ys
n l ys
n l
a a
COMMERCIAL FEED-IN TARIFF 2019/20
COMMERCIAL FEED-IN TARIFF 2019/20
La La
in Lo in Lo
gs ca gs ca
bu l bu l
La rg La rg
ng Lo ng Lo
eb ca eb ca
er l er l
M g M g
ai Lo ai Lo
zi ca zi ca
ka ka
m l m l
M a M a
os Lo os Lo
Western Cape Municipalities
Western Cape Municipalities
se ca se ca
lB l lB l
O ay O ay
ud L ud L
ts oc ts oc
ho al ho al
or or
RESIDENTIAL AVERAGE
O n O n
ve Lo ve Lo
rs ca rs ca
tr tr
Pr a nd l Pr a nd l
in in
ce Lo ce Lo
AVERAGE RESIDENTIAL FIXED FEE
Al ca Al ca
Sa be l Sa be l
ld rt ld rt
an Lo an Lo
ha ca ha ca
St Ba l St Ba l
el y el y
le Lo le Lo
nb ca nb ca
os l os l
ch ch
Sw Lo Sw Lo
ar ca ar ca
tla l tla l
COMMERCIAL AVERAGE
Sw nd Sw nd
el
le L oc
el
le L oc
Th nd Th nd
ee al ee al
w am w am
at Lo at Lo
er ca er ca
sk sk
lo l lo l
W of W of
itz Lo itz Lo
en ca en ca
be l be l
rg rg
AVERAGE COMMERCIAL FIXED FEE
Lo Lo
ca ca
l l
26 ENERGY SERVICES: MIR 2021Overall, these changes at The investment is recovered as • The Green Outcomes Fund: patient, and affordable finance
municipal level complement a portion of the monthly rates The Green Outcomes Fund (GOF) packages for commercial and
legislative updates on a national collected by the respective is a first of its kind structure, residential solar PV. The inclusion
level, e.g. the gazetted Integrated municipality. which incentivises local South of the commercial banking sector
Resource Plan 2019, and future African fund managers to may reduce some opportunities
changes such as the unbundling • Pay as You Save® (PAYS®): increase investment in green for less traditional investors such
of the national utility, Eskom. PAYS® is an inclusive financing small-, medium- and micro- as equity funds; however, it could
Together these changes herald solution that allows all utility sized enterprises (SMMEs). unlock the SSEG opportunity
a freer, more ‘liberalised’ customers to access cost- for end-users and installers,
electricity market, in which all effective energy efficiency engineering, procurement and
FOR MORE INFORMATION
stakeholders are empowered in upgrades and distributed construction contractors (EPCs),
ON GOF, PLEASE VISIT
their energy choices. renewable energy assets, and ESCos by providing accessible
THE GOF WEBSITE
regardless of income, credit and affordable financing.
2.3.4. Energy finance – history, or renter status (The
facilitating the right type of Lab 2018). This is particularly Financing for SSEG, specifically Banks’ offerings include
finance into the sector important for financing rooftop solar PV, is underpinned mechanisms that cover 70% to
programmes that aim to serve by thousands of small contracts 100% of capital costs with a five- to
The growth of the South African market segments that are with consumers. Traditionally, ten-year loan repayment. However,
ES market is aided by ”green” hard to reach. Of the three commercial banks have favoured by making use of pre-selected
energy finance offerings that mechanisms listed here, this big solar/wind farms because they EPCs and meticulous energy
facilitate the tailored finance is the least developed in are generally based on contracts audits, banks ensure that financed
solutions for the energy sector. South Africa. with investment-grade utilities and projects are designed so that the
Several exciting finance international companies. Only in the customer’s savings generated
mechanisms are being tested past two years have the majority from the solar installation are
in the market. CLICK HERE TO of the commercial banks started greater than the loan repayments.
ACCESS THE PAYS to provide tailored mechanisms for This results in a positive cash flow.
• Property assessed clean energy INDUSTRY BRIEF rooftop solar PV investments.
(PACE): PACE is a financing 2020 saw commercial banks'
2020 MIR 2021
mechanism that enables low- Commercial and residential debt SSEG risk profiles improving,
cost, long-term funding for largely remains closely tied to resulting in reduced finance
SERVICES:
energy efficiency, renewable strong individual credit scores and costs. Commercial banks have
energy, and water conservation existing bank-customer relations. seen significant growth of
WATER: MIR
(resource efficiency) projects However, in 2017, the big five banks successful projects on their loan
ENERGY
installed by ESCos on properties. in South Africa started to focus books with portfolios tripling in
on rooftop PV’s unique financing the past two years.
needs, providing more targeted,
03
27As a result, perceived risk 2.4. Key players
is stabilising, and finance
offerings are becoming more Figure 11 shows the Energy
competitive. The commercial Services (ES) value chain and key
banks are also exploring new players in the value chain, with the
approaches to loan collateral. roles of specific actors outlined in
Whereas in the past security Table 5.
has been tied to the asset or
balance sheet of the client, The value chain is based on
financiers increasingly prefer the stages of a generic energy
agreements which tie security intervention, showing the types
to the property on which the of services or products provided
asset is installed. by key players during an energy
service provision. This represents a
Amortising debt is still the most simplified view of the value chain.
cost-competitive form of finance In practice, the roles of these actors
for invest-to-own scenarios. often shift with relative fluidity. For
However, financiers have noted example, the boundary between
that PPAs, whilst more expensive, a project developer, Engineering,
are growing for the following main Procurement and Construction
reason — cash flow stability. A (EPC) company, and installer is
PPA provides a clear indication often blurred, with players taking
of electricity costs, and the client on different roles depending on the
does not always want to own the size, cost, ease of implementation,
system or take on the performance or other project-specific factors.
risk. This is especially true for large
corporate clients.
ENERGY SERVICES: MIR 2021
ACCESS TO
INNOVATIVE FINANCE
INDUSTRY BRIEF
The green economy has
the potential
to create a wide
range of decent jobs.
©GreenCape
28Figure 11: Energy Services market value chain
Energy Energy Technical Operation & Measurement
Services Finance Installations
audit design maintenance & verification
Value Chain
Energy Service Companies
Consultants Consultants
Banks
Self fund
PPA Funders
Product/Service
Providers
Manufacturers
Suppliers
2020 MIR 2021
Installers
SERVICES:
Engineering Procurement, Engineering Procurement,
WATER: MIR
Construction (EPCs) Construction & Management (EPCMs)
ENERGY
Project developers
03
29Table 5: Roles of key players in the Energy Services value chain As with much of South Africa’s
green economy, the Energy
Key player Role Services value chain is dominated
by small- and medium-sized
Energy services companies (ESCos) ESCos are active across the whole value chain, aside from measuring and validation, as
enterprises (SMEs). As the market
independent consultants also perform this function. There are two generic ESCo-type
energy contract models: continues to develop, disruption
• Energy supply contracting (ESC), which delivers units of energy. will be a feature of this nascent
• Energy performance contracting, which provides energy savings economic sector. Adapting to this
determined by comparison to an established and agreed-upon baseline. type of rapid growth is easier for
SMEs, as pre-existing corporate
Consultants Consultants include energy auditors, planning engineers, certified measurement and
verification personnel (CMVP), accountants, and lawyers. structures and sunk investment
do not hamper them. That said,
Financiers Financiers provide funding and financing mechanisms to realise projects. their growth could be stifled by
• Project finance – commercial banks (commercial and asset funding),
their inability to scale up or down
self-funded individuals (with cash reserves) and PPA financiers (such
as private equity funds, debt facilities). fast enough to take advantage
• Funding for ESCos (not detailed in the diagram) – commercial banks, of opportunities.
private equity funds, corporate foundations, private and family foundations, and venture
capitalists. 2.5. Energy Services
Manufacturers and suppliers Manufacturers and suppliers include technology suppliers or original equipment
market size
manufacturers (OEMs). They manufacture and supply equipment, and form part of typical
energy efficiency or supply interventions. Using the total available market
for the small-scale embedded
Installers Most energy service companies, EPCs and project developers make use of specialised
installers for both energy efficiency and SSEG (technology specific). generation (solar rooftop PV
systems) installed in the country,
Engineering, procurement and EPCs design interventions, procure and install tailored turnkey energy efficiency and/or
energy storage, and capital
construction (EPC) company renewable energy solutions.
leveraged in energy efficiency
EPCM (Engineering, Procurement, Under an EPCM contract, the owner maintains more control of the project. interventions implemented by
Construction Management) The contractor manages the construction project, but only under the direction of the
South African energy users, South
ENERGY SERVICES: MIR 2021
owner. With an EPCM contract, the owner is responsible for hiring suppliers, construction
workers and other contractors, and the EPCM contractor will manage these contractors. Africa’s total available ES market
is valued at ~R131 billion by 2035.
Project developers Project developers handle tasks that focus on moving the project along
toward successful completion. In the ES value chain, they play more of a business
development role as they focus on, for example, project design
The total available market is
and procurement, but make use of specialised installers. the total untapped demand
for a product or service in the
ES market. The total available
market size detailed in this
30You can also read


