Sustainable Agriculture 2020 Market Intelligence Report

Page created by Esther Vasquez
 
CONTINUE READING
Sustainable Agriculture 2020 Market Intelligence Report
Sustainable Agriculture

  2020
  Market Intelligence Report

Sustainable Agriculture: Market Intelligence Report 2020   i
Sustainable Agriculture 2020 Market Intelligence Report
GreenCape
                                                                GreenCape is a non-profit organisation that drives the widespread adoption
                                                                of economically viable green economy solutions from the Western Cape. We
                                                                work with businesses, investors, academia and government to help unlock the
                                                                investment and employment potential of green technologies and services, and
                                                                to support a transition to a resilient green economy.

                                                                Acknowledgements
                                                                We thank Inge Kushke, for the time and effort that she has put into compiling
                                                                this market intelligence report.

                                                                Disclaimer
                                                                While every attempt was made to ensure that the information published in this
                                                                report is accurate, no responsibility is accepted for any loss or damage to any
                                                                person or entity relying on any of the information contained in this report.

                                                                Copyright © GreenCape 2020

                                                                This document may be downloaded at no charge from www.greencape.co.za.
                                                                All rights reserved.

                                                                Subscribe to receive e-mail alerts or GreenCape news, events and publications
                                                                by registering as a member on our website: www.greencape.co.za

                                                                18 Roeland Street, Cape Town, 8001, South Africa

                                                                Authors:			Inge Kuschke
                                                                Editorial and review: 		 Louw Pienaar, Cilnette Pienaar, Lauren Basson
                                                                			and Nicholas Fordyce
                                                                Images: 			              GreenCape, Western Cape Department
                                                                			                      of Agriculture and Oranjezicht City Farm
                                                                Layout and design: 		          Tamlin Lockhart Art Direction

ii   Sustainable Agriculture: Market Intelligence Report 2020   Sustainable Agriculture: Market Intelligence Report 2020                          iii
Sustainable Agriculture 2020 Market Intelligence Report
Contents                                                                                                     List of figures

Executive summary                                                                                            1    Figure 1:
What’s new?		                                                                                                5    South Africa’s land cover and select land use classifications                    8
1. Introduction and purpose                                                                                  6    Figure 2:
2. Sector overview                                                                                           8    South African agricultural regions                                              9
   2.1. Physical geography and climate                                                                       8    Figure 3:
		      2.1.1. Western Cape agriculture                                                                      9    Proportion of agricultural commodities produced in the WC                       9
   2.2. Overview of the agricultural economy                                                               10     Figure 4:
		      2.2.1. South African agriculture                                                                   10     Agricultural economy and South African sectoral GDP (ZAR billion per quarter)   11
		      2.2.2. Western Cape agriculture                                                                     12    Figure 5:
   2.3. Key players                                                                                        14     South African agricultural GDP and trade balance (ZAR billion per year)         12
		      2.3.1. Sustainability initiatives and investments by the agricultural industry                      15    Figure 6:
   2.4. Drivers of sustainable technologies and approaches in agriculture                                  16     Breakdown of Western Cape exports by value and area planted for fruit & nuts    13
		 2.4.1. Environment                                                                                      16     Figure 7:
		      2.4.2. Industry cost structure                                                                     16     Key role players in agriculture                                                 14
		      2.4.3. Market pressure and readiness                                                               16     Figure 8:
3. Policies and regulations                                                                                 18    Fruit and wine farm CO2e “hotspots”                                             21
   3.1. South Africa’s agricultural policies and regulations                                                18    Figure 9:
   3.2. Water                                                                                              20     Undercover farming and its various forms                                        29
		      3.2.1. Water policy updates for agriculture                                                        20     Figure 10:
   3.3. Carbon Tax                                                                                         20     Aspects of precision agriculture / smart farming                                32
		      3.3.1. Policy implications                                                                          21    Figure 11:
   3.4. Land Reform                                                                                        22     Crops surveyed using FruitLook (average 2014 – 2019)                            33
		      3.4.1. Land reform policy updates                                                                  22     Figure 12:
   3.5. International regulations                                                                          22     Other irrigation management tools used by FruitLook users                       35
		      3.5.1. Synthetic chemical bans                                                                     22     Figure 13:
4. Opportunities and barriers                                                                              24     Sector communication on new agriculture technology                              35
   4.1. Market updates for 2019                                                                            27     Figure 14:
   4.2. Market update for conservation agriculture                                                         29     Western Cape population and South African population share: 2002 – 2018         41
		      4.2.1. Regenerative agriculture                                                                    30     Figure 15:
   4.3. Precision agriculture: using remote sensing technologies for resource-efficient farming             31    GreenCape’s focus areas                                                         51
		 4.3.1. Overview                                                                                          31
		      4.3.2. Market size                                                                                 32
		      4.3.3. Case study: Fruitlook                                                                       33
		      4.3.4. Local market players providing agricultural remote sensing services                         37
		      4.3.5. Barriers and risks                                                                          37
   4.4. Urban Agriculture                                                                                  37
		 4.4.1. Overview                                                                                         37
		      4.4.2. Market size                                                                                 38
		      4.4.3. South African market players                                                                42
		      4.4.4. Barriers to the uptake of urban agriculture                                                 42
5. Funding and incentives                                                                                  44
   5.1. General database web page                                                                          44
		      5.1.1. Green Finance Database                                                                      44
		      5.1.2. Government funding and incentives database                                                  44
		      5.1.3. Finfind database                                                                            44
		      5.1.4. AlliedCrowds database                                                                       44
6. The Western Cape: Africa’s growing greentech hub                                                        46
7. GreenCape’s support to businesses and investors                                                         50
8. References                                                                                              54

iv                                                     Sustainable Agriculture: Market Intelligence Report 2020   Sustainable Agriculture: Market Intelligence Report 2020                         v
Sustainable Agriculture 2020 Market Intelligence Report
List of tables                                                                                   List of acronyms and
                                                                                                                              abbreviations
Table 1:                                                                                                       AfCFTA        African Continental Free Trade Area
Summary: Investment opportunities in sustainable agriculture for 2019/20                                  3    agtech		      Agricultural technology
Table 2:                                                                                                       APAP		        Agricultural Policy and Action Plan
Key policies and legislation                                                                             19    CA			         Conservation Agriculture
Table 3:                                                                                                       CCT		         City of Cape Town
Draft policies in SA agriculture                                                                         19    CO2e		        Carbon Dioxide Equivalent
Table 4:                                                                                                       COJ		         City of Johannesburg
Projected cost of carbon tax for fruit and wine farmers                                                  21    CSA		         Climate Smart Agriculture
Table 5:                                                                                                       DAFF		        Department of Agriculture Forestry and Fisheries
Market update for renewable energy                                                                       27    DEA		         Department of Environmental Affairs
Table 6:                                                                                                       DWS		         Department of Water and Sanitation
Market update for undercover farming (UF)                                                                28    FAO		         Food and Agriculture Organisation
Table 7:                                                                                                       FIVS		        International Federation of Wine and Spirits
Uptake of FruitLook over time                                                                           33     GHG		         Greenhouse gas
Table 8:                                                                                                       Ha			         Hectare
Estimated and potential market size for select commodities based on FruitLook                           34     IGDP		        Integrated Growth and Development Plan
Table 9:                                                                                                       IPW		         Integrated Production of Wine
Global market uptake of selected UA components                                                          38     IRP		         Integrated Resource Plan
                                                                                                               JHB		         Johannesburg
                                                                                                               kWH		         Kilowatt-hour
                                                                                                               LRAD		        Land Redistribution for Agricultural Development
                                                                                                               MWp		         Megawatt peak
                                                                                                               NDC		         Nationally Determined Contribution
                                                                                                               NDP		         National Development Plan
                                                                                                               NEMA		        National Environmental Management Act
                                                                                                               NGP		         New Growth Path
                                                                                                               OIV		         International Organisation of Vine and Wine
                                                                                                               PA			         Precision agriculture
                                                                                                               PLAS		        Proactive Land Acquisition Strategy
                                                                                                               SA			         South Africa
                                                                                                               SPLAG		       Settlement Production Land Acquisition Grant
                                                                                                               UA			         Urban Agriculture
                                                                                                               UAV		         Unmanned Arial Vehicle
                                                                                                               UN			         United Nations
                                                                                                               WC		          Western Cape
                                                                                                               WCDoA         Western Cape Department of Agriculture
                                                                                                               WCWSS         Western Cape Water Supply System
                                                                                                               WMA		         Water Management Area
                                                                                                               WUA		         Water Use Association
                                                                                                               WWF		         World Wide Fund for Nature

vi                                                  Sustainable Agriculture: Market Intelligence Report 2020   Sustainable Agriculture: Market Intelligence Report 2020         vii
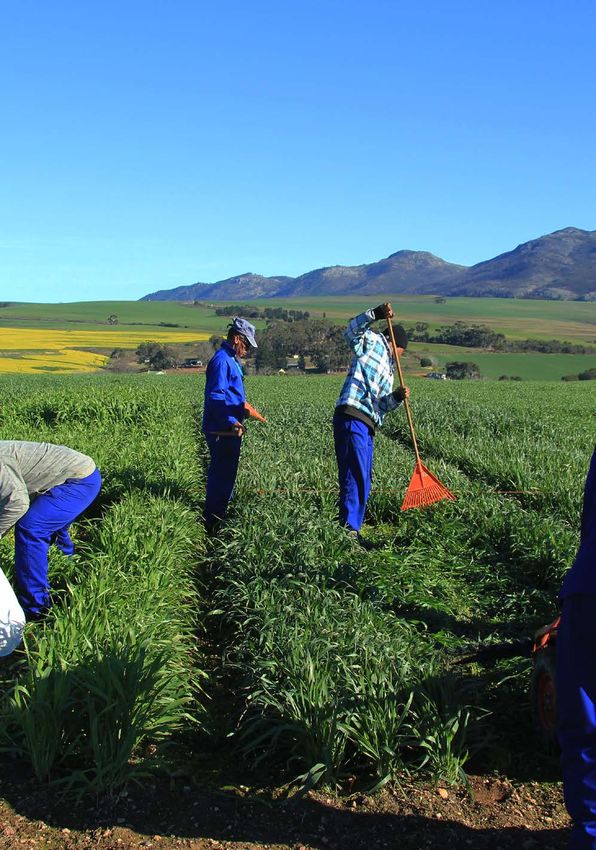
Sustainable Agriculture 2020 Market Intelligence Report
Executive summary
      The South African and Western Cape agriculture sectors offer numerous
    opportunities for investors, agricultural and green technology manufacturers,
           service providers, distributors, and others in the value chain.

Primary agriculture contributed a relatively small      These trends, as well as rising input costs of             ■   Undercover farming (UF): The potential market          The main drivers of these opportunities are:
share of the total GDP (2.6% in 2018) in South          conventional inputs, contribute to emerging                    for low-tech UF in SA is estimated at
Africa (SA), but is significant in terms of providing   investment opportunities in:                                   R38 billion, and R1.9 billion in the WC. There         ■   rising input costs for energy (particularly
employment and earning foreign exchange.                                                                               has been a significant increase in UF in the               electricity and diesel), fertiliser and pesticides;
However, when taking into account the whole             ■   remote sensing technologies for precision                  WC over the past five years. Shade netting has
agricultural value chain, the sector is estimated           agriculture applications (driven specifically              increased by 171% from 2013 to 2018 in terms of        ■   increasing awareness of sustainable
to contribute about 12% of the national GDP.                to improve water efficiency and                            area under production. The number of tunnel                practices and technologies available,
                                                            climate adaptation);                                       structures has increased by 55% for the same               as well as their benefits;
Water availability is a key driver for the uptake of                                                                   time period. The market for medium- to
agricultural technology (agtech) in SA. SA is a         ■   urban agriculture, with hydroponic production              high-tech systems in South Africa is worth             ■   climate change, forcing the sector to adopt
semi-arid country, with limited land suitable for           specifically still emerging;                               more than ~R1 billion. UF provides numerous                more sustainable practices to increase its
rain-fed agriculture production. This makes water                                                                      opportunities for suppliers and manufacturers              resilience; climate change also exacerbates
a key constraint to agricultural development.           ■   undercover farming, which includes low-tech                of UF components as well as consultants,                   water scarcity through increasing evaporation
                                                            infrastructure such as shade netting and                   especially in high-tech UF.                                and recurrence of droughts;
South Africa, in particular the Western Cape                higher-tech controlled environment
(WC), experienced one of the worst droughts on              agriculture systems; and                               ■   Renewable energy: The market for renewable             ■   detrimental environmental effects
record from 2014/15 – 2017/18, which resulted in                                                                       energy in agriculture is estimated to be 90 MW             associated with conventional (i.e. traditional)
water restrictions and large economic losses. The       ■   well-established investment opportunities in               in terms of installed capacity, a market of                inputs and practices, specifically pollution
drought, together with other factors such as loss           renewable energy and conservation agriculture.             between R945 million and 1.5 billion in 2019.              and soil degradation, leading to lower
of and diminishing returns on arable land due to                                                                                                                                  production yields, loss of arable land, and
conventional farming practices, climate change,         ■   Remote sensing applications for precision              ■   Conservation agriculture (CA): The estimated               reduced resilience;
and population growth, has put the long-term                agriculture: There are emerging opportunities              market size for no-till machinery in SA ranges
resilience of the agricultural sector into focus.           for companies offering bespoke services in                 from R136 million to R747 million, based on the        ■   decreasing costs of greentech, such as solar
The uptake of sustainable technologies and                  aerial-data analytics for farmers. The current             current uptake of farmers who are practising               panels; and
practices are crucial for the continuity of                 market estimate for irrigated agriculture in the           CA. There are further emerging opportunities
the sector.                                                 WC is R37.5 million/year.                                  for organisations in regenerative agriculture          ■   scarce natural resources (particularly arable
                                                                                                                       (RA), such as certification bodies, technical              land and water) that are primarily affected by
Other important trends in sustainable agriculture       ■   Urban agriculture (UA): Specifically                       consultancies, environmental NPOs, research                climate and farming practices.
production include international market pressure            hydroponic production is still emerging. A                 institutions, carbon offset companies, and
for low carbon, environmentally friendly products,          conservative estimate for the market of                    bioproduct manufacturers.
and international regulations on the use of                 rooftop hydroponic production is R2.59 million
synthetic chemicals.                                        to R3.94 million, based on current installations
                                                            by largest market player.

1                                                       Sustainable Agriculture: Market Intelligence Report 2020   Sustainable Agriculture: Market Intelligence Report 2020                                                         2
Sustainable Agriculture 2020 Market Intelligence Report
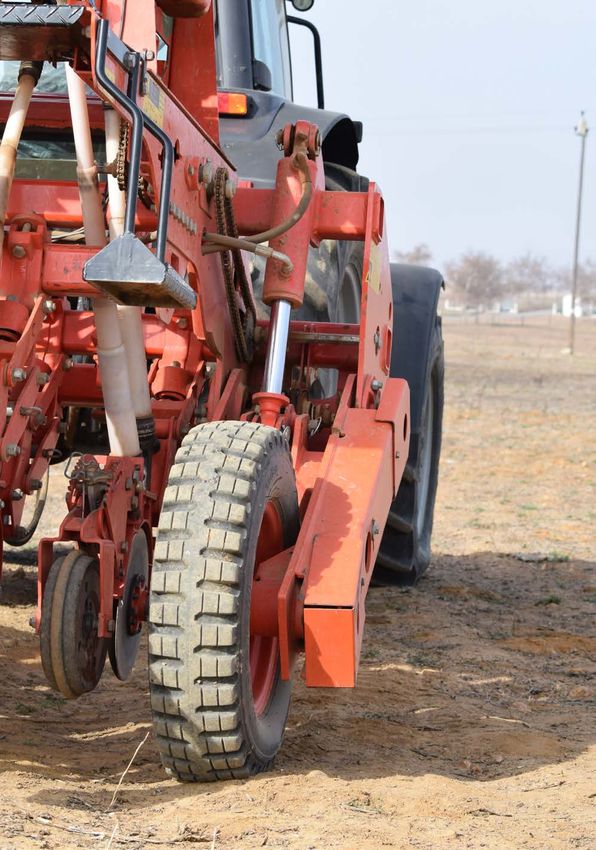
Table 1: Summary: Investment opportunities in sustainable agriculture for 2019/20

                                                       Requirement                                                                           ■   Resource scarcity,        Barriers highlighted by      Medium    Globally, agriculture
    Opportunity            Key drivers                                           Term       Macro environment                                                              current players in the       to long   is the least digitised
                                                         & barrier                                                                               particularly water
                                                                                                                                                 availability              field includes:              term      sector (throughout its
                    ■   Rising electricity       ■   Strong business case       Short to   SA was the fastest                                ■   Global                    ■ The mind-set change                  value chain) and thus
                        tariffs                      for large (e.g. cold       medium     grower of solar                                       competitiveness and          required by farmers to              technology-based
                    ■   Security of energy           storage) and               term       photovoltaic (Solar                                   economies of scale           adopt new farm                      decision-making
                        supply                       year-round energy                     PV) installations in                              ■   Technological                management                          is still emerging.
                                                                                                                         Precision
                    ■   Increasing ability to        users                                 2017 globally. An                                     advances in drone,           technologies.
                                                                                                                         agriculture
    Renewable           feed back into the       ■   Seasonal nature                       estimated 10% of all                                  satellite and             ■ A lack of integration                Remote sensing
                                                                                                                         (remote
    energy (solar       grid                         of agriculture                        solar PV installations                                information                  between various                     applications is an
                        Decreasing cost of           production affects                    are in the agricultural       sensing
    photovoltaic)   ■                                                                                                                            communication                disciplines.                        emerging market in
                        technology                   the business case                     sector, and the business      applications)           technology and            ■ The inclusion of the                 SA’s agriculture sector,
                    ■   Innovative finance                                                 case is well known to                                 the Internet of              end user in developing              with the exception of
                        options                                                            the industry.                                         Things (IoT).                software solutions,                 GPS guidance for
                    ■   Corporate social                                                                                                                                      which results in                    tractors.
                        responsibility (CSR)                                                                                                                                  limited understanding
                                                                                                                                                                              of the end user’s
                    ■   The main driver is       ■   High cost of               Medium     Globally, the uptake of                                                            actual needs.
                        soil degradation             equipment                  to long    CA is high, particularly
                        resulting from           ■   Long-term return on        term       in South America. Only                            ■   Resource scarcity         ■   Enabling municipal       Long      Urban agriculture
                        conventional tillage         investment when                       15% to 20% of                                     ■   Urbanisation                  support environment,     term      (UA) growth is the
                        and subsequently             converting from                       commercial grain                                  ■   Advances in                   such access to water               largest in Asian
    Conservation        diminishing returns on       conventional to                       farmers and 5% of                                     technology,                   and space.                         countries characterised
                        land, due to factors         conservation                          smallholder farmers in                                specifically              ■   Access to finance for              by high-density urban
    agriculture
                        such as decreased            practices                             SA have adopted CA.                                   hydroponic systems            technology                         populations. In
    (no-till
                        moisture-holding         ■   Sustainable farm                                                                            and LED lighting              infrastructure                     particular, vertical
    planting            capacity and                 management                                                                              ■   Consumer                  ■   Lack of technical                  farming production,
    equipment)          biological functions         practices such as                                                                           preferences for locally       knowledge                          as it uses space
                                                     crop rotation and                                                                           produced food             ■   Business case not well             more efficiently
                                                     permanent soil cover                                                Urban               ■   Waste minimisation            established                        than flat structures.
                                                     play an important role                                              agriculture                                                                              Commercially
                                                     to improve the                                                      (hydroponic                                                                              viable production
                                                     business case                                                       production)                                                                              of agricultural produce
                                                                                                                                                                                                                  in SA’s urban
                    ■   Resource scarcity        ■   High capital cost with     Low-       Greenhouses are well                                                                                                   environments is still in
                    ■   Increased yields and         limited financing          tech       established globally.                                                                                                  its infancy. Various
                        quality                      options                    systems:   SA, as with most                                                                                                       factors, such as
                    ■   Providing products       ■   High cost of electricity   Short to   developing countries,                                                                                                  spacing, scale, product
                        out of season                affects viability of       medium     has been very slow to                                                                                                  demand and market
                    ■   Climate change               controlled                 term       adopt greenhouse                                                                                                       access needs to be
                    ■   Technological                environment systems                   technology, and is                                                                                                     better understood to
    Undercover          advances in LED          ■   Business case not well     High-      estimated to be 50                                                                                                     create successful
    farming             lighting                     established for            tech       years behind developed                                                                                                 enterprises.
    (various                                         high-tech systems          systems:   European countries
    technologies)                                ■   Lack of technical          Long       such as the
                                                     knowledge                  term       Netherlands.

                                                                                           Low-tech systems such
                                                                                           as netting and tunnels
                                                                                           are growing rapidly,
                                                                                           particularly for high
                                                                                           value export fruits.

3                                                            Sustainable Agriculture: Market Intelligence Report 2020   Sustainable Agriculture: Market Intelligence Report 2020                                                           4
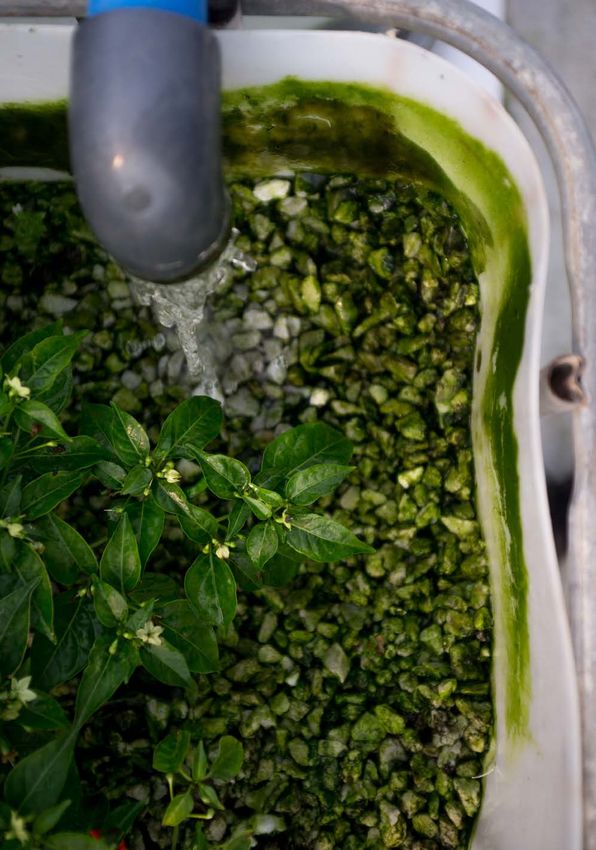
Sustainable Agriculture 2020 Market Intelligence Report
1
                                                                                                                        Introduction and purpose
                                                                                                                             This market intelligence report (MIR) has been compiled by GreenCape’s
                                                                                                                            Agriculture Sector Desk. It highlights opportunities for greening agriculture
                                                                                                                               production and is written for investors, with a focus on new investors
                                                                                                                                           exploring the South African agtech1 market.

                            What’s new?
                                                                                                                    1

                                                                                                                    GreenCape’s Agriculture Sector Desk was                                   The main focus in this MIR is on remote sensing
                                                                                                                    established in 2014 in partnership with the                               applications for precision agriculture (PA) and
                                                                                                                    Western Cape Department of Agriculture                                    urban agriculture (UA). Updates are provided on
                                                                                                                    (WCDoA). The desk aims to support the                                     the areas explored in detail in the 2019 MIR:
The 2019 Sustainable Agriculture MIR discussed the economic impacts of external factors on the sector,              development of sustainable and competitive                                undercover farming, renewable energy and
particularly the Western Cape drought (2015 – 2018). The industry’s response to the drought was an                  agricultural value chains through the uptake of                           conservation agriculture.
important indicator of the level of resilience of the agricultural sector.                                          agricultural technology (agtech) and sustainable
                                                                                                                    production practices. This is achieved by raising                         In what follows, there is a sector overview
The 2020 Sustainable Agriculture MIR looks toward longer-term trends and investments for sector                     awareness of the benefits of agtech uptake                                (Section 2) that provides a national and provincial
resilience, particularly in the light of climate change scenarios (such as more frequent and severe                 (i.e. driving demand within agriculture), and                             economic overview of agriculture with the focus on
weather events), resource scarcity (particularly water), and the global factors (such as synthetic chemical         highlighting opportunities for agtech investors,                          macro-economic trends and key players. This is
bans). These long-term trends include:                                                                              manufacturers, and service providers                                      followed by an overview of policies and regulations
                                                                                                                    (i.e. supporting supply).                                                 (Section 3) that guide and affect investors in the
■   The movement towards regenerative agriculture production for long-term sustainability of soil health                                                                                      agriculture sector. Key opportunities, trends and
    through increasing water-holding capacity, soil carbon, soil organic matter, and microbial activity.            This MIR provides updates on key issues and                               barriers are highlighted (Section 4). The final
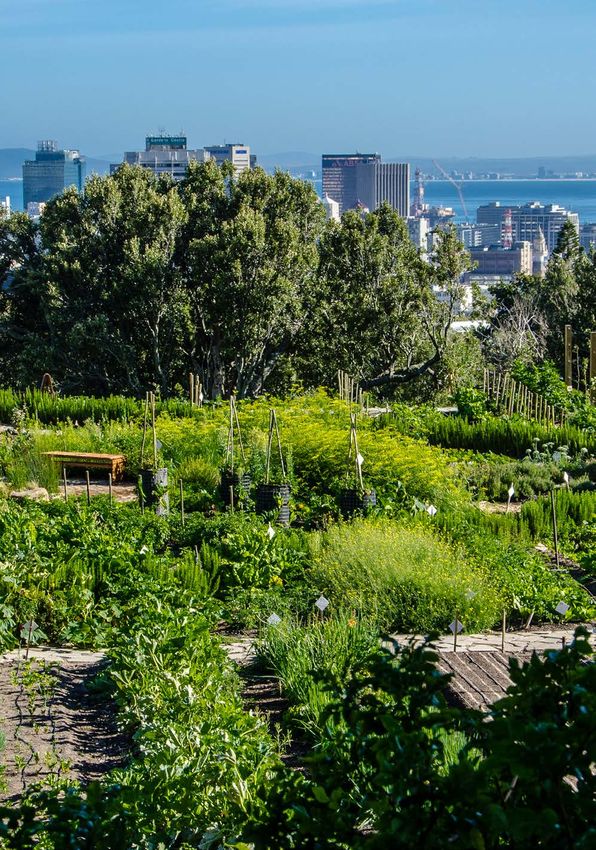
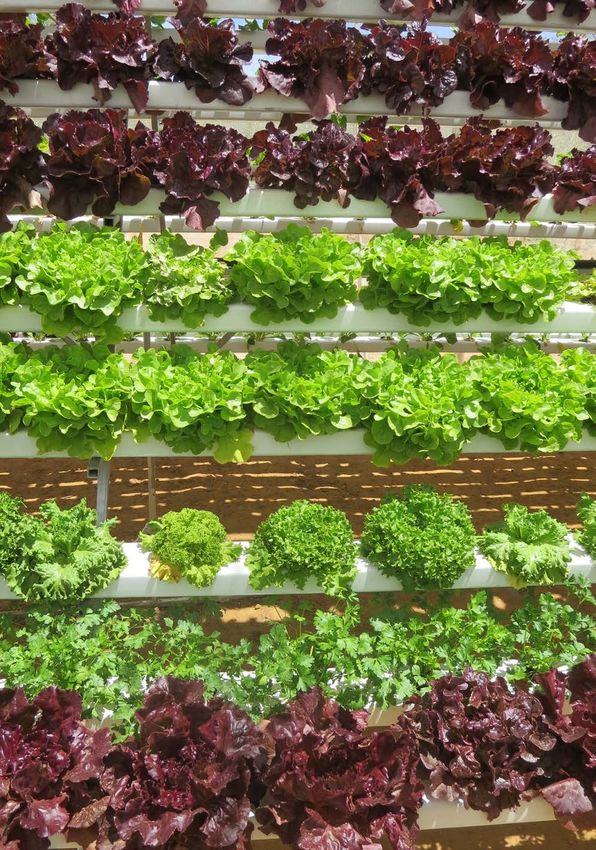
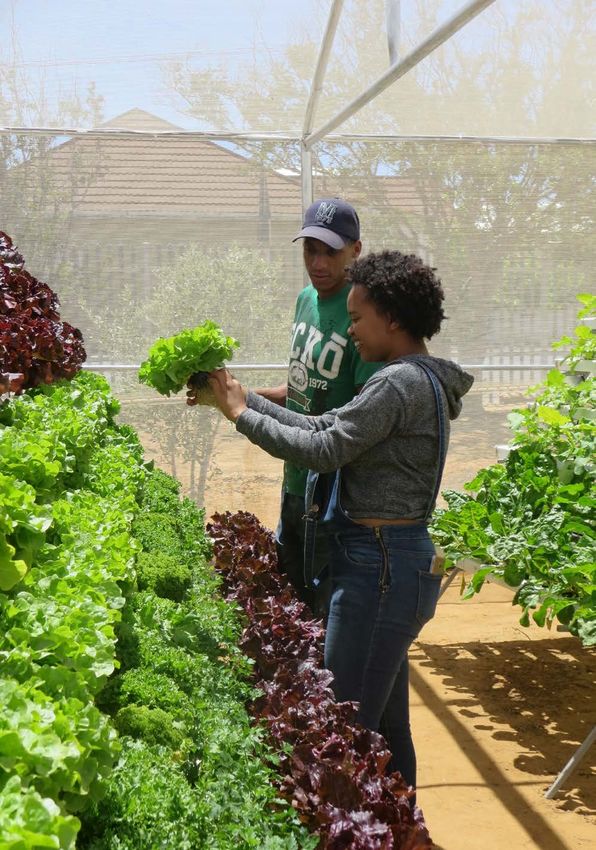
■   The emergence of urban agriculture production, particularly hydroponic rooftop production,                      opportunities identified in previous MIRs, and                            sections provide information on available finance
    resulting from a need for alternative food supply systems due to resource scarcity and urbanisation.            highlights new opportunities related to                                   and incentives (Section 5), present the case for the
■   The role of corporate social responsibility (CSR) in sustainable investments in the sector.                     technologies and practices that:                                          Western Cape as Africa’s emerging greentech hub
                                                                                                                                                                                              (Section 6), and explain GreenCape’s work in the
Another addition to this year’s report is a section on general sustainability initiatives / investments             ■     increase input resource efficiency in primary                       green economy (Section 7).
undertaken by various agricultural industry players to give the reader an understanding of the                            production;
sustainability environment in SA.                                                                                   ■     benefit the environment, primarily by                               For assistance, or if you have any questions after
                                                                                                                          conserving resources, reducing negative                             reading this MIR, please contact the agriculture
The MIR further investigates key developments for remote sensing applications for precision agriculture                   impacts such as soil degradation and pollution;                     team on telephone +27 (0)21 811 0250 or email
by presenting a case study of technology uptake and trends based on FruitLook data.                                 ■     increase resilience to climate change; and                          agri@greencape.co.za.
                                                                                                                    ■     have the potential to attract international
The MIR also discusses, for the first time, emerging opportunities in urban agriculture in South Africa,                  investment.
specifically hydroponic production.

For new readers, we advise that you first read the 2019 Agriculture MIR for an in-depth understanding of
established opportunity areas.

                                                                                                        caption     1
                                                                                                                        AgTech represents the application of technology – especially software and hardware technology – to the field of farming.

5                                                        Sustainable Agriculture: Market Intelligence Report 2020   Sustainable Agriculture: Market Intelligence Report 2020                                                                       6
Sustainable Agriculture 2020 Market Intelligence Report
2
                                                                                     Sector overview
                                                                        This section provides an overview of the South African and Western
                                                                     Cape agricultural sectors. It includes an overview of the sector’s structure,
                                                                       macro-economic trends, key players, and drivers of green technology
                                                                                           and practices in agriculture.

                                                               2.1. Physical geography and climate
                                                               SA is a resource scarce country and classified as semi-arid. The country’s land cover (in total

                                                               54+20+13111
                                                               122 million hectares) and select land use classifications are illustrated in Figure 1 below (DAFF 2013a).

                                                                                                54%     FOREST, WOODLAND, PLANTATIONS & OTHER
                                                                                                20%     GRASSLANDS
                                                                                                13%     MINES, BARE & DEGRADED LAND
                                                                                                 11%    CULTIVATED COMMERCIAL & SUBSISTENCE LAND
                                                                                                 1%     WATER BODIES AND WETLANDS
                                                                                                 1%     SETTLEMENTS

                                                               87+6+32
                                                                                                88%     COMMERCIAL: NON-PIVOT
                                                                                                 6%     COMMERCIAL: PIVOT
                                                                                                 3%     COMMERCIAL PERMANENT ORCHARDS
                                                                                                 2%     COMMERCIAL PERMANENT VINES
                                                                                                 2%     SUBSISTENCE CROPS

                                                               Figure 1: South Africa’s land cover and select land use classifications

                                                               Only ~11% of land in SA is considered arable, of which 3% is truly fertile soil. A mere 1% has the right
                                                               climate and soil combinations for rain-fed crops. Water availability for irrigation is thus vital for the
                                                               sector and the largest limiting factor in production. SA is ranked as the 30th driest country globally.
                                                               Water availability is under further pressure from climate change and increased competition due to
                                                               population growth.

                                                               SA has a wide range of agro-climatic regions, as shown in Figure 2 (FAO 2010). Climatic regions
                                                               include Mediterranean, subtropical and semi-desert, enabling the production of a wide range of
                                                               agricultural commodities.

          © Western Cape Department of Agriculture

7   Sustainable Agriculture: Market Intelligence Report 2020   Sustainable Agriculture: Market Intelligence Report 2020                                                    8
Sustainable Agriculture 2020 Market Intelligence Report
Recent years have seen significant increases in            Technologies and practices that make the sector
                                                                                                                 the area under production of high-value export             more resilient and sustainable are discussed in
                                                                                                                 crops. Growth in production area was seen from             Section 4 of this report.
                                                                                                                 the WCDoA’s census data for citrus (35%), berries
                                                                                                                 (33%), sub-tropical fruits (21%), and nuts (79%)           2.2. Overview of the agricultural
                                                                                                                 from 2013/14 to 2017/18. This growth is largely due        economy
                                                                                                                 to an increase in consumer demand for healthy              This section provides an overview of the
                                                                                                                 foods, especially by Millennials and Generation Z,         agricultural economy in SA and the WC, with a
                                                                                                                 who are willing to pay a premium for such                  focus on the sector’s economic contribution,
                                                                                                                 products (Forbes 2019).                                    value of commodities, and production trends.

                                                                                                                                                                            2.2.1. South African agriculture
                                                                                                                                                                            The South African agricultural economy has seen
                                                                                                                 There has been an exponential                              decent growth over the past decade, albeit with
                                                                                                                 rise in the WC in the production of                        some difficult periods that have stifled growth.
                                                                                                                 high-value crops between 2013 and                          Figure 4 below reveals the performance of the
                                                                                                                                                                            agricultural economy, showing trends for both
                                                                                                                 2018, in citrus, berries, tropical fruits,
                                                                                                                                                                            the agricultural gross domestic product (GDP)
                                                                                                                 and nuts.                                                  and net farm income (NFI) in South Africa. The
                                                                                                                                                                            declines registered between 2015 and 2016 are
                                                                                                                                                                            mainly attributed to the drought in the summer
                                                                                                                                                                            rainfall region. The most recent decline in 2018 is
Figure 2: South African agricultural regions                                                                     Growth in export crops is an important trend in            also due to drought conditions experienced in the
                                                                                                                 terms of sustainable agriculture, as international         Western Cape, with the resultant income losses.
                                                                                                                 market pressure for low-carbon, environment-               Several other factors affecting below-average
2.1.1. Western Cape agriculture                                                                                  friendly products is an increasingly important             growth in the sector have been caused by animal
Fruit production dominates agricultural production in the WC (see Figure 3), with a large percentage of          driver for the uptake of practices and                     disease outbreaks. For instance, in June 2017,
these considered high value and destined for export markets. Grains in the WC is mostly under dryland            technologies that reduce the use of chemicals,             Highly Pathogenic Avian Influenza started

                                                      51+18+976
production. All fruit production is under irrigation.                                                            and a product’s carbon and water footprint.                spreading in the South African chicken industry,
                                                                                                                 Sustainability drivers are further discussed in            which ultimately led to the compulsory culling
                                                                                                                 Section 2.4 of this report.                                of 70% of all layer birds in the Western Cape.
             Crop type              Crop (ha)

    Grains, oil seeds and lupines    531 806                                                                     The long-term resilience of the sector has
                                                                                         51%     WINE GRAPES
                                                                                                                 drawn a lot of attention in recent years,
            Vegetables               16 597                                              18%     POME FRUIT
                                                                                                                 especially in the light of:                                    Although the Western Cape has the
                                                                                          9%     STONE FRUIT     ■ climate change predictions that the province
                Fruit                180 115
                                                                                          9%     CITRUS
                                                                                                                                                                                largest area under irrigation in South
                                                                                                                    will experience a 50% decrease in rainfall by
                Nuts                 12 198                                               7%     TABLE GRAPES       2050, as well as more frequent and severe
                                                                                                                                                                                Africa, it also has the lowest water use
               Other                 59 669                                               6%     OTHER              weather events such as floods and droughts;                 per area unit showing that efficiency
                                                                                                                 ■ large output and job losses due to the drought               measures have already been put in
               Total                 789 316
                                                                                                                    (2015 – 2018); and                                          place (WWF, 2018).
                                                                                                                 ■ decreasing return on soil due to conventional

Figure 3: Proportion of agricultural commodities produced in the WC                                                 production practices.

                                                                                                                 It should be noted that although the Western               The recent outbreak of foot-and-mouth disease
                                                                                                                 Cape has the largest area under irrigation (269            in 2019 has led to restrictions on exports and
                                                                                                                 476 ha) in South Africa, it also has the lowest            movement of animals to be sold to abattoirs.
                                                                                                                 water use per area unit (5 874 m3/ha). This shows          Finally, the current policy uncertainty with regard
                                                                                                                 that efficiency measures have already been put             to land ownership and the potential impact of
                                                                                                                 in place (WWF, 2018). This indicates that there is         expropriation without compensation is
                                                                                                                 awareness of the importance of using water                 hampering investment in the sector.
                                                                                                                 efficiently, making it a good investment
                                                                                                                 destination for efficient irrigation technology.

9                                                     Sustainable Agriculture: Market Intelligence Report 2020   Sustainable Agriculture: Market Intelligence Report 2020                                                    10
Sustainable Agriculture 2020 Market Intelligence Report
100                                                                        25                                      Although primary agriculture, including                                                                 This growth means that the trade balance has
                                                                                                                                                      downstream agricultural value-added activities                                                          also increased, although imports also expanded
                                   90
                                                                                                                                                      known as the agri-processing sector, contributed                                                        during the same period.
                                                                                                                                                      a relatively small share of the total South African
                                   80                                                                         20
                                                                                                                                                      economy (2.6%) in 2018, its contribution has since                                                      An exciting new development for agricultural
                                                                                                                                                      increased to 7%. However, when considering the                                                          trade is the African Continental Free Trade Area

                                                                                                                    Real Net Farm Income (Billions)
Real Agricultural GDP (billions)

                                   70
                                                                                                                                                      impact these two sectors have on employment                                                             (AfCFTA), which is outlined in the African
                                                                                                                                                      and in generating foreign earnings in export                                                            Continental Free Trade Agreement. The
                                   60                                                                         15
                                                                                                                                                      markets, it is clear that the economy is                                                                agreement was brokered by the African Union
                                   50
                                                                                                                                                      dependent on well-functioning and sustainable                                                           (AU) and signed in March 2018 by 44 of the 55 AU
                                                                                                                                                      agricultural value chains. Figure 5 elaborates on                                                       member states. In terms of the AfCFTA
                                   40                                                                         10                                      the trade performance of agricultural and related                                                       agreement, 90% of all traded goods between
                                                                                                                                                      products since 2001. South African agricultural                                                         African countries will be traded at zero tariffs. It is
                                   30                                                                                                                 exports have performed well, growing from                                                               expected that this free trade area will unlock new
                                                                                                                                                      R48 billion to more than R144 billion in the past                                                       opportunities for the South African agricultural
                                   20                                                                         5                                       decade, which is equivalent to an average annual                                                        sector to expand existing trade and open up new
                                                                                                                                                      growth of 11.5%.                                                                                        market opportunities on the continent.
                                    10

                                         22+17+1510986432
                                    0                                                                         0
                                                                                                                                                                                             160
                                   20 1
                                           _3

                                   20 1
                                           _3

                                   20 1
                                           _3

                                   20 1
                                           _3

                                    20 1
                                           _3

                                     20 1
                                             3
                                            _1

                                           _3

                                    20 1
                                           _3

                                    20 1
                                           _3

                                    20 1
                                           _3

                                    20 1
                                           _3

                                    20 1
                                           _3

                                    20 1
                                           _3

                                            _1
                                            _

                                            _

                                            _

                                            _

                                            _

                                          11_

                                            _

                                            _

                                            _

                                            _

                                            _

                                            _
                                         11_
                                       06

                                        07

                                       08

                                       09

                                        10

                                         12

                                         13

                                         14

                                         15

                                         16

                                         17

                                         18

                                         19
                                       06

                                       07

                                       08

                                       09

                                       10

                                        12

                                        13

                                       14

                                        15

                                       16

                                        17

                                        18
                                      20

                                     20
                                     20

                                     20

                                     20
                                     20

                                     20

                                     20
                                     20
                                    20

                                    20
                                    20

                                    20
                                   20

                                   20

                                                                                                                                                                                             140

                                                                                                                                                         Value of Trade in Rand (billions)
                                           Agricultural GDP                          Net Farm Income
                                                                                                                                                                                             120

                                                                                                                                                                                             100
                                                                             22%     FINANCE
                                                                             17%     GOVERNMENT                                                                                              80

                                                                             15%     TRADE
                                                                                                                                                                                             60
                                                                             10%     TRANSPORT
                                                                             9%      OTHER MANUFACTURING
                                                                                                                                                                                             40
                                                                             8%      MINING
                                                                             6%      SOCIAL SERVICES                                                                                         20

                                                                             4%      AGRI PROCESSING
                                                                                                                                                                                              0
                                                                             4%      CONSTRUCTION

                                                                                                                                                                                                     01

                                                                                                                                                                                                            02

                                                                                                                                                                                                                   03

                                                                                                                                                                                                                          04

                                                                                                                                                                                                                                 05

                                                                                                                                                                                                                                        06

                                                                                                                                                                                                                                               07

                                                                                                                                                                                                                                                      08

                                                                                                                                                                                                                                                             09

                                                                                                                                                                                                                                                                    10

                                                                                                                                                                                                                                                                           11

                                                                                                                                                                                                                                                                                  12

                                                                                                                                                                                                                                                                                         13

                                                                                                                                                                                                                                                                                                14

                                                                                                                                                                                                                                                                                                       15

                                                                                                                                                                                                                                                                                                              16

                                                                                                                                                                                                                                                                                                                     17

                                                                                                                                                                                                                                                                                                                            18
                                                                                                                                                                                                                                                                         20

                                                                                                                                                                                                                                                                                                                   20
                                                                                                                                                                                                                                                                                20

                                                                                                                                                                                                                                                                                                     20

                                                                                                                                                                                                                                                                                                                          20
                                                                                                                                                                                                                                                                                       20

                                                                                                                                                                                                                                                                                                            20
                                                                                                                                                                                                                                                                                              20
                                                                                                                                                                                                   20

                                                                                                                                                                                                                                                                  20
                                                                                                                                                                                                                                             20
                                                                                                                                                                                                          20

                                                                                                                                                                                                                               20

                                                                                                                                                                                                                                                    20
                                                                                                                                                                                                                 20

                                                                                                                                                                                                                                      20

                                                                                                                                                                                                                                                           20
                                                                                                                                                                                                                        20
                                                                             3%      AGRICULTURE
                                                                             2%      UTILITIES
                                                                                                                                                      Figure 5: South African agricultural GDP and trade balance (ZAR billion per year)

                                                                                                                                                      2.2.2. Western Cape agriculture
                                                                                                                                                      The agricultural sector in the Western Cape is
     Figure 4: Agricultural economy and South African sectoral GDP (ZAR billion per quarter)                                                          unique compared to other growing regions in the
                                                                                                                                                                                                                                                                    The province’s agricultural value of
                                                                                                                                                      country, mainly due to the winter rainfall and                                                                production contributes to 21% of the
                                                                                                                                                      Mediterranean climate. Horticulture and grape                                                                 country’s total agricultural output,
                                                                                                                                                      production is particularly concentrated in this                                                               whilst around 44% of all exported
                                                                                                                                                      region, of which around 45% gets exported into                                                                agricultural goods comes from the
                                                                                                                                                      world markets (Hortgro, 2019). The province’s
                                                                                                                                                                                                                                                                    Western Cape.
                                                                                                                                                      agricultural value of production contributes to
                                                                                                                                                      21% of the country’s total agricultural output,
                                                                                                                                                      whilst around 44% of all exported agricultural
                                                                                                                                                      goods comes from the Western Cape. The                                                                  followed by beverages (19%), and fish and
                                                                                                                                                      characteristics of the Western Cape agricultural                                                        crustaceans (9%) (Quantec, 2019). In terms of area
                                                                                                                                                      sector are illustrated in Figure 6. It aggregates                                                       planted, wine grapes still dominate, even though
                                                                                                                                                      the exports by value for 2018 on the left, and then                                                     there has been a decline in orchards in the past
                                                                                                                                                      breaks down the area planted in hectares for                                                            several years. Pome and stone fruits make up
                                                                                                                                                      crops included under fruit and nuts. Around half                                                        around 27%, followed by citrus (9%) and table
                                                                                                                                                      of all exports comes from the fruit industry,                                                           grapes (7%) (WCDoA, 2018).

     11                                                       Sustainable Agriculture: Market Intelligence Report 2020                                Sustainable Agriculture: Market Intelligence Report 2020                                                                                                                   12
48+19+109732 50+18+9731
             Agricultural exports by value                                   Area planted for fruits & nuts
                                                                                                                             Important to note is that these exported products          ■   Input suppliers produce inputs such as
                                                                                                                             are highly labour intensive. The income                        fertiliser, seeds, pesticides, packaging, and
                                                                                                                             generated from these activities plays a                        machinery. Suppliers of green technology,
                                   48%       FRUIT & NUTS                                          50%        WINE GRAPES
                                                                                                                             significant role in contributing to the WC                     such as conservation agriculture equipment
                                    18%      BEVERAGES                                             18%        POME FRUIT
                                                                                                                             economy. In 2018, the agricultural sector                      and solar PV manufacturers, also belong to
                                    10%      OTHER                                                  9%        STONE FRUIT
                                                                                                                             contributed 4.1% to the WC economy, and another                this category.
                                     9%      FISH &                                                 9%        CITRUS         5.7% for value-add under the agri processing               ■   Technology suppliers are found across the
                                             CRUSTACEANS                                            7%        TABLE GRAPES   sector (Quantec, 2019). These two sectors employ               value chain, from inputs, production, harvesting
                                     7%      PREPARED                                               3%        OLIVES         around 297 000 workers directly on farms and in                processing, logistics and waste processing
                                             VEGETABLES                                              1%       EXOTICS        manufacturing plants, which translates to 12% of               (e.g. bio-digesters and composters).
                                     3%      OILSEEDS                                                1%       SUB-TROPICAL   the Western Cape labour force (QLFS, 2018).                ■   Industry associations are involved in all aspects
                                     2%      ANIMAL FODDER                                           1%       BERRIES                                                                       of the value chain. They support farmers and
                                     2%      CEREALS                                                 1%       NUTS           2.3. Key players                                               provide them with relevant and reliable
                                                                                                                             As shown in Figure 7, key players in the agriculture           information regarding regulations, logistics,
                                                                                                                             sector can be divided into six broad categories:               cultivar development, etc. They also do or
Figure 6: Breakdown of Western Cape exports by value and area planted for fruit & nuts                                       producers/farmers, input/technology suppliers,                 support research in various fields, including soil,
                                                                                                                             industry associations, research/academia, and                  water, production practices, and cultivars.
                                                                                                                             labour organisations. SA’s national agriculture            ■   Research institutions like universities
                                                                                                                             department, the Department of Agriculture, Land                investigate all aspects of the value chain.
                                                                                                                             Reform and Rural Development (DALRRD), governs             ■   Labour organisations provide support for
                                                                                                                             the whole industry.                                            employees in the agricultural sector by
                                                                                                                             ■ Producers/farmers produce commodities                        assisting them in attaining the best possible
                                                                                                                                and in most cases do their own harvesting,                  financial and social position in all employment
                                                                                                                                storage, and transport.                                     positions along the entire value chain.

                                                                                                                              R&D       Inputs      Production     Harvesting     Storage    Transport   Processing     Wholesale,    Waste
                                                                                                                                                                                                                         retail &
                                                                                                                                                                                                                         exports

                                                                                                                                                                                Government

                                                                                                                                                                                  Producer

                                                                                                                                                                          Research institutions

                                                                                                                                    Input
                                                                                                                                  suppliers

                                                                                                                                                                          Technology suppliers

                                                                                                                                                                          Industry associations

                                                                                                                                                                          Labour organisations

                                                                                                                             Figure 7: Key role players in agriculture

                                                                                                               © WCDoA

13                                                           Sustainable Agriculture: Market Intelligence Report 2020        Sustainable Agriculture: Market Intelligence Report 2020                                                         14
Key role-players for various agtech opportunities                    ■   The Wide Fund for Nature (WWF) engages with                   2.4. Drivers of sustainable                                               ■   Increasing awareness of sustainable
are discussed in detail in Section 4.                                    farmers in the Western Cape, KwaZulu-Natal,                   technologies and approaches                                                   practices and technologies available, as well
                                                                         Mpumalanga, Limpopo, and southern Cape,                       in agriculture                                                                as their benefits.
2.3.1. Sustainability initiatives and                                    helping them improve land use planning,                       The key drivers of sustainable technology and                             ■   The international regulatory environment,
investments by value chain players                                       production efficiency, and responsible farming                innovation in the sector are:                                                 especially synthetic chemical bans and
This section explores general sustainability                             practices. This is achieved by developing best                                                                                              stricter environmental regulation (discussed
initiatives undertaken by industry stakeholders. It                      practice guidelines and standards, and                        2.4.1. Environment                                                            further in Section 3). This has been the main
aims to illustrate that broader sector role-                             helping impact sectors understand what                        ■   Climate change, forcing the sector to adopt                               driver for the increased uptake of biocontrol3,
players, such as retailers, financiers and                               sustainable farming entails.                                      more sustainable practices to increase its                                which is predicted to grow at a significantly
government, are aware of the importance of                                                                                                 resilience. Climate change also exacerbates                               higher compounded annual growth rate
sustainable and resilient production through                         ■   Blue North’s Confronting Climate Change                           water scarcity through increasing evaporation                             (CAGR) compared to conventional pesticides.
actively supporting and/or investing in the                              (CCC) initiative was developed to support South                   and recurring drought.                                                    It has increased from 2% to approximately 8%
primary sector. These include:                                           African fruit and wine farmers. It is a carbon                ■   Scarce natural resources (particularly                                    of the market over the past few years.
■ Woolworth’s Farming for the Future initiative.                         footprinting project that identifies the risks and                arable land and water) that are primarily                             ■   Corporate social responsibility is playing an
    The initiative is about saving water, improving                      opportunities associated with carbon emissions.                   affected by climate, farming practices, and                               increasingly important role in investment
    soil quality, and working with nature. The goal                      The CCC initiative includes an online carbon-                     population growth.                                                        decisions. A recent example of this is Diageo,
    is to grow quality produce while minimising                          footprinting platform, a series of regular                    ■   Detrimental environmental effects associated                              one of the world's largest producers of spirits
    any negative effect on the environment, and                          industry engagement workshops, a range of                         with conventional (i.e. traditional) inputs                               and beers. It has committed to investing $219
    reducing farmers' dependence on chemical                             commodity-specific industry benchmark                             and practices, specifically pollution                                     million (R3.2 billion) in upgrades at 11 of its
    products. Certification includes assessing the                       reports, and up-to-date and relevant energy                       and soil degradation, leading to lower                                    breweries in Africa. This investment will deliver
    management of soil minerals and microbes,                            and emissions-related news and information.                       production yields, loss of arable land,                                   new solar energy, biomass power, and water
    pests, plants, biodiversity, irrigation, and                                                                                           and reduced resilience.                                                   recovery initiatives at 11 sites in seven
    wastewater. Woolworth’s food business                            ■   LandCare is a specialised service of the                                                                                                    countries, including Kenya, Uganda, Tanzania,
    achieves a 20 per cent share in national fresh                       Western Cape Department of Agriculture’s                      2.4.2. Industry cost structure                                                South Africa, Seychelles, Nigeria and Ghana.
    produce sales in South Africa (PMA 2017).                            Farmer Support and Development program.                       ■   Rising input costs for energy (particularly                               This is believed to be one of the biggest single
                                                                         LandCare is involved in multiple projects,                        electricity and diesel), fertiliser, and pesticides.                      investments in addressing climate change
■    Nedbank has made various investments into                           including clearing of alien invasive species,                 ■   Decreasing costs of cleantech such as                                     issues across multiple sub-Saharan markets.
     the sector. Most notably it contributed to:                         which is crucial for water availability. Alien                    solar panels.                                                             The business stated that it has a responsibility
     ■ Aerobotics, an aerial imaging and analysis                        clearing not only improves sustainable water                                                                                                as a local manufacturer and employer in
     		 company that provides early warning                              use in agriculture, but also creates jobs in rural            2.4.3. Market pressure and readiness                                          Africa to grow its business sustainably.
     		 systems to farmers;                                              areas. To date, an estimated 216 farmers have                 ■   Market pressure driving stricter regulations,
     ■ the first commercial floating solar PV                            benefited from these projects. Another                            particularly for chemical usage, through
     		 system in Africa on a fruit farm in                              initiative, FruitLook, is discussed in detail in                  increasing consumer demand for
     		 South Africa;                                                    Section 4 of this report.                                         sustainable products.
     ■ the bank's recently launched innovative

     		 funding plan to assist farmers with the                      ■   Stellenbosch Wine Routes2 has signed the
     		 installation of shade netting in orchards for                    Porto Protocol – a global sustainable initiative
     		 protection against wind, hail, frost,                            signed by companies across numerous
     		 sunburn, and birds; and                                          industries – in an effort to commit itself to
      ■ safeguarding critical water source areas,                        making an accelerated contribution towards
     		 biodiversity hotspots and rural livelihoods.                     climate change mitigation. The Porto Protocol
     		 Money (R25 million) will be spent in                             was launched by former US President Barack
     		 partnership with the World Wide Fund for                         Obama in 2018. Stellenbosch Wine Routes
     		 Nature(WWF), with which they have                                became the first southern hemisphere wine
     		 collaborated for the past eight years to                         region to join the ranks of global signatories.
     		 support sustainable farming across SA.
     		 This forms part of the next 5-year plan.

2                                                                                                                                      3
  Stellenbosch Wine Routes represent more than 200 wine and grape producers within the boundaries of the Stellenbosch Wine of Origin     Biocontrol is the control of pests by interference with their ecological status, e.g. by introducing a natural enemy or a pathogen into the
classification.                                                                                                                        environment.

15                                                                    Sustainable Agriculture: Market Intelligence Report 2020         Sustainable Agriculture: Market Intelligence Report 2020                                                                                    16
3
                                                                    Policies and regulations
                                                                     South Africa has an extensive and robust range of policies and regulations
                                                                                    governing the country’s agricultural sector.

                                                                3.1. South Africa’s agricultural                           development of the agricultural sector in South
                                                                policies and regulations                                   Africa. Support by the DALRRD and DEFF is
                                                                This section outlines the main policies governing          guided by the vision of a sustainable agricultural
                                                                the agriculture sector in SA, as well as key               sector that addresses agricultural policy
                                                                developments. The Department of Agriculture,               distortions of the past, with reformative policies
                                                                Land Reform and Rural Development (DALRRD)                 that create an enabling agricultural sector for
                                                                and the Department of Environmental, Forestry              the future. South Africa’s agricultural sector
                                                                and Fisheries (DEFF) are national entities                 is governed by a suite of key policies and
                                                                responsible for overseeing and supporting the              legislation outlined in Table 2 below:

                                      © Western Cape
                                                                                                                                                              © GreenCape
                              Department of Agriculture

17   Sustainable Agriculture: Market Intelligence Report 2020   Sustainable Agriculture: Market Intelligence Report 2020                                                    18
Table 2: Key policies and legislation                                                                                             A comprehensive list of key policies and                   3.3. Carbon Tax
                                                                                                                                  regulations influencing the agricultural sector            The South African Carbon Tax Act No.15 of 2019
            Name of policy                                                   Key objectives                                       can be found on the GreenAgri portal under the             came into effect on 1 June 2019. The first phase
                                                                                                                                  Action Plans and Policies section5.                        of the tax will run until December 2022, with the
                                               ■   Elimination of poverty
    The National Development                                                                                                                                                                 second phase running from 2023 to 2030.
                                                   Reduction of inequality
                                                                                                                                  3.2. Water
                                               ■
    Plan 2030 (NDP 2012)                                                                                                                                                                     Agriculture is not included in the first phase, and
                                               ■   Highlighting the importance of agriculture to the green economy
                                                                                                                                  The regulatory landscape of the water sector in            it is uncertain as to how (and whether) it will be
    The Strategic Plan for the
                                               ■   Providing an effective framework to address various challenges                 2018 was predominantly influenced by the                   included in the second phase. The basic tax rate
                                                   facing the sector                                                              prolonged drought experienced across the                   is set to be R120/tonne CO2e, with a basic
    Department of Agriculture,
                                               ■   Setting targets for the departmental programmes from 2012 to 2017              country. The policy updates were characterised             allowance of R48/tonne CO2e.
    Forestry, and Fisheries                    ■   Focusing on building a leading, dynamic, united, prosperous and                by the need for agricultural water users to reduce
    (DAFF 2013)                                    people-centred sector                                                          their water consumption, monitor their water               From 2022 onwards, farmers could be paying
    The Agriculture Integrated                 ■   Devising plans to develop equitable, productive, competitive,                  usage, and comply with metering installation               both direct and indirect carbon taxes. Direct
    Growth and Development                         profitable and sustainable agriculture, forestry, and fisheries sectors        enforcements and reporting requirements                    emission sources listed in the Act relevant to
    Plan (IGDP 2012)                           ■   Emphasising that the sector needs to benefit all South Africans                specified by the National Department of Water              agriculture include N2O emissions; urea
                                                                                                                                  and Sanitation (DWS). Water restrictions resulted          application; liming; biomass burning; land use
    The Agricultural Policy Action             ■   A programmatic response to key policy documents, including the                 in major economic and employment losses in the             change; and diesel generators with a combined
    Plan (APAP 2014)                               National Development Plan (NDP) and the New Growth Path (NGP)                  agricultural sector, which are detailed in the             capacity of 10 MW or greater.
                                                                                                                                  2019 Agri MIR.
                                               ■     NEMA is the overarching legislative framework for environmental
                                                     governance. Core values are reflected through the following principles:
    The National Environmental                       ■ Environmental management must place people and their needs at
                                                                                                                                  3.2.1. Water policy updates for
    Management Act 107 of 1998                         the forefront of its concern, and serve their physical, psychological,     agriculture                                                    From 2022 onwards, farmers could
    (NEMA 1998)                                        developmental, cultural, and social interests equitably                    There are still large parts of the province that are           be paying both direct and indirect
                                                     ■ Development must be environmentally, socially, and economically            experiencing drought conditions. Many local
                                                                                                                                                                                                 carbon taxes. Direct emission
                                                       sustainable                                                                municipalities have water restrictions in place.
                                                                                                                                  Four other provinces in SA are expected to
                                                                                                                                                                                                 sources listed in the Act relevant to
                                               ■   The IRP is an electricity infrastructure development plan based on                                                                            agriculture include N2O emissions;
                                                                                                                                  implement water restrictions: parts of Gauteng,
                                                   least-cost electricity supply and demand balance, taking into account
    Integrated Resources Plan                      security of supply and the environment (minimise negative emissions
                                                                                                                                  the North West, Free State and Mpumalanga. Low                 urea application; liming; biomass
    (IRP) 2019                                     and water usage)                                                               dam levels are attributed to high temperatures,                burning; land use change; and diesel
                                               ■   A detailed analyses of the policy can be found in the 2020 Energy              very low rainfall, and high consumption rates.                 generators with a combined
                                                   Services MIR4
                                                                                                                                                                                                 capacity of 10 MW or greater.
                                                                                                                                  More detail on water policy and legislation can be
                                                                                                                                  found in the 2020 Water MIR6.
Table 3: Draft policies in SA agriculture

        Name of draft policy                                                 Key objectives
                                               ■   To promote and establish ecologically and economically sustainable
                                                   agricultural systems to increase food security
    Draft Conservation                         ■   Recommending government to offer producers with incentives to
    Agriculture Policy (2017)                      adopt conservation agriculture measures, thereby developing
                                                   incentive schemes, and that tax rebates are provided to
                                                   manufacturers of conservation agriculture equipment

                                               ■   To outline the role of climate smart agriculture (CSA) practices in
                                                   addressing climate change related vulnerabilities facing the
                                                   agricultural sector
    Draft Climate Smart
                                               ■   Highlighting the importance of integrating mitigation and adaptation
    Agriculture Framework
                                                   strategies into production systems, and the need for resource
    Policy (2018)                                  investment into indigenous knowledge systems
                                               ■   To guide government, investors and developmental partners in
                                                   integrating CSA within projects and programmes

                                                                                                                                  5
                                                                                                                                      http://www.greenagri.org.za/
4                                                                                                                                 6
    https://greencape.co.za/market-intelligence/                                                                                      https://greencape.co.za/market-intelligence/

19                                                                     Sustainable Agriculture: Market Intelligence Report 2020   Sustainable Agriculture: Market Intelligence Report 2020                                                     20
48+28+2031
Indirect emission sources listed in the Act relevant to agriculture include, electricity, diesel, petrol and                                  3.4. Land Reform                                           Empirical data for land
N2O emissions. Figure 8 illustrates typical CO2e contribution of different inputs for commercial fruit and                                    South Africa adopted the White Paper on South              reform strategies
wine farms in SA.                                                                                                                             African Land Policy in 1997 to address the                 The DAFF together with Statistics South Africa
                                                                                                                                              historical discriminatory injustices in land               launched a Farmer Producer/Register Campaign
                                                                                                                                              dispossession during colonialism and apartheid,            in September 2018 to gather more information on
                                                                                                                                              which transpired into inequalities in land                 the country’s smallholder farmers. It would assist
                                                                                                                                              ownership and land use. The White Paper was                government in measuring the progress of land
                                                                                                                                              one of the earliest pieces of democratic                   reform by using the data to inform its strategies.
                                                                                                                                              legislation to emphasise the need for sustainable          The Western Cape phase of data collection
                                                                                                                                              use of land. It also introduced the three                  started in November 2019. It is expected that the
                                                                                          48%        ELECTRICITY                              fundamental components of land reform as                   entire process will be completed in 2021. The
                                                                                          28%        FUEL                                     restitution, redistribution, and tenure reform.            census would be conducted in two parts –
                                                                                          20%        FERTILIZER                               Various policies have since been introduced by             focusing on commercial farmers in 2019 and
                                                                                            3%       AGROCHEMICALS                            the State to support successful land reform                smallholder farmers in 2020. A total of R10 million
                                                                                            1%       LAND-USE CHANGE                          transitions. These include the Land Redistribution         has been invested into the census database.
                                                                                                                                              for Agricultural Development (LRAD) programme,
                                                                                                                                              the Proactive Land Acquisition Strategy (PLAS),            3.5. International regulations
                                                                                                                                              and the Settlement Production Land Acquisition             Many of SA’s agricultural products are exported
                                                                                                                                              Grant (SPLAG).                                             and as such have to adhere to international
                                                                                                                                                                                                         environmental regulations and standards. The
                                                                                                                                              3.4.1. Land reform policy updates                          wine industry in particular has a well-established
Figure 8: Fruit and wine farm CO2e “hotspots” (Blue North, 2019)                                                                              There have been some key updates within the                certification scheme, namely the Integrated
                                                                                                                                              land reform policy arena during 2019.                      Production of Wine (IPW), which complies with
                                                                                                                                                                                                         international wine industry environmental
Table 4: Projected cost of carbon tax for fruit and wine farmers (Blue North, 2019)
                                                                                                                                              Land expropriation and redistribution                      sustainability criteria, including the Global Wine
                                                                                                                                              The Joint Constitutional Review Committee (JCRC)           Sector Environmental Sustainability Principles as
                                                 Electricity                            Diesel                      Nitrogen fertiliser
                                                                                                                                              released its final recommendation in which it              published by the International Federation of Wine
    Consumption per                     3 353 kWh                            320 L                                101 kg                      advised that Section 25 of the Constitution of             and Spirits (FIVS), as well as Guidelines for
    bearing ha7                                                                                                                               South African should be amended to allow                   sustainable Viti-viniculture: Production, processing
                                                                                                                                              expropriation of land without compensation as a            and packaging of products as published by the
                                                                                                                                          9
    Approximate tax rate                Indirect: 7.5c/kWh8                  Indirect: 10c/L                      Direct: R48/tonne CO2       legitimate option for land reform. The next steps in       International Organisation of Vine and Wine (OIV).
                                                                                                                                              this process are for the Section 25 Ad Hoc
    Projected cost per                  R252/ha                              R32/ha                               R59/ha
                                                                                                                                              Committee to initiate and introduce legislation            More recent international regulatory
    bearing ha
                                                                                                                                              which is expected to be gazetted in December               developments are discussed below.
                                                                                                                                              2019. Also, in May 2019, the final report of the
3.3.1. Policy implications                                                                                                                    Presidential Advisory Panel on Land Reform and             3.5.1. Synthetic chemical bans
The carbon tax is expected to be a key driver in the uptake of technologies and practices that increase                                       Agriculture were released with several detailed            China and the European Union (EU) are SA's
resource efficiency and decrease dependence on synthetic fertilizer on farms. This includes precision                                         recommendations. It is expected that many of               largest fruit, nut, and wine importers. China’s
agriculture technologies and regenerative agriculture practices, discussed in more detail in Section 4 of                                     these recommendations will be used to inform the           increasingly strict environmental compliance
this report. The latter also holds potential for sequestering atmospheric carbon, and can be used to offset                                   finalisation of a comprehensive, far-reaching and          requirements and the routine banning of
carbon emissions.                                                                                                                             transformative land reform programme.                      mainstay chemical pesticides by the EU will
                                                                                                                                                                                                         affect SA’s production input:
                                                                                                                                              In his State of the Nation address, President              ■ The EU has implemented a near total ban on
                                                                                                                                              Ramaphosa committed government to                             neonicotinoids, currently the world’s biggest
                                                                                                                                              accelerating efforts to release public land for               insecticide group.
                                                                                                                                              farming and urban settlements, whilst around R4            ■ Switzerland is to vote on a complete synthetic

                                                                                                                                              billion has been allocated to the Land Bank                   pesticide ban within the next three years.
                                                                                                                                              to support black commercial farmers.                       ■ France has indicated an intention to phase out

                                                                                                                                                                                                            synthetic pesticides in five years.
                                                                                                                                                                                                         ■ China leads the world in generic pesticide

                                                                                                                                                                                                            production and currently produces 90% of the
                                                                                                                                                                                                            world’s active ingredients. Thus, any
7
                                                                                                                                                                                                            disturbance in supply from China affects the
  Average consumption is based on graded datasets contained in the CCC database and reflects a combined average of South African
fruit and wine data.                                                                                                                                                                                        supply and demand equation globally.
8
    Estimated indirect carbon tax levy. No official information on the electricity tariff was available at the time of writing.
9
  Expected maximum effective carbon tax rate. Nitrogen carbon costs were determined using an emission factor of 12.044 kg CO2/kg N
fertilizer.

21                                                                            Sustainable Agriculture: Market Intelligence Report 2020        Sustainable Agriculture: Market Intelligence Report 2020                                                     22
4
                                                                                 Opportunities and
                                                                                     barriers
                                                                    Renewable energy and conservation agriculture solutions continue to offer
                                                                   opportunities for investors and businesses in the agriculture sector. Emerging
                                                                     opportunities with significant growth potential include technologies for
                                                                  undercover, precision, and urban agriculture. The main market drivers for these
                                                                         opportunities are climate adaptation and water risk mitigation.

                                                                This section starts by providing brief updates             ■   precision agriculture (PA), in particular the
                                                                on the 2019 MIR for agriculture-related market                 growing demand for bespoke advisory
                                                                opportunities in renewable energy (RE),                        services. These services have capitalised
                                                                conservation agriculture (CA), and undercover                  on the emerging opportunities in software
                                                                farming (UF).                                                  development and add value to relatively
                                                                                                                               mature technology, specifically remote
                                                                For a more in-depth analysis of these                          sensing technology such as sensors, drones
                                                                opportunities, including energy efficiency                     and satellite imaging; and
                                                                in agriculture, refer to the 2017 and 2018                 ■   urban agriculture (UA), which is in its infancy
                                                                Agriculture MIRs. Opportunities are then                       in South Africa and encompasses different
                                                                addressed in more detail for:                                  production technologies. The section will
                                                                                                                               focus on emerging trends for hydroponic
                                                                                                                               UA in South Africa.

                                                                                                                                                     © Oranjezicht City Farm
                                 © Oranjezicht City Farm

23   Sustainable Agriculture: Market Intelligence Report 2020   Sustainable Agriculture: Market Intelligence Report 2020                                                         24
Table 1: Summary of market opportunities (repeated here from page 3)

                                                     Requirement                                                                                                               Requirement
 Opportunity            Key drivers                                            Term       Macro environment             Opportunity               Key drivers                                          Term     Macro environment
                                                       & barrier                                                                                                                 & barrier
                 ■   Rising electricity        ■   Strong business case       Short to   SA was the fastest                                ■   Resource scarcity,        Barriers highlighted by      Medium    Globally, agriculture
                     tariffs                       for large (e.g. cold       medium     grower of solar                                       particularly water        current players in the       to long   is the least digitised
                 ■   Security of energy            storage) and               term       photovoltaic (Solar PV)                               availability              field includes:              term      sector (throughout its
                     supply                        year-round                            installations in 2017                             ■   Global                    ■ The mind-set change                  value chain) and thus
                 ■   Increasing ability            energy users                          globally. An estimated                                competitiveness and          required by farmers to              technology-based
 Renewable           to feed back into         ■   Seasonal nature                       10% of all solar PV                                   economies of scale           adopt new farm                      decision-making
 energy (solar       the grid                      of agriculture                        installations are in the      Precision           ■   Technological                management                          is still emerging.
 photovoltaic)   ■   Decreasing cost of            production affects                    agricultural sector, and                              advances in drone,           technologies.
                                                                                                                       agriculture
                     technology                    the business case                     the business case is                                  satellite and             ■ A lack of integration                Remote sensing
                                                                                                                       (remote
                 ■   Innovative finance                                                  well known to the                                     information                  between various                     applications is an
                                                                                                                       sensing                                              disciplines.                        emerging market in
                     options                                                             industry.                                             communication
                 ■   Corporate social
                                                                                                                       applications)           technology and            ■ The inclusion of the                 SA’s agriculture sector,
                     responsibility (CSR)                                                                                                      the Internet of              end user in developing              with the exception of
                                                                                                                                               Things (IoT).                software solutions,                 GPS guidance for
                 ■   The main driver is soil   ■   High cost of               Medium     Globally, the uptake of                                                            which results in                    tractors.
                     degradation resulting         equipment                  to long    CA is high, particularly                                                           limited understanding
                     from conventional         ■   Long-term return on        term       in South America. Only                                                             of the end user’s
                     tillage and                   investment when                       15% to 20% of                                                                      actual needs.
                     subsequently                  converting from                       commercial grain
                     diminishing returns on        conventional to                       farmers and 5% of                                 ■   Resource scarcity         ■   Enabling municipal       Long      Urban agriculture
 Conservation
                     land, due to factors          conservation                          smallholder farmers in                            ■   Urbanisation                  support environment,     term      (UA) growth is the
 agriculture
                     such as decreased             practices                             SA have adopted CA.                               ■   Advances in                   such access to water               largest in Asian
 (no-till                                                                                                                                      technology,                   and space.                         countries characterised
                     moisture-holding          ■   Sustainable farm
 planting            capacity and                                                                                                              specifically                  Access to finance for              by high-density urban
                                                   management                                                                                                            ■
 equipment)          biological functions          practices such as                                                                           hydroponic systems            technology                         populations. In
                                                   crop rotation and                                                                           and LED lighting              infrastructure                     particular, vertical
                                                   permanent soil cover                                                                    ■   Consumer                  ■   Lack of technical                  farming production,
                                                   play an important role                                                                      preferences for locally       knowledge                          as it uses space
                                                   to improve the                                                                              produced food             ■   Business case not well             more efficiently
                                                   business case                                                       Urban               ■   Waste minimisation            established                        than flat structures.
                                                                                                                       agriculture                                                                              Commercially
                 ■   Resource scarcity         ■   High capital cost with     Low-       Greenhouses are well          (hydroponic                                                                              viable production
                 ■   Increased yields and          limited financing          tech       established globally.         production)                                                                              of agricultural produce
                     quality                       options                    systems:   SA, as with most                                                                                                       in SA’s urban
                 ■   Providing products        ■   High cost of electricity   Short to   developing countries,                                                                                                  environments is still in
                     out of season                 affects viability of       medium     has been very slow to                                                                                                  its infancy. Various
                 ■   Climate change                controlled                 term       adopt greenhouse                                                                                                       factors, such as
                 ■   Technological                 environment systems                   technology, and is                                                                                                     spacing, scale, product
 Undercover          advances in LED           ■   Business case not well     High-      estimated to be 50                                                                                                     demand and market
 farming             lighting                      established for            tech       years behind developed                                                                                                 access needs to be
 (various                                          high-tech systems          systems:   European countries                                                                                                     better understood to
 technologies)                                 ■   Lack of technical          Long       such as the                                                                                                            create successful
                                                   knowledge                  term       Netherlands.                                                                                                           enterprises.

                                                                                         Low-tech systems such
                                                                                         as netting and tunnels
                                                                                         are growing rapidly,
                                                                                         particularly for high
                                                                                         value export fruits.

25                                                         Sustainable Agriculture: Market Intelligence Report 2020   Sustainable Agriculture: Market Intelligence Report 2020                                                        26
You can also read