LTP Induction Boosts Glutamate Spillover by Driving Withdrawal of Perisynaptic Astroglia
←
→
Page content transcription
If your browser does not render page correctly, please read the page content below

Article

LTP Induction Boosts Glutamate Spillover by Driving
Withdrawal of Perisynaptic Astroglia
Highlights                                                               Authors
d   Induction of synaptic LTP prompts withdrawal of perisynaptic         Christian Henneberger, Lucie Bard,
    astroglia                                                            Aude Panatier, ..., Michael G. Stewart,
                                                                                      €gerl, Dmitri A. Rusakov
                                                                         U. Valentin Na
d   The underlying mechanisms involve NKCC1 transporter
    and cofilin                                                          Correspondence
d   Reduced synaptic astroglial coverage boosts extrasynaptic            d.rusakov@ucl.ac.uk (D.A.R.),
                                                                         christian.henneberger@uni-bonn.de
    glutamate escape
                                                                         (C.H.),
                                                                         m.g.stewart@open.ac.uk (M.G.S.),
d   LTP induction thus enhances NMDAR-dependent inter-
                                                                         valentin.nagerl@u-bordeaux.fr (U.V.N.)
    synaptic cross-talk
                                                                         In Brief
                                                                         Central synapses are often surrounded
                                                                         by thin astroglial processes that confine
                                                                         chemical neurotransmission to the
                                                                         synaptic cleft. Henneberger et al. find that
                                                                         memory trace formation at synaptic
                                                                         connections prompts withdrawal of these
                                                                         processes, thus boosting extrasynaptic
                                                                         neurotransmitter actions. Such actions
                                                                         can alter signal integration rules among
                                                                         neighboring synapses.

            Henneberger et al., 2020, Neuron 108, 1–18
            December 9, 2020 ª 2020 The Authors. Published by Elsevier Inc.
            https://doi.org/10.1016/j.neuron.2020.08.030                                                  ll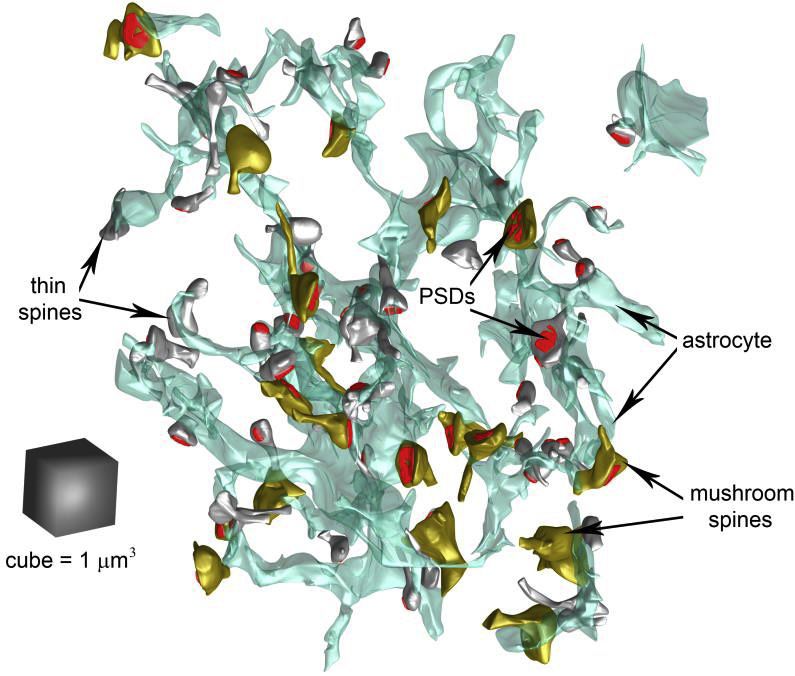
Please cite this article in press as: Henneberger et al., LTP Induction Boosts Glutamate Spillover by Driving Withdrawal of Perisynaptic Astroglia,
 Neuron (2020), https://doi.org/10.1016/j.neuron.2020.08.030

                                                                                                                                        ll
                                                                                                                                  OPEN ACCESS

Article
LTP Induction Boosts Glutamate Spillover
by Driving Withdrawal of Perisynaptic Astroglia
Christian Henneberger,1,2,10,13,* Lucie Bard,1,13 Aude Panatier,3,4,9,13 James P. Reynolds,1,13 Olga Kopach,1,13
Nikolay I. Medvedev,5,13 Daniel Minge,2,13 Michel K. Herde,2 Stefanie Anders,2 Igor Kraev,5 Janosch P. Heller,1
Sylvain Rama,1 Kaiyu Zheng,1 Thomas P. Jensen,1 Inmaculada Sanchez-Romero,6 Colin J. Jackson,11
Harald Janovjak,6,12 Ole Petter Ottersen,7,8 Erlend Arnulf Nagelhus,7,15 Stephane H.R. Oliet,3,4 Michael G. Stewart,5,*
             €gerl,4,9,* and Dmitri A. Rusakov1,14,*
U. Valentin Na
1UCL   Queen Square Institute of Neurology, University College London, London WC1N 3BG, UK
2Institute of Cellular Neurosciences, Medical Faculty, University of Bonn, 53127 Bonn, Germany
3INSERM U1215, Neurocentre Magendie, 33000 Bordeaux, France
4Université de Bordeaux, 33000 Bordeaux, France
5Life Sciences, The Open University, Milton Keynes MK7 6AA, UK
6Institute of Science and Technology Austria, 3400 Klosterneuburg, Austria
7Institute of Basic Medical Sciences, University of Oslo, 0317 Oslo, Norway
8Karolinska Institutet, 171 77 Stockholm, Sweden
9Interdisciplinary Institute for Neuroscience, CNRS UMR 5297, 33000 Bordeaux, France
10German Center for Neurodegenerative Diseases (DZNE), 53175 Bonn, Germany
11Research School of Chemistry, Australian National University, Acton, ACT 2601, Australia
12EMBL Australia, Australian Regenerative Medicine Institute, Faculty of Medicine, Nursing and Health Science, Monash University,

Melbourne, VIC 3800, Australia
13These authors contributed equally
14Lead Contact
15Dr Nagelhus sadly passed away on 10 January 2020

*Correspondence: d.rusakov@ucl.ac.uk (D.A.R.), christian.henneberger@uni-bonn.de (C.H.), m.g.stewart@open.ac.uk (M.G.S.),
valentin.nagerl@u-bordeaux.fr (U.V.N.)
https://doi.org/10.1016/j.neuron.2020.08.030

SUMMARY

Extrasynaptic actions of glutamate are limited by high-affinity transporters expressed by perisynaptic astro-
glial processes (PAPs): this helps maintain point-to-point transmission in excitatory circuits. Memory forma-
tion in the brain is associated with synaptic remodeling, but how this affects PAPs and therefore extrasynap-
tic glutamate actions is poorly understood. Here, we used advanced imaging methods, in situ and in vivo, to
find that a classical synaptic memory mechanism, long-term potentiation (LTP), triggers withdrawal of PAPs
from potentiated synapses. Optical glutamate sensors combined with patch-clamp and 3D molecular local-
ization reveal that LTP induction thus prompts spatial retreat of astroglial glutamate transporters, boosting
glutamate spillover and NMDA-receptor-mediated inter-synaptic cross-talk. The LTP-triggered PAP with-
drawal involves NKCC1 transporters and the actin-controlling protein cofilin but does not depend on major
Ca2+-dependent cascades in astrocytes. We have therefore uncovered a mechanism by which a memory
trace at one synapse could alter signal handling by multiple neighboring connections.

INTRODUCTION                                                                Carter, 2011; Hires et al., 2008), functional inter-synaptic
                                                                            cross-talk (Arnth-Jensen et al., 2002; Asztely et al., 1997; Lozo-
The surface of brain astroglia is packed with high-affinity GLT1            vaya et al., 1999; Scimemi et al., 2004), heterosynaptic potentia-
transporters that rapidly take up glutamate released by                     tion and depression (Vogt and Nicoll, 1999), and remote activa-
excitatory synapses (Danbolt, 2001; Verkhratsky and Neder-                  tion of metabotropic glutamate receptors (mGluRs) (Min et al.,
gaard, 2018). GLT1-enriched perisynaptic astroglial processes               1998; Scanziani et al., 1997). Glutamate escape underlies
(PAPs) that often surround synaptic connections (Grosche                    signaling between mitral cells in the olfactory bulb (Isaacson,
et al., 1999; Heller and Rusakov, 2015; Ventura and Harris,                 1999), and in the cerebellum between climbing fibers and inter-
1999) thus confine glutamate actions largely to the synaptic cleft.         neurons (Coddington et al., 2013; Szapiro and Barbour, 2007)
However, extrasynaptic glutamate escape, or ‘‘spillover,’’ can              and between parallel fibers and stellate cells (Carter and Regehr,
have a significant physiological impact. In the hippocampus,                2000). Changes in extrasynaptic glutamate signaling have also
glutamate spillover has been causally related to a co-operative             been related to cognitive decline (Pereira et al., 2014), fear con-
action of dendritic NMDA receptors (NMDARs) (Chalifoux and                  ditioning (Tanaka et al., 2013; Tsvetkov et al., 2004), and heroin

                                                    Neuron 108, 1–18, December 9, 2020 ª 2020 The Authors. Published by Elsevier Inc. 1
                                      This is an open access article under the CC BY license (http://creativecommons.org/licenses/by/4.0/).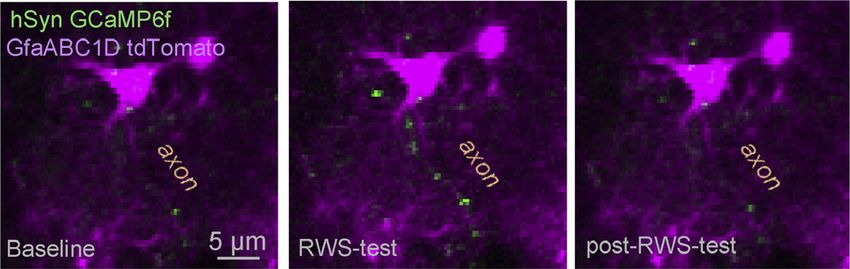
Please cite this article in press as: Henneberger et al., LTP Induction Boosts Glutamate Spillover by Driving Withdrawal of Perisynaptic Astroglia,
  Neuron (2020), https://doi.org/10.1016/j.neuron.2020.08.030

            ll
       OPEN ACCESS                                                                                                                                  Article

   A                                                                     B                                      C

   D                                                        E                                            F

   G                                                 H                                           I

Figure 1. Reduced PAP Presence after LTP Induction at CA3-CA1 Synapses
(A) Left: 2PE point-spread function (PSF) excites dye-filled PAPs (yellow, 3D EM fragment) within an ~1 mm focal plane (dotted lines; bottom). Right: fluorescence
within ROI (FROI) scales with PAP VF, reaching ~100% VF inside the 5–7 mm wide soma (FS).
(B) Astrocyte filled with AF 594 (single focal section; lx2P = 800 nm); dashed cone, extracellular recording pipette. FROI and FS, areas of VF readout; see Video S1
for extended dynamic range.
(C) Traces, s. radiatum fEPSPs, before (pre) and ~25 min after LTP induction (post); graph, relative fEPSP slope (mean ± SEM; arrow, induction onset); ***p < 0.001
(25–30 min post-induction: 151.0% ± 6.7% compared to baseline, n = 18).
(D) Relative change in PAP VF (%, mean ± 95% confidence interval [CI]) in control (green; n = 24 cells) and during LTP induction (arrow, onset; orange; n = 29); red
line, best-fit exponential decay to steady state VFðtÞ = VFss + ð1  VFss Þexpð  t =tÞ; VFss = 0.77 ± 0.04, t = 14 ± 5 min.
(E) Relative change in PAP VF (%, mean ± SEM) plotted against initial PAP VF, in control (n = 8 cells) and ~25 min after LTP induction (orange; n = 13; *p < 0.05,
**p < 0.01, compared to control, df = 19).
(F) Grey, PAP VF change (%, sample size n shown) in hypo-osmotic (220 mOsm/L) and hyper-osmotic (420 mOsm/L) solutions, as shown. Green and orange,
PAP VF change 25–30 min after LTP induction in control (LTP, mean ± SEM: 25% ± 7%), in 50 mM APV (+APV, 3.1% ± 9.9%), with no HFS (0.8% ± 7.3%),

                                                                                                                                  (legend continued on next page)

2 Neuron 108, 1–18, December 9, 2020
Please cite this article in press as: Henneberger et al., LTP Induction Boosts Glutamate Spillover by Driving Withdrawal of Perisynaptic Astroglia,
 Neuron (2020), https://doi.org/10.1016/j.neuron.2020.08.030

                                                                                                                                                 ll
Article                                                                                                                                    OPEN ACCESS

and cocaine relapse (Shen et al., 2014; Smith et al., 2017). How-                ing 2PE. Here, fluorescence intensity FROI inside an 1 mm focal
ever, whether the PAP-controlled glutamate spillover can be                      plane over an x-y region of interest (ROI), scales with the tissue
adaptively regulated by neural activity has remained unknown.                    volume fraction (VF) occupied by the dye-filled PAPs (Figure 1A,
   Astrocytes can generate molecular signals that regulate excit-                left). Because astrocyte territories do not overlap (Bushong et al.,
atory transmission (Araque et al., 2014; Bazargani and Attwell,                  2002), FROI represents all astroglia within the ROI. Thus, relating
2016) and synaptic modifications associated with a memory                        FROI to the fluorescence intensity FS over the somatic region rep-
trace (Adamsky et al., 2018; Henneberger et al., 2010; Min and                   resenting 100% VF (Figures 1A, right, S1A, and S1B) provides
Nevian, 2012; Shigetomi et al., 2013). Whether PAPs can also un-                 the local PAP VF readout, as detailed previously (Medvedev
dergo activity-dependent remodeling has therefore been a long-                   et al., 2014; Savtchenko et al., 2018). This readout gave average
standing question. Electron microscopy (EM) studies have re-                     PAP VF of 6%–7% (cell bodies excluded), with or without gap
ported increased astroglial coverage of synaptic samples that                    junctions blocked (Figures S1B and S1C). A similar value was re-
underwent induction of long-term potentiation (LTP) (Bernardi-                   ported previously in area CA1 (Savtchenko et al., 2018) or den-
nelli et al., 2014; Lushnikova et al., 2009; Wenzel et al., 1991)                tate gyrus (Medvedev et al., 2014) and was in line with earlier
or in animals reared in complex environment (Jones and Green-                    EM data (Lehre and Rusakov, 2002; Patrushev et al., 2013).
ough, 1996). In contrast, synaptic coverage by PAPs decreased                       Next, we induced LTP at CA3-CA1 synapses, with the clas-
following memory consolidation (Ostroff et al., 2014) or during                  sical protocol of high-frequency stimulation (HFS) applied to
lactation (Oliet et al., 2001). Nevertheless, EM cannot follow                   Schaffer collaterals, while monitoring PAP VF and local fEPSPs
morphogenic events in time and might be prone to distortions                     (Henneberger et al., 2010) (Figures 1B and 1C; STAR Methods).
of PAP morphology during tissue fixation (Korogod et al., 2015).                 LTP induction prompted a gradual PAP VF decrease, with a time
   These factors necessitate evidence in live cells, which has                   constant of 14 min and a projected steady-state value of 23%
been a challenge because of the nanoscopic size of PAPs.                         (Figure 1D; Video S1). No VF change occurred in control condi-
Several studies have elegantly used confocal or two-photon exci-                 tions (Figure 1D), ruling out confounding effects, such as dye
tation (2PE) fluorescence microscopy to monitor fine changes in                  photobleaching. Interestingly, ROIs with smaller initial PAP VF
PAPs (Bernardinelli et al., 2014; Haber et al., 2006; Hirrlinger et al.,         showed a stronger VF reduction (Figure 1E). Similar tests using
2004; Perez-Alvarez et al., 2014). However, dynamic fluorescent                  EGFP-expressing astroglia showed a smaller effect, most likely
shapes seen in a light microscope are subject to interpretation.                 due to restricted diffusion of EGFP compared to small AF 594
First, PAPs and inter-PAP distances are beyond the light diffrac-                molecules, and no VF changes were detected after the induction
tion limit, potentially giving rise to spurious shapes (Rusakov,                 of long-term depression (Figures S1D and S1E).
2015). Second, cell-permeable fluorescent tracers appear to un-                     The VF decrease was blocked when LTP was suppressed,
derreport astroglial structure (Reeves et al., 2011). Finally, subtle            either by the NMDAR antagonist APV, or by clamping Ca2+ in
re-distribution of the fluorescent label could be mistaken for                   the recorded astrocyte (Figure 1F) that inhibits astroglia-depen-
changes in PAP shape or motility.                                                dent release of the NMDAR co-agonist D-serine (Henneberger
   To avoid such uncertainties, we set out to monitor PAPs with                  et al., 2010). In the latter test, LTP and VF reduction could be
microscopy methods that are not limited by diffraction of light,                 rescued by washing in 10 mM D-serine (Figure 1F), consistent
under several LTP induction protocols, in hippocampal slices                     with earlier reports (Adamsky et al., 2018; Henneberger et al.,
and in the barrel cortex in vivo. We employed optical glutamate                  2010). These results related VF reduction specifically to LTP in-
sensors to relate LTP-associated changes in PAPs to extrasy-                     duction rather than to HFS per se.
naptic glutamate escape. We identified key players in cell
signaling cascades that could underpin such changes. The re-                     LTP Induction Reduces Diffusion Coupling among
sults thus unveil how a plasticity-inducing pattern of neural activ-             Astroglial Processes
ity could trigger local PAP remodeling thus altering local rules of              Fluorescence recovery after photobleaching (FRAP) of AF 594
synaptic signal integration.                                                     can report diffusion coupling among astrocyte processes when
                                                                                 the bleaching line-scan is applied in their midst (Figure 1G), as
RESULTS                                                                          shown earlier (Anders et al., 2014; Savtchenko et al., 2018). In
                                                                                 these tests, LTP induction slowed down FRAP kinetics, with no
LTP Induction Reduces PAP Volume                                                 changes in control conditions (Figures 1H and 1I), suggesting
First, we visualized astrocytes loaded whole-cell with Alexa Fluor               reduced coupling among PAPs, possibly due to their partial
594 (AF 594), in CA1 s. radiatum of acute hippocampal slices, us-                shrinkage. At the same time, LTP induction had no effect on

under Ca2+ clamp (Ca-clamp, 6.8% ± 9.5%), under Ca2+ clamp with 10 mM D-serine added (Ca-clamp+ D-ser, 24% ± 7%); **p < 0.01; *p < 0.05; dots, indi-
vidual cells.
(G) Evaluating diffusion coupling inside astroglia using FRAP of dialyzed AF 594 (STAR Methods; single focal section; ~80 mm depth); arrow, example line scan
position.
(H) Top: line scan as in (G) (baseline conditions; gray segment, shutter closed). Bottom: the corresponding fluorescence time course, before (Cntrl) and ~20 min
after LTP induction (LTP); F0, initial intensity; arrows, FRAP during shutter-on period (full recovery takes 39–40 s).
(I) Summary of FRAP tests (G and H); diagram, LTP induction may taper PAPs lowering diffusion coupling. Graph (mean ± SEM), FRAP rate relative to baseline (left
ordinate): ~25 min after LTP induction (LTP, 62% ± 12%, n = 11; *p < 0.05); in 50 mM APV (108% ± 32%, n = 7); no-HFS control (87% ± 15%, n = 7). Grey (right
ordinate), change in extracellular diffusivity ~25 min post-induction (LTP-ECS; 104% ± 7%, n = 5; Figures S1F–S1H); dots, individual tests.

                                                                                                                Neuron 108, 1–18, December 9, 2020 3
Please cite this article in press as: Henneberger et al., LTP Induction Boosts Glutamate Spillover by Driving Withdrawal of Perisynaptic Astroglia,
 Neuron (2020), https://doi.org/10.1016/j.neuron.2020.08.030

          ll
     OPEN ACCESS                                                                                                                           Article

A                                                              B                    C                Figure 2. Live STED and Correlational 3D EM
                                                                                                     Report PAP Withdrawal after LTP Induction
                                                                                                     (A) STED images of dendritic spines (red, CA1 py-
                                                                                                     ramidal cell; Thy1-YFP) and nearby astroglia (green;
                                                                                                     600 mM AF 488), before and ~25 min after LTP in-
                                                                                                     duction, as indicated; circles, ROIs centered at
                                                                                                     spine heads.
                                                                                                     (B) LTP induction reduces the green/red (astroglia/
                                                                                                     neuron) pixel ratio within ROIs (G/R; mean ± SEM;
                                                                                                     31% ± 10%, n = 22, **p < 0.01), with no effect on red
                                                                                                     pixel count (R; 3.1% ± 3.8%; *p < 0.02 compared
                                                                                                     to the G/R change, df = 42); dots, individual ROIs.
                                                                                                     (C) Proportion of dendritic spines that adjacent to
                                                                                                     (green) and away from (gray) PAPs, in control (Cntrl),
D                                   F                                                                20–25 min post-induction (LTP), and the latter with
                                                                                                     50 mM APV (+APV); spine numbers shown (Figures
                                                                                                     S2A–S2D).
                                                                                                     (D) Patched astrocyte loaded with biocytin (arrow,
                                                                                                     local astroglia stained through gap junctions),
                                                                                                     shown in the fluorescence (left) and DIC channel
                                                                                                     post-DAB conversion (right).
                                                                                                     (E) Electron micrograph showing PAPs of the
E                                                                                                    patched astrocyte (arrow in D) filled with precipitate
                                                                                                     (blue), and adjacent dendritic spines (yellow)
                                                                                                     featuring PSDs.
                                                                                                     (F) Astrocyte fragment (cyan) reconstructed in 3D,
                                                                                                     including adjacent thin (white) and mushroom (yel-
                                                                                                     low) dendritic spines with PSDs (red; Figure S2E).
                                                                                                     (G) Volumetric measure of synaptic astroglial
                                                                                                     coverage: PAP VF is calculated within 100 nm-thick
                                                                                                     concentric 3D shells (circles, not to scale) centered
                                                                                                     at the PSD (red).
                                                                                                     (H) PAP VF around PSDs (mean ± SEM) of thin and
G                         H                                                                          mushroom spines, in control and ~30 min after LTP
                                                                                                     induction, as indicated; sample sizes shown; ***p <
                                                                                                     0.001 (df = 86 for mushroom and df = 241 for thin
                                                                                                     spines).

                                                                                                   ter LTP induction, with 70 nm x-y resolu-
                                                                                                   tion (Figure 2A). Again, to avoid subjective
                                                                                                   judgement, we recorded the volumetric ra-
                                                                                                   tio of green-to-red pixels (G/R) within
extracellular diffusion (Figure 1I) assessed with a fluorescence            1.5 mm ROIs centered at individual spine heads (Figure 2A). After
point-source method (Figures S1F–S1H) (Zheng et al., 2008).                 LTP induction, G/R decreased by 31% ± 10% (n = 22, p < 0.001)
This was not surprising because CA1 astroglia occupy, soma                  (Figure 2B), thus corroborating results in acute slices (Figures 1A–
excluded, only 6%–7% of the tissue volume (Figure S1C)                      1F). Stable red-pixel count (Figure 2B) ruled out Thy1-YFP photo-
(Savtchenko et al., 2018) of which 15%–20% is taken by the                  bleaching whereas AF 488 bleaching was prevented by dialysis.
extracellular space (Syková and Nicholson, 2008). Thus, a                     STED images revealed subtle changes in some dendritic
20%–30% decrease in PAP VF would increase local extracellular               spines during LTP (Figure S2B). To explore this further while
space by only 5%–10%.                                                       minimizing STED-induced photodamage, we compared ran-
                                                                            domized groups of spines. The LTP group had a much smaller
Stimulated Emission Depletion (STED) Imaging Reveals                        fraction of the PAP-contacting spines (Figure 2C), larger heads
Decreased PAP Presence Near Spines upon LTP                                 in the no-PAP-contact spines, and a greater fraction of distinctly
Induction                                                                   large spine heads (>500 nm wide, 12/54) overall, compared to
STED microscopy enables monitoring live astroglia beyond the                control (3/29, Figures S2C and S2D).
optical diffraction limit (Arizono et al., 2020; Panatier et al.,
2014). We therefore turned to two-color STED (Tønnesen et al.,              Correlational 3D EM Shows Reduced Occurrence of
2018) combined with patch-clamp (Figures 2A and S2A) in orga-               PAPs after LTP Induction
notypic slices. We used the Thy1-YFP transgenic mice and                    To understand further changes on the nanoscale, we turned to
whole-cell AF 488 dialysis to image, respectively, CA1 pyramidal            correlational 3D EM. We loaded an astrocyte with AF 594 and
neurons and PAPs, in separate channels before and 20 min af-               biocytin (Figure 2D), either in baseline conditions or 15–20 min

4 Neuron 108, 1–18, December 9, 2020
Please cite this article in press as: Henneberger et al., LTP Induction Boosts Glutamate Spillover by Driving Withdrawal of Perisynaptic Astroglia,
 Neuron (2020), https://doi.org/10.1016/j.neuron.2020.08.030

                                                                                                                                        ll
Article                                                                                                                           OPEN ACCESS

after LTP induction, followed by rapid slice submersion into fixa-          Activating Cofilin Cascade Occludes LTP-Induced
tive and DAB conversion for EM (Figures 2D and 2E; STAR                     Changes in PAPs
Methods). The embedded slices were cut into 60–70 nm serial                 In glioblastoma cells, NKCC1 provides a protein scaffold regu-
sections, the patched astrocyte was located (Figures 2D and                 lating the phosphorylation of cofilin-1 (Schiapparelli et al.,
2E), and its fragment with the adjacent synapses were 3D-recon-             2017), and in neurons, transporter KCC2 plays a similar role
structed from 200–300 sections (Figures 2F and S2E), as                     (Llano et al., 2015). Cofilin-1 is a pH-dependent regulator of actin
detailed earlier (Medvedev et al., 2014; Savtchenko et al., 2018).          filament polymerization, which in turn controls remodeling of thin
   To evaluate synaptic PAP coverage volumetrically, we calcu-              cell protrusions (Bravo-Cordero et al., 2013; Ethell and Pasquale,
lated PAP VF inside 100 nm thick concentric spherical shells                2005). To probe this cascade, we dialyzed astroglia with peptide
centered at individual postsynaptic densities (PSDs) (Figure 2G;            S3, a specific inhibitor of cofilin-1 phosphorylation (Aizawa et al.,
STAR Methods), up to 0.5 mm, the average nearest-neighbor                  2001; Liu et al., 2016). Unlike bumetanide, this preserved both
distance between CA3-CA1 synapses. Although ‘‘thin’’ and                    LTP induction and the PAP VF decrease (Figures 3F, S3B, and
‘‘mushroom’’ spines have distinct identities (Matsuzaki et al.,             S3C; STAR Methods). However, peptide S3 dialysis reduced
2001), we found that LTP induction reduced local PAP VF for                 PAP VF by 20%–25% in baseline conditions, too, similar to the
both types (Figure 2H). Here, VF values agreed with the earlier             LTP case (Figure 3G): here, astrocytes connected to the patched
EM data (Lehre and Rusakov, 2002; Patrushev et al., 2013) and               cell via gap junctions (impermeable to S3, MW 1.5 kDa)
2PE data (Medvedev et al., 2014; Savtchenko et al., 2018) (Fig-             showed no PAP changes, confirming a cell-specific action (Fig-
ure S1C), arguing that our EM results are unlikely to be biased             ure 3G). Furthermore, when we combined LTP induction with S3
by fixation (Korogod et al., 2015) (see Discussion).                        dialysis (Figures S3B and S3C), the kinetics of PAP shrinkage
                                                                            were the same as under LTP induction alone or under S3 dialysis
LTP-Induced PAP Withdrawal Depends on Activation                            alone (Figure 3H). Thus, peptide S3 action occluded the effect of
of NKCC1                                                                    LTP induction on PAP VF, suggesting a shared mechanism (see
To explore cellular mechanisms underlying PAP withdrawal, we                Discussion).
first examined major astroglial Ca2+-signaling cascades that
engage mGluRs and IP3 receptors (Porter and McCarthy,                       Single-Synapse LTP Induction Prompts Local PAP
1997; Volterra et al., 2014) and can alter PAP motility (Perez-Al-          Retraction
varez et al., 2014). We spot-uncaged IP3 inside cell branches:              Although HFS in the bulk of tissue potentiates multiple synapses,
this evoked local Ca2+ rises (Figures 3A and 3B) but had no effect          memory trace formation is likely to involve changes at individual
on PAP VF (Figure 3C). Puff application of the group I mGluR                connections. We therefore set out to test how LTP at individual
agonist DHPG had a similar outcome (Figure 3C), and PAP VF re-              synapses affects PAPs. First, we modified an established proto-
mained unaffected by WIN55, an agonist of the cannabinoid CB1               col in which LTP at a CA3-CA1 synapse is induced by local gluta-
receptor that is active in astroglia (Navarrete and Araque, 2010).          mate spot-uncaging (Harvey and Svoboda, 2007; Matsuzaki
Similarly, the GABAA receptor agonist muscimol, which triggers              et al., 2004; Yasuda et al., 2003). We held a CA1 pyramidal cell
slight shrinkage of sulforhodamine-101 stained astroglia (Flor-             in voltage clamp and spot-uncaged glutamate (1-ms pulse)
ence et al., 2012), had no effect on PAP VF (Figure 3C).                    near its dendritic spine (Figure 4A) achieving a typical unitary
   We next tested morphogenic agents associated with synaptic               EPSC (Figure 4B; STAR Methods). Next, we switched to current
remodeling. However, removing the extracellular matrix (ECM)                clamp maintaining Vm at 60 to 65 mV, the range for CA1 pyr-
chondroitin sulfate (Dityatev and Schachner, 2003) with chon-               amids in freely moving animals (Epsztein et al., 2010). Here,
droitinase ABC (Kochlamazashvili et al., 2010), or blocking the             applying the spot-uncaging sequence that mimics the HFS pro-
ephrin/EphA4 cascade (Filosa et al., 2009; Murai et al., 2003;              tocol generated postsynaptic depolarization sufficient to trigger
Nishida and Okabe, 2007) with EphA4-Fc had no effect on the                 strong Ca2+ entry reported by OGB-1 (Figures S4A and S4B).
LTP-induced PAP VF reduction (Figure 3D).                                   Switching back to voltage clamp revealed potentiation of sin-
   We next turned to ion and water exchange mechanisms, in                  gle-pulse EPSCs (Figure 4B), which was induced robustly at
which aquaporin-4 (AQP4) plays a prominent role (Nagelhus                   every recorded synapse (7 out of 7 cells) (Figures 4B and 4C).
and Ottersen, 2013). However, the LTP-associated reduction in                  Because CA3-CA1 synapses are only 0.5 mm apart (Rusakov
PAP VF remained intact in the AQP4 knockout (KO) mice (Thrane               and Kullmann, 1998), spot-uncaging HFS should potentiate at
et al., 2011). Another key player in cell volume regulation is the          least one synapse nearby, whether or not the unclamped post-
Na+-K+-2Cl cotransporter NKCC1, which is widely expressed                  synaptic cell is visualized. We therefore loaded an astrocyte
in astroglia (Hoffmann et al., 2009; Kaila et al., 2014). To ensure         with AF 594 and OGB-1 and applied spot-uncaging while moni-
single-cell specificity, we loaded astrocytes whole-cell with the           toring VF and Ca2+ in the adjacent PAPs (Figure 4D). The HFS un-
NKCC1 blocker bumetanide (20 mM). Strikingly, bumetanide                    caging sequence in most cases evoked a local Ca2+ rise in PAPs
blocked the reduction of PAP VF while preserving LTP induction              (Figures 4D, 4E, and S4D), indicating robust glutamate release.
(Figures 3D and 3E, Bmtnd) whereas in baseline conditions bu-               In such cases, we detected PAP VF reduction near the spot (Fig-
metanide had no effects on PAP VF per se (Figure S3A). The                  ures 4F, 4G, and S4C–S4E; Video S2), but no changes either in
NKCC1 involvement was confirmed in rats with 50 mM intracel-                remote ROIs (>3 mm away, Figure 4D) or without MNI-glutamate
lular bumetanide (Figures 3D and 3E, Bmtnd+); here, the AQP4                in the bath (Figures 4G and 4H). Unsurprisingly, the VF change
blocker TGN-020 (Igarashi et al., 2011) was added to the bath,              was smaller than under bulk LTP induction (Figures 1, 2, and 3)
to ‘‘mimic’’ AQP4 KO (although see Tradtrantip et al., 2017).               where a co-operative effect was likely. Blocking NKCC1 with

                                                                                                         Neuron 108, 1–18, December 9, 2020 5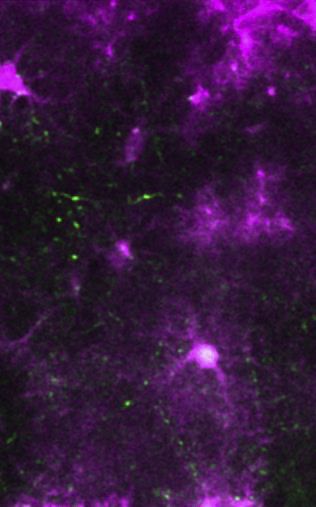
Please cite this article in press as: Henneberger et al., LTP Induction Boosts Glutamate Spillover by Driving Withdrawal of Perisynaptic Astroglia,
 Neuron (2020), https://doi.org/10.1016/j.neuron.2020.08.030

            ll
      OPEN ACCESS                                                                                                                                 Article

A                                                           B                                                Figure 3. LTP-Associated PAP Withdrawal
                                                                                                             Depends on NKCC1 and Cofilin
                                                                                                        (A) Top left: astrocyte fragment (5 mm z stack); circles,
                                                                                                        uncaging spots (400 mM NPE-IP3; AF 594 channel,
                                                                                                        lx2P = 840 nm). Other panels: Ca2+ response (200 mM
                                                                                                        Fluo-4; false colors) to IP3 spot-uncaging (at t = 0; five
                                                                                                        5 ms pulses at 5 Hz; lu2P = 720 nm); time lapse
                                                         C                                              shown; circle, ROI for Ca2+.
                                                                                                        (B) Time course of intracellular Ca2+ signal (DF/G) in
                                                                                                        ROI shown in (A); one-cell example; red arrow (gray
                                                                                                        segment), IP3 uncaging.
                                                                                                        (C) Relative change in PAP VF (%, mean ± SEM)
                                                                                                        25 min after: spot-uncaging of intracellular IP3
                                                                                                        (1.4% ± 4.1%, n = 10), application of DHPG
D                                                    E                                                  (300 mM, 3.5% ± 3.9%, n = 10), CB1 receptor
                                                                                                        agonist WIN55 (1 mM, 4.1% ± 0.4%, n = 3), or GABA
                                                                                                        receptor agonist muscimol (20 mM, 0.4% ± 1.7%,
                                                                                                        n = 6).
                                                                                                        (D) Relative change in PAP VF (%, mean ± SEM;
                                                                                                        top) ~25 min after LTP induction, and the corre-
                                                                                                        sponding LTP level (%, mean ± SEM; bottom,
                                                     F                                                  sample size shown): in the presence of 0.5–0.7 U/
                                                                                                        mL chondroitinase ABC (ChABC, 14% ± 3%),
                                                                                                        control ChABC-c (11% ± 7%), 10 mg/mL EphA4-
                                                                                                        Fc (17% ± 3%), 10 mg/mL Fc control (20% ±
                                                                                                        2%), wild-type C57BI6 mice (17% ± 3%),
                                                                                                        AQP4/ knockout mice (18% ± 2%), 20 mM
                                                                                                        intracellular bumetanide (Bmtnd, 4% ± 4.5%),
                                                                                                        50 mM intracellular bumetanide + 100 mM extracel-
                                                                                                        lular TGN-020 (Bmtnd+, 5.5% ± 2.7%), DMSO
G                                                    H                                                  control 0.2% external + 0.05% internal (19% ±
                                                                                                        2%); blue text, data from mice; gray shadow, 95%
                                                                                                        CI for PAP VF change after LTP induction in control
                                                                                                        conditions; *p < 0.02 (df = 12 for AQP4/ versus
                                                                                                        Bmtnd, df = 9 for Bmtnd versus DMSO), ***p < 0.005
                                                                                                        (df = 13 for AQP4/ versus Bmtnd+, df = 10 for
                                                                                                        Bmtnd+ versus DMSO; t test or Mann-Whitney in-
                                                                                                        dependent sample tests).
                                                                                                        (E) PAP VF change (%, mean ± SEM) during LTP
                                                                                                        induction (arrow) in key tests shown in (D), as indi-
                                                                                                        cated, and summary for other experiments (Rest).
(F) Relative fEPSP slope (mean ± SEM) during LTP induction at CA3-CA1 synapses in control (n = 10) and with S3 peptide inside astroglia (200 mM , n = 6), as
shown (Figures S3B and S3C).
(G) Occlusion experiment: PAP VF change (%, mean ± SEM, sample size shown): ~25 min after LTP induction in control (LTP no S3; 23% ± 3%), no LTP
induction, whole-cell loaded S3 (S3 no LTP; 29% ± 6%); same but recorded in gap-junction connected astrocytes devoid of S3 (S3-GJ cells; 0.4% ± 2.4%);
and ~25 min after LTP induction with S3 (S3 and LTP; 27% ± 3%); ***p < 0.001 (df = 13 for ‘‘LTP no S3’’ versus ‘‘S3 GJ Cells,’’ df = 12 for the rest).
(H) Time course of PAP VF (%, mean ± SEM) in the occlusion experiments shown in (G); notations as in (G).

whole-cell loaded bumetanide suppressed the LTP-associated                           Three-color dSTORM revealed 3D perisynaptic patterns of
PAP change (Figure 4H). A complementary strategy, in which                        GLT1 molecules (Figures 5A and S5B). In potentiated slices,
astrocytes were imaged using the membrane-bound GFP                               GLT1 occurred consistently further away from bassoon,
(AAV5.GfaABC1D.Pi.lck-GFP.SV40) produced a qualitatively                          compared to control (Figure 5B). Because bassoon is a key
identical result, with the PAP withdrawal lasting for up to 100–                  player in synaptic vesicle release (Gundelfinger et al., 2016),
120 min post-induction (Figures S4F–S4H).                                         this suggested that glutamate released from potentiated synap-
                                                                                  ses travels further, compared to control, to reach GLT1. We
LTP Induction Increases Glutamate Traveling Distance                              could not detect a similar trend for GLT1-Homer1 distances (Fig-
We next hypothesized that PAP withdrawal alters perisynaptic                      ure S5C), possibly because Homer1 showed a relatively
occurrence of GLT1. To test this, we turned to dSTORM, a su-                      dispersed pattern across the spine head.
per-resolution technique that we adapted previously (Heller
et al., 2020), aiming to map 3D co-ordinates of the presynaptic                   Induction of LTP Extends Extracellular Exposure of
protein bassoon, the PSD protein Homer1, and local GLT1 (Fig-                     Released Glutamate
ure 5A). To potentiate synapses in bulk, we employed the clas-                    To test whether the withdrawal of GLT1-enriched PAPs indeed
sical chemically induced LTP (cLTP) protocol in acute hippocam-                   prompts increased extracellular travel of released glutamate,
pal slices (Otmakhov et al., 2004) (Figure S5A).                                  we employed the optical glutamate sensor FLIPE600n (Okumoto

6 Neuron 108, 1–18, December 9, 2020
Please cite this article in press as: Henneberger et al., LTP Induction Boosts Glutamate Spillover by Driving Withdrawal of Perisynaptic Astroglia,
 Neuron (2020), https://doi.org/10.1016/j.neuron.2020.08.030

                                                                                                                                                   ll
Article                                                                                                                                      OPEN ACCESS

             A                                                    B                                                       C

              D                                                     E

                                                                    F

              G                                                                                H

Figure 4. LTP Induction at Individual CA3-CA1 Synapses Reduces Local PAP Presence
(A) Dendritic fragment, CA1 pyramidal cell (AF 594 channel), showing glutamate uncaging spot (red dot; 2.5 mM bath-applied MNI-glutamate) before (pre) and
~20 min after spot-uncaging LTP induction (post).
(B) One-spine example. Traces, EPSCs (Isyn, voltage-clamp) during baseline (black) and ~30 min after LTP induction (red; see Figures S4A and S4B for Ca2+
dynamics). Graph, relative EPSC amplitude (Isyn; black and red circles) and cell access resistance (Ra, green) time course; arrow, LTP induction onset.
(C) Statistical summary of experiments in (A) and (B) (mean ± SEM; n = 7, ***p < 0.005); notations as in (B); dots, individual tests.
(D) Example, astrocyte fragment (whole-cell AF 594, single focal section); red dot, glutamate uncaging spot; circles, ROIs for PAP VF monitoring near the spot and
away, as shown.
(E) Time-lapse frames (area shown in D): astrocyte Ca2+ response (Fluo-4, lx2P = 840 nm) to the spot-uncaging LTP protocol (lu2P = 720 nm).
(F) Astrocyte fragment near the uncaging spot (as in D; arrow) immediately after (0 min), at 15 min and 25 min after LTP induction (~9 mm z stack average); PAP
retraction seen at 15–25 min (Figures S4C–S4E; Video S2).
(G) PAP VF change (%, mean ± SEM) in tests shown in (D) and (E) (Glu, n = 11), and with no MNI-glutamate (no Glu, n = 11; arrow, uncaging onset).
(H) Summary: PAP VF change (%, mean ± SEM) ~25 min post-induction (LTP, 13% ± 4%, ***p < 0.005, n = 16), with no MNI-glutamate (no Glu, 1.3% ± 3.0%,
n = 9), in remote ROI (as in D; 2.0% ± 3.5%, n = 11), and with 20 mM bumetanide whole-cell (1.4% ± 3.3%, n = 9); *p < 0.05 (df = 15); ***p < 0.005 (df = 23).

                                                                                                                  Neuron 108, 1–18, December 9, 2020 7
Please cite this article in press as: Henneberger et al., LTP Induction Boosts Glutamate Spillover by Driving Withdrawal of Perisynaptic Astroglia,
 Neuron (2020), https://doi.org/10.1016/j.neuron.2020.08.030

            ll
      OPEN ACCESS                                                                                                                                  Article

              A                                                                                     B

              C                                           D                                             E

                  F                                                                G

Figure 5. LTP Induction Triggers Withdrawal of Glial Glutamate Transporters Boosting Extracellular Glutamate Transient
(A) Perisynaptic patterns of bassoon (red cluster), Homer 1 (green cluster), and GLT1 (magenta dots) molecules localized with 3D dSTORM; one-synapse
example, three viewing angles shown; x-y-z scale bars, 500 nm (STAR Methods).
(B) Nearest-neighbor distances (probability density, mean ± SEM) between GLT1 and bassoon, in control tissue and ~30 min after cLTP induction (Figures S5A
and S5B; STAR Methods); sample size: Nm, inter-molecular distances; Nsyn, synapses; Npre, slices; SEM relates to Npre = 5; *p < 0.05 (gray segments, significant
difference).
(C) Diagram, extracellular immobilization of bFLIPE600n (Venus and ECFP attachments shown) via biotinylation and attachment to streptavidin (SA) (Figure S5D;
STAR Methods) in s. radiatum (delivery pipette shown).
(D) Experimental design: sensor-injecting pipette (field) records fEPSPs evoked by Schaffer collateral stimulation (stim) while bFLIPE600n signal is monitored
within an adjacent ROI (rectangle).
(E) Example, glutamate signal reported by bFLIPE600n (DR, ECFP/Venus signal ratio) in response to Schaffer collateral HFS (100 Hz for 1 s, red arrow; 10 mM
NBQX, 50 mM D-APV) in s. radiatum (also Figures S5E and S5F).
(F) Relative fEPSP slope (%, mean ± SEM) in control (green, n = 8 slices), during LTP induction (n = 14, orange), and with 50 mM APV present (n = 7, orange empty);
***p < 0.005, difference over 20–25 min post-induction.
(G) Traces, bFLIPE600n response to paired-pulses (20 Hz, arrows; mean ± SEM) in control (green) and ~25 min after LTP induction (orange). Plot, summary
(notations as in F); **p < 0.01, difference between LTP and either control or APV datasets.

et al., 2005) immobilized in the extracellular space (Okubo et al.,                sensitivity (Figure S5E) and could be delivered with a patch-
2010), as described previously (Zhang et al., 2018) (Figures 5C                    pipette (Figures 5C and 5D). Burst stimulation of Schaffer collat-
and S5D; STAR Methods). The sensor showed high glutamate                           erals induced a robust optical response (Figures 5E and S5F),

8 Neuron 108, 1–18, December 9, 2020
Please cite this article in press as: Henneberger et al., LTP Induction Boosts Glutamate Spillover by Driving Withdrawal of Perisynaptic Astroglia,
 Neuron (2020), https://doi.org/10.1016/j.neuron.2020.08.030

                                                                                                                                                 ll
Article                                                                                                                                    OPEN ACCESS

     A                         B                                  C                                            D

    E                                                                           F

      G                                                                          H

          I                                                                                                J

Figure 6. LTP Induction Broadens Evoked Extracellular Glutamate Transients
(A) Dendritic fragment, CA1 pyramidal cell (AF 594 channel); red dot, glutamate uncaging spot; yellow arrow, line scan position for iGluSnFR monitoring (Figures
S6A–S6C).
                                                                                                                               (legend continued on next page)

                                                                                                                Neuron 108, 1–18, December 9, 2020 9
Please cite this article in press as: Henneberger et al., LTP Induction Boosts Glutamate Spillover by Driving Withdrawal of Perisynaptic Astroglia,
Neuron (2020), https://doi.org/10.1016/j.neuron.2020.08.030
ll
OPEN ACCESS Article
which was significantly increased after LTP induction (Figures 5F Cofilin-Dependent PAP Shrinkage Boosts Activation of
and 5G). Because in similar settings, LTP induction has no effect Extrasynaptic NMDARs
on the overall amount of released glutamate (Diamond et al., Because astrocyte dialysis with peptide S3 reduces PAP VF in
1998; Lu€scher et al., 1998), the increased bFLIPE600n response baseline conditions (Figures 3G and 3H), we asked if this would,
suggests a greater sensor exposure to the extrasynaptic gluta- on its own, boost glutamate spillover. We noted that extrasynap-
mate transient. To test this at the synaptic level, we carried out tic NMDARs are predominantly GluN2B subunit-containing so
two further experiments, as described below. that their contribution to NMDAR EPSCs/EPSPs in area CA1
varies with the extent of glutamate spillover, in particular during
LTP Induction Widens Spatial Extracellular Transients of stimulus bursts (Lozovaya et al., 2004; Papouin et al., 2012; Sci-
Released Glutamate memi et al., 2004). To confine ourselves to one astrocyte and its
In the first experiment, we expressed the glutamate sensor ‘‘territorial’’ synapses, we recorded local fEPSPs (7 pulses at
iGluSnFR (Marvin et al., 2013) in area CA1, in either neurons 5 Hz) through the astrocyte patch pipette, previously termed as
or astroglia of the mouse hippocampus (STAR Methods). a-fEPSPs (Henneberger et al., 2010; Henneberger and Rusakov,
Optical iGluSnFR response to paired-pulse stimuli faithfully 2012). In baseline conditions, blocking GluN2B-containing
reflected Ca2+-dependent changes in fEPSPs (Figures S6A NMDARs with Ro 25-6981 unveiled their 8% ± 2% (n = 7) contri-
and S6B) and also their preserved paired-pulse ratio after bution to the 7th NMDAR a-fEPSP. However, if the astrocyte was
LTP induction (Figure S6C) (Diamond et al., 1998; Lu €scher dialyzed with S3, this contribution was 17% ± 3% (n = 7) (Figures
et al., 1998). 6I, 6J, and S6I). Thus, withdrawal of PAPs per se was capable of
We next monitored the spatial spread (FWHM) of the iGluSnFR boosting glutamate escape.
response to a 1-ms glutamate spot-uncaging pulse, either near a
postsynaptic dendrite (Figure 6A) or within an astrocyte ROI (Fig- Whisker-Stimulation-Induced LTP Reduces PAP
ure S6A) using line scans (Figures 6B and S6F), before and 10– Presence Near Firing Axons
30 min after the spot-uncaging LTP protocol (as in Figures 4A To assess physiological relevance of our observations, we
and 4B). LTP induction appeared to widen the iGluSnFR signal turned to tests in vivo. We focused on the established protocol
(Figures 6C and 6D; n = 12) but not when the iGluSnFR-express- of LTP induced at the thalamocortical synapses in the barrel cor-
ing astrocyte was dialyzed with bumetanide to block NKCC1 tex (layer II/III) by contralateral rhythmic whisker stimulation
(Figures 6D, S6F, and S6G). (RWS) (Gambino et al., 2014; Mégevand et al., 2009).
The second test aimed at detecting PAP changes near active Building upon our previous in vivo imaging protocols (Rey-
axonal boutons visualized using relatively sparse iGluSnFR nolds et al., 2019; Savtchenko et al., 2018; Zheng et al., 2015),
expression in S. radiatum. We focused on boutons that re- we expressed the green Ca2+ indicator GCaMP6f in the ventral
sponded optically to Schaffer collateral stimulation (five pulses posteromedial nucleus (VPM) that sends axonal projections to
at 20 Hz; Figure 6E) and recorded iGluSnFR signal landscapes the barrel cortex (Figure 7A). In parallel, we sparsely expressed
before and up to 90–120 min after LTP induction (Figures 6F the red-shifted, cytosol-soluble indicator (GfaABC1D) tdTomato
and S6H). Again, LTP induction increased the signal FWHM, in the barrel cortex astroglia (Figure 7B). Thus, we could monitor,
for up to 120 min (Figure 6H), although some boutons showed through an implanted cranial window, fine astroglial morphology
no change (Figure 6H), probably reflecting non-potentiated con- together with presynaptic Ca2+ dynamics in individual thalamo-
nections. The average effect was larger than that under spot-un- cortical projections (Figures 7C and 7D).
caging (Figure 6D), likely because burst stimulation amplifies First, we confirmed that PAP VF readout with tdTomato was
glutamate spillover (Lozovaya et al., 1999). similar to that with AF 594 (Figures S7A and S7B). Next, within
(B) Line scans (as in A; iGluSnFR channel) showing fluorescence transients in response to a 1 ms uncaging pulse (arrow, onset; red dot, position), before (top) and
20–25 min after the spot-uncaging LTP induction (bottom); dotted lines, time windows to sample baseline (F0) and evoked (F) fluorescence profiles, giving signal
profile DF = F F0 (STAR Methods).
(C) iGluSnFR fluorescence profiles (dots, pixel values) from test in (B); zero, uncaging spot position; black and orange lines, best-fit Gaussian.
(D) Summary of tests shown in (A)–(C): relative change (%, mean ± SEM) in DF/F0 signal full-width-at-half-magnitude (FWHM) ~25 min after LTP induction (LTP,
9.0% ± 3.4%; n = 12; *p < 0.03), and with 20 mM bumetanide inside astroglia (LTP+Bumetanide; 3.1% ± 3.0%; n = 7; *p < 0.02, df = 15; Figures S6D–S6G); dots,
individual tests.
(E) Diagram, monitoring evoked glutamate release from Schaffer collateral boutons with iGluSnFR, acute slices. Images: iGluSnFR fluorescence landscape s.
radiatum in resting conditions (F0) and during five stimuli at 20 Hz (F); arrows, two tentative axonal boutons, false colors.
(F) Evoked iGluSnFR signal landscapes (DF = F F0; ROI as in E) just before (0 min, as in E) and 30, 55, and 90 min after LTP induction (red arrow; Figure S6H;
STAR Methods); false colors.
(G) Relative fEPSP slope (%, mean ± SEM, n = 8 slices), protocol as in (E) and (F); arrow, LTP induction; ***p < 0.001 (relative to no-HFS control, n = 4; over 25–
35 min post-induction; df = 10).
(H) The FWHM of evoked iGluSnFR DF signals relative to baseline, over 5–35 min in control conditions (control, n = 17 boutons), 5–35 min (n = 31), and 40–120 min
(n = 21) after LTP induction, as shown; dots, individual boutons; bars, mean ± SEM; ***p < 0.005 (df = 46; 4 slices).
(I) Upper traces, examples of CA1 astrocyte-recorded fEPSPs (a-fEPSP, current clamp, isolated NMDAR component; 3–5 trial average) evoked by 7 stimuli at
5 Hz, in baseline conditions (black) and after blocking GluN2B-containing NMDARs (1 mM Ro 25-6981, red); control cell and one dialyzed with 200 mM peptide S3
shown, as indicated; lower traces, fragments (rectangles) showing the 7th a-fEPSPs (pre-pulse baseline adjusted; see Figure S6I for extended traces).
(J) Summary of tests shown in I; ordinate, reduction of the a-fEPSP amplitude by Ro 25-698; dots, individual cells; bars, mean ± SEM; *p < 0.05 (n = 7 in control and
S3; df = 12).
10 Neuron 108, 1–18, December 9, 2020Please cite this article in press as: Henneberger et al., LTP Induction Boosts Glutamate Spillover by Driving Withdrawal of Perisynaptic Astroglia,
Neuron (2020), https://doi.org/10.1016/j.neuron.2020.08.030
ll
Article OPEN ACCESS
A B C D
E F
G H
Figure 7. Whisker-Stimulation LTP Protocol in the Barrel Cortex In Vivo Triggers PAP VF Reduction in Astroglia Trespassed by Stimu-
lated Axons
(A) Expression of GCaMP6f 3 weeks post-transfection (STAR Methods) into the mouse ventral posteromedial nucleus (VPM), coronal section; LV, lateral ventricle;
CPu caudate putamen; wide-field image, fixed tissue.
(B) Composite post hoc image, barrel cortex area (coronal section), with astroglia expressing GfaABC1D tdTomato (magenta; STAR Methods) and neuronal
structures expressing GCaMPf6 (green); dotted rectangle (inset, arrow) highlights astrocytes with axonal boutons occurring nearby.
(C) Experiment diagram: 2PE imaging of the barrel cortex (S1BF) through a cranial window, with two fs lasers. LTP induction protocol uses RWS (5 Hz air-puffs for
120 s) on the contralateral side.
(D) Live barrel cortex view (S1BF) through the cranial window (lx2P = 1,040 and 910 nm, single focal section). Green (GCaMPf6), heatmap of axonal signals firing in
response to RWS; magenta (tdTomato), local astroglia; circles, examples of ROIs for PAP VF readout in proximity to RWS-responding thalamocortical axons
(green; Figures S7A and S7B).
(E) Example, a thalamocortical axon in S1BF (GCaMP6f, green) crossing astroglial territory (tdTomato, magenta), with boutons responding to an RWS test (3 Hz, 5
s) with Ca2+ elevations (middle panel).
(F) Time course of Ca2+ signal (GCaMP6f) at five axonal boutons (green traces) shown in (E); black line, average.
(legend continued on next page)
Neuron 108, 1–18, December 9, 2020 11Please cite this article in press as: Henneberger et al., LTP Induction Boosts Glutamate Spillover by Driving Withdrawal of Perisynaptic Astroglia,
Neuron (2020), https://doi.org/10.1016/j.neuron.2020.08.030
ll
OPEN ACCESS Article
the tdTomato-expressing astrocyte domains, we found axonal that the trial-to-trial time decay of NMDAR EPSCs was similar
boutons that showed Ca2+ elevations in response to an RWS among potentiated and non-potentiated pathways, suggesting
test (3 Hz air puffs for 5 s) (Figures 7E and 7F). This enabled us no effects of LTP induction on the overall release probability (Fig-
to monitor PAP VF in within 3 mm of active boutons, before ure S8D), as reported here (Figures S6A–S6C) and earlier (Dia-
and after LTP induction by RWS (3 Hz air 100 ms stimuli for mond et al., 1998; Lu €scher et al., 1998; Manabe and Nicoll, 1994).
120 s) (Figure 7C). LTP induction by contralateral RWS triggered
PAP VF reduction (5 cells, 3 animals) whereas the same protocol DISCUSSION
applied ipsilaterally had no effect (12 cells, 4 animals) (Figures 7G
and 7H). Biophysical Plausibility
We used a similar imaging design in a complementary test in Our results suggest that LTP induction prompts nanoscopic
acute hippocampal slices. We loaded a CA3 pyramidal cell withdrawal of PAPs, which boosts extrasynaptic glutamate
with OGB-1 and traced its axon into area CA1, which was popu- escape, thus enhancing NMDAR activation away from the
lated with tdTomato-expressing astroglia (Figures S7C and release site, potentially at nearby synapses (Figure 8D). To
S7D). We then paired presynaptic spikes (triggered by somatic assess biophysical plausibility of these events, we modeled
depolarization pulses) with postsynaptic CA1 pyramidal cell de- CA3-CA1 synaptic environment (Figure S8E) (Zheng et al.,
polarization induced by periodic extracellular stimuli (Figures 2008) and simulated three scenarios that might reflect our obser-
S7E and S7F). This LTP-inducting pairing protocol reduced vations: GLT1-enriched PAPs (1) withdraw without losing any
PAP VF near activated axonal boutons by 12% ± 2% (n = 5) GLT1, (2) withdraw while losing some GLT1, or (3) re-arrange
whereas no such reduction occurred away from the firing axon laterally with the same GLT1 numbers (Figure S8F), which partly
(change 3.4% ± 1%, n = 10; difference at p < 0.01, degrees of exposes extrasynaptic NMDARs. After multiple runs (example in
freedom [df] = 13) (Figure S7E; Video S3). Video S4), scenario (1) appeared most likely in boosting remote
NMDAR activation (Figure S8G).
LTP Induction Prompts NMDAR-Mediated Cross-Talk
among Synapses Cellular Mechanisms of LTP-Dependent PAP
To test if the LTP-associated increase in glutamate escape pro- Withdrawal
motes activation of high-affinity NMDARs at neighboring, non- We found that the LTP-associated PAP withdrawal depends on
active connections, we used a protocol established specifically NKCC1, a key morphology regulator in brain cell migration (Gar-
to monitor NMDAR-mediated cross-talk among independent zon-Muvdi et al., 2012; Haas and Sontheimer, 2010). In glioma
CA3-CA1 synapses (Scimemi et al., 2004). It takes advantage cells, NKCC1 mediates dramatic hydrodynamic volume changes
of the use-dependent NMDAR inhibitor MK801, which blocks that enable invasion of intact tissue (Watkins and Sontheimer,
the receptor channel upon its opening. Thus, if NMDARs at 2011), probably by boosting intracellular chloride up to
non-active (silent) synapses get blocked by MK801 they must 140 mM (Habela et al., 2009). The NKCC1-regulated phosphor-
have been activated by glutamate molecules escaping from ylation of cofilin-1 has been revealed in glioblastoma (Schiappar-
nearby active synapses. elli et al., 2017), and we found that inhibiting cofilin-1 phosphor-
First, we used paired-pulse stimuli to confirm independence of ylation with peptide S3 occluded LTP-induced PAP shrinkage,
two Schaffer collateral pathways converging to a CA1 pyramidal suggesting a shared molecular pathway. An alternative interpre-
cell (Figure S8A). Second, we recorded AMPA receptor-medi- tation is that both mechanisms simply reduce PAP VF to a
ated EPSCs (AMPAR EPSCs), then NMDAR EPSCs, elicited in maximal degree. Yet, astrocyte dialysis with S3 does boost
either pathway (Figure 8A). Third, we applied MK801 and re- glutamate spillover, similar to the LTP case.
corded declining NMDAR EPSC responses in one (active) What activates NKCC1 upon LTP induction remains to be as-
pathway only (Figure 8A). When stimulation resumed in the other, certained. One possibility is that intense activation of local
silent pathway, its NMDAR EPSC amplitude was close to its NMDARs and GLT1 leads to a hotspot of K+ efflux (Shih et al.,
baseline value (Figures 8A, top dotted line, and S8B, no-LTP, 2013). Classically, NKCC1 is activated by excess of external
silent). Thus, the silent pathway had little cross-activation of its K+ (Russell, 2000) whereas proton transport by GLT1 could
NMDARs by synaptic discharges in the active pathway. help boost cofilin-dependent actin assembly. Although this
The outcome was different when we induced LTP of AMPAR appears plausible (Figure 8E), a better understanding of the
EPSCs in the active pathway (Figure 8B). Here, resuming stimu- mechanisms relating PAP plasticity to NKCC1 and cofilin, and
lation of the silent pathway revealed reduced NMDAR EPSCs probably to other morphogenic agents of astroglia such as neu-
(Figure 8B, cross-talk). Thus, a proportion of NMDARs here roligins (Stogsdill et al., 2017), requires a separate study.
must have been activated by glutamate escaping from synapses
in the active pathway (see Discussion for quantitative estimates). 3D EM: Faithful Representation of Live Tissue?
LTP induction in the silent pathway, or in both pathways, pro- The relevance of fixed-tissue EM has recently been questioned:
duced similar outcome (Figures 8C and S8C). We confirmed chemical fixation in vivo can cause linear tissue contraction by
(G) PAP VF change (%, mean ± SEM), during RWS LTP induction protocol (arrow, onset), near axonal boutons responding to contralateral RWS (orange, n = 5
cells, 3 animals), and in during ipsilateral RWS (n = 12 cells, 4 animals).
(H) Summary of experiments in (G): PAP VF change (%, mean ± SEM) over 15–30 min after the RWS LTP protocol onset; dots, data from individual cells; *p < 0.04 (t
test, df = 15 for two-sample comparison).
12 Neuron 108, 1–18, December 9, 2020Please cite this article in press as: Henneberger et al., LTP Induction Boosts Glutamate Spillover by Driving Withdrawal of Perisynaptic Astroglia,
Neuron (2020), https://doi.org/10.1016/j.neuron.2020.08.030
ll
Article OPEN ACCESS
Figure 8. LTP Induction Boosts NMDAR-
Mediated Inter-synaptic Cross-Talk
(A) Inset diagram, experiment design to test
NMDAR-mediated cross-talk between two afferent
pathways (green and orange lightning) (Scimemi
et al., 2004) (Figure S8A; STAR Methods). Plot,
relative EPSC amplitude (mean ± SEM, n = 13), with
single stimuli, 20 s apart, applied alternately to the
two pathways (green and orange). AMPAR EPSCs
are recorded for 12–15 min (Vm = 70 mV; left
ordinate), then NMDAR EPSCs for ~5 min (10 mM
NBQX, Vm = 20 mV; right ordinate). Once MK801 is
added, NMDAR EPSCs are recorded in active
(green) pathway only. Resuming stimulation in the
silent (orange) pathway reveals little change in the
NMDAR EPSC amplitude compared to baseline
(dotted line).
(B) Experiment as in (A) but with LTP induced in the
active pathway (red arrow; n = 7). Reduced NMDAR
EPSCs in the silent (orange) pathway upon resumed
stimulation (arrow, cross-talk) point to NMDAR
activation by glutamate escaping from the active
(green) pathway.
(C) Summary of experiments in (A) and (B). The de-
gree of cross-talk (percentage of one-pathway
NMDARs activated by glutamate discharges at the
other pathway; mean ± SEM), in control (Cntrl, n =
13), with LTP induced either in one (LTP-one, n = 10)
or both (LTP-both, n = 11; Figures S8C and S8D)
pathways, prior to NMDAR EPSC recordings; *p <
0.05 (df = 21 for Cntrl versus LTP-one), **p < 0.01
(df = 22), ***p < 0.005.
(D) Proposed changes in PAPs after LTP induction.
In baseline conditions (left), PAPs restrict glutamate
action to the synaptic cleft and some extrasynaptic
NMDARs (red dots). After LTP induction (right),
some PAPs withdraw, widening the pool of acti-
vated extrasynaptic NMDARs, including neigh-
boring synapses.
(E) Diagram, candidate cellular mechanisms of LTP-
driven PAP withdrawal. LTP induction activates
postsynaptic NMDARs and engages GLT1 trans-
porters. This generates an extracellular K+ hotspot,
activating the NKCC1-cofilin-1 pathway that en-
gages, in a pH-sensitive manner, actin polymeriza-
tion responsible for morphogenesis.
18% resulting in 2% VF for the extracellular space and dis- et al., 1991) even though their overall VF decreases. Similarly,
torted PAP morphology (Korogod et al., 2015). However, we do not dispute previous findings reporting high PAP mobility
different fixation protocols produce different outcomes. Here, or morphological plasticity detected with fluorescence imaging
we used rapid slice fixation by submersion: our earlier studies re- (Bernardinelli et al., 2014; Haber et al., 2006; Hirrlinger et al.,
ported 5%–6% linear hippocampal shrinkage under a similar 2004; Perez-Alvarez et al., 2014) but note that mobility of the
protocol (Rusakov et al., 1998), whereas in vivo fixation gave fluorescent label, or fluctuations in focus, laser power, or tissue
12% extracellular space VF in area CA1 (Rusakov and Kull- optical properties, might add to the perceived motility.
mann, 1998). In chemically fixed CA1 tissue, PAPs occupied
9% of tissue volume (Lehre and Rusakov, 2002), which falls PAP Withdrawal and Extrasynaptic Glutamate Actions
within the range estimated here with live 2PE imaging. A similar Remodeling of GLT1-enriched PAPs on the nanoscale will not
correspondence was observed in other studies (Medvedev affect total glutamate uptake by astroglia because all released
et al., 2014; Savtchenko et al., 2018). molecules will still be bound by local GLT1 and taken up by the
We made no attempt to assess PAP shapes or exact position, same astrocyte. Thus, LTP induction should have little effect
which, in addition to protocol differences, might explain an on the astrocyte uptake currents measured by a somatic pipette
apparent discrepancy with some previous results. For instance, (Diamond et al., 1998; Lu €scher et al., 1998). However, reduced
smaller PAPs that occur closer to synapses might well count as PAP coverage suggests that glutamate should dwell longer
an increased PAP occurrence (Lushnikova et al., 2009; Wenzel and travel further in the extracellular space, thus allowing
Neuron 108, 1–18, December 9, 2020 13Please cite this article in press as: Henneberger et al., LTP Induction Boosts Glutamate Spillover by Driving Withdrawal of Perisynaptic Astroglia,
Neuron (2020), https://doi.org/10.1016/j.neuron.2020.08.030
ll
OPEN ACCESS Article
high-affinity optical sensors to compete more successfully with B LTP induction ex vivo
GLT1 (Armbruster et al., 2020; Kopach et al., 2020). Thus, the op- B 2PE imaging of astroglia ex vivo
tical glutamate signal is enhanced after LTP induction. B iGluSnFR transduction in astroglia
We examined NMDAR-mediated cross-talk between two B iGluSnFR transduction in neurons
independent pools of CA3-CA1 synapses and found that, B Viral transduction of astroglial GFP
following LTP induction, 120 discharges in the active pool acti- B Dual transduction in the barrel cortex
vated 40% NMDARs in the silent pool. Although this suggests B Cranial window implantation
only 0.4% per discharge, this protocol activates only 2%–3% B Multiplexed 2PE imaging in vivo
of CA3-CA1 connections (Scimemi et al., 2004). With the synap- B Monitoring PAP VF
tic nearest-neighbor distance in CA1 of 0.5 mm (Rusakov and B Fluorescence recovery after photobleaching (FRAP)
Kullmann, 1998), 2% synapses will be separated by 0.5 3 experiments
(0.021/3) 1.8 mm. The travel distance increase from 0.5 to B Optical measurements of extracellular diffusivity
1.8 mm corresponds to a >100-fold drop in the glutamate con- B STED microscopy in organotypic slices
centration transient post-release (Rusakov, 2001; Zheng et al., B Fast fixation and DAB staining
2008). Thus, cross-talk among 2%–3% synapses accumulated B 3D electron microscopy
over 120 discharges could underestimate cross-talk between B Astroglial coverage in 3D EM
nearest neighbors per discharge. B Chemical LTP induction
The increased exposure of glutamate to the extracellular B Three-color 3D dSTORM
space after LTP induction might explain why some earlier studies B LTP induction by 2PE glutamate spot-uncaging
reported increased extracellular glutamate transients detected B Probing ephrins and extracellular matrix
with micro-dialysis (Bliss et al., 1986; Errington et al., 2003). It B Glutamate imaging with FLIPE600n
might also explain the reduced NMDAR EPSC variability at B Glutamate imaging with iGluSnFR
CA3-CA1 synapses (Kullmann et al., 1996), an enhanced local B Two-pathway cross-talk experiments
excitability of pyramidal cell dendrites (Frick et al., 2004), and B Monte Carlo simulations
why LTP at one synapse could lower the LTP induction threshold d QUANTIFICATION AND STATISTICAL ANALYSIS
at its neighbors (Harvey and Svoboda, 2007). Other important
consequences could be a boost in NMDAR-driven dendritic SUPPLEMENTAL INFORMATION
spikes (Chalifoux and Carter, 2011), facilitated plasticity at silent
Supplemental Information can be found online at https://doi.org/10.1016/j.
connections nearby (Tsvetkov et al., 2004), or increased hetero-
neuron.2020.08.030.
synaptic depression (Vogt and Nicoll, 1999).
ACKNOWLEDGMENTS
PAP Remodeling on Longer Timescales
Our observations in slices were necessarily limited to 30–90 min We thank J. Angibaud for organotypic cultures and R. Chereau and J. Tonne-
after LTP induction, and to 30–35 min in vivo (to avoid concom- sen for help with the STED microscope; also D. Gonzales and the Neurocentre
Magendie INSERM U1215 Genotyping Platform, for breeding management
itants of animal stress in 2- to 3-h long experiments). This does
and genotyping. This work was supported by the Wellcome Trust Principal Fel-
not preclude the possibility for PAP coverage to re-establish it-
lowships 101896 and 212251, ERC Advanced Grant 323113, ERC Proof-of-
self on a longer timescale. Indeed, unlimited accumulation of Concept Grant 767372, EC FP7 ITN 606950, and EU CSA 811011 (D.A.R.);
LTP must lead to runaway excitation unless synaptic weight NRW-Ru €ckkehrerpogramm, UCL Excellence Fellowship, German Research
re-scaling follows it. One might therefore expect a similar dy- Foundation (DFG) SPP1757 and SFB1089 (C.H.); Human Frontiers Science
namic sequence of PAP remodeling on a longer timescale, which Program (C.H., C.J.J., and H.J.); EMBO Long-Term Fellowship (L.B.); Marie
remains an important and intriguing question to be addressed in Curie FP7 PIRG08-GA-2010-276995 (A.P.), ASTROMODULATION (S.R.);
Equipe FRM DEQ 201 303 26519, Conseil Régional d’Aquitaine R12056GG,
chronic experiments.
INSERM (S.H.R.O.); ANR SUPERTri, ANR Castro (ANR-17-CE16-0002), R-
13-BSV4-0007-01, Université de Bordeaux, labex BRAIN (S.H.R.O. and
STAR+METHODS U.V.N.); CNRS (A.P., S.H.R.O., and U.V.N.); HFSP, ANR CEXC, and France-
BioImaging ANR-10-INSB-04 (U.V.N.); and FP7 MemStick Project No.
Detailed methods are provided in the online version of this paper 201600 (M.G.S.).
and include the following:
AUTHOR CONTRIBUTIONS
d KEY RESOURCES TABLE D.A.R. and C.H. conceived the study. C.H., L.B., O.K., D.M., M.K.H., S.A., and
d RESOURCE AVAILABILITY T.P.J. designed and carried out patch-clamp, morphometry, imaging experi-
B Lead Contact ments, and analyses in slices. A.P., S.H.R.O., and U.V.N. designed and carried
B Materials Availability out STED tests. J.P.R. designed and carried out in vivo tests and analyses.
B Data and Code Availability N.I.M., I.K., and M.G.S. designed and carried out 3D EM studies. I.S.-R.,
C.J.J., and H.J. designed the modified glutamate sensor bFLIPE600n. S.R.
d EXPERIMENTAL MODEL AND SUBJECT DETAILS
and D.M. performed S3 peptide tests. J.H. designed and carried out dSTORM
B Animals
studies. K.Z. performed biophysical modeling and dSTORM analyses. O.P.O.
d METHOD DETAILS and E.A.N. provided expertise and materials pertinent to AQP4 tests. D.A.R.
B Preparation of acute slices designed experiments, analyzed the data, and wrote the manuscript, which
B Electrophysiology ex vivo was subsequently contributed to by all the authors.
14 Neuron 108, 1–18, December 9, 2020You can also read