The potential current distribution of the coypu (Myocastor coypus) in Europe and climate change induced shifts in the near future - NeoBiota
←
→
Page content transcription
If your browser does not render page correctly, please read the page content below
A peer-reviewed open-access journal
NeoBiota 58: 129–160 (2020)
                 The potential current distribution of the coypu (Myocastor coypus) in Europe...                                       129
doi: 10.3897/neobiota.58.33118                             RESEARCH ARTICLE                                                      NeoBiota
http://neobiota.pensoft.net                                                                               Advancing research on alien species and biological invasions

         The potential current distribution of the coypu
        (Myocastor coypus) in Europe and climate change
                induced shifts in the near future

Anna Schertler1, Wolfgang Rabitsch2, Dietmar Moser1, Johannes Wessely1, Franz Essl1

1 Division of Conservation Biology, Vegetation Ecology and Landscape Ecology, Department of Botany and Bio-
diversity Research, University of Vienna, Rennweg 14, 1030 Vienna, Austria 2 Environment Agency Austria,
Department of Biodiversity and Nature Conservation, Spittelauer Lände 5, 1090 Vienna, Austria

Corresponding author: Anna Schertler (anna.schertler@univie.ac.at)

Academic editor: I. Kühn             | Received 7 July 2019 | Accepted 13 May 2020 | Published 17 July 2020

Citation: Schertler A, Rabitsch W, Moser D, Wessely J, Essl F (2020) The potential current distribution of the coypu
(Myocastor coypus) in Europe and climate change induced shifts in the near future. NeoBiota 58: 129–160. https://doi.
org/10.3897/neobiota.58.33118

Abstract
The coypu (Myocastor coypus) is a semi-aquatic rodent native to South America which has become invasive
in Europe and other parts of the world. Although recently listed as species of European Union concern in
the EU Invasive Alien Species Regulation, an analysis of the current European occurrence and of its poten-
tial current and future distribution was missing yet. We collected 24,232 coypu records (corresponding to
25,534 grid cells at 5 × 5 km) between 1980 and 2018 from a range of sources and 28 European countries
and analysed them spatiotemporally, categorising them into persistence levels. Using logistic regression,
we constructed consensus predictions across all persistence levels to depict the potential current distribu-
tion of the coypu in Europe and its change under four different climate scenarios for 2041–2060. From
all presence grid cells, 45.5% showed at least early signs of establishment (records temporally covering a
minimum of one generation length, i.e. 5 years), whereas 9.8% were considered as containing established
populations (i.e. three generation lengths of continuous coverage). The mean temperature of the warmest
quarter (bio10), mean diurnal temperature range (bio2) and the minimum temperature of the coldest
month (bio6) were the most important of the analysed predictors. In total, 42.9% of the study area are
classified as suitable under current climatic conditions, of which 72.6% are to current knowledge yet
unoccupied; therefore, we show that the coypu has, by far, not yet reached all potentially suitable regions

Copyright Anna Schertler et al. This is an open access article distributed under the terms of the Creative Commons Attribution License (CC BY 4.0),
which permits unrestricted use, distribution, and reproduction in any medium, provided the original author and source are credited.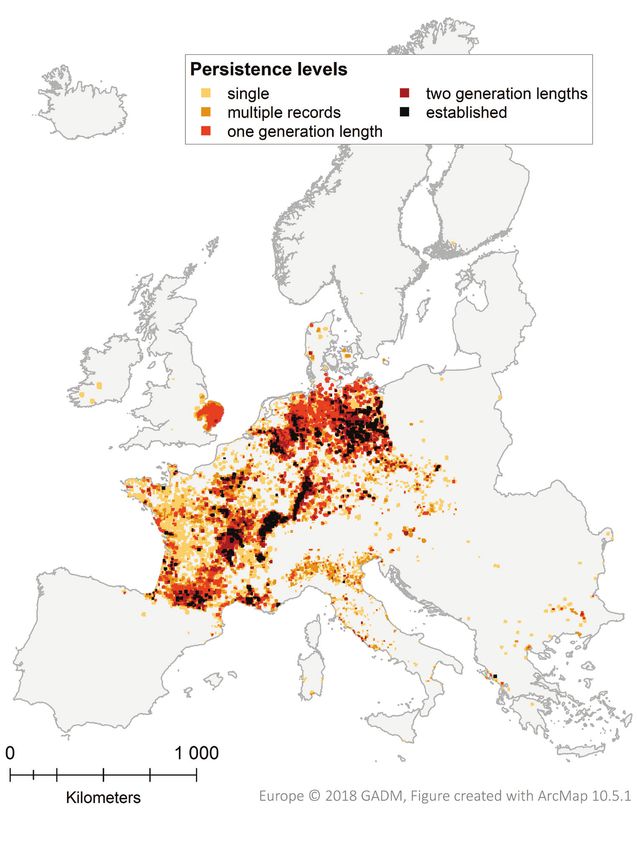
130                       Anna Schertler et al. / NeoBiota 58: 129–160 (2020)

in Europe. Those cover most of temperate Europe (Atlantic, Continental and Pannonian biogeographic
region), as well as the coastal regions of the Mediterranean and the Black Sea. A comparison of the suit-
able and occupied areas showed that none of the affected countries has reached saturation by now. Under
climate change scenarios, suitable areas will slightly shift towards Northern regions, while a general de-
crease in suitability is predicted for Southern and Central Europe (overall decrease of suitable areas 2–8%
depending on the scenario). Nevertheless, most regions that are currently suitable for coypus are likely
to be so in the future. We highlight the need to further investigate upper temperature limits in order to
properly interpret future climatic suitability for the coypu in Southern Europe. Based on our results, we
identify regions that are most at risk for future invasions and provide management recommendations. We
hope that this study will help to improve the allocation of efforts for future coypu research and contribute
to harmonised management, which is essential to reduce negative impacts of the coypu and to prevent
further spread in Europe.

Keywords
biological invasions, climate change, consensus prediction, invasive alien species management, nutria,
species distribution modelling, vertebrate

Introduction

Invasive alien species, i.e. species introduced to areas outside their native range that have
become successfully established, spread and cause substantial impacts on the new envi-
ronment (CBD 2002), are one of the main constituents of global change (Simberloff et
al. 2013). They are a major cause of biodiversity loss, often associated with significant
economic losses and negative impacts on human health (IPBES 2019).
     One prominent example, even included in the list of “100 of the World’s Worst Inva-
sive Alien Species” (Lowe et al. 2004), is the coypu, Myocastor coypus (Molinia 1782). This
large semi-aquatic rodent native to subtropical and temperate South America was intro-
duced to many regions of the world and subsequently often became invasive in those re-
gions of introduction, for example, in Europe, North America and Asia (Carter and Leon-
ard 2002, Hong et al. 2015, Ojeda et al. 2017, Tsiamis et al. 2017, Kawamura et al. 2018).
The fur industry, being the main historic invasion vector beside zoos, game and biocontrol
(e.g. for removal of aquatic vegetation), has led to the establishment of coypu farms all over
the world, with the first registered introductions to Europe dating back to the second half
of the 19th century (Carter and Leonard 2002, Scheide 2013, Tsiamis et al. 2017). Escaped
or intentionally-released animals, as well as deliberate introductions subsequently served as
source for wild populations (Carter and Leonard 2002, Tsiamis et al. 2017).
     Negative impacts of the coypu are mainly due to its burrowing activity and feeding
behaviour and include undermining of flood protection structures, such as river banks
and dykes and therefore increased risk of floods, as well as agricultural damage, mainly
on corn and sugar beet (Gosling and Baker 1989, Woods et al. 1992, Carter and Leonard
2002, DAISIE 2009, Scheide 2013, Tsiamis et al. 2017). For instance, within a six year
period in Italy, damage amounted to about €1 million in agriculture and more than €10
million were attributed to the destruction of riverbanks (Panzacchi et al. 2007). Vari-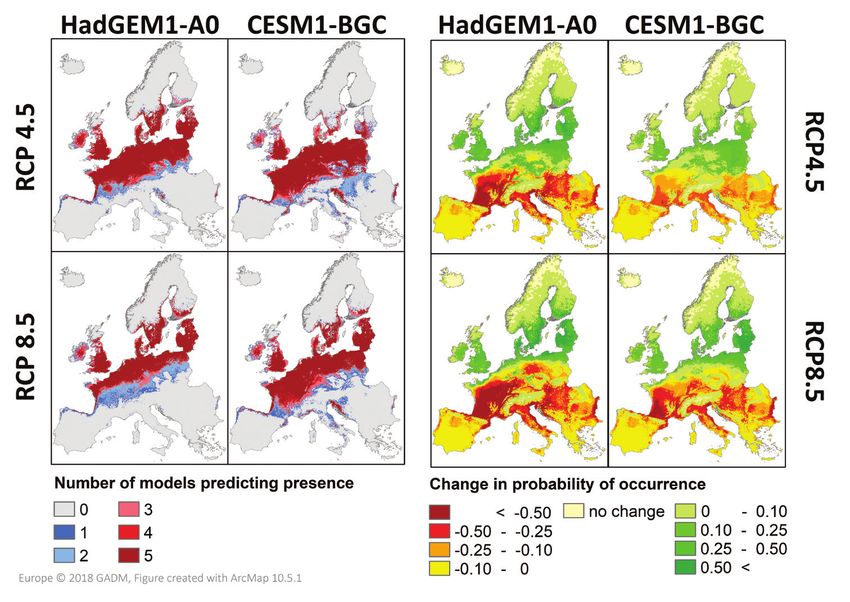
The potential current distribution of the coypu (Myocastor coypus) in Europe...   131

ous studies report that dense coypu populations can reduce plant diversity and destroy
seedlings, influencing vegetation succession and preventing re-vegetation in marshes and
wetlands. There are reports of coypus severely affecting wetland vegetation, for example,
in Italy (Bertolino et al. 2005, Prigioni et al. 2005), Great Britain (Gosling and Baker
1989) and Louisiana (Baroch et al. 2002). Additionally, the coypu is a potential vector of
hazardous diseases such as leptospirosis, toxoplasmosis and trichinosis (Carter and Leon-
ard 2002, Scheide 2013, Fratini et al. 2015). Another aspect is the potential negative
impact on breeding success of marshland birds by using floating nests as resting ground
and consequently destroying or sinking the eggs (Bertolino et al. 2012).
     The coypu is an opportunistic herbivore, preferably inhabiting slow-flowing or
standing water bodies that are rich in hydrophytes, reeds and riparian vegetation, as well
as wetland areas and swamps in lowlands (Woods et al. 1992). According to Baroch et
al. (2002), coypus are capable of long distance dispersal, although they usually do show
philopatric behaviour. However, if the environmental conditions become suboptimal, for
example, due to drought or limited food resources, coypus may migrate. In this case, they
primarily disperse along waterways (Hong et al. 2015). Although there is little informa-
tion on coypu dispersal behaviour in general, there are reports of a range expansion in
Eastern Europe of up to 120 km within a two-year period (Aliev 1968), dispersal dis-
tances of 67 km within eight years along the Norfolk river (Gosling and Baker 1989) and
about 50 km per year at the lower Nakdong River in South Korea (Hong et al. 2015). In
contrast, coypus barely travel more than 200 m away from aquatic habitats while forag-
ing (Scheide 2013) and Denena et al. (2003) showed very small individual daily linear
travel distances (143–475 m) under favourable environmental conditions. Coypus are
non-seasonal breeders and have a high reproduction rate with about 2 to 3 litters per
year (litter size 1–12) under favourable conditions (Woods et al. 1992, DVWK 1997,
Guichón et al. 2003, Scheide 2013). Mild winters favour rapid population growth,
through decreased fitness loss and mortality, as well as additional reproduction events in
the cold period (Gosling and Baker 1989, Woods et al. 1992), underlining the impor-
tance of considering recent climate change in studies on this species.
     Nowadays, the coypu is established in many European regions (Tsiamis et al. 2017).
However, management measures differ across Europe, often even within countries. In
some countries, the coypu is included in hunting laws or hunting is allowed with ex-
ceptional permission. Others conduct intensive control programmes with government
trappers and volunteers such as farmers, for example, in Belgium (Verbeylen 2002, K
Swinnen personal communication), France (Carter and Leonard 2002), Italy (Bertolino,
Perrone & Gola 2005; S Bertolino personal communication) and the Netherlands (Unie
van Waterschappen 2017; D Moerkens personal communication). In Great Britain, a
successful eradication programme was undertaken between 1981 and 1989 (Gosling
and Baker 1989). Recently, the coypu became listed as one of 66 invasive alien species of
Union concern (EU Commission 2016, 2017, 2019) associated with the EU regulation
on invasive alien species (EU Commission 2014). Member states are therefore obliged to
implement strategies, which encompass the prevention of introduction and spread, early
detection and eradication or management of those species.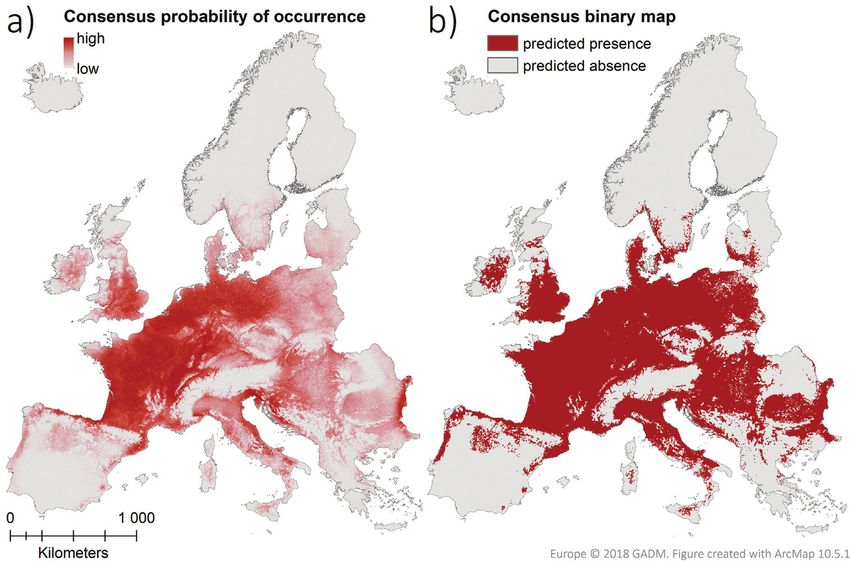
132                   Anna Schertler et al. / NeoBiota 58: 129–160 (2020)

     However, successful management requires an adequate understanding of the ecol-
ogy and behaviour of the targeted species (Jiménez-Valverde et al. 2011, Kawamura et
al. 2018). In particular, assessing current and future potential distribution, taking into
account global change, is key for successful management and the identification of prior-
ity management and monitoring regions (van Klinken et al. 2015). One widely used
approach to reveal potential distributions of invasive alien species is via species distribu-
tion models (SDMs), which correlate a species' occurrence in geographical space with
environmental variables in order to predict its potential distribution through spatial and
temporal extrapolation (Elith and Leathwick 2009, Václavík and Meentemeyer 2009,
Franklin 2010, Jiménez-Valverde et al. 2011). Although some studies have applied SDMs
to the coypu (Bertolino and Ingegno 2009, Scheide 2013, Farashi and Najafabadi 2015,
Hong et al. 2015, Jarnevich et al. 2017), a detailed investigation on a pan-European scale,
taking into account land cover, bioclimatic and socioeconomic factors, is yet missing.
     In the light of the urgent need of a harmonised coypu management, here we
provide such an assessment for Europe. Specifically, we reconstruct the recent spread
within the last decades and the current distribution of the coypu and group the occur-
rence data into different persistence-categories to identify regions that are suitable for
permanent occurrence of coypus. Further, by using a consensus approach, we predict
its potential current distribution and analyse to what extent suitable regions are not yet
invaded. Finally, we investigate which climatic, land cover and socioeconomic variables
influence coypu occurrence and model the potential future distribution under four dif-
ferent climate change scenarios. Based on our results, we identify regions that are most
at risk for future invasions and provide management recommendations.

Methods
Study area and data acquisition

The study region includes most parts of the European mainland and the larger islands
(excluding only European Russia, Ukraine, Belarus and Cyprus) (Fig. 1). To provide an
up-to-date overview of the current distribution of the coypu, data from several sources
such as publications, national administrative authorities and scientists were compiled
between July 2017 and December 2018 (Suppl. material 1, Table S1). Additionally, we
downloaded occurrence data from the Global Biodiversity Information Facility (GBIF.
org). The occurrence of persisting populations in the Boreal, Arctic and northern Al-
pine biogeographic regions (European Environment Agency 2002) is not mentioned
in literature (Carter and Leonard 2002, DAISIE 2009, Tsiamis et al. 2017), thus, no
further effort has been made in sending out data requests for those regions. The same
applies to Portugal, from where occurrences are not known either (Carter and Leonard
2002, Tsiamis et al. 2017). We did not include data from the coypu’s native range,
because there are only few spatially explicit records available, as already pointed out by
Jarnevich et al. (2017).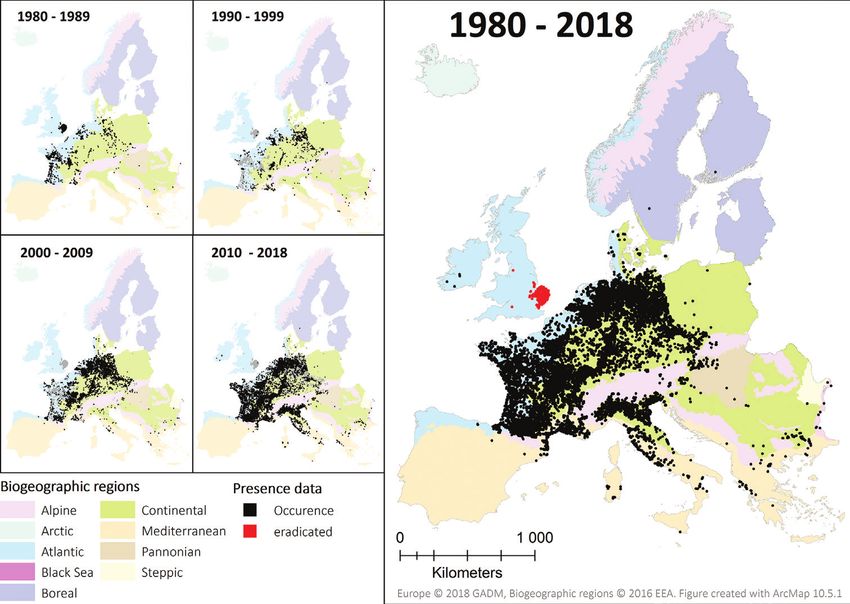
The potential current distribution of the coypu (Myocastor coypus) in Europe...            133

Figure 1. Coypu occurrence records from 1980 to 2018 in Europe. The decade-wise accumulation of
records is depicted on the left side, with records of the respective decade in black and records of previous
decades shown in grey. On the summary map (right side), records in Great Britain are displayed in red,
as the coypu is officially eradicated (see Gosling and Baker 1989). Note, that for optimised illustration
purposes, 10-km buffered centroids of occurrence records are shown.

Occurrence data
The raw occurrence data were prepared and quality-checked prior to analyses. If a source
described the occurrence of coypu over several decades, the record was split into one re-
cord per decade. Only records that contained geographic information and approximate
sampling date were considered in this study. Records that were lacking coordinates, but
contained an unambiguous locality description, were georeferenced, either using the
point-radius method (estimating coordinates and an uncertainty radius according to
the precision of the locality description) or the shape method (assigning a geographic
shape that represents the uncertainty) (Wieczorek et al. 2004); i.e. for France and Ger-
many, locality descriptions at municipality levels were linked to the according feature
of the GADM 3.4 shapefile (database of Global Administrative Areas, https://gadm.
org/). Point-radius georeferencing was conducted using the GeoLocate web tool (Rios
and Bart 2010) and web map services. Coordinate uncertainty estimates were used to
buffer the records. Note that for records linked with the municipality area, no buffers
were introduced; thus, the uncertainty information was linked with the shape and size
of the municipalities. As the coypu is a mobile species, a circular buffer of 1 km radius
134                   Anna Schertler et al. / NeoBiota 58: 129–160 (2020)

was applied to records with very low uncertainty estimates to sufficiently cover potential
home ranges and account for cases were records fall at the borders of grid cells. After
a literature research on coypu home ranges (Doncaster and Micol 1989, Denena et al.
2003, Nolfo-Clements 2009, Scheide 2013), we have orientated ourselves to the upper
end of documented values. Scheide (2013) reported that, along waterways, territory
length usually varies between around 150 m to about 1 km, although home range can
increase up to several kilometres in radius if resources are scarce.
     For further analysis, records that were missing essential information (i.e. no geo-
reference), putative duplicates (i.e. records with same year and coordinates or locality
description), as well as records exceeding an uncertainty radius of 10 km in areas where
more accurate records were available, were discarded. This resulted in a final dataset
consisting of 24,232 coypu records between 1980 and 2018 across 28 European coun-
tries containing year, uncertainty estimate and coordinates (Fig. 1).
     We transformed those presence records (inclusive uncertainty buffer) to a grid of
5 × 5 km resolution (temporal resolution: one year) to reduce the effect of pseudo-
replication (i.e. artificial inflation of the sample size due to intensively-sampled regions
or non-detected duplicates in different datasets). Grid cells that showed only marginal
overlap with buffered presences (< 2.5% of the grid cell area) were not defined as pres-
ences, to avoid area inflation. After discarding those, 25,534 grid cells (about 12.6%
of all grid cells throughout the study area) were defined as presence grid cells and were
used for further analysis (see workflow scheme, Fig. 2). Note, that there are more pres-
ence grid cells as presence records per se, as we used the buffered presences for the grid
cell transformation to consider the spatial uncertainty of records.

Spatiotemporal analysis
Dullinger et al. (2009) found that environmental niche models, based on distribu-
tion data, produce more accurate predictions when analyses are restricted to persistent
populations. To keep information about long term occurrence and, therefore, prob-
able establishment, we conducted a spatiotemporal analysis and allocated the presence
within grid cells to different persistence categories. Presence records per grid cell were
analysed by counting the number of years containing coypu records and the time-span
covered. Grid cells with multiple years of recorded coypu presence were classified with
regard to the time-span covered by the records and accordingly grouped into different
persistence levels of at least one, at least two or at least three generation lengths (here-
after GL; which is 5 years, according to Ojeda et al. (2017)). Temporal coverage of at
least one or two generation lengths can be interpreted as early signs of establishment.
For cells that repeatedly showed coypu presence, covering a time-span of at least 15
years (thus three full generation lengths of coypu), we assumed the occurrence of es-
tablished populations within the time from 1980 to 2018. If temporal discontinuities
of more than 10 years between successive records were present in a grid cell, we divided
the counts into subgroups, which were analysed separately. In this case, the highest
derived persistence category was assigned to the according grid cell.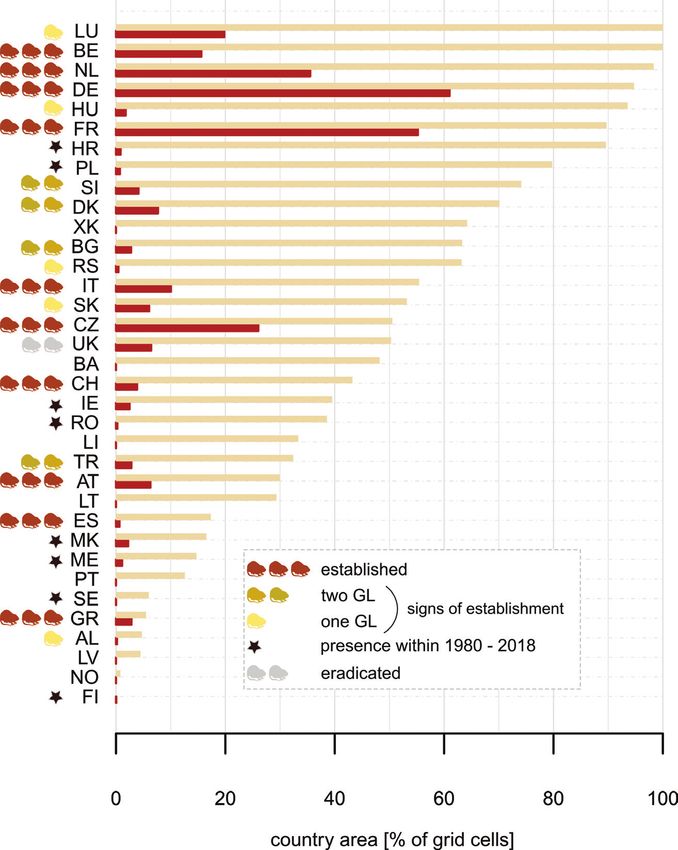
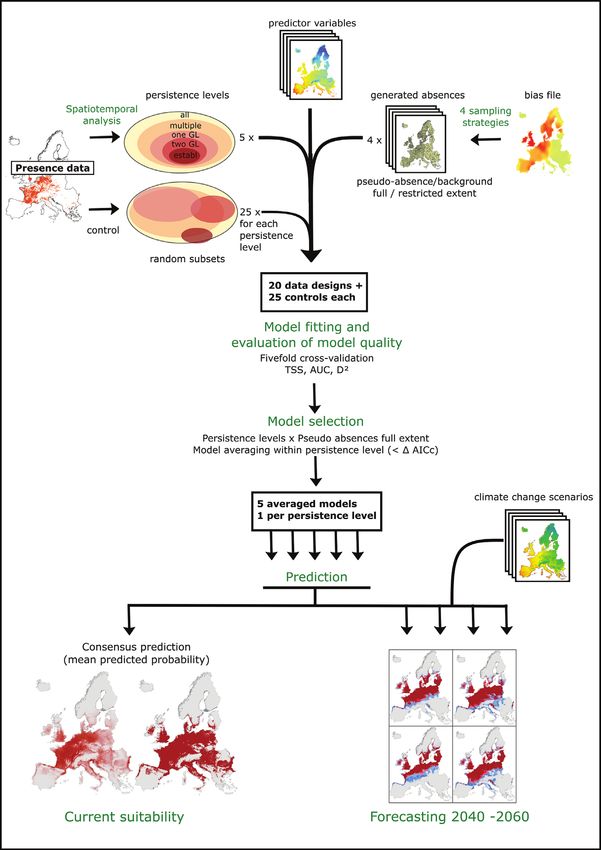
The potential current distribution of the coypu (Myocastor coypus) in Europe...        135

Figure 2. Workflow used for species distribution modelling. Presence data was transformed to a raster
grid (5 × 5 km), spatiotemporally analysed, accordingly grouped into five levels of persistence and then
combined with environmental data and generated absences (using four different sampling strategies) to
fit logistic regression models. The absence sampling strategy that derived the best evaluation measures
was used for predicting suitability under current (1979–2013) and future climatic conditions after going
through a model selection and averaging procedure.
136                          Anna Schertler et al. / NeoBiota 58: 129–160 (2020)

     On this basis, we created sub-datasets by stepwise exclusion of the lowest level of per-
sistence (those sub-datasets are hereafter called persistence levels and abbreviated as indi-
cated by the bold words: all grid cells = 25,534, multiple records per grid cell = 15,078,
multiple records per grid cell that cover at least one GL = 11,619, multiple records per
grid cell that cover at least two GL = 5,145, established populations only = 2,505).

Predictor variables
Environmental predictors included bioclimatic variables from the CHELSA database
(Karger et al. 2017a), CORINE Land Cover data for different land cover classes (i.e.
agricultural areas, wetlands and water bodies) (European Environment Agency (2012),
hilliness (i.e. the standard deviation of the average sea level) derived from a digital eleva-
tion model (European Environment Agency 2000), human population density (EU-
ROSTAT 2011) and data on rivers and lakes (European Environment Agency 2012b)
(Table 1). Human population density was log-transformed to reduce the effect of outliers
due to large cities. All variables were calculated for a grid of 5 × 5 km and standardised
for better comparison (i.e. scaled to a mean of 0 and a standard deviation of 1). As mul-
tiple bioclimatic variables were highly correlated (|Pearson’s r| > 0.7), we limited them
to five variables that represent temperature (bio06; ‘Minimum Temperature of Coldest
Month’ and bio10; ‘Mean Temperature of Warmest Quarter’), temperature fluctuations
(bio2; ‘Mean Diurnal Range’), precipitation (bio17; ‘Precipitation of Driest Quarter’)
and precipitation fluctuations (bio15; ‘Precipitation seasonality’). After this procedure,
all pairwise correlations of our final predictor set were below the threshold of |Pearson’s
r| > 0.7 and all variables showed VIF (Variance Inflation Factor) values smaller than 10,
indicating that collinearity is a minor issue within the predictor data (R package usdm,
Naimi et al. 2014) (for correlations amongst variables, see Suppl. material 1, Fig. S1).
     Additionally, we used qualitative information on biogeographic region (European
Environment Agency 2016) and country (GADM 2018) for summary statistics.

Table 1. Environmental predictor variables. All predictors were rescaled to a 5 × 5 km raster resolution
(bilinear interpolation) and standardised (scaled to a mean of 0 and a standard deviation of 1).

  Predictor                           Description                               Temporal coverage        Source
Bio2                           Mean Diurnal Range [°C]                             1979–2013        CHELSA (Karger et al.
Bio6                  Min Temperature of Coldest Month [°C*10]                                           2017)
Bio10               Mean Temperature of Warmest Quarter [°C*10]
Bio15                        Precipitation Seasonality [CV]
Bio17                Precipitation of Driest Quarter [mm/quarter]
Hilliness                       Std. Dev. of m a.s.l./cell                            2000                 EEA
Pop. density    Mean human population density [inhabitants/km²] log-                  2011          GEOSTAT v.2.0.1. /
                                       transformed                                                    Eurostat, EFGS
Distance       Euclidean distance to the next grid cell containing artificial         2012              CORINE
Settlement                                surfaces                                                  LANDCOVER, vers.
Agriculture               Agricultural surfaces [% counts/cell]                                           18.5.1
Wetlands                   Wetlands surfaces [% counts/cell]
Waterbodies              Water bodies’ surfaces [% counts/cell]
Shores                  Total shoreline (rivers and lakes) [m/ha]                  1990–2006        ECRINS v.1.1 / EEA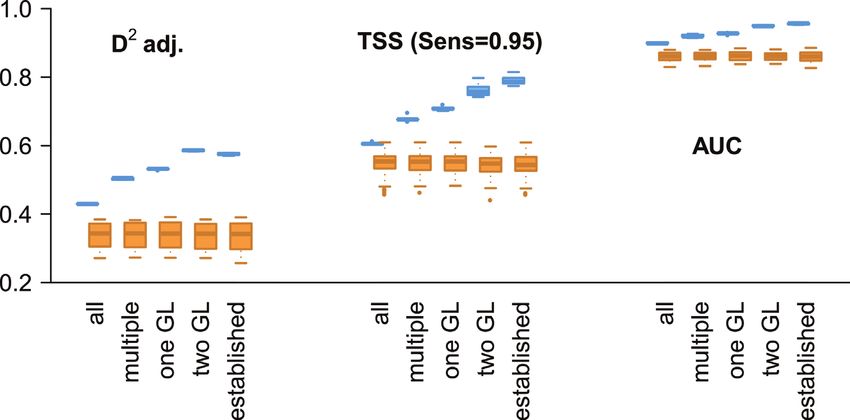
The potential current distribution of the coypu (Myocastor coypus) in Europe...   137

Future climate projections
Two IPCC (Intergovernmental Panel on Climate Change) climate change scenarios
were selected to model coypu response to a changing climate by the mid-21st century
(2041–2060). One represents medium (RCP 4.5; Representative Concentration Path-
way) and one represents severe climate change (RCP 8.5) by depicting the different
approximate radiative forcing in comparison to the pre-industrial state (i.e. + 4.5 and
+ 8.5 W/m²) (Moss et al. 2010). Further, it is known that climate predictions are
sensitive to different climate model frameworks (GCMs; General Circulation Models)
(Porfirio et al. 2014). Thus, we downloaded data for two different GCMs, representa-
tive for different model families (Sanderson et al. 2015), from the CHELSA website
(Karger et al. 2017a). The GCMs were chosen considering model independence and
performance: Had-GEM2-A0 and CESM1-BGC.

Presence-absence data designs
To model the range of potential distribution under current climate and under climate
change, we used logistic regression, a generalised linear modelling (GLM) technique
that is widely used for predicting species distributions (Elith and Leathwick 2009,
Franklin 2010). Here, a linear model is related to the binary response variable via a
logistic link function (McCullagh and Nelder 1989). We chose this technique due to
the proposed transferability in time and space and lower risk of overfitting compared
to other methods, such as classification trees (Marmion et al. 2009, Franklin 2010).
Since logistic regression requires presence and absence data, we generated absences
using different approaches to compare their model performance and predictions in
order to select the most appropriate absence design. The absences were drawn either
as background or pseudo-absences, i.e. from all grid cells or only from non-presence
grid cells (see Phillips et al. 2009); this was done for the whole study area extent or
within a buffer of 150 km around presence grids, representing an assumption of
coypu dispersal (Aliev 1968, Gosling and Baker 1989, Hong et al. 2015) . As the
data collected consists of a variety of sources, contains opportunistic records and
is not following a standardised collecting scheme across our study area, we used
a target-group approach to account for biased survey effort (Phillips et al. 2009,
Stokland et al. 2011). Here, we filtered occurrence data of non-marine, non-volant,
small- to medium-sized European mammals from GBIF (https://www.gbif.org/) for
the same spatial and temporal extent and downloaded the resulting records, assum-
ing these will exhibit a similar spatial sampling bias. The records were used to create
a probability density surface (Suppl. material 1, Fig. S2a) that served as the basis for
generating absences.
     We combined each of the four different absence sampling strategies (background
full, background restricted, pseudo-absence full, pseudo-absence restricted; see Suppl.
material 1, Fig. S2b) with all five levels of persistence, resulting in a total of 20 data de-
signs. The number of absence grids cells was set to at least 10,000 or equal the number
138 Anna Schertler et al. / NeoBiota 58: 129–160 (2020)
of presence grid cells. Barbet-Massin et al. (2012) argue that this amount of generated
absences adequately depicts the model quality without the need to account for vari-
ability in generated absences, for example, through generating replicates. At the same
time, predictive accuracy of GLMs does not significantly increase with prevalence,
once the number of presences reached at least one tenth of the number of absences
(Barbet-Massin et al. 2012). In their study, this held true for weighted and unweighted
schemes, therefore we did not apply any weightings.
As pseudo-absences which were generated across the whole study area extent
(“pseudo-absence full”) consistently derived the best evaluation values (Suppl. material
1, Fig. S2c) and spatial predictions were basically identical between different absence
sampling strategies, we chose this sampling strategy for further analysis.
Model evaluation
We assessed the goodness of fit for the full models (including linear and quadratic
terms for all variables) of all datasets and of 25 random subsets per persistence level.
Those were created by drawing random presence subsamples that equal the size of
the according persistence level to check for sampling size effects that might occur.
For the model evaluation, we compared a set of commonly-used measures (Allouche
et al. 2006, Elith and Leathwick 2009, Liu et al. 2011), based on a fivefold cross-
validation (split ratio train:test equals 80:20): 1) AUC, which is the sum of the area
under the receiver operating curve, a graph that displays false positive vs. true positive
rate (Franklin 2010); 2) adjusted D², which is the proportion of explained deviance,
Figure 3. Comparison of model performance for the persistence levels (with pseudo-absences for the
full extent) versus random subsets. The boxplots show the results of the fivefold-cross validation for the
persistence levels (blue) and the according random subsets (orange).The potential current distribution of the coypu (Myocastor coypus) in Europe... 139
taking into account the number of model parameters and observations and thus allows
comparison amongst different models (R package modEvA; Barbosa et al. 2014); and
3) the threshold-dependent true skill statistic (TSS) which needs a binary result. TSS
corresponds to the sum of sensitivity (i.e. the proportion of correctly-predicted pres-
ences) and specificity (proportion of correctly-predicted absences) minus one and was
shown to be independent of prevalence (Allouche et al. 2006). As we aimed to identify
the regions sensitive to coypu invasion and regarded false negatives as costlier than false
positives, the threshold for TSS computation was chosen following the recommenda-
tion of Jiménez-Valverde et al. (2011) to avoid omission error by maximising sensitiv-
ity whilst keeping a reasonable specificity and therefore TSS value. Therefore, we set the
sensitivity to a fixed value of 0.95 (i.e. the threshold used for binary classification will
lead to 95% of presences predicted correctly).
Variable importance was measured for each predictor by evaluating the mean drop
in explained deviance caused by removal of the respective predictor. Finally, true posi-
tives and omission errors were mapped to reveal sensitivity issues and spatial patterns
in model performance (Suppl. material 1, Fig. S3).
Model selection and consensus predictions of potential current and future
distribution
The full models’ quality notably increased with increasing level of persistence and this
effect could be clearly distinguished from sample size effects, when comparing the
evaluation measures with those of the random subsets (Fig. 3). We hence used the per-
sistence level classification for prediction. To select the best models for each persistence
class, we compared the corrected Akaike’s Information Criterion (AICc) between the
full model (all predictors) and possible sub-models. Then we averaged the top models
with ΔAICc < 4 (R package “MuMIn”, Barton 2019), finally resulting in five averaged
models (one per persistence level) that were fitted with the whole data of the according
persistence level.
We assumed grid cells that contain long-term occurrences to be more informa-
tive than those where coypu occurrence was only registered once. Both approaches
(using all data vs. subsets) in its extremes may incorporate biases (i.e. all presence
data will more likely include non-persistent occurrences and false identifications,
whereas grid cells that show long-term occurrence might underestimate the area of
a still-spreading alien species and comprise historical effects of propagule pressure
due to regional differences in fur farming intensity, as well as effects of uneven data
availability across regions). To balance those possible biases and reduce uncertainty,
we combined the resulting predictions of probability of occurrence for all persistence
levels and created a consensus prediction by simply calculating the mean probability
of occurrence per grid cell, depicting the overall agreement of the averaged models.
Marmion et al. (2009) showed a significant increase in accuracy and robustness for
consensus predictions that used averaging methods. For binary maps, we used the140 Anna Schertler et al. / NeoBiota 58: 129–160 (2020)
same cut-off as for the computation of the TSS (sensitivity fixed to 95%) to separate
suitable and unsuitable grid cells (Jiménez-Valverde et al. 2011).The proportion of
suitable grid cells was calculated for all countries and compared to the proportion of
grid cells that contained presence records.
Further, consensus forecasts for all climate change scenarios were computed. The
change in probability of occurrence was assessed by comparing the number of cells that
were classified as suitable under current climate and under climate change scenarios
and by subtracting the probabilities of occurrence of current from future predictions.
To obtain the agreement between binary models, we used the sum of predicted pres-
ences per cell across all averaged models, with a high value meaning high agreement.
Priority regions for surveillance and management
Finally, we used the resulting predictions to define priority regions for surveillance
and management by creating a risk map. Grid cells that 1) show high probability of
occurrence in the consensus prediction and 2) areas adjacent to already known recent
occurrences, are deemed to be particularly susceptible to invasion by coypus, due to
short colonisation distances. Thus, to incorporate dispersal constraints and to account
for proximity to known occurrence, a weighting matrix was computed, by summing
up weighted inverse Euclidean distance classes per decade for each cell (Suppl. mate-
rial 1, Fig. S4).We combined this matrix with the consensus map under current cli-
mate showing the mean probability of occurrence. Here, values below the probability
threshold for binary map computation were set to zero. We expected both suitability
and proximity to be of equal importance for the invasion process. If a cell were con-
sidered too distant or unsuitable, no risk of invasion was assumed. For the United
Kingdom, we considered only Northern Ireland for the risk map and excluded Great
Britain, as the coypu has been eradicated there (see Gosling & Baker 1989).
Statistical analyses were conducted and maps were produced using ArcGIS 10.5.1
(ESRI 2018), R 3.6.0 (R Core Team 2019) within the GUI RStudio 1.1.463 (RStudio
Team 2018). The following R packages were used: dismo (Hijmans et al. 2017), dplyr
(Wickham et al. 2017), modEva (Barbosa et al. 2016), MuMIn (Barton 2019), Presence-
Absence (Freeman and Moisen 2008), raster (Hijmans 2017), spdep (Bivand et al. 2013,
Bivand and Piras 2015), rgbif (Chamberlain et al. 2017), usdm (Naimi et al. 2014).
Results
Spatiotemporal analysis of coypu occurrence
In total, 24,232 coypu presence records (corresponding to 25,534 grid cells at 5 × 5
km) were collected across 28 countries. The spatiotemporal analysis of presence grid
cells shows centres of documented long-term occurrence in Czech Republic, France,The potential current distribution of the coypu (Myocastor coypus) in Europe... 141
Germany, Italy and the Netherlands. Of all presence grid cells, 45.5% (corresponding
to 20 countries) show at least early signs of establishment (i.e. had multiple records
that covered one generation length as a minimum; of those 20.1% have been covered
by at least two generation lengths and 9.8% of the grid cells (corresponding to 10
countries) show spatially-explicit evidence for long-term persistence (i.e. established
populations) with coypus being present over a period of at least 15 years (Fig. 4). Note,
that these periods of occurrence do not necessarily imply that populations are still pre-
sent in a given area, but are indicative of the general suitability of the area within the
last decades. For example, the successful eradication programme in Great Britain led to
the local extinction of the coypu (Gosling and Baker 1989), despite the suitability of
the environment that allowed persistence over several generation lengths.
Model performance and variable importance
Model quality increased with higher levels of persistence, with mean AUC values
ranging from 0.90 (all) to 0.96 (established) indicating excellent discrimination abil-
ity across all averaged models and TSS values ranging from 0.61 to 0.79 which can be
interpreted as good to excellent agreement between training and test data (Eskildsen
et al. 2013). Adjusted explained deviance was between 43.0% and 57.5% (Table 2).
Between two to four top models were averaged for the persistence levels, with the
full model always being included. Only land cover variables were excluded (‘shores’,
‘water-bodies’) and none of them was excluded across all persistence levels (for model
weightings and ΔAICc, see Suppl. material 1, Table S2). The analysis of predictor vari-
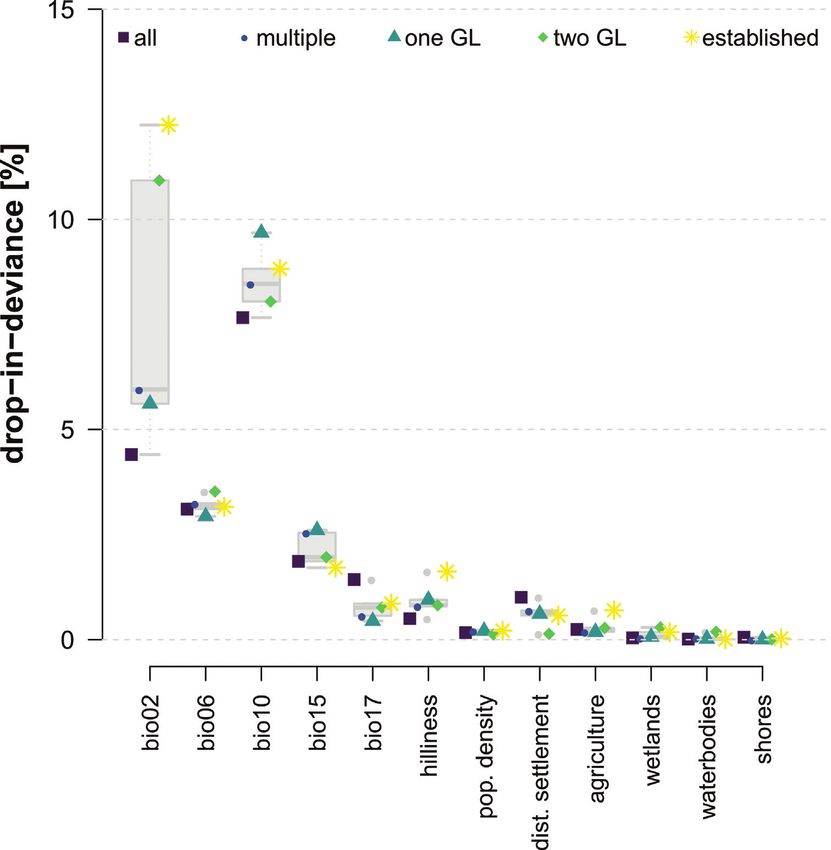
able importance showed that the mean temperature of the warmest quarter (bio10;
mean drop in D² ± SD: 8.5 ± 0.77), mean diurnal temperature range (bio2; 7.8 ±
3.51) and the minimum temperature of the coldest month (bio6; 3.2 ± 0.22) were the
most important of the analysed predictors (Fig. 5). In addition, precipitation seasonal-
ity (bio15; 2.1 ± 0.41) played a relatively important role, whereas the other variables
had markedly lower values. Still, the mean precipitation of the driest quarter (bio17),
hilliness and the distance to settlements are of superior importance in comparison
to the land cover variables. Coypu presence was more likely at medium diurnal tem-
perature ranges and when the mean temperature of the warmest quarter, as well as the
minimum temperature of the coldest month, was medium to high. The probability of
occurrence decreased with increasing precipitation seasonality, distance to settlements
and hilliness and increased with increasing human population density, number of wet-
lands and higher precipitation during drier months (bio17).
Plotting of the omission errors of the binary consensus prediction revealed that those
mostly occurred at the range margins of the currently known European distribution, es-
pecially towards Southern Europe and mountainous areas (Suppl. material 1, Fig. S3b).
A good distinction between the presence and generated pseudo-absence data could be
achieved (median of predicted probability for pseudo-absences and presences: 0.05 vs.
0.77, Figure S3a).142 Anna Schertler et al. / NeoBiota 58: 129–160 (2020) Figure 4. Persistence levels of presence grid cells as derived from the spatiotemporal analysis. Each grid cell that intersects at least one record of coypu presence between 1980 and 2018 is coloured according to the maximum derived persistence level: 1) single record, 2) multiple records, 3) one generation length (multiple records covering at least 5 years), 4) two generation lengths (multiple records covering at least 10 years), 5) established (multiple records covering at least 15 years). One generation length is assumed to be 5 years, following Ojeda et al. (2016).
The potential current distribution of the coypu (Myocastor coypus) in Europe...             143

Table 2. Evaluation statistics of the averaged models for all five levels of persistence. For computation of
the TSS, the sensitivity was set to 0.95.

                         AUC                 D² adj [%]          TSS (Sens = 0.95)          Specificity
all                      0.90                   43.0                   0.61                   0.65
multiple                 0.92                   50.3                   0.68                   0.73
one GL                   0.93                   53.1                   0.71                   0.76
two GL                   0.95                   58.6                   0.76                   0.81
established              0.96                   57.5                   0.79                   0.84

Figure 5. Importance of predictor variables for the averaged final models. The importance is measured
as the mean drop in explained deviance (D²) upon removal of the respective predictor. For descriptions of
the predictor variables, see Table 1.
144 Anna Schertler et al. / NeoBiota 58: 129–160 (2020)
Figure 6. Consensus predictions of the probability of occurrence across the study area under current cli-
matic conditions (years 1979–2013). a Mean probability of occurrence across the final averaged models of
all persistence levels. b Binary classification of suitable and unsuitable grid cells after applying a threshold
corresponding to 0.95 sensitivity (= 0.16).
Current and future predictions of potential distribution
The consensus map for current climatic conditions shows that, currently, large parts
of Europe have a high probability of coypu occurrence (Fig. 6a). Applying a threshold
that gives 95% sensitivity (correctly predicted presence grid cells) results in 42.9%
of the study area being rated as potentially suitable (Fig. 6b). Only 27.4% of those
cells already comprise documented coypu occurrences, while the remaining 72.6% be-
ing, to our current knowledge, yet unoccupied. These potentially suitable areas cover
most of Central Europe and parts of the following biogeographical regions; Atlantic
(67.8%), Black Sea (92.7%), Continental (79.3%), Mediterranean (24.0%), Pannon-
ian (93.5%) and Steppic (38.2%) regions. Only minor parts of the Alpine and Boreal
regions contain predicted suitable grid cells (8.8% and 4.2%) and the Arctic biogeo-
graphic region is considered unsuitable.
All four climate change scenarios show substantial shifts in predicted habitat suit-
ability until the mid-21st century (2041–2060) (Fig. 7). While the total amount of
suitable area is predicted to decrease between 2–8% in comparison to current climat-
ic conditions (38.1% (HadGEM1 A0 RCP 4.5), 34.7% (HadGEM1-A0 RCP 8.5),The potential current distribution of the coypu (Myocastor coypus) in Europe... 145 Figure 7. Future predictions. Agreement between averaged models for projected probability of occur- rence in the mid-21st century under two climate change scenarios (medium climate change: RCP 4.5; severe climate change: RCP 8.5) combined with two different global circulation models (HadGEM1-A0, CESM1-BGC, displayed as number of models predicting presence (left side) and net change in occur- rence probability compared to the current climatic situation (right side). 40.9% (CESM1-BGC RCP 4.5) and 39.8% (CESM1-BGC RCP 8.5), particularly northern and Atlantic regions with Ireland and the United Kingdom will experience an increase in suitability. In contrast, all models predict decreasing suitability along the southern range. Priority regions for surveillance and management The risk map (Fig. 8) is an indication of invasion risk, considering not only the poten- tial suitability, but also the current distribution of the coypu and thus the likelihood of dispersal and colonisation of new grid cells. In Figure 9, the percentage of suitable and occupied area per country, as well as the establishment status of the coypu in the respective country, is shown. None of the already affected European countries reached saturation by now and, additionally, a number of not-yet invaded countries contain a considerable amount of suitable area.
146                      Anna Schertler et al. / NeoBiota 58: 129–160 (2020)

Figure 8. Risk map, highlighting regions potentially prone to invasion, i.e. with high probability of oc-
currence under current climate and adjacent to known recent occurrences of coypu. Presence grid cells are
shown in black. Great Britain was excluded as the coypu is officially eradicated (Gosling & Baker, 1989).
The potential current distribution of the coypu (Myocastor coypus) in Europe...   147

Discussion
Current situation and changes in the near future

This study confirms and substantially expands the overview of Tsiamis et al. (2017),
who report coypu occurrence for 18 EU countries and establishment for 12 of those.
Our presence dataset covers 28 European countries, of which 10 countries showed
spatially-explicit evidence for long-term establishment of the species and another 10
countries showed at least early signs of establishment within the regarded time period
(Fig. 9; note that our study also deals with non-EU member states). Under the current
climate, a considerable number of countries has high proportions of suitable areas, for
example, Belgium, Germany, Luxembourg, Netherlands and Hungary with > 90%
and Bulgaria, Croatia, Czech Republic, Denmark, France, Kosovo, Poland, Italy, Ser-
bia, Slovenia, Slovakia and the United Kingdom with more than half of their country
area being predicted as suitable for coypu (Fig. 9). The comparison of presence grid
cells with not-yet invaded but suitable ones, shows that further substantial range ex-
pansions can be expected. Moreover, several countries that do not have documented
coypu occurrences yet, contain potentially suitable areas. Overall, 42.9% of the study
area is considered suitable under current climate (1979–2013) (Fig. 6), of which less
than a third already contained occurrences from 1980 to 2018.
     All four climate change scenarios used in this study predicted a slight to moderate
decrease of suitable area (from 42.9% under current climate to between 34.7% and
40.9%). This decline is caused by a loss of suitable habitats in the southern parts of
Europe, which is not fully compensated for by increasing suitability at higher latitudes
(Fig. 7). Thus, our results show that climate change likely will not cause an overall
increase of suitable areas for coypu in Europe. This is in line with Bellard et al. (2018)
who reviewed modelling studies of climate change effects on alien species distributions
and found that climate change will more frequently contribute to a decrease in alien
vertebrate species range size. Currently suitable areas closely match warm temperate
climates (fully humid or summer dry and with warm summers) after the Köppen-
Geiger Climate Classification (Kottek et al. 2006), but not regions with hot summers.
Scheide (2013) mentions increasing mortality rates of coypu at high temperatures,
which would be in accordance with our finding of decreasing suitability in warming
arid regions. In addition, Jarnevich et al. (2017) found support for upper thermal toler-
ance thresholds of the species. Decreasing suitability on the Iberian peninsula supports
the findings of Gallardo and Capdevila (2018) which conducted a risk analysis for
Spanish national parks using climate scenarios for 2050 and 2070; they predicted slight
to medium decrease of suitability for the coypu in the majority of cases.
     The recent occurrence of the coypu in Ireland caused the first Species Alert issued
by a European Union Member State under the EU Regulation on Invasive Alien
Species. Although those areas were only partly predicted correctly, a considerable
area of Ireland is classified as suitable by our predictions. In line with our study, Sc-
heide (2013) and Jarnevich et al. (2017) identified Ireland as having a high similarity
148 Anna Schertler et al. / NeoBiota 58: 129–160 (2020) Figure 9. The country-wise percentage of suitable grid cells under current climate (brown bars) and grid cells containing presences (red bars). Countries are marked according to the maximum persistence level. Countries with no suitable areas and occurrences are not shown, as well as microstates not covering a whole grid cell. Alphabetically ordered country abbreviations with corresponding percentages of suit- able grid cells and occupied cells in parentheses: AL : Albania (4.7/0.2), AT : Austria (30.0/6.3), BA : Bosnia and Herzegovina (48.2/-), BE : Belgium (99.9/15.6), BG : Bulgaria (63.3/2.8), CH : Switzerland (43.2/3.9), CZ : Czech Republic (50.5/26.0), DE : Germany (95.7/61.0), DK : Denmark (70.1/7.7), ES : Spain (17.3/0.6), FI : Finland (-/0.1), FR : France (89.7/55.2), GR : Greece (5.5/2.8), HR : Croatia (89.6/0.8), HU : Hungary (93.6/1.8), IE : Ireland (39.5/2.5), IT : Italy (55.4/10.0), LI : Liechtenstein (33.3/-), LT : Lithuania (29.3/-), LU : Luxembourg (100/19.8), LV : Latvia (4.5/-), ME : Montenegro (14.7/1.1), MK : Macedonia (16.5/2.2), NL : Netherlands (98.3/35.5), NO : Norway (0.8/-), PL : Po- land (79.8/0.7), PT : Portugal (12.6/-), RO : Romania (38.6/0.2), RS : Serbia (63.2/0.5), SE : Sweden (6.0/
The potential current distribution of the coypu (Myocastor coypus) in Europe...   149

to the coypu’s realised niche when predicting its potential distribution on a global
scale. Therefore, the recent occurrence reports should be taken with great caution,
especially as the overall suitability of Ireland under climate change scenarios is ex-
pected to increase (Fig. 7). This said, the predictions of Jarnevich et al. (2017), when
modelling the potential distribution of the coypu in the US and worldwide, did also
classify large parts of Central and Eastern Europe as unsuitable, which is in contrast
with our findings and with the presence of established populations in many areas of
those regions.
    While our predictions classify most of the Atlantic, Continental, Black Sea and
Pannonian biogeographic regions as suitable, this is not the case for the Alpine biogeo-
graphic region. Therefore, this study is in agreement with others that have classified the
coypu as a typical lowland species and implies that mountain regions act as effective
dispersal barriers on a regional scale (Woods et al. 1992, DVWK 1997, Bertolino and
Ingegno 2009, Scheide 2013).

Environmental predictors shaping coypu occurrence
Our results highlight the importance of temperature-related climatic variables, such as
the mean temperature of the warmest quarter, the mean diurnal temperature range and
the minimum temperature of the coldest month as being essential in shaping habitat
suitability for coypus (Fig. 5). Under climate change, increasing populations due to
decreasing winter mortality seem to be possible and could have economic and environ-
mental consequences in affected areas (Gosling and Baker 1989, Carter and Leonard
2002, Scheide 2013).
     Currently, urban coypu populations, fed by humans and profiting from mild ur-
ban climate and, in some cases, the thermal pollution of rivers, clearly demonstrate the
consequences of high reproduction rates coupled with lowered mortality and enhanced
resource availability for population densities (Carter and Leonard 2002, Verbeylen
2002, Walther et al. 2011, Scheide 2013). Whereas Meyer (2005) found local adapta-
tions of the coypu to urban areas, other studies revealed negative effects of settlements
on coypu occurrence (Bertolino and Ingegno 2009). In our study, increasing distance
to settlements had a negative effect on occurrence probability, whereas the human pop-
ulation density was slightly positively correlated throughout all models. These results
indicate that human presence seems to favour coypu occurrence, as it can well adapt
to urban waters and can take advantage of additional resources provided for feeding.
However, recording bias may contribute to this result as there may be preferential re-
cording in more densely populated regions. Nevertheless, because the attitude toward
coypu varies between regions or countries (Carter and Leonard 2002), the association
between humans and coypu occurrence may vary spatially and may also change over
time. While in some regions the species is hunted (Carter and Leonard 2002, Bertolino
and Ingegno 2009) and therefore presence might be more likely in remote areas, in
others, regularly fed urban populations occur (e.g. in Germany (Scheide 2013), the
150 Anna Schertler et al. / NeoBiota 58: 129–160 (2020)
Czech Republic (M Anděra personal communication) or in Austria (A Schertler per-
sonal observation)). In contrast to former findings, nowadays the coypu is also com-
mon in Italian cities, where it is fed by people, highlighting the temporal dynamic of
its relationship with humans (S Bertolino personal communication).
Although on a continental scale, climatic aspects are clearly of higher importance
(Franklin 2010), some of the predictors associated with land cover consistently showed
a significant influence on occurrence probability which, for example, increased with
increasing amount of wetlands within a grid cell. The relevance of land cover vari-
ables for coypu occurrence was reported by previous studies (Scheide 2013, Farashi
and Najafabadi 2015) and should definitely be taken into account in future studies
that are conducted on a finer scale. Bertolino and Ingegno (2009) showed that coypu
prefers rice paddies as habitats in Northern Italy. Specific agricultural areas do not only
enhance food availability, but also potentially provide habitat, for example, trough
irrigation ditches. The flexibility to colonise a variety of habitats must be considered
when predicting the potential future distribution of the coypu. Although arid environ-
ments in Southern Europe are predicted to be unsuitable in the near future (Fig. 7),
wetlands and small patches of suitable habitat due to microclimatic factors (e.g. along
riparian areas), as well as agroecosystems can still provide suitable habitat for coypus
and simultaneously promote conflicts due to feeding damage.
Predictive ability of the species distribution model
The assumption of an equilibrium between a population and its environment is
typically violated during biological invasions, due to ongoing dispersal. Václavík and
Meentemeyer (2012) found that SDMs calibrated in early invasion stages tend to be
less accurate and under-predict potential ranges of species. The coypu was introduced
to Europe more than a century ago and a multitude of release or escape events across
regions happened, as it was widely used for fur farming (Carter and Leonard 2002). As
the coypu is a conspicuous species that is regularly recorded by a wide range of people
(e.g. naturalists, waterway authorities, anglers, farmers and hunters) and given the ex-
haustive search of records performed, we are convinced that the collated distribution
dataset closely reflects the known distribution of the coypu in Europe. Therefore, we
assume that our dataset captures a wide range of suitable environmental conditions,
with the consensus predictions providing valuable tools to predict the next phase of
invasion and areas at high risk (Fig. 8).
The SDMs performed well (Table 2), although some tendency in misclassifications
was detected (Suppl. material 1, Fig. S3b). This might be due to missing essential pre-
dictors, model mis-specification or influential spatially clustered factors, such as biotic
interactions, propagule pressure and dispersal (Elith and Leathwick 2009). Propagule
pressure and the number of release events within the last century are difficult to re-
construct given the lack of necessary data, but were presumably differing across Eu-The potential current distribution of the coypu (Myocastor coypus) in Europe... 151
rope, due to the varying economic importance of the fur industry amongst countries
(Carter and Leonard 2002). We aimed to account for uneven sampling effort across
regions and unsuccessful escape events by using a target-group approach for absence
generating and by spatiotemporally analysing presence grid cells. Nevertheless, several
escape events at a given site might lead to overestimation of persistence, whereas other
regions due to scarcity of spatially explicit records might be under-represented and
their suitability hence underestimated (e.g. Southern Europe). Due to these data limi-
tations and because the coypu most likely has not yet colonised all climatically suitable
regions in Europe, here, the calculated environmental niche might be conservative.
Misclassification increased with increasing hilliness in a region, likely due the chosen
spatial resolution, which is too coarse to properly characterise the full variation of en-
vironmental conditions in heterogeneous areas (e.g. valleys, which can locally provide
suitable habitat in mountainous regions). In addition, a temporal change in sampling
effort could lead to earlier decades being under-represented, hence, the impression of
the species’ spread could be intensified by more data becoming available recently, for
example, through citizen science projects.
Implications for management
The majority of grid cells deemed suitable for coypu under current climate or climate
change are not yet colonised. Our results illustrate the urgent need to not only improve
management measures in areas with persisting populations, but also find strategies to
prevent or reduce further spread as the costs of early intervention are much smaller
than control of established populations (Panzacchi et al. 2007). Although the eradica-
tion of the coypu in Great Britain was successful, this was achieved as a result of coor-
dinated intensive trapping efforts which were executed by employed professionals over
one full decade (Gosling and Baker 1989). Moreover, Great Britain has the advantage
of being an island and re-invasion is therefore unlikely. Considering the current situ-
ation on the European mainland, with widespread occurrence in Central Europe, it
seems highly unrealistic to attempt total eradication of the species in Europe.
Baroch and Hafner (2002) argue that, in the case of low population densities, im-
pacts of coypus in general are rather minor. Given that the coypu is already fairly wide-
ly distributed, management that minimises population density and therefore negative
economic and environmental impacts should be the aim. As there are several hotspots
of coypu occurrence covering more than one country, there is a need for international
collaboration to coordinate control measures on a metapopulation scale and prevent
compensatory re-invasion from adjoining populations (Oliver et al. 2016). There are
well-known cases of migration events of coypus from neighbouring countries, for ex-
ample, from France to Germany (DVWK 1997, Scheide 2013) and from Belgium and
Germany to the Netherlands (Carter and Leonard 2002). Already existing binational
control programmes could serve as best-practice examples. Gosling and Baker (1989)152 Anna Schertler et al. / NeoBiota 58: 129–160 (2020)
suggest concentrating efforts on high-density hotspots to maximise mortality and min-
imise dispersal to new habitats. Further research regarding coypu dispersal movement
and interaction on metapopulation level, also taking into account population genetics,
would give new insights to its spreading history across Europe and allow the identifica-
tion of relevant centres of dispersal.
Accounting for coypu in hunting laws would allow integrating it as a wildlife re-
source and harvesting coypu for its meat and fur. Meat of wild coypus was shown to
be low in fat and cholesterol, while rich in proteins (Tulley et al. 2000) and the use
of the coypu as a food source was common in Eastern Europe during the last century
(Carter and Leonard 2002). Increasing the market value of the species would introduce
an incentive for trappers and hunters and was shown to result in population decreases
(Carter and Leonard 2002, Scheide 2013); however, it may also result in the wish to
manage populations for permanent resource extraction.
Aside from direct control measures, another aspect of coypu management is the fa-
cilitation of winter survival and rise of reproduction rates by providing additional food
sources. Wildlife feeding in or nearby settlements can induce rapid increases of coypu
populations. Urban feeding sites and easily accessible agricultural areas may suffer from
high coypu abundances (Walther et al. 2011, Scheide 2013). Managing urban popu-
lations is aggravated by the fact that the general public is often against lethal control
methods of charismatic species, such as furry mammals (Walther et al. 2011, Jarić et
al. 2020). Feeding bans, in combination with educational measures, such as awareness
campaigns in such areas, are thus essential and have multiple positive benefits.
Conclusions
It is well-established knowledge that the coypu causes substantial economic and en-
vironmental damage when occurring at high densities. Although cool-temperate cli-
mates were believed to keep coypus at low densities, in many parts of Europe numbers
have increased strongly during the last decades (Gosling and Baker 1989, Carter and
Leonard 2002, Scheide 2013). Therefore, in Europe, the species was already subject to
several national control campaigns (Carter and Leonard 2002), peaking in its inclusion
as species of European Union concern (EU Commission 2014).
Our study shows that the coypu has, by far, not yet reached all potentially suitable
regions in Europe and further highlights the importance of clarifying its response to
increasing temperatures and arid conditions as they are likely to increasingly occur in
the near future under climate change. However, one must consider the shortcomings
of predictions that are made on the basis of opportunistic records from various sources
and of differing data quality. Sampling effort differs spatiotemporally across the study
area and, although we considered the violated assumption of an equilibrium for taxa
undergoing an invasion process (Elith and Leathwick 2009, Václavík and Meente-
meyer 2009, 2012) by depicting the uncertainty in predictions through a consensus
approach, the outcome should be interpreted with caution (Pearce and Boyce 2006).You can also read