Accumulation of Human-Adapting Mutations during Circulation of A(H1N1)pdm09 Influenza Virus in Humans in the United Kingdom
←
→
Page content transcription
If your browser does not render page correctly, please read the page content below
Accumulation of Human-Adapting
                                       Mutations during Circulation of
                                       A(H1N1)pdm09 Influenza Virus in Humans
                                       in the United Kingdom
                                       Ruth A. Elderfield, Simon J. Watson, Alexandra Godlee,
                                       Walt E. Adamson, Catherine I. Thompson, Jake Dunning,

                                                                                                           Downloaded from http://jvi.asm.org/ on October 23, 2014 by Imperial College London Library
                                       Mirian Fernandez-Alonso, Deena Blumenkrantz, Tracy
                                       Hussell, The MOSAIC Investigators, Maria Zambon, Peter
                                       Openshaw, Paul Kellam and Wendy S. Barclay
                                       J. Virol. 2014, 88(22):13269. DOI: 10.1128/JVI.01636-14.
                                       Published Ahead of Print 10 September 2014.

                                        Updated information and services can be found at:
                                        http://jvi.asm.org/content/88/22/13269

                                        These include:
               REFERENCES               This article cites 68 articles, 31 of which can be accessed free
                                        at: http://jvi.asm.org/content/88/22/13269#ref-list-1

          CONTENT ALERTS                Receive: RSS Feeds, eTOCs, free email alerts (when new
                                        articles cite this article), more»

Information about commercial reprint orders: http://journals.asm.org/site/misc/reprints.xhtml
To subscribe to to another ASM Journal go to: http://journals.asm.org/site/subscriptions/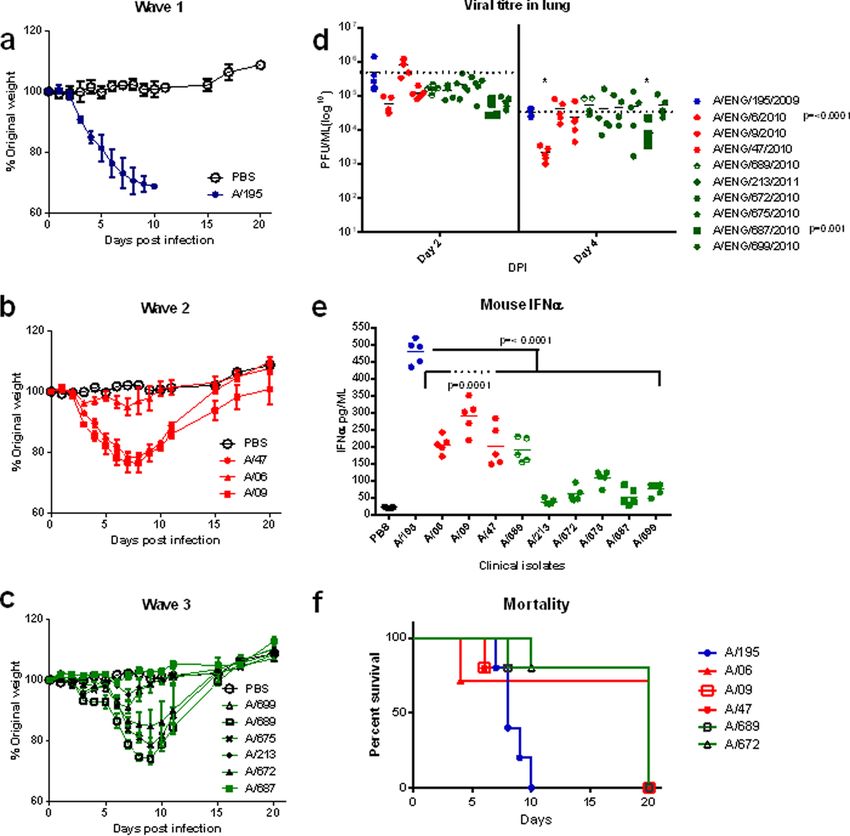
Accumulation of Human-Adapting Mutations during Circulation of
A(H1N1)pdm09 Influenza Virus in Humans in the United Kingdom
Ruth A. Elderfield,a Simon J. Watson,e Alexandra Godlee,b Walt E. Adamson,f Catherine I. Thompson,d Jake Dunning,c
Mirian Fernandez-Alonso,a Deena Blumenkrantz,a Tracy Hussell,b The MOSAIC Investigators, Maria Zambon,d Peter Openshaw,c
Paul Kellam,e Wendy S. Barclaya

                                                                                                                                                                               Downloaded from http://jvi.asm.org/ on October 23, 2014 by Imperial College London Library
Sections of Virology,a Leucocyte Biology,b and Respiratory Medicine,c Faculty of Medicine, Imperial College London, London, United Kingdom; Virus Reference
Department, Public Health England, London, United Kingdomd; Wellcome Trust Sanger Institute, Hinxton, United Kingdome; West of Scotland Specialist Virology Centre,
Gartnavel General Hospital, Glasgow, United Kingdomf

ABSTRACT
The influenza pandemic that emerged in 2009 provided an unprecedented opportunity to study adaptation of a virus recently
acquired from an animal source during human transmission. In the United Kingdom, the novel virus spread in three temporally
distinct waves between 2009 and 2011. Phylogenetic analysis of complete viral genomes showed that mutations accumulated
over time. Second- and third-wave viruses replicated more rapidly in human airway epithelial (HAE) cells than did the first-wave
virus. In infected mice, weight loss varied between viral isolates from the same wave but showed no distinct pattern with wave
and did not correlate with viral load in the mouse lungs or severity of disease in the human donor. However, second- and third-
wave viruses induced less alpha interferon in the infected mouse lungs. NS1 protein, an interferon antagonist, had accumulated
several mutations in second- and third-wave viruses. Recombinant viruses with the third-wave NS gene induced less interferon
in human cells, but this alone did not account for increased virus fitness in HAE cells. Mutations in HA and NA genes in third-
wave viruses caused increased binding to ␣-2,6-sialic acid and enhanced infectivity in human mucus. A recombinant virus with
these two segments replicated more efficiently in HAE cells. A mutation in PA (N321K) enhanced polymerase activity of third-
wave viruses and also provided a replicative advantage in HAE cells. Therefore, multiple mutations allowed incremental changes
in viral fitness, which together may have contributed to the apparent increase in severity of A(H1N1)pdm09 influenza virus dur-
ing successive waves.

IMPORTANCE
Although most people infected with the 2009 pandemic influenza virus had mild or unapparent symptoms, some suffered severe
and devastating disease. The reasons for this variability were unknown, but the numbers of severe cases increased during succes-
sive waves of human infection in the United Kingdom. To determine the causes of this variation, we studied genetic changes in
virus isolates from individual hospitalized patients. There were no consistent differences between these viruses and those circu-
lating in the community, but we found multiple evolutionary changes that in combination over time increased the virus’s ability
to infect human cells. These adaptations may explain the remarkable ability of A(H1N1)pdm09 virus to continue to circulate
despite widespread immunity and the apparent increase in severity of influenza over successive waves of infection.

I n 2009, a novel H1N1 influenza virus [A(H1N1)pdm09] crossed
  the species barrier from swine into humans, causing the first
influenza pandemic of the 21st century. The swine-origin virus
                                                                                    mans (6). Finally, RNA segment 8, encoding NS1 and NEP pro-
                                                                                    teins, had accumulated many mutations that differentiated it from
                                                                                    the NS segment of human-adapted influenza viruses. Notably, the
displayed a complex genotype, including antigen gene segments                       swine virus NS1 protein had become truncated through a termi-
derived from swine-adapted influenza viruses that had previously                    nation codon at amino acid 220 in comparison to the human-
circulated on different continents and an internal gene cassette                    adapted NS1 protein, which retained a typical NS1 length of 230
known as the triple-reassortant genotype (TRIG), first described                    residues (5). A functional difference in the swine-origin NS1 was
in pigs in the late 1990s (1–3). The TRIG cassette contained two                    reported by Hale et al. (7) and confirmed by us (8), whereby the
polymerase components, PB2 and PA, from an avian virus and the                      ability to bind to the human host cell factor CPSF 30 and limit host
other, PB1, from a human-adapted virus. The NP, HA, and NS                          gene expression had been lost by the accumulation of at least 3
gene segments of the pandemic H1N1 2009 virus were acquired
from the classical swine virus lineage that has circulated in pigs
since 1918 and had been maintained in North American swine                             Received 9 June 2014 Accepted 26 August 2014
viruses (4, 5). Classical swine influenza viruses shared an origin                     Published ahead of print 10 September 2014
with the human H1N1 seasonal influenza viruses, but the two had                        Editor: D. S. Lyles
since undergone species-specific mutations in their respective                         Address correspondence to Wendy S. Barclay, w.barclay@imperial.ac.uk.
hosts. The genetic distance between the HA genes was sufficient to                     Copyright © 2014 Elderfield et al. This is an open-access article distributed under
cause a pandemic, despite the circulation of seasonal H1 viruses in                    the terms of the Creative Commons Attribution 3.0 Unported license.
humans from 1977 until 2009. The A(H1N1)pdm09 NP gene had                              doi:10.1128/JVI.01636-14
adaptations associated with evasion of MxA from swine or hu-

November 2014 Volume 88 Number 22                                          Journal of Virology   p. 13269 –13283                                         jvi.asm.org   13269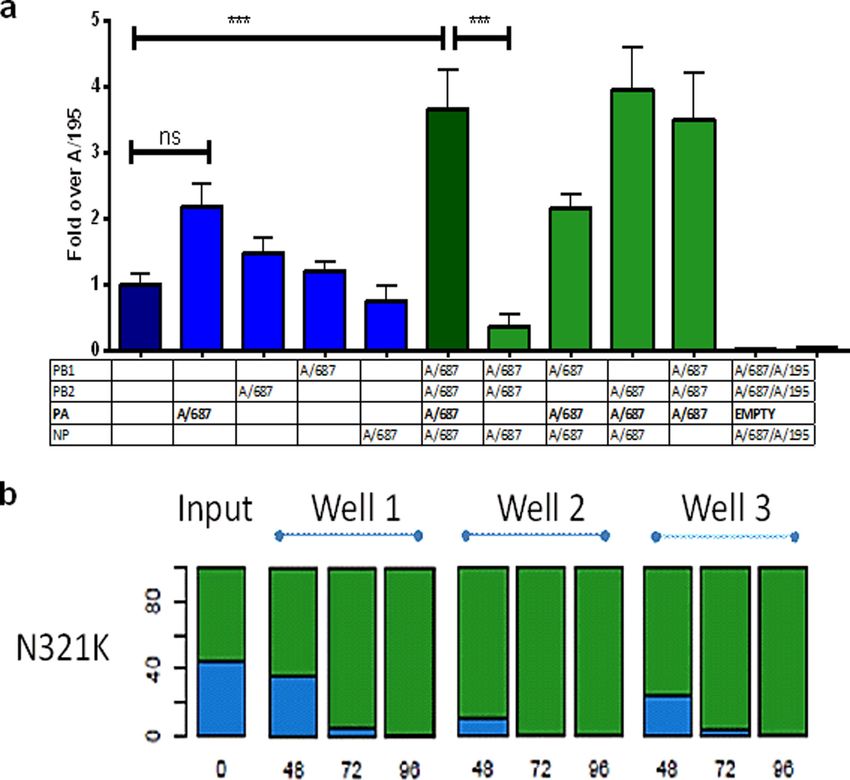
Elderfield et al.
mutations in the C-terminal domain of the NS1 gene. Thus, the (NPA) and viral throat swab samples were obtained according to the study
virus that crossed from pigs to humans and sparked the 2009 standard operating procedures. Patients with comorbidities were not ex-
pandemic was not optimized for human replication and transmis- cluded. Different severities of illness were included, and severity was
sion because its gene segments were swine adapted. graded as follows: grade 1, no respiratory compromise (oxygen saturation
In the United Kingdom, there were two waves of A(H1N1) of ⬎93% on room air); grade 2, respiratory compromise requiring non-
invasive oxygen supplementation; grade 3, respiratory compromise re-
pdm09 activity during the 2009-2010 pandemic period: an ini-
quiring invasive mechanical ventilation and oxygen supplementation.
tial out-of-season outbreak that started in April 2009 and
The MOSAIC study was approved by the NHS National Research Ethics
peaked in July 2009, followed by a second wave in the autumn Service, Outer West London REC (09/H0709/52 and 09/MRE00/67).
and winter of 2009-2010. In the first postpandemic winter Viruses. Influenza viruses were isolated from clinical specimens by the
(2010-2011), a third wave of A(H1N1)pdm09 activity was seen.
Downloaded from http://jvi.asm.org/ on October 23, 2014 by Imperial College London Library
Respiratory Virus Unit, Public Health England (PHE), Colindale, Lon-
This third wave was associated with an increase in infection and don. Briefly, clinical specimens, including NPA, viral throat swab in virus
severity and a shift in age demographics from children (0 to 15 transport medium (VTM), bronchial alveolar lavage (BAL) fluid, or en-
years old) and younger adults (16 to 44 years old) to predom- dotracheal aspirate (ETA), were transported to PHE frozen on dry ice. For
inantly adults (9–12). Compared with the first two pandemic virus isolation, 200-l clinical specimen aliquots were inoculated onto
waves, the third wave was associated with more hospital admis- monolayers of MDCK cells or the SIAT-1 cell derivative in virus isolation
sions (8,797 versus 7,879 people), more people admitted to tubes and allowed to adsorb for 1 h (17). Cells were incubated in serum-
critical care (2,200 versus 1,700 people), and a greater number free Earles minimal essential medium in the presence of 1.25 g/ml tosyl-
sulfonyl phenylalanyl chloromethyl keton (TPCK)-treated trypsin (Wor-
of deaths (474 versus 361 people) in England (13). Although
thington) on a rolling drum at 33°C for a maximum of 7 days with regular
there had been evidence of sequence variation in viruses in the
observation for viral cytopathic effect (CPE). Blind passage on fresh cells
second pandemic wave in the United Kingdom and elsewhere for a further 7 days was performed where necessary. Virus growth was
(14, 15), surveillance and antigenicity studies had reported no determined by hemagglutination assay using turkey or guinea pig red
change in the antigenicity of the surface glycoproteins hemag- blood cells. One further virus passage was made to generate a large stock of
glutinin (HA) and neuraminidase (NA), so a vaccine update virus for distribution to the MOSAIC group.
was not warranted (14). Moreover, any change in antigenicity Plasmid-based reverse genetics. The reverse genetics viruses were
would be unlikely to explain the increased severity of third- generated as previously described (8) from plasmids either synthesized
wave viruses in the unvaccinated or those who had not previ- (GeneArt) from the A/England/195/2009 whole-genome sequence and
ously contracted the virus. Nonetheless, it is possible that other A/England/687/2010 segment 4 sequence or generated by site-directed
genetic changes distinct from those with an antigenic effect mutagenesis (Stratagene Lightening mutagenesis kit) of A/England/195/
may have led to increased circulation of the virus or enhanced 2009 plasmid sequence with the point mutations necessary to create the
A/England/687/2010 amino acid sequence. The plasmids were sequenced
virulence that accounted for the apparent increased severity in
to confirm the presence of the required mutations and absence of un-
the United Kingdom’s third wave. Indeed, Dorigatti and Fer-
wanted variations. Primer sequences are available upon request. Reverse
guson recently modeled the United Kingdom third wave and genetics viruses were generated using the 12-plasmid system with either
concluded that the observed increased numbers of cases were A/England/195/2009 or A/England/687/2010 polymerase I clones and
most likely accounted for by an increase in virus transmission helper polymerase of A/Victoria/3/75.
with a commensurate increase in the numbers of severely ill. Virus replication in cell lines and primary airway cultures. Conflu-
They suggested this could be due to weather conditions, as that ent cell monolayers were infected with equal PFU of each virus at a mul-
winter was particularly cold and dry and favored virus trans- tiplicity of infection (MOI) of 0.01 or 0.001 as indicated below. The cells
mission events, or to a change in the inherent transmissibility were incubated in the inoculum for 1 h, and then the inoculum was re-
of the virus itself, or both (16). Here we report genetic variabil- moved, cells were washed with phosphate-buffered saline (PBS), overlaid
ity across the three waves of influenza virus A(H1N1)pdm09 in with DMEM supplemented with nonessential amino acids, penicillin-
the United Kingdom and identify nonsynonymous variants streptomycin, and TPCK-treated trypsin, and incubated at 34°C in 5%
CO2. Growth was assessed by well sampling at fixed time points and titra-
that define the third-wave viruses. We show that mutations in
tion on MDCK cells by plaque assay. For infection of MucilAir cultures,
HA and NA, the PA component of the polymerase complex, the apical surface (air interface) was washed with serum-free (SF) medium
and the NS1 interferon (IFN) antagonist protein enhanced the prior to infection, then washed again after the inoculation. Viral titer was
virus’ ability to replicate in human airway cells. assessed by sampling from the apical surface by the addition of 200 l of
serum-free medium, incubation for 15 min, and removal of the medium.
MATERIALS AND METHODS The basal layer was sampled for cytokine analysis, with an equal volume of
Cells. Madin-Darby canine kidney (MDCK), human embryonic kidney MucilAir medium replacing that removed.
(293T), and newborn pig tracheal (NPTr) cells were grown in Dulbecco’s Virus competition assays. Cells in MucilAir were washed with serum-
modified Eagle medium (DMEM) supplemented with 10% fetal calf se- free DMEM prior to inoculation with a 50:50 mix of two viruses at a total
rum (FCS). MucilAir cultures of human nasal epithelium (HAE; Epithe- MOI of 0.001. The cells were incubated for 1 h prior to removal of the
lix) were grown in MucilAir medium. All cells were maintained at 37°C in inoculum and washing with SF medium. The apical layer was sampled
5% CO2. every 12 h as described above. Viral RNA was extracted from the super-
Patient recruitment and sampling. The MOSAIC study investigators natant with a Qiagen Qiamp vRNA kit and processed for Ilumina deep
recruited adult and pediatric patients admitted to the hospital with sus- sequencing. Each assay was run in triplicate.
pected influenza virus infection in London and Liverpool between De- Minigenome polymerase assays. The coding sequences for the PB1,
cember 2009 and February 2011. Infection with seasonal influenza A PB2, PA, and NP proteins were amplified using KOD polymerase (Nova-
H3N2, influenza B, or A(H1N1)pdm09 viruses was confirmed locally by gen) and primers containing restriction sites to allow incorporation into
viral PCR according to regional protocols. Patients were approached for pCAGGs expression vectors. To introduce alternative amino acids into
recruitment and initial (T1) sampling as soon as possible following ad- the coding sequence, site-directed mutagenesis was undertaken on the
mission to a MOSAIC-associated hospital. Nasopharyngeal aspirate reverse genetic genomic plasmids. Primers are available on request.
13270 jvi.asm.org Journal of Virology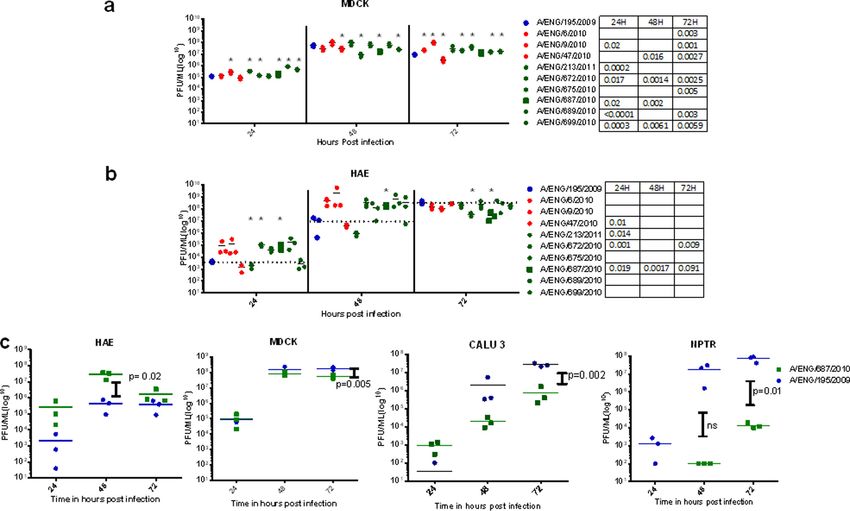
Human Adaptation of A(H1N1)pdm09 during Pandemic Waves
pCAGGs expression plasmids for PB1, PB2, PA, and NP proteins were RESULTS
transfected onto a confluent layer of 293T cells by using Lipofectamine The Mechanisms of Severe Acute Influenza Consortium (MOSAIC)
2000 and Optimem in a plasmid concentration ratio of 1:1:0.5:2, respec- was formed to investigate why some individuals infected by the
tively. Additionally, a plasmid encoding a minigenome firefly luciferase pandemic H1N1 influenza virus developed severe symptoms re-
reporter flanked by the promoter region of the influenza virus segment 8
quiring hospitalization while others developed a milder coryzal
and either a Renilla or -galactosidase transfection control plasmid were
illness. MOSAIC recruited 85 patients admitted to the hospital
cotransfected with the minigenome complement. Cells were incubated
with the transfection mix for 24 h at 34°C at 5% CO2. Then, supernatant
with influenza-like illness in the winter of 2009-2010 and a further
was removed, the cells were washed, and 100 l of passive lysis buffer was 172 patients in the winter of 2010-2011. NPA and viral throat swab
added (Promega). The cells were freeze-thawed, and lysates were analyzed specimens were collected from patients for attempted isolation of
Downloaded from http://jvi.asm.org/ on October 23, 2014 by Imperial College London Library
with the dual luciferase reporter system (Promega) on the FLUOstar virus strains by culture in MDCK cells, assessment of viral titer by
Omega system (BMG Labtec). All assays were run in triplicate, with each quantitative reverse transcription-PCR (qRT-PCR), and whole-
assay being repeated a minimum of 3 times. genome sequencing directly from the clinical sample.
Interferon reporter assays. A plasmid with the beta interferon pro- Evolution of influenza A(H1N1)pdm09 viruses showed a dis-
moter region upstream of a firefly luciferase reporter was transfected tinct United Kingdom third-wave lineage. Clinical samples, ei-
along with a -galactosidase or Renilla control plasmid into 293T cells in ther NPA or throat swabs that were positive for influenza
suspension by using Lipofectamine 2000 and Optimem. 293T cells were A(H1N1)pdm09 RNA, were prepared without virus isolation or
allowed to adhere to plates pretreated with poly-L-lysine and incubated passage and sequenced by using either the Roche Genome Se-
overnight. The cells were then infected with virus at an MOI of 3 and quence FLX 454 or Illumina Genome Analyzer IIx platforms as
incubated at 37°C for 1 h prior to inoculum removal, washing, and over- previously described (20) and assembled into full genomes as de-
laying with DMEM with 10% FCS. The cells were then harvested at set
scribed elsewhere (21). Background whole-genome pandemic se-
time points by the removal of medium, washing with PBS, the addition
quences were downloaded from NCBI’s Influenza Virus Resource
of passive lysis buffer, and passage through a freeze-thaw cycle prior to
detection with the dual luciferase reporter system (Promega) on the
database (18) and aligned against the United Kingdom first-, sec-
FLUOstar Omega apparatus (BMG Labtec). All assays were run in tripli- ond-, and third-wave genomes. Phylogenetic analysis showed that
cate, with each assay being repeated a minimum of 3 times. viruses from the first two pandemic waves were closely related,
Mouse experiments. All animal procedures and care conformed consistent with the proposed persistence of the first-wave lineages
strictly to the United Kingdom Home Office Guidelines under the Ani- into the second wave in the United Kingdom (20). However, vi-
mals (Scientific Procedures) Act 1986, and the protocols were approved ruses detected during the third wave (winter of 2010-2011) were
by the Home Office of Great Britain (license number 70/6646). genetically distinct, with the majority of genomes clustering in a
Fifteen weight-matched female BALB/c mice anesthetized with isoflu- separate monophyletic clade (Fig. 1). Across the second and third
rane were inoculated with 7.5 ⫻ 105 or 2 ⫻ 105 PFU of each influenza waves in the United Kingdom, viruses from hospitalized patients
virus. Mice were weighed daily, and any mice falling below a 30% weight were phylogenetically indistinguishable from community and
loss threshold were sacrificed. At day 2 and day 4 postinfection, 5 mice nonhospitalized control patients and did not contain shared ge-
from each experimental group were sacrificed and the lungs harvested. nome variants that could confer enhanced pathogenicity (Fig. 1).
Whole lungs were weighed and homogenized in the presence of 1 ml of We assessed amino acid changes fixed in the majority of viruses
PBS and split into aliquots. An aliquot of lung homogenate from each
and identified 21 common changes across all segments, of which
mouse was subjected to titration by plaque assay. Results are expressed in
12 were unique to third-wave viruses (Table 1). These changes also
milliliters of the homogenate, as whole mouse lungs were homogenized in
a standardized volume of PBS.
accumulated in second- and third-wave virus isolates from other
Interferon detection. Aliquots of mouse lung homogenate were tested regions of the United Kingdom and from the rest of the world
for the presence of mouse interferon by using the Verikine alpha inter- (Table 2), except for G189D in NS1. We also checked for nucleo-
feron kit (R&D Systems) according to the manufacturer’s instructions tide differences in segment 2 that would affect the translation of
and then measured on the FLUOstar Omega system (BMG Labtec). Each PB1-F2 and/or N40 open reading frames, but we found none.
sample was run in duplicate. Clinical isolates from the first, second, and third pandemic
Phylogenetic analysis. Complete genomes of samples sequenced by waves varied in their growth kinetics in primary human airway
the MOSAIC group were aligned against all complete A/H1N1/09 ge- cultures. The lack of a common genetic difference between influ-
nomes up to 2011 that were present in the NCBI Influenza Virus Resource enza viruses isolated from severe or mild influenza cases in each
database (18). To improve tree readability, this set of 2,084 genomes was wave suggests that the observed increase in overall severity in the
down-sampled by using custom Python scripts, ensuring that the topol- third wave may be related to a general property of third-wave
ogy of the phylogenetic tree was maintained. Phylogenetic trees were in- viruses, which should be reflected in virological differences be-
ferred by using a neighbor-joining clustering method with branch lengths tween first-, second-, and third-wave viruses.
and substitution parameters estimated using the Tamura-Nei model un-
To assess virus differences, we isolated virus from clinical
der the maximum composite likelihood method implemented in MEGA
samples in SIAT-MDCK cells for a subset of viruses selected in
version 6.06 (19). Tree robustness was evaluated by bootstrapping with
accordance with their placements on the phylogenetic tree in
1,000 pseudoreplicates.
Statistical analysis. All statistical analyses were conducted using Fig. 1. We infected MDCK cells or primary HAE cultures or
GraphPad Prism software. Virus replication, IP-10, IFN cytokine produc- mice with 9 different clinical isolates from the second wave (3
tion, and mucus inhibition assays were assessed by unpaired t tests com- viruses) and the third wave (6 viruses), and we compared
pared to the A/195 first-wave isolate. The interferon and minigenome growth and outcome of infection with the first-wave prototypic
assays were assessed by repeated-measures or ordinary one-way analysis United Kingdom A(H1N1)pdm09 virus, A/England/195/2009.
of variance (ANOVA) with Tukey’s multiple-comparison test, as appro- Clinical data for patients from whom these isolates were ob-
priate. tained are shown in Table 3. We recorded the differences in
November 2014 Volume 88 Number 22 jvi.asm.org 13271
Elderfield et al.

                                                                                                                                                                  Downloaded from http://jvi.asm.org/ on October 23, 2014 by Imperial College London Library
FIG 1 Phylogenetic relationship of complete influenza A(H1N1)pdm09 virus genomes. The tree is rooted on A/California/04/2009, shown as a blue-filled circle.
United Kingdom first-wave isolates are highlighted as blue circles, while isolates sequenced by MOSAIC are shown as red circles for second-wave isolates from
community and hospitalized patients, and green circles show isolates from third-wave community and hospitalized patients. Isolates characterized in this study
are indicated with colored arrows, while the inferred ancestral location of the asparagine-lysine mutation in PA is indicated with a black arrow. Nodes with
bootstrap support of ⬎75% are highlighted with asterisks. Bar, 0.002 substitutions/site.

viral RNA load in NPA at time of recruitment (T1 NPA titer),                    third-wave viruses displayed a growth advantage at 24 and 48 h
the severity score for the patient, and the presence of patient                 postinfection in human airway cells. Using a different HAE culture
comorbidities. With the caveat that the delay between symp-                     code (primary cells obtained from a different donor), a representative
tom onset and recruitment varied from patient to patient (day                   third-wave clinical isolate, A/687, displayed a consistent 2-log10
since symptom onset), we did not find any correlation between                   growth advantage at the 24- and 48-h time points, with a peak titer of
viral load and severity score for this subset of the MOSAIC                     108 PFU/ml, compared with 106 PFU/ml for the A/195 first-wave
cohort.                                                                         virus at 48 h postinfection (P ⫽ 0.02), before the virus titers became
   In vitro, first-, second-, and third-wave viruses used to infect             similar at 72 h postinfection (Fig. 2c). Strikingly, in pig tracheal cell
MDCK cells did not show a consistent difference in replication pat-             cultures (NPTr), the third-wave virus A/687 was compromised in
tern according to respective waves, although there were small varia-            growth (Fig. 2c). In other human lung cell lines, such as Calu-3, the
tions between individual isolates (Fig. 2A). In HAE cell cultures, the          first-wave virus also replicated more efficiently than the third-wave
patterns of virus replication were more diverse and correlated with             virus, although the difference was not as pronounced as in the pig cell
respective waves. Although two viruses, one from the second wave                line. This suggests that the adaptation in third-wave virus might be
(A/47) and one from the third wave (A/213), displayed similar                   conferred by features only present in the well-differentiated complex
growth kinetics to the prototypic A/195 virus, most second- and                 HAE cultures.

13272    jvi.asm.org                                                                                                                        Journal of Virology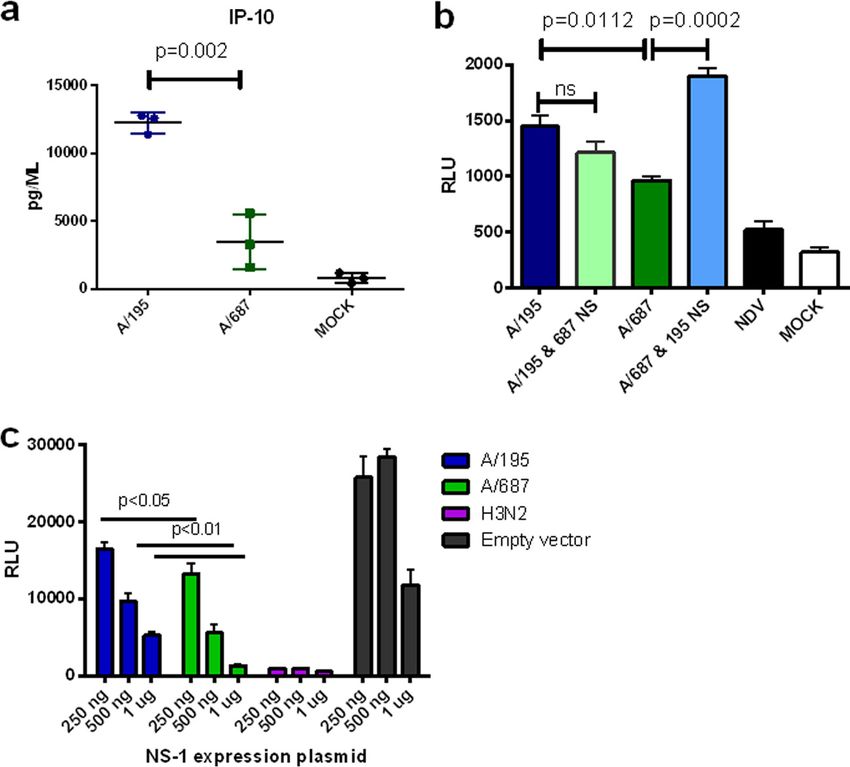
Human Adaptation of A(H1N1)pdm09 during Pandemic Waves

TABLE 1 Amino acid changes observed in 10 A/H1N1 pdm(2009) viruses isolated in the United Kingdom, in comparison to prototypic virus
A/England/195/2009a

                                                                                                                                                                              Downloaded from http://jvi.asm.org/ on October 23, 2014 by Imperial College London Library
a
    Data for the three isolates from the 2009-2010 season are above the line, and data for the 6 isolates from 2010-2011 are below it.

   Outcomes of infection in the in vivo BALB/c mouse model                                      day 2 for the second- and third-wave viruses compared to A/195
did not correlate with patient severity or growth in human air-                                 (Fig. 3d). For example, the first-wave A/195 virus replicated to
way cultures. In order to assess the in vivo characteristics of this                            high levels in mice, whereas the third-wave A/687 virus replicated
panel of clinical isolates, we utilized a mouse model. BALB/c mice                              comparatively poorly, but in HAE cells the situation was reversed
were infected intranasally with each of the panel of viruses. After a                           (Fig. 2c). However, in some cases the reciprocal pattern between
dose of 2 ⫻ 105 PFU, the A/195 first-wave isolate caused ⬎20%                                   HAE replication and mouse pathogenicity was not maintained:
weight loss by day 5 postinfection (Fig. 3a). Some of the second-                               A/672, which had similar growth in HAE as A/687, replicated to a
and third-wave viruses inoculated at the same dose were less                                    higher titer, induced greater weight loss of around 15%, and led to
pathogenic in mice, as ascertained by less weight loss; for example,                            20% mouse mortality. There are only four coding genetic differ-
the A/687 third-wave virus induced only 2% weight loss and no                                   ences between these two third-wave viruses: HA L176I, NS1
mortality (Fig. 3b and c). Mouse mortality (due to humane cull                                  I123V, PB1 I12T, and PB2 N556S.
based on weight loss) was observed in all three of the sets of mice                                 The most obvious trait that was associated with virus wave was a
infected with the second-wave viruses but only in two sets (A/689                               clear association between the IFN-␣ level in the mouse lung and the
and A/672) of the third-wave virus-infected mice. Statistically,                                wave of isolation for each virus; levels of IFN in lungs of mice infected
only the A/09-infected mice did not show a difference in weight                                 with second-wave viruses were lower than for A/195, and the lowest
loss compared to the A/195-infected mice; the A/47 and the A/689                                IFN levels were in third-wave virus-infected mouse lungs (Fig. 3e).
mouse groups displayed a statistical difference only on days 2 and                              The lower IFN production as the waves progressed could reflect the
3, respectively. The differences in weight loss and mortality in                                virus adapting to better control the host immune system. The same
mice did not correlate with the severity scores assigned to the                                 patterns of weight loss, lung titers, and lung interferon levels for each
human patients infected with the same virus (Fig. 3a, b, and c and                              isolate were observed in a separate experiment in which mice were
Table 3). Interestingly, the viral loads in the mouse lungs at day 2                            infected with 7.5 ⫻ 105 PFU (data not shown).
or 4 postinfection did not show the same pattern as titers in HAE                                   Virus with segment 8 of the third-wave virus induced less
culture infections, with a trend toward lower virus lung titers at                              type I interferon. The increased interferon in lungs of mice in-

November 2014 Volume 88 Number 22                                                                                                                         jvi.asm.org 13273
Elderfield et al.
TABLE 2 Prevalence ratios of amino acid changes in influenza viruses in the United Kingdom and the rest of the world (RoW) during the first,
second, and third waves of virus infection
Downloaded from http://jvi.asm.org/ on October 23, 2014 by Imperial College London Library
a
Incomplete ratios are due to unknown or multiple minor populations. HA numbering is based on that of H1.
fected with first-wave virus might be driven by higher viral loads. from HAE cells infected with the A/687 virus than cells infected
However, viral loads in lungs at day 2 were not always higher in with the first-wave virus A/195 (Fig. 4a). Levels of two other cyto-
mice infected by second-wave versus third-wave viruses, but IFN kines, interleukin-6 (IL-6) and IL-8, were also lower in basolateral
levels were higher (Fig. 3d and e). We hypothesized that mutations media following infection of the HAE cells with third-wave virus
in the virus between the second and third waves may have en- (data not shown), but the difference did not reach significance.
hanced the virus’ ability to control the innate immune response. IFN was not detectable in samples collected from the HAE cells
NS1 protein encoded on RNA segment 8 is the major interferon after infection with either virus.
antagonist of influenza A virus. Sequence analysis showed third- To further assess the role of the NS gene mutations in control-
wave viruses possessed a cluster of amino acid changes in the NS1 ling the cytokine response, we generated recombinant viruses with
protein in various combinations at positions E55Q, P114T, I123V, the segment 8 RNAs exchanged. The A/195 reverse genetics (RG)
and G189D (Table 1). A third-wave isolate, A/687, possessed three system described previously was generated by synthesizing the
of these changes within the effector domain of the NS1 protein: cDNAs for this strain de novo (8, 22). The A/687 reverse genetics
114T, 123V, and 189D. The G189D variation also changed the virus was created by site-directed mutagenesis of the A/195 plas-
coding sequence of the NEP protein (V32I), because the NS1 and mids wherever an amino acid change was present, for seven of the
NEP open reading frames overlap at this region. Under the con- gene segments. The gene segment encoding the A/687 HA was
ditions used for these assays, IFN- was undetectable in apical synthesized de novo.
washes or in basal medium from infected HAE cultures. There- 293T cells transiently transfected with an IFN- promoter
fore, we assessed the virus’ ability to counteract the production of luciferase reporter construct were infected with each of the 7:1
an innate induced cytokine, IP-10. At 16 h postinfection with a single-gene reassortant viruses or with the isogenic A/195 or
high multiplicity of virus, significantly less IP-10 was secreted A/687 wild-type RG viruses (Fig. 4b) (23). The A/687 RG virus
13274 jvi.asm.org Journal of VirologyHuman Adaptation of A(H1N1)pdm09 during Pandemic Waves
TABLE 3 Patient information for the MOSAIC viral isolates
Severity Collection date Days since T1 NPA titerf
Isolate scorea Comorbiditiesb (mo-yr)c symptoms onsetd Virus detectione (PFU/ml)
A/England/195/2009 Mild NKg Apr-09 NK NK NK
A/England/06/2010 1 Yes Jan-10 20 NPA 5,802
A/England/09/2010 1 Yes Dec-09 2 NPA 7,035
A/England/47/2010 3 Yes Dec-09 9 NPA, blood, stool 2,315
A/England/213/2011 2 Yes Jan-11 1 NPA 47
A/England/672/2010 2 Yes Dec-10 4 NPA 0.2
A/England/675/2010 1 No Dec-10 2 NPA 2
Downloaded from http://jvi.asm.org/ on October 23, 2014 by Imperial College London Library
A/England/687/2010 2 Yes Dec-10 2 NPA 8
A/England/689/2010 1 Yes Dec-10 2 NPA 1,251
A/England/699/2010 3 Yes Dec-10 4 NPA 23
a
The severity score was assigned according to the severity of respiratory impairment, as follows: grade 1, no respiratory compromise (oxygen saturation of ⬎93% on room air);
grade 2, respiratory compromise requiring noninvasive oxygen supplementation; grade 3, respiratory compromise requiring invasive mechanical ventilation and oxygen
supplementation.
b
Predisposing (comorbid) conditions included asthma, immunosuppression, etc. NK, not known.
c
The month the sample (from which the virus was isolated) was collected.
d
The time between onset of symptoms and viral sample collection.
e
Sample types in which virus was detected. NPA, nasopharyngeal aspirate.
f
The viral titer was assessed by qPCR of the H1N1 NA gene and compared against a standard curve of viral RNA of known PFU/ml.
g
NK, not known.
induced a significantly lower luciferase signal than A/195. The Since there was also a difference in NEP coding between these
induction of the IFN- promoter was decreased relative to that two viruses, we tested whether the NS1 protein itself had altered
with the isogenic A/195 virus when the 687 NS gene was present activity as an interferon antagonist when expressed exogenously.
and significantly increased for the A/687 virus with A/195 NS. At 3 different doses of NS1 expression, the third-wave NS1 protein
FIG 2 Replication of A(H1N1)pdm09 viruses in cell culture. (a and b) Viral growth of 10 clinical isolates from first-wave (blue), second-wave (red), or
third-wave (green) viruses in MDCK cells (a) and human nasal MucilAir cell cultures (HAE; Epithelix) (b). Cells were infected at an MOI of 0.001 (MDCK cells)
or 0.01 (MucilAir) and incubated at 34°C. The dashed line represents the mean for A/195. Statistics in the tables adjoining the chart keys were calculated using
unpaired t tests with Holm-Sidak corrections. (c) Replication of a representative first-wave (A/195; blue circles) and third-wave (A/687; green squares) virus pair
was assessed in HAE cells (left panel), MDCK cells (left middle panel), CALU3 cells (right middle panel), and pig tracheal cells (right panel). Cells were infected
at an MOI of 0.001. Statistics were calculated using unpaired t tests.
November 2014 Volume 88 Number 22 jvi.asm.org 13275Elderfield et al.
Downloaded from http://jvi.asm.org/ on October 23, 2014 by Imperial College London Library
FIG 3 Infection of mice with A(H1N1)pdm09 viruses. (a to c) Weight loss was followed after infection of 15 BALB/c mice inoculated intranasally with 2 ⫻ 105
PFU of virus isolates: (a) one A/195 first-wave isolate (blue); (b) three second-wave isolates (red); (c) six third-wave isolates (green). Weights in mice inoculated
with PBS are shown in black. (d and e) Virus titers (d) and interferon levels (e) in lung homogenates at day 2. (f) Mouse mortality data for virus infections where
weight loss necessitated culling.
was significantly better able to control the expression of luciferase MOSAIC virus isolates representative of the three waves, includ-
driven by an interferon promoter in Newcastle disease virus ing A/195 (first wave), A/06 (second wave), and A/675 and A/687
(NDV)-infected cells (Fig. 4c). (third wave) from the panel of nine viruses studied above, were
The HA and NA genes of third-wave viruses displayed differ- tested in a hemagglutination assay using erythrocytes from differ-
ent receptor binding preferences, enhanced infectivity in hu- ent species (guinea pig, turkey, and chicken), which are known to
man mucus, and conferred enhanced growth in HAE cell cul- differ in specificity and density of sialic acids expressed on their
tures compared to first-wave viruses. Second- and third-wave cell surfaces (24). All viruses displayed comparable binding to
United Kingdom viruses displayed wave-associated amino acid guinea pig and turkey erythrocytes, but the second- and third-
changes in the HA and NA proteins (Table 1). A collection of 11 wave isolates displayed lower binding to chicken red blood cells
13276 jvi.asm.org Journal of VirologyHuman Adaptation of A(H1N1)pdm09 during Pandemic Waves
Downloaded from http://jvi.asm.org/ on October 23, 2014 by Imperial College London Library
FIG 4 Cytokine induction by first- and third-wave viruses and the role of NS gene segments in virus replication in HAE cells. (a) Human nasal MucilAir cell
cultures (HAE; Epithelix) were infected in triplicate with RG A/195 and A/687 virus at an MOI of 1 for 16 h. The basal medium was harvested, and levels of the
cytokine IP-10 were measured using mesoscale discovery (MSD) plates. Statistical analysis was performed with an unpaired t test. (b) 293T cells transiently
transfected with a beta interferon promoter luciferase reporter plasmid were infected with RG viruses A/195 (dark blue), A/195 with A/687 segment 8 (light
green), A/687 (dark green), and A/687 with the A/195 segment 8 (light blue) at an MOI of 3. Infection with NDV was used as a positive control. Statistical analysis
entailed a one-way ANOVA, with Tukey’s multiple-comparison test (and associated adjusted P values). (c) 293T cells transiently transfected with an beta
interferon promoter luciferase reporter and pCAGGs NS1 plasmids A/195 (blue), A/687 (green), and H3N2 (purple). Positive controls were stimulated with
NDV. Statistical analysis was performed with a one-way ANOVA and Tukey’s multiple-comparison test.
relative to A/195 (Fig. 5a). The only exception was A/675, which with 7 segments from the A/195 virus and RNA segment 6, which
has an M227I (230 in H3 numbering) amino acid variation near encodes the NA protein from A/687. This virus and the isogenic
the receptor binding pocket and retained strong binding to A/195 virus were then incubated in the presence of human respi-
chicken erythrocytes. HA assays performed with RG A/195 and ratory mucus for 60 min prior to infection of MDCK cells. The
A/687 viruses recapitulated the general pattern seen for the panel numbers of plaque-forming foci were counted, and the percent
of isolates; the relative binding of the first-wave virus for chicken reduction in infectivity was calculated (25). The virus carrying the
erythrocytes was higher than for the third-wave virus (Fig. 5b). third-wave NA gene segment displayed an increased ability (P ⫽
A/687 virus differs from A/195 by 8 amino acids in the HA 0.044) to overcome inhibition of infectivity by human mucus,
protein and 4 in the NA protein. To test if the changes in HA and which is an important factor in the ability of a virus to infect and
NA alone were sufficient to confer the observed growth advantage spread in the human airway (Fig. 5d).
in human airway cells (Fig. 2b and c), we generated 6:2 recombi- The mutation in PA N321K of third-wave viruses conferred
nant viruses with the A/687 HA and NA combined with A/195 enhanced replication in a minireplicon assay and in viral com-
internal proteins or the A/687 internal genes with the HA and NA petition assays. Mutations in other genes of the second- and
of A/195, and we compared their replication with that of isogenic third-wave viruses may have also contributed to human adapta-
wild-type RG A/195 or RG A/687. The virus with the A/687 inter- tion and enhanced replication in HAE cells. In the polymerase
nal genes coupled with first-wave HA and NA replicated to a lower proteins and nucleoprotein of the A/687 virus, there were 7 amino
titer than whole A/687 virus, and conversely, the virus with A195 acid changes from A/195 polymerase genes, 3 of which were
internal genes and third-wave HA and NA replicated to higher unique to the majority of the third-wave viruses in the United
titers than whole A/195 virus. However, the differences in replica- Kingdom. These three changes were at PB2 V344M, I354L, and PA
tion did not reach statistical significance (Fig. 5c). This suggests N321K (Table 1).
that both internal and external genes contribute to the enhanced In order to assess whether these amino acid changes altered the
replication of third-wave virus in HAE cultures, but neither of the activity of the viral polymerase, we created two sets of expression
gene sets is sufficient to reproduce the phenotype alone. plasmids that allowed reconstitution of polymerase components
To investigate a role for the third-wave NA protein in en- from either A/195 or from A/687 virus. For the A/195 constella-
hanced replication in HAE cultures, we generated a 7:1 RG virus tion, we used a PA plasmid with the glycine 3 mutated to aspartic
November 2014 Volume 88 Number 22 jvi.asm.org 13277Elderfield et al.
Downloaded from http://jvi.asm.org/ on October 23, 2014 by Imperial College London Library
FIG 5 Variation in surface genes HA and NA in third-wave virus isolates leads to altered receptor binding, enhanced replication in HAE cells, and enhanced
infectivity in mucus. (a) Hemagglutination assay with 11 clinical isolates from first-wave (blue), second-wave (red), and third-wave (green) isolates, assessed for
binding to 0.5% chicken, turkey, or guinea pig red blood cells. The dashed line represents the A195 HA score. (b) Hemagglutination assay with equal PFU of
A/195 first-wave (blue) and A/687 third-wave (green) RG viruses with 0.5% chicken or turkey red blood cells. (c) Viral replication in human nasal MucilAir cell
cultures (HAE; Epithelix) of RG viruses based on A/195 with HA and NA from A/195 first-wave (blue) or HA and NA of A/687 third-wave (green triangle)
isolates. (d) A/687 (green square) or A/687 with A/687 with HA and NA from A/195 (blue triangle). Cells were infected at an MOI of 0.01. *, P ⬍ 0.05 based on
an unpaired t test. (e) Mucus inhibition assay. An equal PFU of A/195 (blue) or A/195 with A/687 third-wave isolate NA (green) RG virus was incubated with
diluted human mucus for 1 h prior to infection of MDCK cells. Infectivity remaining was plotted as the percentage of the titer in the absence of mucus. *, P ⫽
0.044 by unpaired t test.
acid, since this difference was atypical among first-wave viruses total reads via an unpaired t test), illustrating a growth advantage
(17). Each viral polymerase was reconstituted in a minireplicon in human cells conferred by this amino acid change (Fig. 6b).
reporter assay in 293T cells as previously described (26). The
third-wave A/687 polymerase and nucleoprotein complex consis- DISCUSSION
tently directed higher amplification and higher expression of the
In the United Kingdom, there was a reported increase in severity
luciferase signal from the minireplicon in human cells than the
of the pandemic H1N1 virus as the waves of influenza virus infec-
A/195 polymerase constellation (P ⱕ 0.001) (Fig. 6a).
In order to discern if this enhancement of polymerase activity tion progressed from its emergence in spring 2009 until the end of
was a result of amino acid changes in a single protein, the minire- winter 2011 (10, 12). It has been suggested that this can be attrib-
plicon assays were carried out with single protein exchanges. A uted to a shift in the behavior of the infected population due to a
dramatic 10-fold decrease in signal was observed when the A/195 change in public health responses (10, 13). However, this expla-
PA protein was paired with the A/687 PB1, PB2, and NP proteins. nation does not exclude host adaptations in the influenza virus
The reciprocal exchange showed the converse result, although the itself that might also have contributed to the change in severity
increase in polymerase activity when A/687 PA was introduced associated with A(H1N1)pdm09 infection. If the virus were re-
into the A/195 polymerase constellation was not statistically sig- sponsible, there may have been a specific virulence factor that
nificant (Fig. 6a). appeared in many or all of the hospitalized cases; however, we
To assess whether the PA N321K mutation led to an enhance- found no evidence for this in our study. We can discern from
ment of replication in the context of whole virus, we generated a whole-genome sequence data provided by FLUWatch, FF100,
7:1 (PA) RG virus in which every genomic segment except for the PHE, RCGP, and the isolates derived from the hospitalized
A/687 PA segment was derived from A/195. Replication competi- MOSAIC patients over three waves of infection in the United
tion experiments starting with a 50:50 mix in triplicate HAE cul- Kingdom that the viruses derived from hospitalized patients did
tures were analyzed by deep sequencing using Illumina sequenc- not vary genetically from those found within the community, con-
ing technology and showed the virus with the PA 321K from the sistent with the findings of Galliano et al. for the second wave (27).
third-wave genotype rapidly dominated the viral RNA population Alternatively, a constellation of adaptive changes that accumu-
in all 3 biological replicates (P ⫽ 0.0078, ⬍0.0001, and ⬍0.0001 at lated in the virus as it circulated in the community could have
48, 72, and 96 h, respectively, when assessed as the percentage of made it more likely that a higher proportion of individuals would
13278 jvi.asm.org Journal of VirologyHuman Adaptation of A(H1N1)pdm09 during Pandemic Waves
Downloaded from http://jvi.asm.org/ on October 23, 2014 by Imperial College London Library
FIG 6 PA of third-wave virus confers enhanced polymerase activity and a fitness advantage in HAE cells. (a) Activities of polymerase reconstituted from plasmids
expressing polymerase components of A/195 first-wave (dark blue) and A/687 third-wave (dark green) viruses. 293T cells were transiently transfected with a
plasmid that directs in situ synthesis of a minigenome in which a luciferase reporter gene is flanked by the influenza A virus promoter. Cotransfection of a Renilla
expression plasmid was used to normalize for transfection efficiency. Combinations of the PB1, PB2, PA, and NP expression plasmids of A/195 (blue) or A/687
(green) or lacking the PB2 polymerase (white) were transfected. At 24 h posttransfection, cells were harvested. The results were normalized based on Renilla
results (transfection control) and are from three separate set of experiments, each with triplicate wells (n ⫽ 9). Differences were analyzed using a one-way
ANOVA test with Tukey’s multiple-comparison test. (b) Human nasal MucilAir cell cultures (HAE; Epithelix) were infected in triplicate with RG viruses based
on A/195 that differed only in PA at N321K. Virus released was harvested at 24, 48, 72, and 96 h and sequenced using the Illumina system. The percentage of N
allele (first wave) is represented in blue and K (third wave) is shown in green.
become infected, with possibly more efficient early virus replica- present as a minority variant in samples taken at certain times
tion, leading to more severe infections in some people. during the infection. We do not know why it was not detected in
A great deal of effort worldwide has been put into tracing our MOSAIC cohort.
amino acid changes in the pandemic H1 HA, and to a lesser degree We detected a different type of phenotypic change associated with
the NA (28–37). This emphasis on the glycoproteins is under- the HA protein of the third-wave viruses compared to the first-wave
standable, due to their antigenic properties and importance in isolate. A comparison of the viruses’ relative abilities to hemaggluti-
determining antiviral susceptibility. Indeed, various functional nate chicken, turkey, or guinea pig red blood cells indicated a relative
consequences of naturally occurring amino acid changes in the increase in affinity to ␣-2,6-linked sialic acids and a concomitant
NA and HA proteins have already been demonstrated using ani- decrease in the ability to bind to ␣-2,3-linked sialic acids for the ma-
mal models (38–43). In our MOSAIC hospitalized cohort, we did jority of the third-wave isolates. This alone may have increased the
not detect the specific HA mutations described by others to affect ability of the virus to infect the human upper respiratory tract, ac-
A(H1N1)pdm09 virulence, for example, HA D222G, which pur- counting for the greater replication of A/687 in HAE cells. That the
portedly facilitates better binding to ␣-2,3-sialic acid-linked re- lost affinity for the ␣-2,3-sialic acids is observed in both second- and
ceptors in the lower respiratory tract (44–47), changes in glycosy- third-wave isolates would implicate one or more of the previously
lation (48), or antigenicity (49) were not present. Other groups reported variations in the HA I32L, D97N, S185T, E374K, and S451N
have suggested that HA D222G is relatively common in severe (27). A recent publication by de Vries et al. (50) indicated a change in
cases (44–47).The D222G mutation has been suggested to some- receptor binding caused by an S185T mutation. We also note the
times arise during virus culture as an artifact and may also only be recent publication from Cotter et al. (51) showing that later isolates of
November 2014 Volume 88 Number 22 jvi.asm.org 13279Elderfield et al.
A(H1N1)pdm09 virus contained pH-stabilizing mutations in HA 2.06% of avian isolates have PA 321K. This amino acid does not
which enhanced their replication in the ferret upper respiratory tract. occur in the PA segment of seasonal human influenza viruses, but
This mutation at HA residue E374K (H1 numbering) is present in 5 the prevalence of the lysine variation in human isolates of pan-
of 6 third-wave viruses in our subset (Table 1) and may also have demic H1N1 increased sharply as sequences from later in the pan-
contributed to the increased replication in HAE cultures we observed demic were submitted to NCBI, supporting its prevalence during
(Fig. 2b). and after the third wave. We expected the advantage conferred by
There may also be a contribution of NA to the increased this single PA mutation engineered alone to be subtle, and there-
propagation of third-wave virus in HAE (Fig. 5c). All of the fore we analyzed the effect by using a competition assay rather
second- and third-wave viruses in our cohort had NA muta- than by direct comparison of growth curves. Previously, we
tions V106I and N248D compared to first-wave A/195. These showed that the NA mutation H275Y in first-wave virus conferred
Downloaded from http://jvi.asm.org/ on October 23, 2014 by Imperial College London Library
are proposed to enhance viral stability, through modifications a replicative cost that was not detected by growth curve analysis
in pH tolerance under acidic conditions, although we did not but only by competition assay (62). Indeed, we found that virus
assess this phenotype (52). However, we did observe an in- with the single PA change 321K outgrew 321N virus in 3 biological
crease in the ability of virus with third-wave NA to retain its replicates of HAE cultures. This type of fitness assay could be
infectivity in human mucus, a property linked with efficient useful in predicting the selection of mutations that confer subtle
replication in HAE cells and transmission in ferrets (23). Sev- advantage.
eral other research groups have already investigated variations The other gene segment we investigated in detail here was that
between individual isolates of the A(H1N1)pdm09 lineage. which encodes the NS1 protein. Interestingly, we found a cluster
These publications described a few selected isolates from mild, of mutations in NS1 that slightly enhanced its ability to control the
severe, or fatal cases and characterized their phenotypes in var- innate immune response, including IFN and other cytokines. In
ious animal models without considering their broader phylo- the murine model, decreased virus titer in the lungs early in infec-
genetic relationships (41, 53–55). A correlation has sometimes tion with third-wave viruses may also have contributed in part to
been observed between the outcome of infection in animal decreased IFN production. However, in human airway cultures
models and the severity of the human case from which the where third-wave virus replicated robustly, we observed decreased
isolate was obtained; this was not the case in our study. Rather, IP-10 production in comparison with A/195. We attribute this to
we found increased replication in primary human cells was changes in NS1, because other known antagonists of the inter-
often accompanied by decreased virulence in the murine feron response, such as PB1-F2, were not different between these
model. It is well recognized that the mouse is not a good model two viruses. Moreover, a 6:2 recombinant virus with HA and NA
host for human-adapted influenza viruses. from the third wave on a first-wave internal gene constellation
Our work suggests that changes to internal viral proteins, induced higher IP-10 and other cytokine responses in HAE cells
including NS1 and PA, occurred during evolution of the third- than whole first-wave virus (data not shown). This suggests that
wave viruses and adapted them for increased replication in the differences in cytokine response were not accounted for in this
human cells. Others have also recently suggested that muta- case by changes in receptor binding specificity that affected cili-
tions have occurred in the virus polymerase, since its transfer to ated versus nonciliated cell tropism in the HAE cultures, as sug-
humans may enhance replication or transmission (56, 57). gested by Ramos et al. in 2011 (63). One explanation for our find-
These previously described mutations may contribute to some ings is that the NS1 protein had acquired some ability to bind to
of the enhanced polymerase activity we measured for the A/687 host cell factor CPSF30 and inhibit host mRNA processing, a
third-wave virus polymerase, but our in vitro polymerase re- mechanism by which other human-adapted influenza viruses
porter system also indicated that the N321K amino acid change have enhanced their control of the human innate immune re-
in the PA protein, not previously reported, drove enhancement sponse (64, 65). Indeed, exogenous expression of the A/687 NS1
of viral polymerase activity. How it may achieve this is unclear. gene inhibited the expression of a reporter gene from a polymer-
PA is known to interact with host factors, such as transcrip- ase II promoter significantly more efficiently than the NS1 gene
tional modulator of RNA polymerase II (RNAPII) hCLE (58, from A/195 did (data not shown). This property is associated with
59) and the minichromosome maintenance complex (60). The an ability to bind and inhibit CPSF30 and may account for the
PA gene segment of A(H1N1)pdm09 virus was originally de- difference we observed in heterologous control of induced inter-
rived from an avian source during the formation of the TRIG feron (Fig. 4c). Hale et al. already predicted some mutations in
internal gene cassette. Bussey et al. already described three A/California/04/2009 virus by which this could be achieved, one
amino acids (85I, 186S, and 336M) present in the A(H1N1) of which is common to the A/687 NS1, G189D (7). That study also
pdm09 PA that are not usually present in PA of avian viruses. reported rather subtle effects on virus replication for viruses that
They concluded that these three mutations together may have were engineered to have CPSF30 binding. Notably, one virus iso-
contributed to the ability of this polymerase complex to func- lated in the third wave, A/689, which phylogenetically lies closer to
tion better in mammalian cells. The mutation at residue 336 is second-wave viruses, was associated with higher cytokine levels
situated close to amino acid 321 on the crystal structure (61). than other third-wave viruses in mouse lungs.
PA 321K was, until now, rare in swine-adapted influenza vi- In conclusion, using a collection of A(H1N1)pdm09 viruses
ruses, occurring in only 1.85% of sequences of all influenza virus A chosen based on phylogenetic divergence, we have shown that
subtypes and in 3% of swine H1N1 viruses before the emergence amino acid changes in HA, NA, NS1, and PA in later waves led to
of A(H1N1)pdm09 in 2009. It will be interesting to see if there is functional changes in individual viral genes that conferred in-
an increase in the occurrence of a lysine at this position in swine as creased replication in primary human airway cells, suggestive of
the A(H1N1)pdm09 virus circulates in pigs or is reintroduced to human adaptation. The increase in viral fitness overall may facil-
this host through contact with humans after the third wave. Only itate increased transmission, as suggested by Doriggati and Fergu-
13280 jvi.asm.org Journal of VirologyHuman Adaptation of A(H1N1)pdm09 during Pandemic Waves
son, but the lack of viral genetic differences between severe and United Kingdom, and by the Biomedical Research Centre (BRC) and Unit
community influenza cases suggests these changes are not on their (BRU) funds.
own sufficient to confer severe disease (16), especially as there is Finally, we thank all patients and their relatives for their generous
evidence of high levels of asymptomatic or unreported illness dur- agreement for inclusion in this study.
ing the first three waves of A(H1N1)pdm09 virus activity in the
United Kingdom (12). Infection of those people predisposed to REFERENCES
more severe disease may have been more likely in the third wave 1. Zhou NN, Senne DA, Landgraf JS, Swenson SL, Erickson G, Rossow K,
because of the differences in viral replication, host immune mod- Liu L, Yoon KJ, Krauss S, Webster RG. 1999. Genetic reassortment of
ulation, and viral persistence in the host and the external environ- avian, swine, and human influenza A viruses in American pigs. J. Virol.
73:8851– 8856.
ment (66–68).
Downloaded from http://jvi.asm.org/ on October 23, 2014 by Imperial College London Library
2. Karasin AI, Schutten MM, Cooper LA, Smith CB, Subbarao K, Ander-
son GA, Carman S, Olsen CW. 2000. Genetic characterization of H3N2
ACKNOWLEDGMENTS influenza viruses isolated from pigs in North America, 1977–1999: evi-
dence for wholly human and reassortant virus genotypes. Virus Res. 68:
R.E., S.W., W.B., P.K., and P.O. wrote the manuscript. J.D. developed 71– 85. http://dx.doi.org/10.1016/S0168-1702(00)00154-4.
clinical protocols, helped collect clinical samples and clinical data, and 3. Webby RJ, Swenson SL, Krauss SL, Gerrish PJ, Goyal SM, Webster RG.
contributed to manuscript revision. S.W., R.E., W.A., B.C., C.T., M.Z., the 2000. Evolution of swine H3N2 influenza viruses in the United States. J. Virol.
MOSAIC investigators, Flu Watch, FF100, and RCGP contributed viral 74:8243– 8251. http://dx.doi.org/10.1128/JVI.74.18.8243-8251.2000.
isolates and sequencing data. R.E., A.G., W.B., T.H., P.O., M.F.A., S.W., 4. Smith GJD, Vijaykrishna D, Bahl J, Lycett SJ, Worobey M, Pybus OG,
P.K., and D.B. performed and/or planned experiments. Ma SK, Cheung CL, Raghwani J, Bhatt S, Peiris JSM, Guan Y, Rambaut
A. 2009. Origins and evolutionary genomics of the 2009 swine-origin
Funding for this study was provided by The Medical Research Council
H1N1 influenza A epidemic. Nature 459:1122–1125. http://dx.doi.org/10
UK. In addition, Wellcome Trust funded MOSAIC via program grant .1038/nature08182.
090382/Z/09/Z, Imperial College London Comprehensive Biomedical 5. Garten RJ, Davis CT, Russell CA, Shu B, Lindstrom S, Balish A,
Research Centre (cBRC) and Public Health England. Sessions WM, Xu X, Skepner E, Deyde V, Okomo-Adhiambo M,
MOSAIC data and clinical samples were provided by the MOSAIC Gubareva L, Barnes J, Smith CB, Emery SL, Hillman MJ, Rivailler P,
group, which includes the following investigators: D. Chaussable (Ben- Smagala J, de Graaf M, Burke DF, Fouchier RAM, Pappas C, Alpuche-
aroya Research Institute, USA); W. E. Adamson and W. F. Carman (Gart- Aranda CM, López-Gatell H, Olivera H, López I, Myers CA, Faix D,
navel General Hospital, Greater Glasgow, United Kingdom); C. Thomp- Blair PJ, Yu C, Keene KM, Dotson PD, Boxrud D, Sambol AR, Abid
son and M. C. Zambon (Health Protection Agency, United Kingdom); P. SH, St George K, Bannerman T, Moore AL, Stringer DJ, Blevins P,
Aylin, D. Ashby, W. S. Barclay, S. J. Brett, W. O. Cookson, L. N. Drum- Demmler-Harrison GJ, Ginsberg M, Kriner P, Waterman S, Smole S,
Guevara HF, Belongia EA, Clark PA, Beatrice ST, Donis R, Katz J,
right, J. Dunning, R. A. Elderfield, L. Garcia-Alvarez, B. G. Gazzard, M. J.
Finelli L, Bridges CB, Shaw M, Jernigan DB, Uyeki TM, Smith DJ,
Griffiths, M. S. Habibi, T. T. Hansel, J. A. Herberg, A. H. Holmes, T. Klimov AI, Cox NJ. 2009. Antigenic and genetic characteristics of swine-
Hussell, S. L. Johnston, O. M. Kon, M. Levin, M. F. Moffatt, S. Nadel, P. J. origin 2009 A(H1N1) influenza viruses circulating in humans. Science
Openshaw, and J. O. Warner (Imperial College London, United King- 325:197–201. http://dx.doi.org/10.1126/science.1176225.
dom); S. J. Aston and S. B. Gordon (Liverpool School of Tropical Medi- 6. Mänz B, Dornfeld D, Götz V, Zell R, Zimmermann P, Haller O, Kochs
cine, United Kingdom); A. Hay, J. McCauley, and A. O’Gara (National G, Schwemmle M. 2013. Pandemic influenza A viruses escape from re-
Institute for Medical Research, United Kingdom); J. Bancherau (Roche, striction by human MxA through adaptive mutations in the nucleopro-
Nutley, NJ, USA); A. Hayward (University College London, United King- tein. PLoS Pathog. 9:e1003279. http://dx.doi.org/10.1371/journal.ppat
dom); J. K. Baillie, D. A. Hume, P. Simmonds (University of Edinburgh, .1003279.
United Kingdom); P. S. McNamara, M. G. Semple, R. L. Smyth (Univer- 7. Hale BG, Steel J, Medina RA, Manicassamy B, Ye J, Hickman D, Hai R,
Schmolke M, Lowen AC, Perez DR, García-Sastre A. 2010. Inefficient
sity of Liverpool, United Kingdom); J. S. Nguyen-Van-Tam (University of
control of host gene expression by the 2009 pandemic H1N1 influenza A
Nottingham, United Kingdom); L.-P. Ho, A. J. McMichael (University of virus NS1 protein. J. Virol. 84:6909 – 6922. http://dx.doi.org/10.1128/JVI
Oxford, United Kingdom); P. Kellam (Wellcome Trust Sanger Institute, .00081-10.
United Kingdom). 8. Shelton H, Smith M, Hartgroves LCS, Stilwell P, Roberts KL, Johnson
MOSAIC acknowledges the assistance of K. Alshafi, E. Bailey, A. Ber- B, Barclay WS. 2012. An influenza reassortant with polymerase of pH1N1
mingham, M. Berry, C. Bloom, E. Brannigan, S. Bremang, J. Clark, M. C. and NS gene of H3N2 influenza A virus is attenuated in vivo. J. Gen. Virol.
Cox, M. Cross, L. A. Cumming, S. Dyas, J. England-Smith, J. Enstone, D. 93:998 –1006. http://dx.doi.org/10.1099/vir.0.039701-0.
Ferreira, N. Goddard, A. Godlee, S. Gormley, M. Guiver, M. O. Hassan- 9. Sridhar S, Begom S, Bermingham A, Hoschler K, Adamson W, Carman
Ibrahim, H. Hill, P. Holloway, K. Hoschler, G. Houghton, F. Hughes, R. R. W, Van Kerkhove MD, Lalvani A. 2013. Incidence of influenza
Israel, A. Jepson, K. D. Jones, W. P. Kelleher, M. Kidd, K. Knox, A. Lack- A(H1N1)pdm09 infection, United Kingdom, 2009 –2011. Emerg. Infect.
Dis. 19:1866 –1869. http://dx.doi.org/10.3201/eid1911.130295.
enby, G. Lloyd, H. Longworth, M. Minns, S. Mookerjee, S. Mt-Isa, D.
10. Green HK, Andrews N, Fleming D, Zambon M, Pebody R. 2013.
Muir, A. Paras, V. Pascual, L. Rae, S. Rodenhurst, F. Rozakeas, E. Scott, E. Mortality attributable to influenza in England and Wales prior to, during
Sergi, N. Shah, V. Sutton, J. Vernazza, A. W. Walker, C. Wenden, T. and after the 2009 pandemic. PLoS One 8:e79360. http://dx.doi.org/10
Wotherspoon, A. D. Wright, F. Wurie, and the clinical and laboratory staff .1371/journal.pone.0079360.
of the Alder Hey Children’s NHS Foundation Trust, Brighton & Sussex 11. Presanis AM, Pebody RG, Paterson BJ, Tom BDM, Birrell PJ, Charlett
University Hospitals NHS Trust, Central Manchester University Hospi- A, Lipsitch M, De Angelis D. 2011. Changes in severity of 2009 pandemic
tals NHS Foundation Trust, Chelsea and Westminster Hospital NHS A/H1N1 influenza in England: a Bayesian evidence synthesis. BMJ 343:
Foundation Trust, Alder Hey Children’s Hospital and Liverpool School of d5408. http://dx.doi.org/10.1136/bmj.d5408.
Tropical Medicine, Health Protection Agency Microbiology Services 12. Hayward AC, Fragaszy EB, Bermingham A, Wang L, Copas A, Ed-
Colindale, Imperial College Healthcare NHS Trust, Liverpool Women’s munds WJ, Ferguson N, Goonetilleke N, Harvey G, Kovar J, Lim MSC,
McMichael A, Millett ERC, Nguyen-Van-Tam JS, Nazareth I, Pebody R,
NHS Foundation Trust, Royal Liverpool and Broadgreen University Hos-
Tabassum F, Watson JM, Wurie FB, Johnson AM, Zambon M. 2014.
pitals NHS Trust, Royal Brompton and Harefield NHS Foundation Trust, Comparative community burden and severity of seasonal and pandemic
The Roslin Institute, Edinburgh, University Hospitals Coventry, and influenza: results of the Flu Watch cohort study. Lancet Respir. Med.
Warwickshire NHS Trust. 2:445– 454. http://dx.doi.org/10.1016/S2213-2600(14)70034-7.
MOSAIC was supported by several Comprehensive Local Research 13. Mytton OT, Rutter PD, Donaldson LJ. 2012. Influenza A (H1N1) pdm09
Networks (CLRNs), the National Institute for Health Research (NIHR), in England, 2009 to 2011: a greater burden of severe illness in the year after
November 2014 Volume 88 Number 22 jvi.asm.org 13281You can also read