Genome-Wide Analysis Identifies NURR1- Controlled Network of New Synapse Formation and Cell Cycle Arrest in Human Neural Stem Cells
←
→
Page content transcription
If your browser does not render page correctly, please read the page content below
Molecules and Cells

Genome-Wide Analysis Identifies NURR1-
Controlled Network of New Synapse Formation
and Cell Cycle Arrest in Human Neural Stem Cells
Soo Min Kim1,2, Soo Young Cho3, Min Woong Kim1,2, Seung Ryul Roh1,2, Hee Sun Shin1,2, Young Ho Suh4,
Dongho Geum5, and Myung Ae Lee1,2,*

1
 Department of Brain Science, Ajou University School of Medicine, Suwon 16499, Korea, 2Neuroscience Graduate Program,
Department of Biomedical Sciences, Graduate School of Ajou University, Suwon 16499, Korea, 3National Cancer Center,
Goyang 10408, Korea, 4Department of Biomedical Sciences, Seoul National University College of Medicine, Seoul 03080, Korea,
5
 Department of Medical Science, Korea University Medical School, Seoul 02841, Korea
*Correspondence: lma52347@ajou.ac.kr
https://doi.org/10.14348/molcells.2020.0071
www.molcells.org

Nuclear receptor-related 1 (Nurr1) protein has been identified          Keywords: dopaminergic neurogenesis, gene expression
as an obligatory transcription factor in midbrain dopaminergic          profiling, human neural stem cell, NURR-1
neurogenesis, but the global set of human NURR1 target
genes remains unexplored. Here, we identified direct gene
targets of NURR1 by analyzing genome-wide differential                  INTRODUCTION
expression of NURR1 together with NURR1 consensus sites
in three human neural stem cell (hNSC) lines. Microarray                The cell bodies of midbrain dopaminergic (mDA) neurons are
data were validated by quantitative PCR in hNSCs and mouse              localized in the substantia nigra and ventral tegmental area,
embryonic brains and through comparison to published                    where these neurons play critical roles in the central regula-
human data, including genome-wide association study hits                tion of motor and motivational behaviors (Elsworth and Roth,
and the BioGPS gene expression atlas. Our analysis identified           1997; Wallen and Perlmann, 2003). Progressive degeneration
~40 NURR1 direct target genes, many of them involved                    of dopaminergic (DA) cells leads to the cardinal symptoms
in essential protein modules such as synapse formation,                 of Parkinson’s disease (Shastry, 2001; Wallen and Perlmann,
neuronal cell migration during brain development, and cell              2003). Similar to the development of other neuron types
cycle progression and DNA replication. Specifically, expression         in the central nervous system (CNS), maturation of mDA
of genes related to synapse formation and neuronal cell                 neurons may require neuron migration, cell positioning, and
migration correlated tightly with NURR1 expression, whereas             axon wiring, all processes for establishing neural networks in
cell cycle progression correlated negatively with it, precisely         different neuronal systems.
recapitulating midbrain dopaminergic development. Overall,                 A previous report described a series of events that are im-
this systematic examination of NURR1-controlled regulatory              portant for mesencephalic DA cell differentiation in mice (An-
networks provides important insights into this protein’s                dersson et al., 2013; Blakely et al., 2011; Deng et al., 2011;
biological functions in dopamine-based neurogenesis.                    Di Salvio et al., 2010; Inestrosa and Arenas, 2010; Panman
                                                                        et al., 2014; Prakash and Wurst, 2006; Smits et al., 2006;

Received 19 March, 2020; revised 1 May, 2020; accepted 9 May, 2020; published online 10 June, 2020

eISSN: 0219-1032
©The Korean Society for Molecular and Cellular Biology. All rights reserved.
cc This is an open-access article distributed under the terms of the Creative Commons Attribution-NonCommercial-ShareAlike 3.0 Unported
License. To view a copy of this license, visit http://creativecommons.org/licenses/by-nc-sa/3.0/.

                                                                                                     Mol. Cells 2020; 43(6): 551-571 551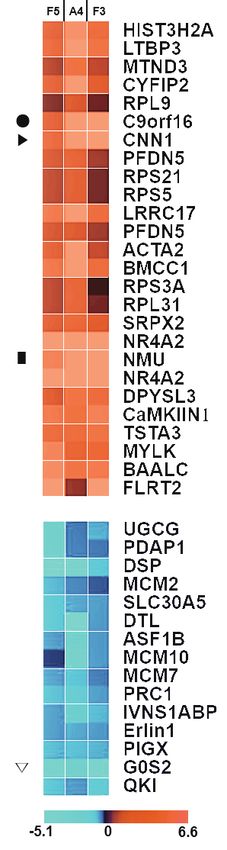
Genome-Wide Analysis of NURR1-Controlled Network in hNSCs
Soo Min Kim et al.

Theofilopoulos et al., 2013; Van den Heuvel and Pasterkamp,          MATERIALS AND METHODS
2008; Wallen et al., 1999; Yang et al., 2013; Zhang et al.,
2013). Initially, the mDA progenitor appears in the ventricu-        Cell cultures
lar-most cell layers within the ventral mesencephalon at em-         Immortalized hNSC lines (HB1.F3, HB1.F5, and HB1.A4) (Kim,
bryonic day (E)10.5, undergoes neurogenesis, and gives rise          2004) and the human embryonic kidney cell line HEK293
to mDA neuroblasts. The mDA precursor cells then migrate             were maintained and passaged on uncoated culture dishes
from the ventricular zone to a medial location in the mantle         in Dulbecco’s modified Eagle medium (Gibco – ThermoFisher
zone and exit the cell cycle (become post-mitotic) between           Scientific, USA) with 10% fetal bovine serum (Hyclone), and
E11.5 and E13.5. At this stage, expression of nuclear recep-         10 µg/ml penicillin-streptomycin (Gibco, USA). All cells trans-
tor-related 1 (Nurr1) protein, a transcription factor, is strongly   duced with the plasmids pLPCX or pLPC-NURR1 were main-
upregulated.                                                         tained in the same culture condition. Cells from the mouse
   This transcription factor is a member of a family of nuclear      amphotropic retrovirus packaging cell line PA317 were cul-
receptors that are critical for the development and survival of      tured in RPMI 1640 medium with 10% fetal bovine serum.
DA neurons. During the development of DA neurons, Nurr1              All cells were incubated at 37°C with 5% CO2.
expression is induced in early postmitotic DA progenitors
and then maintained during differentiation and in the adult          Retrovirus-mediated gene transfer
brain (Perlmann and Wallen-Mackenzie, 2004). Of interest,            We used an amphotropic replication-incompetent retroviral
in mice lacking the Nurr1 gene, DA neurons fail to differ-           vector to infect target cells, as previously described (Kim et
entiate. In addition, in contrast to wild-type animals, in the       al., 2013). A vector encoding the human NURR1 gene was
knockout mice, DA progenitor cells show no lateral migration         generated using pLPCX to infect the PA317 retrovirus pack-
in the midbrain, fail to innervate the striatal target area, and     aging cells. Cells then were infected with a retrovirus encod-
become apoptotic (Castillo et al., 1998; Saucedo-Cardenas            ing human NURR1 (pLPC-NURR1) or with the control vector
et al., 1998; Zetterstrom et al., 1997). In adult DA neurons,        (pLPCX).
Nurr1 also maintains fiber integrity, and Nurr1 ablation re-
sults in a progressive pathology associated with reduced stri-       Reverse transcription polymerase chain reaction (RT-PCR)
atal DA, impaired motor behaviors, and dystrophic axons and          and Northern blot analysis
dendrites (Kadkhodaei et al., 2013). The early development           Total RNA was extracted from all cells using the RNeasy Mini
of mDA neurons has received much attention in recent years,          Kit (Qiagen, Germany). Total RNA (2 μg) was subjected to
particularly with regard to morphogenesis, progenitor speci-         reverse transcription with Superscript II reverse transcriptase
fication, mDA differentiation, and neuritogenesis (Andersson         (Invitrogen, USA) according to the manufacturer’s instruc-
et al., 2013; Blakely et al., 2011; Deng et al., 2011; Di Salvio     tions. Amplification reactions were performed with 1/10 vol-
et al., 2010; Inestrosa and Arenas, 2010; Prakash and Wurst,         ume of the reverse-transcribed product in a final volume of
2006; Smits et al., 2006; Theofilopoulos et al., 2013; Van           25 ml using recombinant Taq DNA polymerase (Invitrogen), as
den Heuvel and Pasterkamp, 2008). Little is known, however,          described previously (Kim et al., 2013).
about the downstream targets of Nurr1 that are involved in              For Northern blotting, 20 mg of total RNA was separated
this pathway.                                                        on a 1% formaldehyde-agarose gel and transferred to poly-
   Few reports are available that characterize the gene ex-          vinylidene fluoride membranes (Millipore, USA). Blots were
pression profile of Nurr1 overexpression (Jacobs et al., 2009a;      hybridized with a 1.8-kb BamHI–MluI fragment of the NURR1
Sousa et al., 2007), and no reports focused on human de-             gene labeled with [α-32P]-dCTP (3000 Ci/mmol; Amersham,
velopment are available. The dramatic differences between            USA). X-ray film was exposed for 2 days at –80°C and devel-
mice and humans in brain development—including size,                 oped.
events at specific stages, and structural proportions—likely
reflect meaningful differences in developmental gene expres-         DNA microarray analysis
sion (Bohland et al., 2010; Hawrylycz et al., 2012; La Manno         The GeneChip Human Genome U133 Plus 2.0 Array (Affy-
et al., 2016; Lein et al., 2007; Myers et al., 2015; Ng et al.,      metrix, USA) was used to analyze differential gene expres-
2009). In the absence of human developmental data, gaps in           sion profiles modulated by NURR1 protein expression. Total
understanding of gene expression profiling are likely, given         RNA was extracted according to the manufacturer’s protocol
the limitations of mouse-derived data. Furthermore, the two          (Affymetrix). For extraction of RNA from hNSCs overex-
available reports describe Nurr1 as regulating many genes            pressing NURR1, we harvested the cells within one week of
in the murine mesencephalon MN9D cell line (Jacobs et al.,           puromycin selection after transduction to avoid shutdown
2009b) and in meso-diencephalic dopamine neurons (Sousa              of NURR1 expression. Hybridization to the U133A DNA mi-
et al., 2007). Neither group, however, confirmed whether the         croarray, washing, and scanning were performed according
affected genes are direct targets of Nurr1 regulation. For this      to the manufacturer’s protocol, and expression patterns were
reason, using human neural stem cells (hNSCs), we sought to          compared between samples.
address this gap and identify direct targets of NURR1. Here,            To normalize signals, we divided each probe by the aver-
we show that NURR1 modulates sets of genes implicated in             age value of the chip to avoid differences between different
cell migration, synapse wiring, and postmitotic events.              chips and experiments. NCBI UniGene cluster nomenclature
                                                                     was used to describe uncharacterized sequences. All of the
                                                                     raw microarray data are available from Gene Expression Om-

552 Mol. Cells 2020; 43(6): 551-571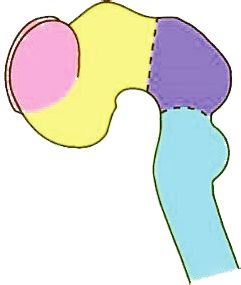
Genome-Wide Analysis of NURR1-Controlled Network in hNSCs
                                                                                                                 Soo Min Kim et al.

nibus (GEO) (series record No. GSE58475). For hierarchical         lined: mNurRE, 5'-GTTCCCTGTTTTTCAAAAACAGGTCAAA-
clustering of the list of differentially expressed genes using     TA-3'. The site-directed mutations were confirmed by se-
Hamming distance correlation, we used software made pub-           quence analysis.
licly available by the lab of Michael Eisen at the University of
California, Berkeley.                                              Electrophoretic mobility shift assay (EMSA)
                                                                   Nuclear extracts from HB1.F3 cells were prepared as de-
Quantitative real-time PCR                                         scribed earlier (Kim et al., 2013). Sense and antisense oligo-
Quantitative real-time RT-PCR assays were carried out using        nucleotides were annealed and then end-labeled with [γ-32P]
gene-specific double-labeled fluorescent probes and sets of        ATP (Amersham) and T4 polynucleotide kinase. Labeled
specific primers in an ABI PRISM 7700 Sequence detection           probes were purified on 19% non-denaturing polyacrylamide
system (PE Applied Biosystems, USA). The primers and probes        gels. The DNA–protein binding reaction was performed in
were obtained for 12 selected genes and the glyceraldehyde         a final volume of 20 μl reaction buffer containing 10 mM
phosphate dehydrogenase (GAPDH ) gene control from                 Tris (pH 7.6), 50 mM NaCl, 0.5 mM dithiothreitol, 0.5 mM
Assays-on-Demand system, which are ready-made and val-             EDTA, 1 mM MgCl2, 5% glycerol, and 250 μg of poly(dI–dC)
idated assays for the human genome (Applied Biosystems).           per milliliter. Nuclear extract (20 μg of protein) was added to
To compensate for differences in cell number and/or RNA            the reaction buffer in the absence or presence of unlabeled
recovery, the copy number of hNSC mRNA was determined              competitor DNA and pre-incubated for 15 min on ice. Radio-
relative to human GAPDH mRNA simultaneously using the              isotope-labeled probes (50,000 cpm) were added, and the
comparative ΔCt method.                                            mixture was incubated for a further 30 min at room tempera-
                                                                   ture. To resolve DNA–protein complexes, electrophoresis was
RNA interference knockdown                                         performed on a 5% non-denaturing polyacrylamide gel. Gels
Four sets of human NURR1 small interfering (si) RNA duplex-        were fixed, dried, and visualized by autoradiography. The oli-
es (19 nucleotides) were purchased from Dharmacon RNA              gonucleotides employed were as follows (only sense strands
Technologies (USA), and used as a cocktail. As a negative          presented):
control, the commercially available control siRNA (Non-spe-        NMU-NurRE, 5'-GTTCCTCACCTTTCAAAGGGAGGTCAAA-
cific Control Duplex IX; Dharmacon RNA Technologies, USA)          TA-3';
was used. Transfection of the siRNAs was performed ac-             NMU-mtNurRE, 5'-GTTCCCTGTTTTTCAAAAACAGGTCAAA-
cording to the manufacturer’s instructions. Briefly, cells were    TA-3'; and
transfected with 100 nM NURR1 siRNA by Lipofectamine Plus          G0S2-NBRE2, 5'-CATCACTGACCTTTGCAATT-3'.
(Invitrogen). Forty-eight hours after transfection, cells were
harvested for real-time PCR analysis.                              Chromatin immunoprecipitation (ChIP)
                                                                   Soluble chromatin from HB.F3 cells was prepared as de-
Cloning of the 5'-flanking region of human NMU and                 scribed previously (Kim et al., 2013) and immunoprecipitated
G0S2 genes and mutagenesis                                         with antibody against NURR1 (TransCruz, sc-991X). Specific
We cloned the 5'-flanking region of the human NMU (neu-            primer pairs were designed to amplify the promoter region
romedin U ) and G0S2 (lymphocyte G0/G1 switch ) genes              of human NMU (forward, 5'-GGCTTAATTCCTAGCTGACGG-
using a PCR-based method of genomic DNA from SH-SY5Y               GT-3'; and reverse, 5'-TCTAACTGGTCTGGAGCGCTGGT-3')
cells. The following sets of primers were designed: forward,       and human G0S2 (forward, 5'-AGTGGGACCTTCGCGT-
NMU p (5'-gggggtaccACATTCCAAGCAGCCTGGTTCA-3')                      GCAC-3'; and reverse, 5'-CCAGCTAATCTTGGGGAGG-
and reverse NMU p (5'-gggaagcttCTCGGCGGCTGCGG-                     GCTC-3') from human genomic DNA. PCR conditions were
GAGGCT-3'); and forward, G0S2 p (5'-gggggtacccatttctgc-            optimized to allow for semiquantitative measurement, and
cagttatcagaggt-3') and reverse, G0S2 p (5'-gggctcgagCTC-           PCR products were visualized on 1% agarose-Tris-acetate
GGCTCTGGGCTCTCGGAG-3'). To facilitate subcloning, the              EDTA gels.
enzyme site (indicated with lowercase letters) was added to
the 5'-end of each primer. The PCR conditions were 25 cycles       Transfection and luciferase reporter assays
at 94°C for 1 min, at 60°C for 45 s, and at 72°C for 3 min.        Transfections were performed using Lipofectamine PLUS
PCR products were directly cloned into a pGEM-T Easy vec-          reagent (Invitrogen) according to the manufacturer’s in-
tor (Promega, USA) and confirmed by sequence analysis. To          structions. A total of 3 mg of DNA was used per transfec-
generate luciferase reporter constructs, each promoter frag-       tion, as previously described (Kim et al., 2013), and briefly
ment (human NMU , 2102 bp; human G0S2 , 2082 bp) was               as follows: 1 to 2 mg of pLPCX or pLPCX-NURR1 , 1 mg of
subcloned upstream of the firefly luciferase reporter gene         reporter vector, and 0.5 μg of the internal control plasmid,
of pGL3-Basic vector (Promega) employing Kpn I/Hind III and        pSV-β-galactosidase (Promega). All transfections were carried
KpnI/XhoI sites.                                                   out three times in triplicate. Promoter activities were deter-
   The QuickChange Mutagenesis kit (Stratagene, USA) was           mined using the Single-Luciferase Reporter Assay System
used to perform site-directed mutagenesis of the NurRE ele-        (Promega). Luciferase activities were normalized based on
ment within the human NMU promoter. The human NMU -                β-galactosidase activity in each well.
luc construct was used as a template. Oligonucleotides with
34 to 36 nucleotides containing the desired point mutations        BioGPS gene expression analyses
were created as follows, with the mutated residues under-          We used the publicly available gene expression atlas at the

                                                                                               Mol. Cells 2020; 43(6): 551-571 553
Genome-Wide Analysis of NURR1-Controlled Network in hNSCs
Soo Min Kim et al.
BioGPS website (http://biogps.org/) (Wu et al., 2016) to de- lated gene expression that is relevant for DA development.
termine whether the identified genes showed tissue-specific To trigger NURR1 overexpression in the hNSC lines, we
expression. The embedded GeneAtlas U133A gcrma gene transduced them with pseudovirus harboring plasmids over-
expression activity chart was used to interrogate gene expres- expressing NURR1 cDNA (pLPCX or pLPC-NURR1 ). To avoid
sion data from 176 human cell types and tissues. In accor- detecting secondary gene expression changes resulting from
dance with previously established stringency thresholds (Pen- downstream effects of a direct NURR1 target, we treated
nings et al., 2011), we considered genes to be tissue-specific cells with puromycin for only one week to select transduced
if (1) they corresponded to a single organ or tissue with an cells and checked the surviving cells for NURR1 expression
expression value > 30 multiples of the median and (2) there (Supplementary Fig. S1A). We used Affymetrix U133 Plus 2.0
was no unrelated tissue with an expression value greater oligonucleotide microarrays to analyze mRNA gene expres-
than one-third of the maximum expression value. sion in RNA extracted from these cells (Supplementary Fig.
S1).
Disease-associated single nucleotide polymorphisms Software made available by the lab of Michael Eisen at
(SNPs) from genome-wide association study (GWAS) data the University of California, Berkeley, was used to filter the
SNPs associated with disease susceptibility at the loci of genes microarray data for each cell line. Of the > 40,000 gene que-
that are direct targets of NURR1 were searched in July 2016 ries, we found 2,437 that were upregulated by NURR1 over-
from the previously identified variants of GWAS datasets expression (617 in F3, 1,580 in A4, and 240 in F5 cells) and
from different chip platforms. Because the GWAS database 1,399 that were downregulated (214 in F3, 865 in A4, and
is a mixture of disease- and trait-associated SNPs from many 320 in F5 cells). The expression profiling data of three hNSC
different sources, we selected SNPs linked to conditions such lines with NURR1 overexpression have been submitted to the
as schizophrenia, bipolar disorder, depression, and Parkin- GEO (accession No. GSE58475).
son’s disease. The URL for data presented here is GWASdb In comparing the three cell lines, we found that genes
(GWASdb v2; http://jjwanglab.org/gwasdb) (Li et al., 2016b). showing regulation in a coordinated manner (i.e., in all three
lines and in the same direction) were not highly represented.
Statistics For example, we found no genes among any of the three cell
Data analysis was performed using GraphPad Prism5 (Graph- lines that were within 30 orders of the greatest magnitude
Pad Software, USA). Comparisons between 2 groups were of change by NURR1. We inferred from this outcome that
analyzed using a two-tailed unpaired Student’s t- test. Com- NURR1 may modulate many genes indirectly rather than di-
parisons between multiple groups were analyzed using one- rectly (Supplementary Fig. S1B).
way ANOVA with Benjamini & Hochberg’s method. Statistical
significance was defined as a P value of less than 0.05. Levels Direct targets of NURR1 in hNSC lines
of significance were indicated as *P < 0.05, **P < 0.01, and For an understanding of the logic of NURR1-dependent neu-
***P < 0.001. rogenesis, the newly identified downstream genes must be
placed within an underlying regulatory hierarchy. The tran-
RESULTS scription factor Nurr1 is characterized by binding as a mono-
mer to the NBRE sequence motif, as a heterodimer with ret-
Profiling NURR1-regulated gene expression by microarray inoid X receptor (RXR) to DR5, or as a dimer to NurRE (Perl-
in hNSCs mann and Jansson, 1995). To filter genes that NURR1 targets
Loss of Nurr1 resulted in ventral mDA agenesis (Zetterstrom directly, based on the presence of NURR1 consensus binding
et al., 1997). Despite the many approaches that have been sites, we searched promoter sequences (retrieved from the
used to identify Nurr1 target genes in rodents (Jacobs et al., University of California, Santa Cruz at http://genome.ucsc.
2009a; Sousa et al., 2007), the full range of Nurr1 target edu/cgi-bin/hgTables) within 3 kb of the transcriptional start
genes is unlikely to have been identified. In particular, NURR1 site (TSS) for NURR1 binding elements with no more than
targets have not been systematically studied in DA neurogen- one base pair difference compared to the consensus sites
esis through human embryo stages, despite the requirement (Fig. 1A). Of the putative NURR1 direct targets, using the
for Nurr1 during this time for specification of ventral mDA Eisen lab software, we detected 187 sequences represent-
neurons. Thus, to identify additional NURR1 targets in human ing 180 genes, based on their NCBI UniGene designations,
systems, we performed microarray expression profiling of that were predicted to modulated by NURR1 overexpression
three hNSC lines overexpressing NURR1 (Fig. 1A). (Supplementary Table S2). A hierarchical cluster diagram is
These cell lines—HB1.F3, HB1.A4, and HB1.F5—represent shown in Fig. 1C, and Venn diagrams depicting the number
separately isolated clones from primary human mesenceph- of genes commonly and differentially up- or downregulated
alon tissues immortalized with the v-myc gene (Kim, 2004; in the three hNSC lines are shown in Figs. 2A and 2B.
Kim et al., 2002) and express several markers, including nes- Based on the functions of the genes assigned by the Eisen lab
tin (Fig. 1B). In addition, microarray data showed that these software, NURR1 direct target genes were classified into cat-
cell lines highly express genes such as ALDH2 , TNC , Nestin , egories (Fig. 1D). The classes of genes represented included
and FOXA2 that are associated with DA progenitors, involved nervous system development, cytoskeletal components, cell
in DA differentiation, or characterize mature phenotypes adhesion, DNA replication, regulation of progression through
(Supplementary Table S1). Based on these data, we deter- the cell cycle, transcription, and protein folding and secretion.
mined to use the human NSC lines to investigate NURR1-re- In addition, we derived several important observations from
554 Mol. Cells 2020; 43(6): 551-571Genome-Wide Analysis of NURR1-Controlled Network in hNSCs
Soo Min Kim et al.
A
Screen of Nurr1
Infection Selection Microarray 1¶¶ Analysis 2¶¶ Analysis
direct targets
Genes modulated Analysis of genes
hNSCs Purification of RNAs regulated in a
NURR1+ NURR1 direct targets: by NURR1
overexpression coordinated manner in
F3 3 hNSC lines
of Nurr1 direct targets
A4
Of 30,000 genes
F5 on UCSC genome
Vector bioinformatics
+ NURR1- NURR1+ Up
Down
-3 Kb NURR1
Affymetrix NBRE ORF
U133 Plus 2.0
Retroviral NURR1 or Puromycin oligonucleotide Nurr1
G
-3kb
empty vector for 1 week microarrays ORF
180 screen genes 23:up / 15:down
B C
NURR1
F3 A4 F5
-3kb
NBRE Nu
NBRE, NurRE
urRE
urRE
or DR5 Genes
Nestin
Early ABCG2
CNS
Otx2
Mes Wnt1
NF-L
Neu NF-M
NF-H
Ast GFAP
DA TH
neu AADC
GAPDH
D
Fig. 1. Genome-wide screen for direct NURR1 targets. (A) Schematics for identification of direct NURR1 target genes. (B) Semi-
quantitative RT-PCR analysis of the early CNS, mesencephalic, neuronal, astrocyte, and DA markers in the three hNSC lines used in this
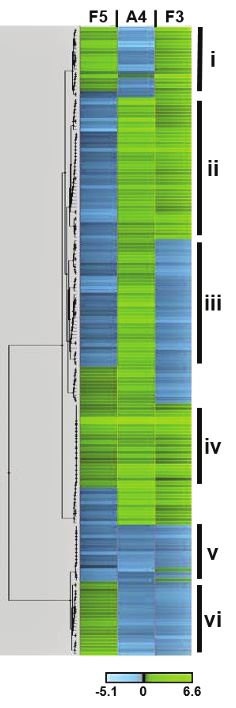
study. (C) Comparison of NURR1-modulated transcript expression patterns among cell lines using the Eisen lab hierarchical cluster analysis
software. The cluster contained 180 genes that were up- or downregulated in the three cell lines and contained NURR1-binding site(s)
in their promoter. The dendrogram on the left shows different clusters of genes segregated according to the pattern of regulation in the
three cell lines. (D) Functional classification of direct NURR1 target genes, obtained using software from the Eisen lab.
Mol. Cells 2020; 43(6): 551-571 555Genome-Wide Analysis of NURR1-Controlled Network in hNSCs
Soo Min Kim et al.
A 101 genes
B 86 genes
in F3 in F3
4 11
18 53 38 22
23 15
22 11 38 53 4 18
77 genes 128 genes 110 genes 59 genes
in F5 in A4 in F5 in A4
C D
F5
C9orf16 ̻G
PHLDA1
PITPNC1 ඖG
CNN1
TSTA3
BMCC1
LRRC17
MSX1
CaMKIIN
GLS
NMU GږG
MYLK
BAALC
INA
MPP4
LTBP2
NT5E
WNT5A
NAV3
FLRT2
IFITM1
EPHA3
HRASLS3
DSP
GREM1
G G0S2
LITAF
LRP8
UGCG
PDAP1
ANXA6
GPC4
PLCE1
NNMT
COL5A2
SEL1L3
EPHX1
NNMT
TENS1
RGC32
-5.0 -2.5 0.0 2.5 5.0
A4
NMU GږG
S100A4
CYFIP2
LRRC17
IRS1
FAM8A1
C14orf159
TPD52L1
CPE
COL3A1
FZD7
CHI3L1
LTBP3
C9orf16 ̻G
ඖG
CNN1
IF
PTN
ACTA2
BMCC1
NELL2
GREM1
ODZ2
TNFRSF12A
DTL
S100A2
HSPC171
DSP
MCM10
DSCR1
G G0S2
ASF1B
CAV2
NF2
DOK1
STAC
UPP1
IVNS1ABP
SLC3A2
HDHD1A
LRP8
-5.0 -2.5 0.0 2.5 5.0
F3
DPYSL3
SEMA5A
TPD52L1
LTBP3
TSTA3
NRN1
MSX1
BAALC
CPE
CaMKIIN
PTP4A3
PTN
COL3A1
LUM
NMU GږG
C9orf16 ̻G ඖG
CNN1
SCG2
NELL2
FLRT2
SOX9
PRR16
G G0S2
TRIB3
S100A2
SREBF1
PHGDH
TENS1
EPHX1
PLCE1
SLC3A2
NF2
DSCR1
DOK1
COL5A2
KDELR2
TPM1
CD9
QKI
NNMT
-5.0 -2.5 0.0 2.5 5.0
Gene Expression Changes
Fold Difference (Log2 Transformed)
Fig. 2. NURR1 overexpression in hNSCs identifies novel NURR1 direct target genes. (A and B) Venn diagram showing the shared
and unique genes upregulated (A) and downregulated (B) by NURR1 in three hNSC lines. (C) Heatmaps showing subclasses of genes
coordinately regulated by NURR1 in three hNSC lines (derived from Fig. 1C); upper panel, genes upregulated by NURR1 in all three cell
lines (23 genes); lower panel, genes downregulated by NURR1 in all three cell lines (15 genes). (D) The top 20 genes exhibiting the
greatest magnitude of change by NURR1 in each cell line. All of these genes contained NURR1-binding site(s) in the promoter. Four
genes are marked that were commonly ranked within the top 20 in the three cell lines: ● = C9orf16; ▶ = CNN1; ■ = NMU; ∇ = G0S2.
All genes or expressed sequence tags were identified by the significance analysis of microarrays algorithm as being statistically significant.
For all cell lines, the false discovery rate was set at 10%.
556 Mol. Cells 2020; 43(6): 551-571Genome-Wide Analysis of NURR1-Controlled Network in hNSCs
Soo Min Kim et al.
this analysis. A significant proportion of the 180 differentially 10 genes, including sushi repeat containing protein X-linked
expressed genes were regulated in the same (coordinated) 2 (SRPX2 ), localize in the synapse, primarily in postsynaptic
manner among the three hNSC lines, indicating transcription- elements (Table 1) (Sia et al., 2013; Soteros et al., 2018). In
al modulation that was independent of cell context (Fig. 1C, addition, fibronectin leucine-rich transmembrane protein
groups iv and v; Fig. 2C). Our microarray data also showed 2 (FLRT2 ) was the most upregulated gene (3.5-fold) in the
that several uncharacterized NURR1 targets, including chro- microarray data set for both HB1.F3 and HB1.F5 cells (Fig.
mosome 9 open reading frame 16 (C9orf16 ; highlighted in 2D). Four genes, including FLRT2 , regulate radial migration of
blue in Fig. 2D), are modulated in hNSC lines. Thus, NURR1 pyramidal neurons and their tangential spread during embry-
appears to modulate a number of characterized and unchar- onic brain development (Table 1) (Seiradake et al., 2014; Ya-
acterized genes, acting both as an activator and a repressor. magishi et al., 2011). Of interest, C9orf16, the only unchar-
acterized gene, may function in synapse formation through
Genes regulated in a coordinated manner in all 3 lines trafficking of neurotransmitter-containing vesicles, based on
Next, to obtain a more restricted list of unambiguously regu- its interaction with proteins in high-throughput proteomics
lated genes, we applied two stronger filters based on coordi- analyses (UniProt site) (Huttlin et al., 2015; Marley and von
nated regulation of expression among the three cell lines (Fig. Zastrow, 2010).
2). First, we considered for further validation and quantitative Moreover, nine genes were implicated in DNA replication
analysis only those genes regulated in the same direction in and cell cycle categories. Eight of these were from a group
all three NURR1-overexpressing hNSC lines (shown in Fig. 2C, of 15 downregulated genes (~53%) that were overrepre-
Supplementary Tables S3 and S4). Of this group, 23 genes, sented among the coordinated NURR1-downregulated gene
including H2A.W histone (HIST3H2A ), were upregulated, sets in the three cell lines. These results implicate NURR1 in
and 15 genes, including UDP-glucose ceramide glucosyltrans- cell cycle exit and in establishing post-mitotic DA neuroblasts
ferase (UGCG), were downregulated in all three lines. Almost during brain development (Table 2). In addition, nuclear and
all genes that were downregulated or upregulated in this mitochondrially encoded genes, G0S2 and mitochondrially
coordinated manner showed a strong association with neu- encoded NADH dehydrogenase 3 (MTND3 ), are modulated
ronal function, indicating a high stringency of our microarray by NURR1 to increase oxidative phosphorylation (Lee et al.,
data (Tables 1-3). 2015; Yamada et al., 2013). mDA neurons are highly ener-
As a second step, we identified genes showing the great- gy-demanding and have high requirements for ATP-gener-
est degree of change with NURR1 overexpression in each cell ating oxidative phosphorylation. Our findings suggest that
line (Fig. 2D). Upregulated genes that were within the 20th NURR1 is an important transcription factor for sustaining this
order of the greatest degree of change in all three lines were distinguishing trait of DA neurons, consistent with previous
NMU, calponin 1 (CNN1), and C9orf16. The downregulated results (Kadkhodaei et al., 2013). In this set of coordinated
gene that met this criterion was G0S2. downregulated genes, we also detected leucine rich repeat
containing 17 (LRRC17 ), UGCG , desmoplakin (DSP ), and
Gene ontology (GO) and pathways of coordinately regu- QKI, KH domain containing RNA binding (QKI ), all of which
lated genes occur in non-neuronal lineage differentiation categories, sug-
Because CNS development is still being investigated and nov- gesting that NURR1 inhibits differentiation into non-neuronal
el functions and genes are always being added in this area, lineages (Table 3).
the GO analysis does not include the most recently published
results. To identify in detail the function of each gene show- Validation of NURR1 direct targets identified by microar-
ing coordinated expression, we searched the possible func- ray analysis
tions of each candidate using UniProt (http://www.uniprot. Of the 38 genes that were modulated in the same direction
org/), BioGPS, the Human Protein Atlas (http://www.pro- in the three hNSC lines (Fig. 2B, Supplementary Tables S3 and
teinatlas.org/), Eukaryotic Linear Motif analysis, and PubMed. S4), 10 genes were chosen for validation by real time RT-PCR
The results point to some striking features. In Tables 1-3, we (Fig. 3). We selected eight genes involved in nervous system
present a detailed listing of these findings according to gene development: BAALC binder of MAP3K1 and KLF4 (BAALC )
groups and pathways. (Wang et al., 2005), calcium/calmodulin dependent pro-
Overall, the analyses identified distinct categories of genes tein kinase II inhibitor 1 (CAMK2N1 ) (Lucchesi et al., 2011;
modulated by NURR1 in hNSCs, although they are not the Saha et al., 2006), myosin light chain kinase (MYLK ) (Li et
well-known DA neuronal markers such as tyrosine hydroxy- al., 2016a), NMU (Kasper et al., 2016), C9orf16 (Huttlin et
lase (TH) and dopamine transporter (DAT). Among the gene al., 2015; Marley and von Zastrow, 2010), prune homolog
sets showing coordinated upregulation by NURR1 in all three 2 with BCH domain (BMCC1 ) (Arama et al., 2012), FLRT2
cell lines, we found a marked enrichment of synapse forma- (Seiradake et al., 2014; Yamagishi et al., 2011), and CNN1
tion-associated dendritic morphogenesis categories as well (Blunk et al., 2014; Liu and Jin, 2016; Rami et al., 2006). The
as morphogenic movements of neuronal precursors during other two included genes, protein regulator of cytokinesis
brain development, suggesting the importance of NURR1 in 1 (PRC1 ) (Polak et al., 2017) and G0S2 (Lee et al., 2015;
new synaptic formation and brain morphological develop- Yamada et al., 2013), are involved in regulation of the cell
ment. Of the set of 38 genes included in this analysis, 13 of cycle and in oxidative phosphorylation. Among the genes on
23 upregulated genes (~56%) showed this enrichment, as this list, NMU, CNN1, C9orf16, and G0S2 were in the top 20
did 1 of 15 downregulated genes (Table 1). Of this group, showing the greatest degree of change in all three lines. In
Mol. Cells 2020; 43(6): 551-571 557Table 1. Genes associated with synapse formation, neuronal morphogenesis and cell migration during brain development
Gene symbol GenBank ID Cellular localization GO function Fold change P value Reference
Soo Min Kim et al.
Synapse formation
SRPX2 NM_014467 Secreted, synapse, focal Positive regulation of synapse assembly 0.5 0.7 0.6 0.000692 Excitatory synapse (Sia et al., 2013;
adhesion Soteros et al., 2018)
CYFIP2 AL161999 Ddendrites, synaptosome Interaction with FMRP, a role in local pro- 0.5 1.6 0.6 0.000244 (Han et al., 2015)
tein translation at neuronal dendrites
558 Mol. Cells 2020; 43(6): 551-571
and in dendritic spine maturation, to ini-
tiate actin polymerization and branching
LTBP3 NM_021070 Extracellular region Secretion, correct folding, and matrix 0.6 2.2 1.0 0.001709 Inbibiroty synapse (Dobolyi & Palkovits,
Midbrain deposition of TGF-b2 formation (TGFb1, 2008)
Regulation of extracellular activation of CaMKII)
TGF-b2
Induction of midbrain DA neurons
BAALC NM_024812 Postsynaptic lipid rafts Synaptogenesis at postsynaptic lipid rafts 1.3 1.0 1.1 0.000692 Inbibiroty synapse (Wang et al., 2005)
Genome-Wide Analysis of NURR1-Controlled Network in hNSCs
by interacting with CAMK2A formation (TGFb1,
(Isoforms 2, 6: brain development) CaMKII)
CAMK2N1 NM_018584 Sypaptosome/postsynaptic Potent and specific inhibitor of CAMK2 1.0 0.9 1.2 0.001994 Excitatory synapse (Lucchesi et al., 2011;
cell membrane (nervous Saha et al., 2006)
system)
C9orf16 NM_024112 Lysosome, endosome Synpase formation, transmission with in- 0.5 2.3 1.6 0.000244 Coiled coil, unchar- (Marley & von Zastrow,
teraction with Dysbindin-D2Ra acterized protein 2010)
Post-endocytic sorting into lysosomea families
Neuronal morphogenesis
CNN1 NM_001299 Post-synaptic elements Modulation of morphological structure of 0.6 2.4 1.6 0.001221 Interaction: part of (Blunk et al., 2014;
(cytoskeleton or focal cytoskeleton in postsynpatic areas cGMP kinase signal- Liu & Jin, 2016;
adhesion) Neuronal and glial plasticity ing complex at least Rami et al., 2006)
Growth cones in develop- composed of ACTA2,
ing brain CNN1, PLN, PRKG1
and ITPR1
ACTA2 NM_001613 Actin cytoskeleton Cytoskeleton organization 0.5 3.2 0.4 0.000244 Interaction with CamkII (D'Arco et al., 2018)
MYLK NM_005965 Lamellipodium, stress Actin filament organization 1.2 0.7 0.8 0.000244 (Li et al., 2016a)
fiber, focal adhesion Positive regulation of cell migration
Growth initiation of astrocytic processes
and in transmitter release at synapses
BMCC1/PRUNE2 AB002365 Cytoplasm BMCC1s (brain-isoform): cell morphology 0.8 3.2 0.8 0.000529 (Arama et al., 2012)
CNS Neurite outgrowthTable 1. Continued
Gene symbol GenBank ID Cellular localization GO function Fold change P value Reference
Cell migration and positioning during embryonic development
DPYSL3 NM_001387 F-actin, cell projection, For signaling by class 3 semaphorins and 0.5 1.0 0.9 0.000244 Convergent extension (Tan et al., 2015)
growth cone, lamellipo- subsequent remodeling of the cytoskele- movement and cor-
dium ton rect positioning
Strong expression in fetal Axon extension and guidance
brain & spinal cord Positive regulator of convergent extension
movement and correct positioning of
certain type neurons during zebrafish
neurulation
IVNS1ABP NM_006469 Cytoplasm, cytoskeleton, Negative regulator of cell migration –0.3 –0.7 –0.5 0.000244 Convergent extension (Perconti et al., 2007)
nucleoplasm Negative regulator of convergent exten- movement and cor-
sion in neurulation during embryonic rect positioning
development
FLRT2 NM_013231 Integral component of Axon guidance/cell adhesion/regulation of 1.9 0.3 3.5 0.00293 Radial migration of (Seiradake et al., 2014;
plasma membrane neuron migraion pyramidal neurons as Yamagishi et al.,
Regulation of radial migration of neurons well as their tangen- 2011)
as well as their tangential spread tial spread
NMU NM_006681 Terminal bouton Positive regulator of cell migration, inva- 1.2 1.5 1.6 0.001831 Cell migration (Kasper et al., 2016)
Secreted siveness
Positive regulation of synaptic transmission
a
Predicted from interaction binding partners.
Mol. Cells 2020; 43(6): 551-571 559
Soo Min Kim et al.
Genome-Wide Analysis of NURR1-Controlled Network in hNSCsSoo Min Kim et al.
Table 2. Genes associated with DNA replication, cell cycle progression, apoptosis and mitochondrion functions
Gene Cellular
GenBank ID Description GO function Fold change P value Reference
symbol localization
MCM2 NM_004526 Minichromosome maintenance Nucleus, Component of MCM2-7 complex which is –0.4 –0.3 –0.2 0.000244 (Im et al., 2009)
complex component 2 cytoplasm replicative helicase essential for 'once per
560 Mol. Cells 2020; 43(6): 551-571
MCM7 AF279900 Minichromosome maintenance Nucleus, cell cycle' DNA replication initiation and –0.3 –0.5 –0.3 0.000732 (Im et al., 2009)
complex component 7 cytoplasm elongation in eukaryotic cells
MCM10 AB042719 Minichromosome maintenance Nucleus, Acts as a replication initiation factor that –0.1 –1.0 –0.4 0.000732 (Im et al., 2009)
complex component 10 cytoplasm brings together MCM2-7 helicase and DNA
polymerasea/primase complex in order to
initiate DNA replication
PRC1 NM_003981 Protein regulator of cytokinesis Nucleus, Controlling spatiotemporal midzone forma- –0.4 –0.6 –0.4 0.000244 (Polak et al., 2017)
1 cytoplasm, tion and successful cytokinesis
Genome-Wide Analysis of NURR1-Controlled Network in hNSCs
spindle
ASF1B NM_018154 Anti-silencing function 1B Nucleus, Cooperates with chromatin assembly factor –0.3 –0.9 –0.4 0.001221 (Jiangqiao et al., 2019)
histone chaperone nuclear 1 to promote replication dependent-chro-
chromatin matin assembly
PDAP1 NM_014891 PDGFA associated protein 1 Enhances PDGFA-stimulated cell growth –0.9 –0.3 –0.3 0.000244 (Sharma et al., 2016)
DTL AK001261 Denticleless E3 ubiquitin pro- Nuclear matrix Decrese G2-arrest, p53 and p21 induction, –0.5 –1.3 –0.4 0.000244 (Cui et al., 2019)
tein ligase homolog and enhance cell proliferation
PFDN5 NM_002624 Prefoldin5/MM-1 Nucleus, Inhibition of cell growth through repression 0.4 0.6 0.3 0.000244 (Kadoyama et al., 2019)
cytoplasm of c-Myc activity
Prefoldin Inhibition of huntingtin/a-synuclein aggrega-
complex tion
Necessary for proper folding of nascent
proteins, in particular, tubulin and actin
G0S2 NM_015714 G0/G1 switch 2 Mitochondrion Negative regulator of oxidative phosphoryla- –1.1 –0.9 –1.2 0.002889 (Lee et al., 2015;
tion Yamada et al., 2013)
Cell cycle switch from G0 to G1 phase
Promotes apoptosis by binding to BCL2
MTND3 NM_173710 Mitochondrially encoded Mitochondrial Mitochondrial electron transport 0.3 0.9 0.4 0.000244 (Fu et al., 2019)
NADH dehydrogenase 3 inner membraneGenome-Wide Analysis of NURR1-Controlled Network in hNSCs
Soo Min Kim et al.
Table 3. Genes associated with differentiation into non-neuronal lineages
Gene GenBank
Cellular localization GO function Fold change P value Reference
symbol ID
UGCG NM_003358 Membrane of Myelin formation –0.9 –0.3 -0.5 0.000244 (Watanabe et al.,
Golgi apparatus 2010)
DSP NM_004415 Desmosome/adher- Epidermis development –1.4 –1.1 –0.6 0.000244 (Bharathan &
ens junction Dickinson, 2019)
QKI AF142421 Cytoplasm, nucleus Regulator of oligodendrocyte –0.5 –0.4 –0.7 0.000244 (Irie et al., 2016)
differentiation and maturation
in the brain
LRRC17 NM_005824 Extacellular space Negative regulation of osteoclast 0.8 1.6 0.8 0.000244 (Kim et al., 2009)
differentiation
all cases, we used real-time RT-PCR to confirm the direction 2004) program to identify evolutionarily conserved regions
of change in expression indicated by microarray (Figs. 3A- in the upstream sequences of the TSSs of human NMU and
3C). In some cases, the array data suggested that NURR1 G0S2 that were upregulated or downregulated in the same
could modulate the same gene in opposite directions in dif- direction in three cell lines (Fig. 5A). As noted above, NURR1
ferent hNSC lines. Of these genes, we chose three for further can bind as a monomer, a heterodimer, or dimer depending
analysis. Figure 3D shows real-time PCR data confirming this on the target. Two potential NURR1-binding elements (NBEs)
cell line–based directionality for decorin (DCN ), pleiotrophin were identified in each of the promoters: one NBRE and one
(PTN), and galanin and GMAP prepropeptide (GAL). In 30 of NurRE in the NMU promoter, and two NBREs in the G0S2
39 (~77%) comparisons of gene expression using microarray promoter (Fig. 5A). Alignment of the human, rat, and mouse
and RT-PCR, results with the two methods showed agree- promoters revealed that NurRE in the human NMU promoter
ment regarding the direction of change by cell line (Fig. 3). and NBRE2 in the human G0S2 promoter are perfectly con-
served across all three species.
NURR1 modulates target gene expression in a hNSC-spe- We performed EMSA and a ChIP assay to verify that
cific manner NURR1 is recruited to these sites in in vitro and in vivo (Figs.
To discern which NURR1 target genes identified in this mi- 5B and 5C). EMSA showed that NURR1 could bind evolu-
croarray analysis were involved only in hNSCs, we analyzed tionarily conserved NBEs in both promoters in vitro (Fig. 5B).
NURR1-associated gene expression in another cell type, In addition, competition experiments and supershift assay
human embryonic kidney HEK293 cells (Fig. 4A). In this cell confirmed that NURR1 specifically bound NurRE in the NMU
line, expression of most target genes was not affected by in- promoter and NBRE2 elements in the G0S2 promoter (Fig.
creased levels of NURR1, except for NMU and BAALC, which 5B). For the ChIP assay, HB1.F3 cells overexpressing NURR1
showed 0.71- and –0.85-fold changes, respectively. This were cross-linked to chromatin and immunoprecipitated with
result contrasts with the direction of NURR1-associated gene an antibody against NURR1, followed by PCR using primers
expression change in hNSCs and suggests differential NURR1 corresponding to NurRE or NBRE2. As shown in Fig. 5C,
functions in hNSCs versus HEK293 cells. NURR1 was recruited to the NBEs in both promoters.
To functionally characterize the role of NURR1 in gene ex- To verify whether the predicted binding sites for NURR1
pression, we also inhibited NURR1 using siRNA (Fig. 4B). For are functional, we cloned a 2102-bp fragment of the human
this purpose, we focused on five genes (NMU, BAALC, CAM- genomic sequence upstream of the NMU translation start
K2N1, FLRT2, and CNN1) that showed a consistent direction site into a luciferase reporter plasmid. Transient transfection
of change in expression levels on microarray and with RT-PCR showed that NURR1 overexpression increased transcription
(Fig. 3). Figure 4B demonstrates the successful inhibition of from this promoter by 7.1-, 13.0-, and 3.5-fold in F3, A4,
NURR1 using targeted siRNA compared to cells transfected and F5 cells, respectively (Fig. 5D). To investigate whether the
with control siRNAs. The expression direction of the five evolutionarily conserved NurRE is important for NURR1-de-
genes was reversed in hNSCs expressing diminished levels of pendent activation of the human NMU promoter, we used
NURR1 compared to those overexpressing NURR1 (Fig. 4B). site-directed mutagenesis to introduce point mutations in
These data offer further evidence supporting the results of the promoter that disrupt these sequences. These mutations
the real-time PCR analysis. clearly reduced the ability of NURR1 to activate the promoter
(approximately 66.6%, 56.8%, and 31.3% decreases in F3,
Transactivation of the human NMU and G0S2 promoters A4, and F5 cells, respectively) (Fig. 5E). The NurRE element
by NURR1 thus is essential for NURR1-dependent NMU expression in
We next evaluated whether NURR1 may be involved in tran- hNSCs. We also evaluated the transcriptional regulation of
scriptional regulation of human NMU and G0S2 genes. If the G0S2 promoter by NURR1 (Fig. 5F). A 2082-bp fragment
NURR1 does regulate these genes during embryonic brain of the human G0S2 promoter was cloned into a luciferase re-
development, NURR1 binding elements may be evolutionarily porter plasmid. As shown in Fig. 5F, NURR1 comprehensively
conserved among species. We used the mVista (Frazer et al., repressed human G0S2 promoter activity in all three hNSC
Mol. Cells 2020; 43(6): 551-571 561Genome-Wide Analysis of NURR1-Controlled Network in hNSCs
Soo Min Kim et al.
A D
12
** F3/Array
Fold Change in ExpressionG
10
F3/PCR
8
25 GAL F3 / Array
F3 / PCR
Fold Change in Expression
A4 / Array
6 20 A4 / PCR
F5 / Array
15 F5 / PCR
** ** ** *
4
10
2 5
0
0
-5
-2
-10
-4 * ** * -15
B
-20
10
DCN
Fold Change in ExpressionG
A4/Array 16
8 A4/PCR 14
12
6
10
8
4
6
4
2
2
0 0
-2
-2 -4
-4
10 PTN
C 70
8
60
Fold Change in ExpressionG
50 F5/Array 6
40
30
F5/PCR
4
10
2
8
0
6
-2
4
-4
2
0
-2
-4
Fig. 3. Real-time RT-PCR validation of selected NURR1 gene targets. (A-C) Confirmation of NURR1-regulated genes in HB.F3, HB.FA4,
and HB.F5 cells. RNA was isolated from 3 hNSC lines transduced with empty vector and NURR1-overexpressing hNSC lines, and assayed by
real-time RT-PCR to validate the expression profile of NURR1-regulated transcripts. Gene expression levels were calculated by normalizing
PCR data from vector-transduced and NURR1-overexpressed samples to the GAPDH control gene. Fold up- or downregulation was
calculated using the ratio of normalized PCR values with the –∆∆Ct method and the ratios of NURR1 overexpression/vector only signals
from the microarray data. The left histograms show relative normalized expression from the microarray, and the right histograms show
the relative normalized expression levels per RT-PCR. (D) Quantitative verification of NURR1 target genes with differential expression
among different hNSC lines. Expression of three genes was analyzed using real-time RT-PCR, and fold changes in expression were similar
to those from the array analyses (A-C). Asterisks (*) indicate genes showing agreement in the direction of expression change between
two cell lines and between microarray and RT-PCR. Asterisks (**) indicate genes showing directional agreement among three cell lines
and between microarray and RT-PCR.
lines in a dose-dependent manner. Collectively, the effect of by microarray and RT-PCR.
NURR1 on the promoter-driven reporter activity in the NMU
and G0S2 genes paralleled changes in mRNA levels detected
562 Mol. Cells 2020; 43(6): 551-571Genome-Wide Analysis of NURR1-Controlled Network in hNSCs
Soo Min Kim et al.
A
140
Relative Gene Expression (10 )
-2 120 HEK-Control
HEK-Control
100 HEK-NURR1
HEK-Nurr1
80
15
- +
10 Nurr1
GAPDH
5
0
1
1
K
T
1
lc
2
r1
U
N
TN
2N
C
N
0S
R
YL
M
C
aa
ur
C
N
FL
P
D
N
K
G
N
B
M
C
M
M
B
A
C
B
F3 / NURR1
Fold Change in Expression
50 F3 / siNURR1
A4 / NURR1
A4 / siNURR1
4 F5 / NURR1
F5 / siNURR1
2
0
-2
NMU BAALC CAMK2N1 FLRT2 CNN1 Nurr1
NURR1
-4
Fig. 4. NURR1 regulates target genes in a hNSC-specific manner. (A) NURR1 target expression in a human embryonic kidney cell
line, HEK293 (HEK). Target gene levels were measured by real-time PCR in HEK293 cells overexpressing NURR1. Inset: RT-PCR analysis
of HEK293 cells transfected with pLPCX (–) or pLPCX-NURR1 (+) plasmids. (B) Converse changes of NURR1 target genes in NURR1 -
knockdown hNSC lines. hNSCs were transfected with pLPCX-NURR1 (NURR1 ) or NURR1 siRNA (siNurr1). Target gene levels were
assessed by real-time RT-PCR, and relative gene expression is given as the ratio of GAPDH -normalized values.
Expression of Nurr1 direct target genes from the ventral and 6C). In addition, Camk2n1 and Cnn1 expression became
midbrain of embryonic mice during in vivo mDA differen- evident at E10.5 and was maintained thereafter (Figs. 6B and
tiation 6C). Figure 6D shows a summary of the timing of target gene
To confirm the in vivo expression pattern of these gene sets expression. These results validate our microarray data and
during midbrain development, we performed quantitative indicate that these genes are truly in vivo targets of Nurr1.
PCR analysis of mRNA extracted from the mouse embryonic
ventral midbrain (Fig. 6). Because Nurr1 expression becomes BioGPS analysis: CNS-specific expression of NURR1 direct
evident at E10.5 during mDA cell fate specification (Fig. 6A) target genes
(Perlmann and Wallen-Mackenzie, 2004), we prepared em- To discern which Nurr1 target genes identified in our microar-
bryonic midbrain tissues from E9.5 to E13.5 for RT-PCR anal- ray analysis are biologically relevant, we searched each gene
ysis (Figs. 6B and 6C). We detected an increase in expression on the BioGPS website (http://biogps.org), using the Ge-
of Nmu, C9orf16, dihydropyrimidinase-like 3 (Dpysl3), G0s2, neAtlas U133A gene expression (Wu et al., 2016). The most
and Baalc at successive intervals from E9.5 to E13.5 (Figs. 6B highly represented systems were CNS tissues, and other sys-
Mol. Cells 2020; 43(6): 551-571 563Genome-Wide Analysis of NURR1-Controlled Network in hNSCs
Soo Min Kim et al.
A B Probe hNMU/NurRE M hG0S2
hNMU promoter Comp W M - - NURR1
-2102bp -1911 -1228 NURR1 - + + + + - + + + +
Luc
NBRE NurRE
100%
Mouse
50%
100%
Rat
50%
GGAAGAAGGTCACGGGG TCCTCACCTTTCAAAGGGAGGTCAAAT Human
CCCCTGGCTCCCTGGCG AACCAACCTCTTAACAGGACACTGAGA Mouse
AATGAAACTGCGCGGGA TCCTCACCTTTCAAAGGGAGGTCAAAT Rat
* ** * **** * ** *** *
hG0S2 promoter
-2082bp -1855 -1632
NBRE1 NBRE2
Luc
100%
C -1260 -1066 hNMU exon1
Mouse IP N Nurr1 IgG
50%
100% hNMU
Rat
50% -1671 -1542 hG0S2 exon1
AACCTTGACCATTCTCCA GCATCACTGACCTTTGCAATTT Human
AGCCTGAGCCAATCCCCA GCATCAGTGACCTTTGCAATTT Mouse
IP N Nurr1 IgG
GGCCTTGGCCAACCCCCA GCATCAGTGACCTTTGCAATTT Rat
*** *** ***** ****** *************** hG0S2
D -2102 NBRE NurRE E -2102 NBRE NurRE
Luc hNMU-Luc Luc
Luc
F3 A4 F5
8 15 4
1.2 WT
MT
12 1.0
6 3
Relative LUC activity
Relative LUC activity
0.8
9
4 2 0.6
6
0.4
2 1
3
0.2
0 0 0 0
NURR1 - - - F3 A4 F5
F -2082 NBRE1 NBRE2
Luc hG0S2-Luc
F3 A4 F5
4 1.2 2.0
1.0
Relative LUC activity
3 1.5
0.8
2 0.6 1.0
0.4
1 0.5
0.2
0 0 0
NURR1 - NURR1 - NURR1 -
Fig. 5. Transcriptional regulation of human NMU and G0S2 genes by NURR1. (A) mVista plot of 2-kb regions upstream of the TSS of
human (h) NMU and G0S2 genes. The human genome was used as the base sequence for comparison with mouse and rat genomes.
Peaks in the mVista plot represent conserved regions. Conserved and non-conserved binding sites for NURR1 are indicated in red and
blue, respectively. (B) Sequence-specific binding activities of NURR1 to the conserved NurRE and NBRE2. EMSA was performed with
radiolabeled oligonucleotides containing the NurRE of the human NMU promoter or the NBRE2 of the human G0S2 promoter using
nuclear extracts from HB1.F3 cells overexpressing NURR1. Slow-migrating complexes (arrowheads) were detected in both promoters.
Competitors (a 40- or 80-fold molar excess) or antibody against NURR1 was added to confirm specific NURR1 complexes. The DNA-
binding activities were competed out by addition of unlabeled wild-type oligonucleotide (W), but not with addition of mutated NurRE
(M). (C) ChIP analysis of NURR1 binding to human NMU or G0S2 promoter sequences. ChIP was performed with a NURR1 antibody and
immunoglobulin G (IgG) as control in HB.F3 cells, and quantitative PCR analysis of the promoter sequences, as indicated. IP, input; N, no
antibody added. (D and E) Reporter gene analysis of the human NMU -2102 promoter. Luciferase (LUC) activity assays were performed in
hNSCs transfected with the constructs, as indicated. NURR1 binding sites are shown as gray boxes; gray boxes marked with X represent a
mutation of the NurRE site that abolished the NURR1 binding. To compare NURR1 transactivation activities directly, we set the luciferase
activity of the reporter construct with an empty vector (pLPCX) to 1. (F) Reporter gene analysis of the human G0S2 gene promoter from
–2082 to +1 in 3 hNSC lines. Luciferase assays were performed three times with similar results. The figures represent the mean ± SD (bars),
and data were normalized as in Figs. 5D and 5E. *P < 0.05, **P < 0.01, and ***P < 0.001.
564 Mol. Cells 2020; 43(6): 551-571Genome-Wide Analysis of NURR1-Controlled Network in hNSCs
Soo Min Kim et al.
Aa b c E12.5
Mesencephalon
Specification Nurr1 DAPI
(E9 – E14)
Di
Tel
Lmx1a
Rhomb Th DAPI
Nurr1
B Embryonic VM C
Nurr1 Th
Relative mRNA expression
1.8 1.8
1.6 1.6
9.5 10.5 11.5 12.5 13.5 1.4 1.4
1.2 1.2
Nurr1 1.0 1.0
0.8 0.8
0.6 0.6
0.4 0.4
Th 0.2 0.2
0.0 0.0
9.5 10.5 11.5 12.5 13.5 9.5 10.5 11.5 12.5 13.5
Nmu
Nmu C9orf16
Relative mRNA expression
C9orf16 1.2 1.2
1.0 1.0
0.8 0.8
Dpysl3
0.6 0.6
0.4 0.4
G0s2
0.2 0.2
1-6-8 0.0 0.0
Baalc 9.5 10.5 11.5 12.5 13.5 9.5 10.5 11.5 12.5 13.5
1-8
Dpysl3 G0s2
Relative mRNA expression
Camk2n1 1.2 1.2
1.0 1.0
Cnn1 0.8 0.8
0.6 0.6
Flrt2 0.4 0.4
0.2 0.2
Gapdh 0.0 0.0
9.5 10.5 11.5 12.5 13.5 9.5 10.5 11.5 12.5 13.5
Baalc Camk2n1
Relative mRNA expression
1.2 1.2
D E9.5 E10.5 E11.5 E12.5 E13.5
1.0
0.8
1.0
0.8
0.6 0.6
Nurr1
0.4 0.4
Th 0.2 0.2
Nmu 0.0 0.0
C9orf16 9.5 10.5 11.5 12.5 13.5 9.5 10.5 11.5 12.5 13.5
Dpysl3 Cnn1 Flrt2
Relative mRNA expression
1.2 1.2
G0s2
1.0 1.0
Baalc 0.8 0.8
Camk2n1 0.6 0.6
Cnn1 0.4 0.4
Flrt2 0.2 0.2
0.0 0.0
9.5 10.5 11.5 12.5 13.5 9.5 10.5 11.5 12.5 13.5
Fig. 6. Expression of Nurr1 target genes in embryonic midbrain tissues. (A-a) Schematic illustrating mouse brains ranging from E9.5 to
E13.5. The red line marks the plane of section shown in immunocytochemistry. (A-b) Specification of the mDA neuronal identity within
the ventral midline (VM). (A-c) Immunohistochemical analysis of Nurr1 and TH expression in midbrain sections from E12.5 mice. (B and
C) Representative RT-PCR analysis for Nurr1 target genes from embryonic midbrain tissues during mDA neuron development. DAPI,
4’,6-diamidino-2-phenylindole. (D) The timing of expression of Nurr1 direct target genes in the midbrain of mice at E9.5 to E13.5. Tel,
telencephalon; Di, diencephalon; Rhomb, rhombencephalon.
Mol. Cells 2020; 43(6): 551-571 565Genome-Wide Analysis of NURR1-Controlled Network in hNSCs
Soo Min Kim et al.
tems did not show a significant percentage of tissue-specific on the loci of NURR1 direct target genes from the previously
genes. As indicated in Table 4, 12 transcripts (31.6%) exhibit- identified variants of GWAS datasets derived using different
ed ≥ 1.5 fold increased expression in the CNS or fetal brain as chip platforms (Li et al., 2012; 2016b).
compared to the mean expression values of all human tissues About half of the up- and downregulated targets showed
in the datasets. The gene symbols and CNS and fetal brain associations with these diseases (Supplementary Table S6). Of
enrichment for these 12 genes are provided in Table 4, and these targets, we identified 11 SNPs with Parkinson’s disease
additional details on the microarray probe ID and CNS versus susceptibilities at seven independent loci: rs1385331 (chr 3)
average human expression levels are given in Supplementary for phosphatidylinositol-glycan biosynthesis class X (PIGX );
Table S5. Of these 12 genes, three (BAALC , CAMKIIN1 , and rs10056132 (chr 5) and rs10041339 (chr 5) for DPYSL3 ;
QKI ) were highly expressed, with an expression value >30 rs4874150 (chr 8) for tissue specific transplantation antigen
multiples of the median in the brain/CNS, in accordance with P35B (TSTA3); rs2453998 (chr 8) for BAALC; rs3003602 (chr
previously established stringency thresholds (Pennings et al., 9) and rs2502731 (chr 9) for C9orf16 ; rs1011711 (chr 9)
2011). The other dominant genes were DPYSL3 and FLRT2 , for PRUNE ; and rs5966709 (chr X), rs4828037 (chr X), and
both of which were specifically expressed in fetal brains. rs932437 (chr X) for SRPX2 (Table 5). All of the variations
were found in non-coding DNA within ~50 kb of NURR1 tar-
GWAS of NURR1 direct target genes get genes. Because a non-coding DNA sequence at the loci
NURR1 is a Parkinson’s disease susceptibility gene because of direct target genes may encode information guiding the
it is a key factor in the neurodevelopmental control of DA proper level, time, and place of gene expression during DA
neurons in the substantia nigra pars compacta and ventral neurogenesis (Lee et al., 2020), we searched the genomic
tegmental area. In addition, NURR1 mutations are associated region for each variant associated with Parkinson’s disease,
with both schizophrenia and bipolar disorder (Buervenich et and annotated this region for sequence conservation and
al., 2000; Vuillermot et al., 2011; Xing et al., 2006). Consider- candidate enhancers based on H3K4me1 and H3K27ac his-
ing a possible role for NURR1 direct target genes in DA neu- tone modifications and DNase hypersensitive sites (Fig. 7). Of
rogenesis, we hypothesized that genetic alterations within 11 SNPs with Parkinson’s disease susceptibilities, two varia-
the loci of these genes (including non-coding DNA sequences tions in the C9orf16 locus (rs3003602 and rs2502731), two
and regulatory elements) may be associated with susceptibil- in DPYSL3 (rs10056132 and rs10041339), one in BAALC
ity to schizophrenia, bipolar disorder, and depression, as well (rs2453998), and one in PIGX (rs2453998) directly over-
as Parkinson’s disease. For this reason, we searched for SNPs lapped with a H3K4me1 and a H3K27ac marker of regulato-
associated with susceptibilities to these conditions, focusing ry element sequences (candidate enhancer). These variants
Table 4. BioGPS gene expression analysis of Nurr1 direct target genes
Gene CNS-enriched FB-enriched
Gene name CNS expression
symbol (fold change) (fold change)
Upregulated genes
Calcium/calmodulin dependent protein CAMK2N1 69.63a 56.92 Prefrontal cortex, amygdala, whole
kinase II inhibitor I brain
Brain and acute leukemia, cytoplasmic BAALC 48.25a 40.16 Spinal cord, hypothalamus, amygdala,
prefrontal cortex, whole brain
Dihydropyrimidinase-related protein 3 DPYSL3 18.65 156.10b Fetal brain
Protein prune homolog 2 Prune2/BMCC1 22.01 3.03c Prefrontal cortex, hypothalamus
Fibronectin leucine rich transmembrane FLRT2 7.32 25.27b Fetal brain, prefrontal cortex
protein 2
Cytoplasmic FMR1 interacting protein CYFIP2 10.02 5.20 Amygdala, prefrontal cortex, pineal
Chromosome 9 open reading frame 16 C9orf16 2.03 2.91 Whole brain (6.5×), temporal lobe
(5×), amygdala, prefrontal cortex,
fetal brain (3-4×)
Latent transforming growth factor beta LTBP3 3.67 0.99 Retina, pineal
binding protein 3
Prefoldin 5 PFDN5 1.20 1.63 Pineal, fetal brain
Histone 3, H2a HIST3H2A 1.25 2.05 Cerebellum peduncles, cerebellum,
fetal brain
Downregulated genes
Quaking homolog, KH domain RNA binding QKI 38.96a 15.84c Spinal cord, hypothalamus, prefrontal
(mouse) cortex
Influenza virus NS1A binding protein IVNS1ABP 2.00 9.12b Fetal brain
Genes are associated with CNS-specific expression > 30MoMs in BioGPS.
a
Genes are expressed with the bhighest or the clowest level in the fetal brain of CNS tissues.
566 Mol. Cells 2020; 43(6): 551-571You can also read