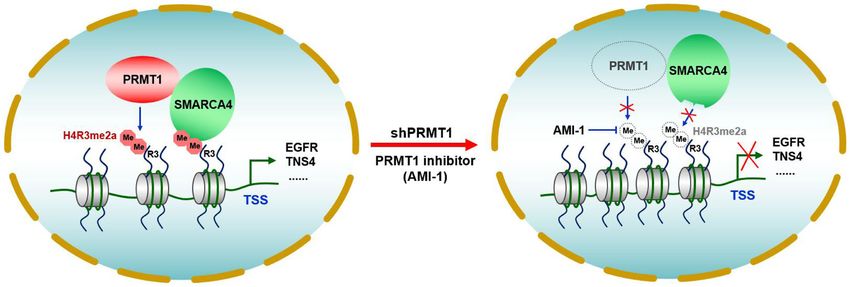
PRMT1-mediated H4R3me2a recruits SMAR CA4 to promote colorectal cancer progression by enhancing EGFR signaling
←
→
Page content transcription
If your browser does not render page correctly, please read the page content below
Yao et al. Genome Medicine      (2021) 13:58
https://doi.org/10.1186/s13073-021-00871-5

 RESEARCH                                                                                                                                            Open Access

PRMT1-mediated H4R3me2a recruits SMAR
CA4 to promote colorectal cancer
progression by enhancing EGFR signaling
Bing Yao1,2†, Tao Gui1†, Xiangwei Zeng1, Yexuan Deng1, Zhi Wang1, Ying Wang1, Dongjun Yang1, Qixiang Li1,
Peipei Xu1, Ruifeng Hu1, Xinyu Li1, Bing Chen1, Jin Wang1, Ke Zen1, Haitao Li3,    Melissa J. Davis 4,
Marco J. Herold , Hua-Feng Pan , Zhi-Wei Jiang , David C. S. Huang , Ming Liu , Junyi Ju1* and Quan Zhao1*
                4               5               5                   4           1*

  Abstract
  Background: Aberrant changes in epigenetic mechanisms such as histone modifications play an important role in
  cancer progression. PRMT1 which triggers asymmetric dimethylation of histone H4 on arginine 3 (H4R3me2a) is
  upregulated in human colorectal cancer (CRC) and is essential for cell proliferation. However, how this dysregulated
  modification might contribute to malignant transitions of CRC remains poorly understood.
  Methods: In this study, we integrated biochemical assays including protein interaction studies and chromatin
  immunoprecipitation (ChIP), cellular analysis including cell viability, proliferation, colony formation, and migration
  assays, clinical sample analysis, microarray experiments, and ChIP-Seq data to investigate the potential genomic
  recognition pattern of H4R3me2s in CRC cells and its effect on CRC progression.
  Results: We show that PRMT1 and SMARCA4, an ATPase subunit of the SWI/SNF chromatin remodeling complex,
  act cooperatively to promote colorectal cancer (CRC) progression. We find that SMARCA4 is a novel effector
  molecule of PRMT1-mediated H4R3me2a. Mechanistically, we show that H4R3me2a directly recruited SMARCA4 to
  promote the proliferative, colony-formative, and migratory abilities of CRC cells by enhancing EGFR signaling. We
  found that EGFR and TNS4 were major direct downstream transcriptional targets of PRMT1 and SMARCA4 in colon
  cells, and acted in a PRMT1 methyltransferase activity-dependent manner to promote CRC cell proliferation. In vivo,
  knockdown or inhibition of PRMT1 profoundly attenuated the growth of CRC cells in the C57BL/6 J-ApcMin/+ CRC
  mice model. Importantly, elevated expression of PRMT1 or SMARCA4 in CRC patients were positively correlated with
  expression of EGFR and TNS4, and CRC patients had shorter overall survival. These findings reveal a critical interplay
  between epigenetic and transcriptional control during CRC progression, suggesting that SMARCA4 is a novel key
  epigenetic modulator of CRC. Our findings thus highlight PRMT1/SMARCA4 inhibition as a potential therapeutic
  intervention strategy for CRC.
  (Continued on next page)

* Correspondence: liuming_nju@163.com; jujunyi@nju.edu.cn;
qzhao@nju.edu.cn
†
 Bing Yao and Tao Gui contributed equally to this work.
1
 The State Key Laboratory of Pharmaceutical Biotechnology, Department of
Hematology, the Affiliated Drum Tower Hospital of Nanjing University
Medical School, China-Australia Institute of Translational Medicine, School of
Life Sciences, Nanjing University, 163 Xianlin Avenue, Nanjing 210023, China
Full list of author information is available at the end of the article

                                         © The Author(s). 2021 Open Access This article is licensed under a Creative Commons Attribution 4.0 International License,
                                         which permits use, sharing, adaptation, distribution and reproduction in any medium or format, as long as you give
                                         appropriate credit to the original author(s) and the source, provide a link to the Creative Commons licence, and indicate if
                                         changes were made. The images or other third party material in this article are included in the article's Creative Commons
                                         licence, unless indicated otherwise in a credit line to the material. If material is not included in the article's Creative Commons
                                         licence and your intended use is not permitted by statutory regulation or exceeds the permitted use, you will need to obtain
                                         permission directly from the copyright holder. To view a copy of this licence, visit http://creativecommons.org/licenses/by/4.0/.
                                         The Creative Commons Public Domain Dedication waiver (http://creativecommons.org/publicdomain/zero/1.0/) applies to the
                                         data made available in this article, unless otherwise stated in a credit line to the data.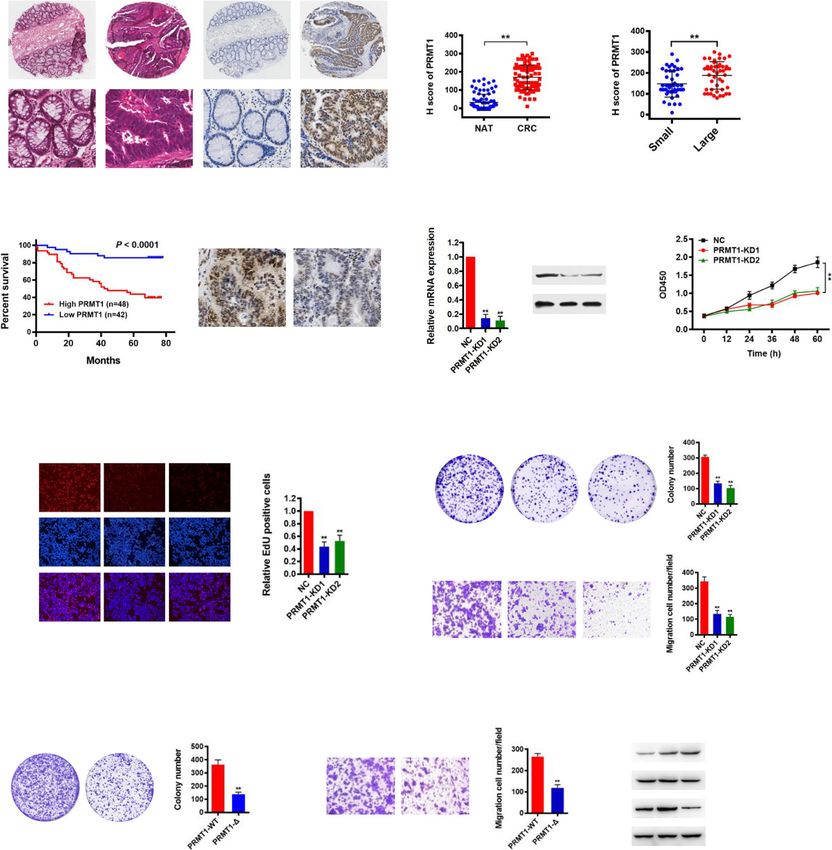
Yao et al. Genome Medicine        (2021) 13:58                                                                  Page 2 of 21

 (Continued from previous page)
 Conclusion: PRMT1-mediated H4R3me2a recruits SMARCA4, which promotes colorectal cancer progression by
 enhancing EGFR signaling.
 Keywords: Transcription, Epigenomics, H4R3me2s, PRMT1, SMARCA4, Colorectal Cancer

Background                                                     development and has been implicated in a variety of bio-
Colorectal cancer (CRC) is the third most commonly diag-       logical processes in both normal and neoplastic tissues
nosed malignancy and the fourth leading cause of cancer-       [17, 18]. Heterozygous loss of SMARCA4 in mice leads to
related deaths in the world; its burden is expected to in-     increased risk of developing cancer including lung and
crease by 60% to more than 2.2 million new cases and 1.1       mammary gland, indicating that it is a tumor-suppressor
million cancer deaths by 2030 [1]. One of the fundamental      gene [18]. In support of this, the loss or mutation of
processes driving the initiation and progression of CRC is     SMARCA4 is associated with human cancers including
the accumulation of a variety of genetic and epigenetic        lung cancer, hepatocellular carcinoma, ovarian cancer,
changes in colon epithelial cells [2]. Over the past decade,   endometrial tumors, and Burkitt’s lymphoma [16, 19–25].
major advances have been made in our understanding of          Other studies, however, have reported a tumor-promoting
cancer epigenetics, particularly regarding epigenetic alter-   role of SMARCA4 [26–28]. Thus, SMARCA4 can be an
ations including aberrant DNA methylation and alter-           oncogene for some cancers or in other contexts.
ations in histone modification states [3–5]. For example,         In the murine small intestinal epithelium, SMARCA4
aberrant hypermethylation has been identified in the pro-      is required for stem cell maintenance [29]. Loss of
moter regions of key tumor-suppressor genes, including         SMARCA4 attenuates Wnt signaling and prevents Wnt-
MLH1, CDKN2A, and APC in the case of CRC; abnormal             dependent tumorigenesis in the murine small intestine
histone methylations, including H4K20me3, H3K4me1/2/           [30]. In addition, duodenal SMARCA4 loss in mice is as-
3, H3K9me3, H3K27me3, and H3K79me2, have been fre-             sociated with dysregulation of the Notch pathway, which
quently found in CRC tumor samples and cell lines [6].         contributes to growth impairment, early death, and ab-
Progress in this field suggests that these epigenetic alter-   normal villous formation [31]. However, a recent study
ations will be commonly used in the near future to direct      showed that SMARCA4 attenuates colonic inflammation
the prevention and treatment of CRC [7].                       and tumorigenesis through autophagy-dependent oxida-
   Protein arginine methyl transferase 1 (PRMT1), a mem-       tive stress sequestration [32]. Thus, discrepancies
ber of the protein arginine methyltransferase family           abound regarding the functions of SMARCA4 with re-
(PRMTs), is the most abundant PRMT in mammals.                 spect to tumor initiation and progression in gut. The
PRMT1 mainly catalyzes asymmetric dimethylation of his-        roles of SMARCA4 in colon also remain unclear.
tone H4 on arginine 3 (H4R3me2a), usually a marker of             Here, we found that PRMT1 and SMARCA4 act co-
transcriptional activation, which has been implicated in       operatively to promote CRC progression. Our data indi-
transcriptional control, pre-mRNA splicing, protein stabil-    cate that SMARCA4 is a novel effector molecule of
ity, DNA damage signaling, and cell fate decisions [8]. To     PRMT1-mediated H4R3me2a. We show that TNS4 and
date, only TDRD3 has been identified as a “reader” of epi-     EGFR are direct downstream targets of PRMT1/
genetic mark H4R3me2a [9]. PRMT1 is also involved in           SMARCA4 mediating activation of EGFR signaling path-
the interaction of many transcription factors and pro-         way in CRC. These findings provide a novel strategy for
moters, and the overexpression and abnormal splicing of        targeting therapy of CRC.
PRMT1 directly affects the occurrence of tumors, includ-
ing breast cancer, lung cancer, bladder cancer, leukemia,      Methods
and colorectal cancer [10–14]. In colorectal cancer, the       Cell lines, transfections, and siRNA interference assays
pathophysiological function of PRMT1 is largely unknown        Two colon carcinoma cell lines (HCT116 and SW620)
although PRMT1 has been examined as a marker of un-            were purchased from the Shanghai Institute of Cell Biol-
favorable prognosis for colon cancer patients [8, 14, 15].     ogy, Chinese Academy of Sciences (Shanghai, China).
   SWI/SNF related matrix-associated actin-dependent           Cells were maintained at 37 °C in a humidified air at-
regulator of chromatin subfamily A member 4 (SMAR              mosphere containing 5% carbon dioxide in McCOY’s 5A
CA4, also known as Brahma-related gene 1, Brg1) is a           medium (HCT116) or RPMI-1640 (SW620) supple-
catalytic subunit of the SWI/SNF complex, which uses           mented with 10% FBS (Invitrogen). The human colon
ATP hydrolysis to provide energy required for the mediat-      cancer cell lines were recently authenticated by Genetic
ing changes in chromosome structure or chromatin re-           Testing Biotechnology Corporation (Suzhou, China)
modeling [16]. SMARCA4 is indispensable for embryonic          using short tandem repeat (STR) profiling. All lines were
Yao et al. Genome Medicine   (2021) 13:58                                                                     Page 3 of 21

found to be negative for mycoplasma contamination.            proteins and peptides were incubated for 5 min and trans-
SiRNA against PRMT1 and SMARCA4 were synthesized              ferred into silicon-treated capillaries. Thermophoresis was
by Jima, China. The sequences used were as follows:           measured for 30 s on a NanoTemper Monolith NT.115
PRMT1 siRNA-1, 5′-CUGAAGUCCAGGUCGAUG                          (NanoTemper Technologies GMBH) using 60% LED
GUGAAGUC-3′; PRMT1 siRNA-2, 5′-UUGUAGUCUU                     power and 20% laser power. Dissociation constants were
UGUACUGCC-3′; SMARCA4 siRNA-1, 5′-UCGCUU                      calculated by NanoTemper Analysis 1.5.41 software using
UGGUUCGCAAAUC-3′; SMARCA4 siRNA-2, 5′-UUC-                    the mass action equation (Kd formula).
CUCCUCAUUCAGGUCC-3′. HCT116 and SW620                           A MicroCal ITC-200 system (Malvern Instruments
cells were transfected with oligonucleotides or the indi-     Ltd.) was used for ITC experiments. Briefly, the synthe-
cated constructs using Lipofectamine 3000 (Invitrogen)        sized peptides (Genscript, Nanjing, China) and proteins
according to the manufacturer’s instructions.                 were all subjected to extensive dialysis against PBS. Pep-
                                                              tides at concentrations of 1 mM were loaded into the
Mass spectrometry                                             ITC syringe, and proteins at concentrations of 100 μM
High-capacity streptavidin agarose (Thermo Scientific)        were loaded into the ITC cell. Then, 19 injections of 2 μl
was incubated with C-terminal biotin-tagged 20 amino          peptide each were automatically made into the cell at
acid N-terminal peptides of H4, H4R3me2a, and                 25 °C. The results of binding isotherms were analyzed
H4R3me2s peptide immunoprecipitates from nuclear ex-          using the Origin 7.0 software package (Origin Lab).
tracts of HCT116 cells, separated by sodium dodecyl
sulfate-polyacrylamide gel electrophoresis (SDS-PAGE),
and stained with SimplyBlue Safestain (Invitrogen). Pro-      Immunofluorescence and confocal microscopy
tein bands of interest were excised and subjected to elec-    HCT116 cells were fixed with 4% formaldehyde for 15
trospray–ion trap tandem mass spectrometry (LCQ-              min at room temperature. After washing cells 3 times in
Deca, Finnigan).                                              PBS with 0.1% Triton X-100, cells were blocked with 4%
                                                              BSA for 30 min. Cells were incubated with primary anti-
Plasmid construction, recombinant protein expression,         body (PRMT1 and SMARCA4) for 1 h at room
and purification                                              temperature. Following washes with PBS 0.1% Triton X-
pGEX-6p-1 plasmids encoding GST, GST-SMARCA4-F1               100, cells were incubated with a secondary antibody
(aa1-351), GST-SMARCA4-F2 (aa352-707), GST-SMAR               (Goat anti-Mouse IgG Alexa Fluor 488 and Goat anti-
CA4-F3 (aa708-1008), GST-SMARCA4-F4 (aa1009-1314),            Rabbit IgG Alexa Fluor 594 from Life Technologies) for
and GST-SMARCA4-F5 (aa1315-1647) (human SMAR                  1 h at room temperature. Following washes with PBS
CA4 isoform 1, Accession AAG24789.1) were trans-              0.1% Triton X-100, cells were stained with DAPI (Sigma)
formed into E. coli BL21 and cultured with IPTG at 16 °C      and visualized by confocal scanning microscopy (Olym-
for 12 h until the optical density (OD600) reached 0.5~0.6.   pus FV10i).
BL21 cells were collected and sonicated in cold PBS, and
GST-fusion proteins were purified with Glutathione S-
transferase beads according to the users’ manual. Purity      Western blot analysis and protein interaction studies
was assessed by SDS-PAGE.                                     Cellular proteins were extracted by RIPA lysis buffer at
   Wild-type human PRMT1 coding regions was cloned            high salt concentration (420 mM NaCl), and western
into the retroviral vector plasmid MSCV and confirmed         blot analysis was performed as described previously [34].
by DNA sequencing. The deletion mutant PRMT1Δ                 Scans of the uncropped blots for Western blots are pre-
(GSGTG, amino acids 86–90) [33] was constructed by            sented in Additional file 3. For immunoprecipitation as-
site-directed mutagenesis. The oligonucleotide used to        says, cells were washed with cold phosphate buffered
introduce the deletion was 5′-GGTGGTGCTGGACG                  saline (PBS) and lysed with cold cell lysis buffer for 30
TC ATCCTCTGCATGTTTGC-3′.                                      min at 4 °C. Then, 500 μg of cellular extract was incu-
                                                              bated with appropriate specific antibodies or normal
Microscale thermophoresis (MST) analysis and isothermal       rabbit immunoglobin G (IgG) at 4 °C overnight with
titration calorimetry (ITC) assays                            constant rotation, followed by the addition of protein A/
For MST analysis, purified recombinant SMARCA4-F4             G Sepharose beads and incubation for 2 h at 4 °C. Beads
(aa1009-1314) proteins or Flag-SMARCA4 from HCT116            were then washed five times with cell lysis buffer (50
cells were labeled with Monolith NT-647-NHS. Labeled          mM Tris-HCl, pH 7.4, 150 mM NaCl, 1 mM EDTA,
proteins were used at a concentration of 100 nM in PBS        0.5% NP-40, 0.25% sodium deoxycholate and protease
pH 7.4 containing 0.05% Tween-20. The concentration of        inhibitor mixture). The immune complexes were sub-
H4, H4R3me2a, and H4R3me2s peptides ranged from 10            jected to SDS-PAGE followed by immunoblotting with
nM to 500 μM. The combined solutions of labeled               secondary antibodies.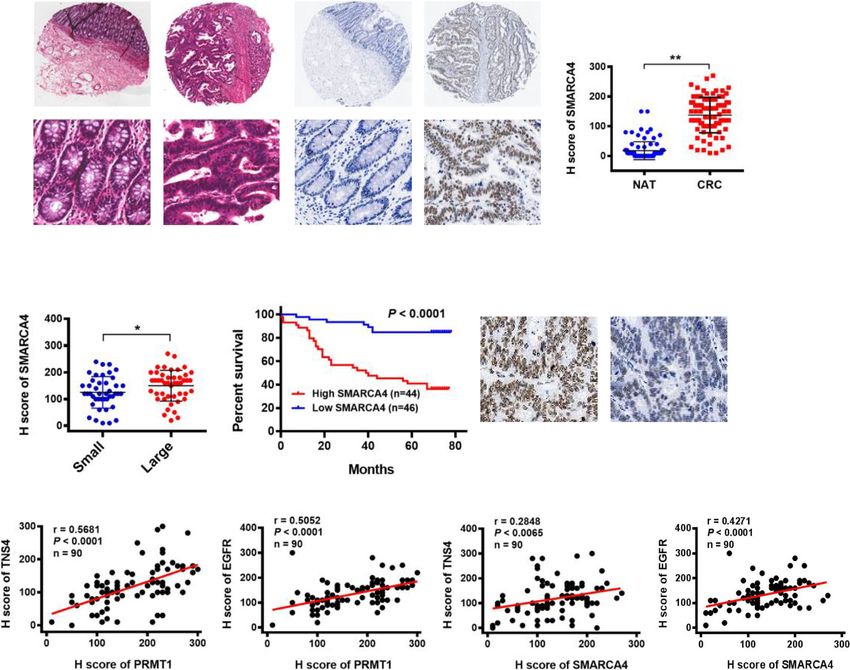
Yao et al. Genome Medicine   (2021) 13:58                                                                  Page 4 of 21

RNA isolation and quantitative RT-PCR                        value greater than 1.5, and a p value < 0.01 was consid-
Total RNA from cultured cells was extracted using TRI-       ered differentially expressed. Relationships of differen-
zol reagent (Invitrogen). cDNAs were synthesized with a      tially expressed genes were determined by GO and
HiScript 1st Strand cDNA Synthesis Kit (Vazyme Bio-          GSEA analysis.
tech, China). Quantitative RT-PCR was performed using
a FastStart Universal SYBR Green Master (Vazyme Bio-         Chromatin immunoprecipitation (ChIP)
tech, China) according to the manufacturer’s instruc-        ChIP assays were performed with HCT116 cells in ac-
tions in a StepOnePlus™ Real-Time PCR System                 cordance with standard protocols as described previously
(Thermo Scientific) in a final volume of 20 μl. Cycling      [35]. Normal rabbit IgG served as the control. ChIP
conditions were 94 °C for 15 s, 60 °C for 1 min, and 72 °C   samples were analyzed by quantitative real-time PCR
for 30 s. Each reaction was performed in triplicate. The     using the FastStart Universal SYBR Green Master
primer sequences for RT-PCR are listed in Add-               (Vazyme Biotech, China). The primer sequences for
itional file 2: Table S5.                                    ChIP are listed in Additional file 2: Table S6.

Proliferation assay, EdU incorporation assay, colony         ChIP-Seq data processing and analysis
formation assay, and migration assays                        The ChIP-Seq data was from CistromeDb [36] about
The in vitro viability of colorectal cancer cells was        H3K4me1 [37], H3K4me3 [38], H3K27ac [39], and
assessed using the Cell Counting Kit-8 (CCK-8). Cell pro-    SMARCA4 [40]. CistromeDb provides a QC metric with
liferation was determined by incorporation of 5-ethynyl-     7 QC items across three different layers. For datasets
20-deoxyuridine (EdU) using an EdU Cell Proliferation        with replicates, we choose the ChIP-Seq data with the
Assay Kit (Ribobio). Colony formation was observed by        highest QC score. All data uses the standard analysis
staining cells with 0.1% crystal violet (Sangon Biotech-     pipeline ChiLin [41] to process all chromatin profiling
nologies Inc., China). For cell migration assays, 5 × 10⁵    reads. The ChIP and control FASTQ data were mapped
cells were seeded into the upper chamber of the Transwell    onto a genome with BWA [42]. Marks on TNS4 and
apparatus (Corning Costar) in serum-free medium, and         EGFR were distinctly identified using MACS2 [43] for
medium supplemented with 10% FBS was added to the            narrow peak calling mode.
bottom chamber. After 24 h, the cells on the upper surface
that did not pass through the 8-μm pore-size polycarbon-     ATAC-seq data processing and analysis
ate filter were removed using a moistened cotton swab;       Chromatin accessibility data by ATAC-seq for SMAR
the cells migrating to the lower membrane surface were       CA4 was from GSM2719724 [44]. Reads were aligned to
fixed in 100% methanol for 10 min, stained with 0.4% crys-   the human genome (hg38) using STAR [45]. Only reads
tal violet for 15 min, and counted under a microscope        that mapped to a unique genomic locations (MAPQ >
(Nikon) at × 100 magnification.                              10) were used for downstream analysis. ATAC-seq peaks
                                                             were found using the findPeaks program in HOMER
Gene-microarray analysis                                     [46].
Total RNA was extracted from PRMT1-NC1, PRMT1-
NC2, PRMT1-KD1, PRMT1-KD2, SMARCA4-KD1, and                  Clinical samples and IHC staining
SMARCA4-KD2 HCT116 cell lines. Total RNA was                 Ninety pairs of CRC and adjacent normal paraffin tissue
quantified by the NanoDrop ND-2000 (Thermo Scien-            sections (HColA180Su14) were obtained from Shanghai
tific), and RNA integrity was assessed using an Agilent      Outdo Biotech (National Human Genetic Resources
Bioanalyzer 2100 (Agilent Technologies). Sample label-       Sharing Service Platform with code No. 2005DKA21300,
ing, microarray hybridization, and washing were per-         Shanghai, China) under the approval by the Ethics Com-
formed based on the manufacturer’s standard protocols.       mittee of Taizhou Hospital, Zhejiang, China. Immuno-
Briefly, total RNA were transcribed to double strand         histochemical staining (IHC) was performed using
cDNA, then synthesized into cRNA and labeled with            paraffin-embedded sections of biopsies from CRC pa-
Cyanine-3-CTP. The labeled cRNAs were hybridized             tients and controls according to standard protocols (Cell
onto the microarray. After washing, the arrays were          Signaling Technology). Briefly, slides were incubated
scanned by the Agilent Scanner G2505C (Agilent Tech-         with primary antibodies: anti-SMARCA4 (1:100 dilution,
nologies). The 60-mer oligo nucleotide probes were de-       Abcam, ab110641), anti-PRMT1 (1:100 dilution, CST,
signed using a microarray (Agilent) and performed by         #2449), anti-EGFR (1:200 dilution, Abcam, ab52894), or
Oe-biotech (Shanghai, China). For the study of differen-     anti-TNS4 (1:100 dilution, Abcam, ab192247), followed
tial gene expression, Genespring (version13.1, Agilent       by incubation with horseradish peroxidase-conjugated
Technologies) were employed to complete the basic ana-       goat anti-rabbit secondary antibody. Antibody binding
lysis with the raw data. The genes with a fold change        was visualized using a 2-Solution DAB Kit (Invitrogen).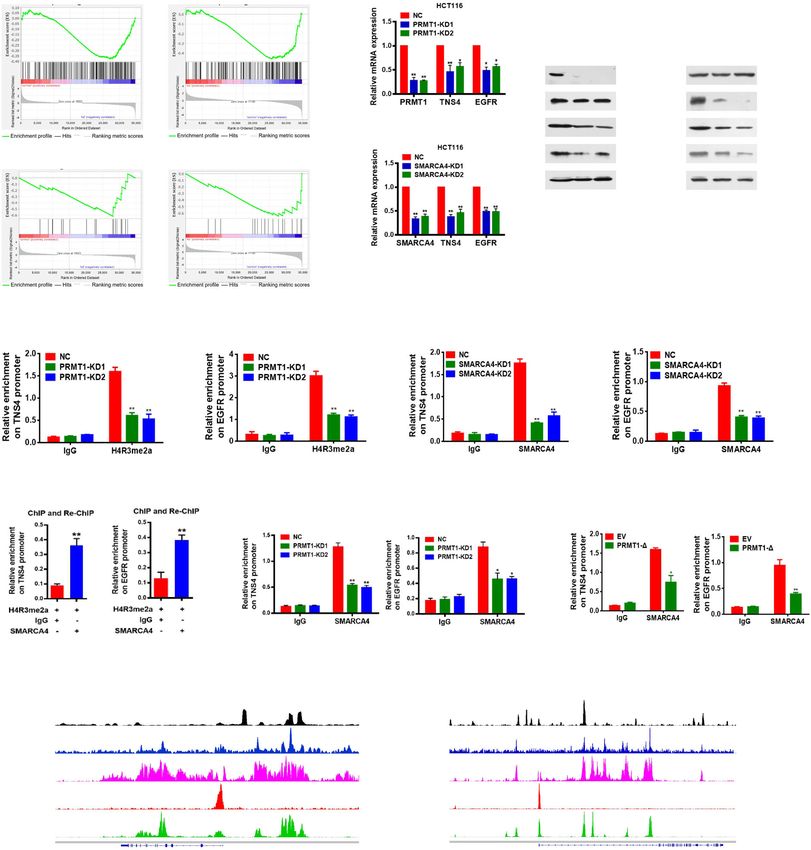
Yao et al. Genome Medicine   (2021) 13:58                                                                      Page 5 of 21

All colorectal cancer tissue sections were reviewed by        Software, San Diego, CA). Statistically significant differ-
two experienced pathologists, and staining of SMAR            ences were examined using Two-tailed Student’s t test,
CA4, PRMT1, TNS4, or EGFR in the tissue was scored            two-sided Pearson χ2 test, or the log-rank (Mantel-Cox)
independently (using the H-score system [47]) by two          test to derive the significance of the differences between
pathologists blinded to the clinical data. Rare discordant    two groups. P < 0.05 was considered to be significant.
scores were resolved by re-review of the slide and con-
sultation between the pathologists. The intensity of im-      Results
munostaining (category A) was documented as 0–3: 0,           SMARCA4 is a major H4R3me2a-associated protein and
negative; 1, weak; 2, moderate; 3, strong. For the Pearson    promotes CRC cell proliferation
correlation scatter plot of molecules in CRC, the H score     To identify proteins that bind to histone H4R3me2a in
was calculated by adding the multiplication product of        colon cells, we employed affinity purification followed by
the different staining intensities in category A (0–3) with   mass spectrometric analysis to identify proteins that could
the percentage of positive cells, i.e., H score (0–300        potentially bind H4R3me2a. We performed a peptide pull-
scale) = 3 × (% at 3+) + 2 × (% at 2+) + 1 × (% at 1+). The   down assay using C-terminal biotin-tagged 20 amino acid
clinical features of the patients are listed in Additional    N-terminal peptides of histone H4 in which the Arg3 resi-
file 2: Table S1 (the same patients from which tissues        due was either asymmetrically dimethylated (H4R3me2a),
were obtained). For survival analyses, patient overall sur-   or symmetrically dimethylated (H4R3me2s), or nonmethy-
vivals were stratified by expression of the gene of inter-    lated (H4). We incubated equivalent amounts of each pep-
est and were presented as Kaplan–Meier plots and              tide coupled to streptavidin beads with nuclear extracts
tested for significance using log-rank tests. Degree of       from HCT116 cells, washed the beads, separated the elu-
correlation between SMARCA4, PRMT1, TNS4, and                 ates on SDS-PAGE gels, and stained with SimplyBlue
EGFR expression patterns in CRC was assessed via Pear-        Safestain (Fig. 1a, left). Compared to H4R3me2s or H4
son correlation analysis.                                     peptides, we found that there was a protein band above
                                                              170 kDa that preferentially bound H4R3me2a. Mass spec-
Mice, colitis-associated colon tumor formation, and           trometric analysis showed that this protein band corre-
treatment                                                     sponded to SMARCA4 (Fig. 1a, right). Analysis of other
C57BL/6 J-ApcMin/+ mice were purchased from the               proteins identified by mass spectrometry will be described
Model Animal Resource Information Platform (Nanjing,          elsewhere (Additional file 2: Table S9). We confirmed the
China). All animal experimental procedures were con-          interaction between H4R3me2a and SMARCA4 from
ducted in accordance with animal protocols approved by        HCT116 cell nuclear extracts by immunoblot using an
the Laboratory Animal Center of Nanjing University.           antibody to SMARCA4 following a peptide pull-down
  Colitis-associated colon tumor formation was induced        assay. Strong binding of SMARCA4 was observed with the
in mice as described previously [48]. Briefly, 8-week-old     H4R3me2a peptide, but not with the unmethylated or
male mice were provided with drinking water containing        symmetrically methylated peptides (Fig. 1b). We further
2% dextran sodium sulfate (DSS) (MP Biomedicals, Irvine,      found that this interaction was direct, as demonstrated by
USA) for 7 consecutive days, followed by another 21 days      the peptide pull-down assay using purified recombinant
with 45 kcal% high-fat diet (SYSE Biotech, Changzhou,         glutathione S-transferase (GST) fusion proteins of SMAR
China). This cycle was repeated once after high-fat diet      CA4 fragments expressed in E. coli. Binding required the
for 4 weeks until day 150, when all mice were euthanized      residues between aa1009 and aa1314, a region which con-
for analysis. Lentivirus expressing murine PRMT1 shRNA        tains the HELICc domain [49] of SMARCA4 (SMARCA4-
(5′-GTCAAAGCCAACAAGTTA-3′) was administrated                  F4, Fig. 1c, Additional file 1: Fig. S1a and S1b). No binding
into C57BL/6J-ApcMin/+ mice via enema infection from          to H4R3me2a peptides by other SMARCA4 domains, in-
day 64 once a week (1 × 10⁸ TU). AMI-1 (Apexbio,              cluding a fragment containing a Bromo domain, was de-
Boston, USA) was administrated intraperitoneally into         tected (Fig. 1c, Additional file 1: Fig. S1a and S1b).
C57BL/6J-ApcMin/+ mice at 10 mg/kg twice weekly from          Similarly, H4R3me2a peptides bound robustly with puri-
day 64. Cetuximab (MedChemExpress, Shanghai, China)           fied Flag-tagged SMARCA4 from HCT116 cells, but not
was injected in the tail vein into C57BL/6J-ApcMin/+ mice     with the unmethylated or symmetrically methylated pep-
at 30 mg/kg once a week from day 120.                         tides (Additional file 1: Fig. S1c-d).
                                                                 Next, we confirmed that H4R3me2a peptide was
Statistical analysis                                          directly bound by SMARCA4-F4 by microscale thermo-
All data were collected from more than 3 independent          phoresis (MST) using purified recombinant SMARCA4-
experiments. Results are expressed as the mean ± stand-       F4 protein. The data fit a one-site-binding model with a
ard deviation unless otherwise indicated and were ana-        dissociation constant (Kd) of 5.36 ± 0.26 μM for SMAR
lyzed using GraphPad Prism 5.0 software (GraphPad             CA4-F4 binding to H4R3me2a peptide. No binding of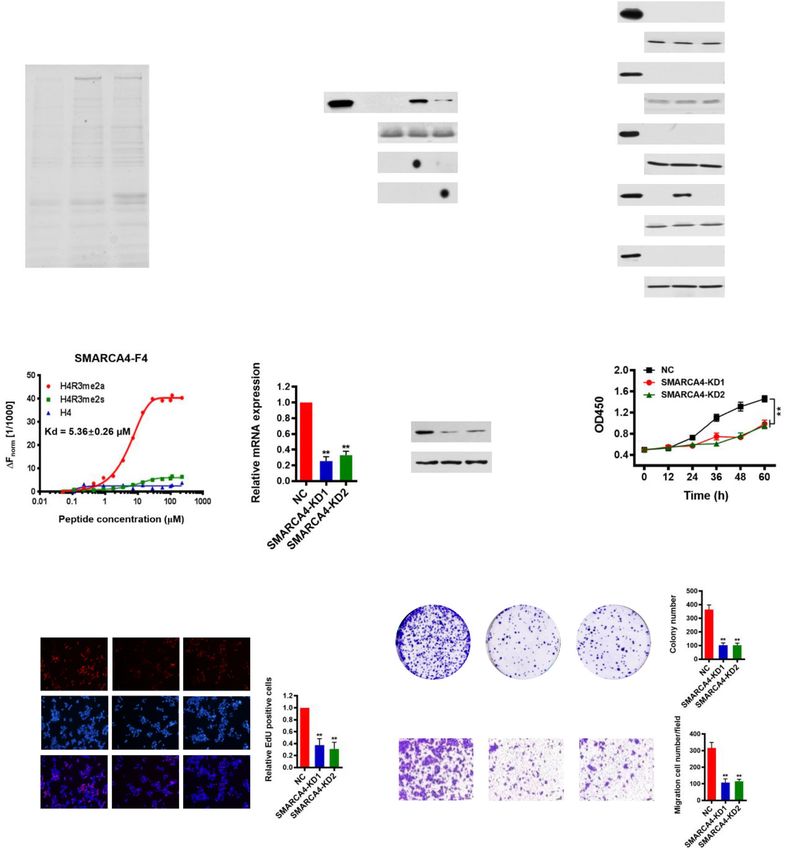
Yao et al. Genome Medicine      (2021) 13:58   Page 6 of 21

 Fig. 1 (See legend on next page.)
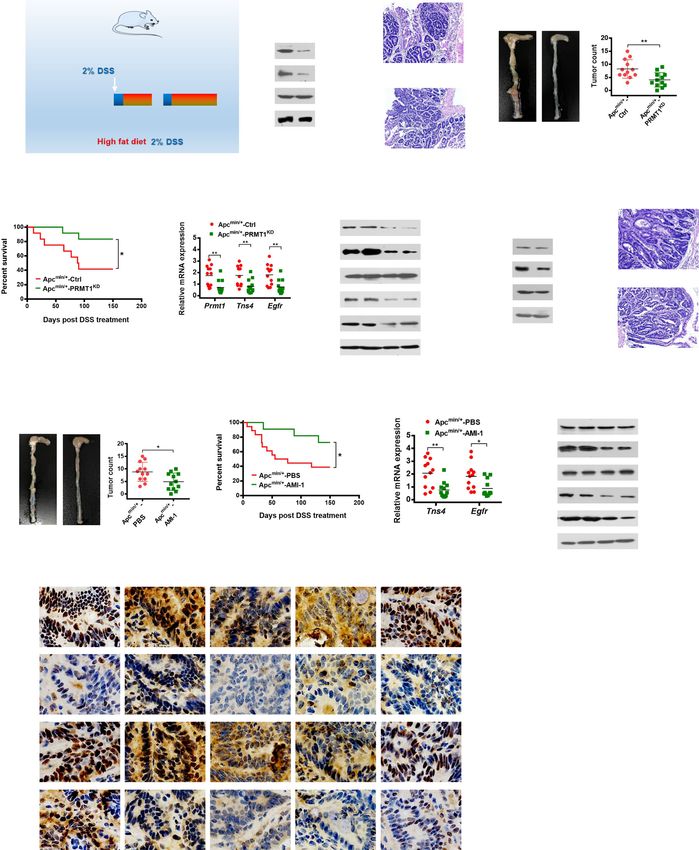
Yao et al. Genome Medicine       (2021) 13:58                                                                                          Page 7 of 21

 (See figure on previous page.)
 Fig. 1 SMARCA4 is a major H4R3me2a-associated protein and promotes CRC cell proliferation. a Immunoaffinity purification to identify proteins
 that are associated with H4R3me2a. The protein bands were retrieved and analyzed by mass spectrometry. SMARCA4 peptide fragments
 identified by mass spectrometric assay (right). b Peptide pull-down assay to detect the interactions between H4, H4R3me2a, and H4R3me2s
 peptides and SMARCA4 in HCT116 cell nuclear extracts (top panel). Coomassie staining shows equivalent loading of the three peptides (middle
 panel). The modification of the synthesized peptide was confirmed by dot blot analysis with specific antibodies (bottom panels). c Peptide pull-
 down experiments were performed with H4, H4R3me2a, and H4R3me2s peptides and purified recombinant glutathione S-transferase (GST) fusion
 proteins of SMARCA4 fragments expressed in E. coli. as in b. d MST assay to identify direct interactions between SMARCA4-F4 and H4R3me2a
 peptides. The dissociation constant (Kd) between SMARCA4-F4 and H4R3me2a peptide is 5.36 ± 0.26 μM. e, f Identification of the effect of SMAR
 CA4 knockdown (SMARCA4-KD) in HCT116 cells by quantitative real-time PCR (e) and western blot analysis with indicated antibodies (f). Hsp70
 served as a loading control. g Proliferation of HCT116 cells following knockdown of SMARCA4. Values at the indicated time points represent
 mean ± s.d. from three independent tests; **P < 0.01. h EdU proliferation analysis of the effect of siRNA knockdown of SMARCA4 on the growth of
 HCT116 cells. Representative images (left panel) and quantitative analyses of the assay (right panel) are shown. i Colony formation assay of
 HCT116 cells following SMARCA4 knockdown. Representative images (left panel) and quantitative analyses of the colony formation (right panel)
 are shown. j Migration assay of HCT116 cells following SMARCA4 knockdown. The numbers of migrated cells were quantified by counting the
 numbers of cells in entire fields at ×200 magnification. Representative images (left panel) and quantitative analyses of the migrated cells (right
 panel) are shown. For e, h, i, and j, results are shown as mean ± s.d. from three independent experiments; **P < 0.01 compared with the
 scrambled negative control (NC)

SMARCA4-F4 to H4 or H4R3me2s control peptides was                           levels of SMARCA4 mRNAs were reduced to ~ 30% of
observed (Fig. 1d). Keeping in line with this, we obtained                  levels in cells transfected with the scrambled negative
a similar Kd of 6.27 ± 0.37 μM for purified Flag-SMAR                       control (NC) (Fig. 1e). The reduced protein levels of
CA4 from HCT116 cells binding to H4R3me2a peptide                           SMARCA4 were confirmed by western blot analysis
(Additional file 1: Fig. S1e). Isothermal titration calorim-                (Fig. 1f). Knockdown of SMARCA4 significantly reduced
etry (ITC) measurements also showed a similar specific                      the cell growth rate in HCT116 cells (Fig. 1g). These re-
interaction of SMARCA4-F4 with H4R3me2a peptide,                            sults were confirmed by EdU staining to detect nucleo-
with a Kd of 2.41 ± 0.12 μM (Additional file 1: Fig. S2).                   tide analogue incorporation into replicated DNA
Again, compared to H4R3me2a, no interaction of SMAR                         (Fig. 1h). In addition, knockdown of SMARCA4 signifi-
CA4-F4 with H4 or H4R3me2s control peptides was de-                         cantly reduced the numbers of HCT116 colonies formed
tected (Additional file 1: Fig. S2). These results indicate                 after culture compared with NC controls (Fig. 1i). Re-
that SMARCA4 can discriminate between H4R3me2a                              sults from the Transwell assay showed that cell migra-
and H4R3me2s marks and binds strongly to the isolated                       tory capabilities of HCT116 cells were also significantly
methyl mark of H4R3me2a compared to H4R3me2s.                               reduced in SMARCA4 knockdown cells compared with
   We noticed that histone mark H4R3me2a was mainly                         the NC cells (Fig. 1j). These data indicate that SMAR
triggered by PRMT1 in cells [8]. Thus, we reasoned that                     CA4 is an H4R3me2a-associated protein, and knock-
SMARCA4 and PRMT1 could interact in cells. Immuno-                          down of SMARCA4 inhibits CRC cell proliferation.
fluorescence staining experiments showed that SMAR
CA4 co-localized with PRMT1 in the nucleus of                               PRMT1 expression is associated with prognosis of CRC,
HCT116 cells (Additional file 1: Fig. S3a). We analyzed                     and knockdown of PRMT1 reduces CRC cell proliferation
Flag-antibody immunoprecipitates from HCT116 cells                          Histone modification of H4R3me2a in cells is mainly
overexpressing Flag-tagged PRMT1 by immunoblot with                         mediated by PRMT1 [50]. Thus, we evaluated PRMT1
antibodies to SMARCA4 and found that PRMT1 co-                              expression and its potential role in CRC cells. To investi-
immunoprecipitated with SMARCA4 (Additional file 1:                         gate the clinical significance of PRMT1 expression in pa-
Fig. S3b). In addition, we showed that SMARCA4 was                          tients with CRC, we examined expression of PRMT1 by
co-immunoprecipitated with endogenous PRMT1 (Add-                           immunohistochemical staining (IHC) in a human CRC
itional file 1: Fig. S3c). Furthermore, we confirmed that                   tissue array containing 90 CRC samples and adjacent
PRMT1 interacted with SMARCA4 at gene promoters in                          normal colon tissue controls (Additional file 2: Table
HCT116 cells using a ChIP-reChIP strategy (Add-                             S1). We found that PRMT1 was significantly upregulated
itional file 1: Fig. S3d). These results indicate that SMAR                 in CRC compared with matched adjacent normal colon
CA4 and PRMT1 interact in colon cells. However,                             tissues (NAT; Fig. 2a). Notably, PRMT1 expression cor-
whether they interact directly needs to be determined.                      related with increased tumor size and higher grade, but
   We went on to determine potential roles of SMAR                          not with lymph node status or TNM stage (Fig. 2b, Add-
CA4 in CRC cells. To examine the effect of SMARCA4                          itional file 2: Table S1). Importantly, Kaplan–Meier sur-
on cell growth, we knocked down SMARCA4 in                                  vival analysis showed that CRC patients with high
HCT116 cells using two independent RNAi. We found                           PRMT1 expression had shorter overall survival (Fig. 2c).
that in SMARCA4-knockdown (SMARCA4-KD) cells,                               These results indicate that PRMT1 expression levels are
Yao et al. Genome Medicine      (2021) 13:58   Page 8 of 21

 Fig. 2 (See legend on next page.)
Yao et al. Genome Medicine           (2021) 13:58                                                                                                         Page 9 of 21

 (See figure on previous page.)
 Fig. 2 Upregulation of PRMT1 in colorectal cancer is associated with poor prognosis, and knockdown of PRMT1 reduces CRC cell proliferation. a Hematoxylin
 and eosin (H&E) staining and immunohistochemical staining (IHC) of PRMT1 protein in adjacent normal colon tissue controls (NAT) and colorectal cancer (CRC)
 human tissues. Representative micrographs are shown in original magnification (× 200) as indicated (left); total IHC score of PRMT1 in NAT and CRC tissues (n =
 90); **P < 0.01 (right). Scale bar, 50 μm. b Correlation of PRMT1 expression with tumor size; **P < 0.01. c Kaplan–Meier plot of overall survival of 90 patients with
 colorectal cancer, stratified by PRMT1 expression. Log-rank test, P < 0.0001. d, e Effect of PRMT1 knockdown (PRMT1-KD) in HCT116 cells assessed by
 quantitative real-time PCR (d) and western blot analyses with the indicated antibodies (e). Hsp70 served as a loading control. f Proliferation of HCT116 cells
 following PRMT1 knockdown. Values at the indicated time points represent mean ± s.d. from three independent tests; **P < 0.01. g EdU proliferation analysis of
 the effect of PRMT1-KD on the growth of HCT116 cells compared with NC controls; Representative images (left panel) and quantitative analyses of the assay
 (right panel) are shown. h Colony formation assay of HCT116 cells following PRMT1 knockdown. Representative images (left panel) and quantitative analyses of
 the colony formation (right panel) are shown. i Migration assays of HCT116 cells following PRMT1 knockdown. The numbers of migrated cells were quantified
 by counting the numbers of cells in entire fields at × 200 magnification. Representative images (left panel) and quantitative analyses of the migrated cells (right
 panel) are shown. j, k Colony formation (j) and migration assays (k) of HCT116 cells overexpressing wild-type PRMT1 (PRMT1-WT) or PRMT1-Δ. l Western blot
 analysis of indicated proteins from HCT116 cells overexpressing PRMT1-WT, PRMT1-Δ, or EV (empty vector, MSCV). Hsp70 and histone H4 served as loading
 controls. Data are representative of three independent experiments. All results are shown as mean ± s.d. from three independent experiments; **P < 0.01
 compared with the NC control

upregulated in human CRC tissues and correlate with                                   activity of PRMT1 is critical for CRC cell proliferation
poor prognosis in CRC, suggesting that PRMT1 may                                      in vitro.
promote cancer cell growth during malignant
progression.                                                                          TNS4 and EGFR are direct downstream transcriptional
  To determine the role of PRMT1 in CRC cell prolifer-                                targets of PRMT1 and SMARCA4 in CRC cells
ation, two different short hairpin RNAs against PRMT1                                 The experiments above showed that PRMT1 and SMAR
were used to knock down PRMT1 expression in                                           CA4 promoted proliferation of CRC cells. To identify
HCT116 cells. We found that PRMT1 expression in                                       their potential downstream targets and understand their
PRMT1-knockdown (PRMT1-KD) cells was reduced to                                       mechanisms of action, we conducted gene expression
~ 20% of that in cells transfected with the scrambled                                 profiling assays with the Agilent SurePrint G3 Human
negative control (NC) (Fig. 2d). Decreased protein levels                             Gene Expression v3 (8*60K, Design ID:072363) using
of PRMT1 were confirmed by western blot analysis                                      mRNA following PRMT1 knockdown, SMARCA4
(Fig. 2e). Knockdown of PRMT1 significantly reduced                                   knockdown, and NC controls from HCT116 cells (Add-
the cell growth rate of HCT116 cells (Fig. 2f). This was                              itional file 1: Fig. S4a and S4b). Gene set enrichment
confirmed by EdU staining to detect nucleotide analogue                               analysis (GSEA) showed that cell proliferation and EGFR
incorporation into replicated DNA (Fig. 2g). In addition,                             signaling genes were enriched in PRMT1- or SMAR
knockdown of PRMT1 significantly reduced the num-                                     CA4-knockdown HCT116 cells compared to NC con-
bers of HCT116 colonies formed after culture compared                                 trols (Fig. 3a, b). Consistently, gene ontology (GO) ana-
with NC cells (Fig. 2h). Results from the Transwell assay                             lysis of the differentially expressed genes in the PRMT1-
showed that cell migratory capabilities of HCT116 cells                               or SMARCA4-knockdown versus NC controls revealed
were also significantly reduced in PRMT1 knockdown                                    significant enrichment of genes involved in several key
cells compared with NC cells (Fig. 2i). These data indi-                              cellular processes such as EGFR signaling pathways, cell
cate that knockdown of PRMT1 inhibits CRC cell prolif-                                proliferation, and cell division or migration, which corre-
eration in vitro.                                                                     lated with cancer progression (Additional file 1: Fig.
  To determine whether regulation of cell proliferation                               S4c). From gene profile data, we found a total of 770
by PRMT1 was methyltransferase activity-dependent, we                                 downregulated genes in PRMT1-KD1 and 781 downreg-
constructed a mutant form of PRMT1 in which five                                      ulated genes in PRMT1-KD2 versus NC controls with at
amino acids (GSGTG, aa86-90) located in the S-                                        least a 1.5-fold change, whereas there were a total of
adenosyl-L-methionine binding motif were deleted                                      1967 downregulated genes in SMARCA4-KD1 and 1932
(PRMT1-Δ) [51]. HCT116 cells were transfected with                                    downregulated genes in SMARCA4-KD2 versus NC
vectors overexpressing either PRMT1 or PRMT1-Δ. Cell                                  controls with at least a 1.5-fold change (Additional file 1:
colony formation assay and Transwell assay showed that                                Fig. S4d, GEO database under accession GSE143198 and
cell proliferation of HCT116 cells was significantly re-                              GSE143199). There were 109 common genes which ex-
duced in PRMT1-Δ cells compared with the wild-type                                    hibited at least 1.5-fold downregulation in all four KD
PRMT1 overexpressing cells (Fig. 2j, k), similar to the ef-                           profiles (Additional file 1: Fig. S4d; Additional file 2:
fect obtained from PRMT1 knockdown. The effect of                                     Table S10). We found that 15 genes in a previously pub-
the PRMT1-Δ mutant on histone H4 was confirmed by                                     lished SMARCA4 ChIP-Seq database [40] in HCT116
western blot analysis with an anti-H4R3me2a antibody                                  cells overlapped with our 109 genes (Additional files 1
(Fig. 2l). These results suggest that the methyltransferase                           & 2: Fig. S4e, Table S2). Among these 15 common target
Yao et al. Genome Medicine        (2021) 13:58                                                                                             Page 10 of 21

 Fig. 3 Identification of transcriptional targets of PRMT1 and SMARCA4. a,b Gene set enrichment analysis (GSEA) plots for cell proliferation-related and
 EGFR signaling pathway-related genes in HCT116 cells following PRMT1 knockdown (a) or SMARCA4 knockdown (b). c Quantitative real-time PCR
 analysis of PRMT1, TNS4, or EGFR mRNA levels normalized to GAPDH in scrambled negative control HCT116 cells (NC) and PRMT1-KD1/2 or SMARCA4-
 KD1/2 HCT116 cells. d Western blot analysis of indicated proteins in NC, PRMT-KD, and SMARCA4-KD HCT116 cells. Hsp70 served as a loading control.
 Data are representative of three independent experiments. e,f ChIP analysis of H4R3me2a and SMARCA4 binding to the TNS4 and EGFR promoter in
 NC, PRMT-KD, and SMARCA4-KD HCT116 cells. g ChIP-reChIP analysis of chromatin from HCT116 cells. The first antibody (H4R3me2a) and second
 antibody (SMARCA4) used in the reChIP are shown below the bar plot. The amount recovered from the reChIP was determined by qPCR and is shown
 as a percentage of the input. h ChIP analysis of SMARCA4 on the TNS4 and EGFR promoter from PRMT1 knockdown cells or NC control cells. i ChIP
 analysis of SMARCA4 on the TNS4 and EGFR promoter from PRMT1-Δ-overexpressing cells or EV (empty vector, MSCV) control cells. j Genomic tracks of
 ATAC and ChIP intensities of SMARCA4, H3K4me1, H3K4me3, and H3K27ac in the vicinity of TNS4 and EGRF loci in HCT116 cells. Track height is
 normalized to relative number of mapped reads. All results are shown as mean ± s.d. from three independent experiments. **P < 0.01 or *P < 0.05
 compared to NC control or the indicated control (rabbit IgG)
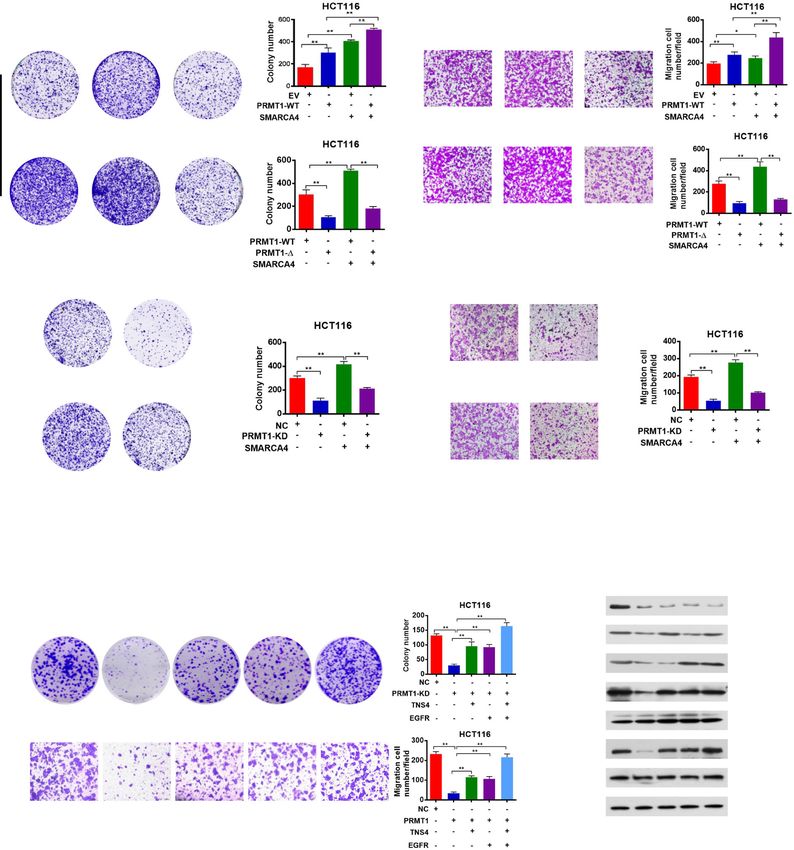
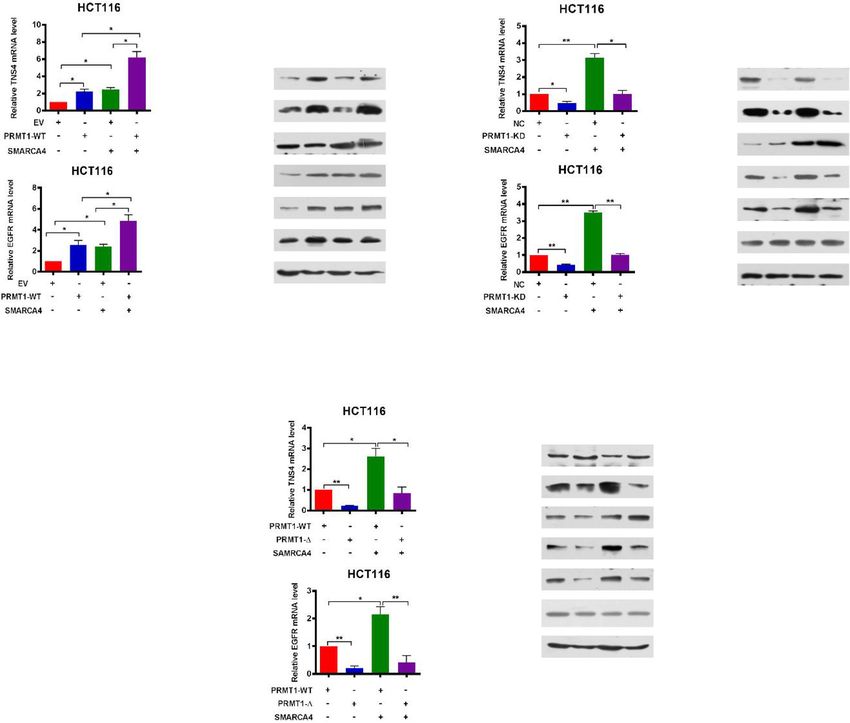
Yao et al. Genome Medicine   (2021) 13:58                                                                    Page 11 of 21

genes, TNS4 (also named CTEN), which regulates EGFR          PRMT1 and SMARCA4 cooperatively activate TNS4 and
protein levels through a posttranslational mechanism         EGFR transcription
and prolongs signaling by EGFR through reducing its          Given that knockdown of PRMT1 or SMARCA4 re-
ligand-induced degradation [52], turned out to be the        duced mRNA and protein expression of TNS4 and
most downregulated gene by both PRMT1 and SMAR               EGFR in CRC cells (Fig. 3c, d), we sought to determine
CA4 knockdown. Interestingly, we also found that EGFR        whether SMARCA4 and PRMT1 regulated TNS4 and
was among the 15 overlapping gene list. Based on these       EGFR expression in a cooperative fashion. We enforced
findings, we chose TNS4 and EGFR for further investiga-      overexpression of PRMT1 or SMARCA4 or both in
tion as potential downstream target genes of PRMT1           HCT116 and SW620 cells. We found that either PRMT1
and SMARCA4.                                                 or SMARCA4 individually activated expression of TNS4
   We confirmed that knockdown of PRMT1 or SMAR              and EGFR, and the combination produced an additive
CA4 in HCT116 cells led to significantly decreased ex-       effect on expression of TNS4 and EGFR, whereas SMAR
pression of TNS4 and EGFR at both transcriptional and        CA4 knockdown did not have such an effect with
protein levels (Fig. 3c, d). To probe whether PRMT1 or       PRMT1 (Fig. 4a, b, and Additional file 1: Fig. S6a, S6b,
SMARCA4 directly regulated TNS4 and EGFR transcrip-          S6g, S6h). However, when PRMT1 was knocked down,
tion, we performed ChIP analysis using anti-PRMT1-           this additive effect was lost (Fig. 4c, d, and Additional
mediated H4R3me2a or anti-SMARCA4 antibodies at              file 1: Fig. S6c, S6d, S6i, S6j). These results indicate that
TNS4 and EGFR gene promoters. We found that knock-           PRMT1 and SMARCA4 can cooperatively activate TNS4
down of PRMT1 led to a significant reduction of              and EGFR transcription and that PRMT1 is required for
H4R3me2a and knockdown of SMARCA4 led to a signifi-          this synergy. To further investigate whether enzymatic
cant reduction of SMARCA4 at the promoters of TNS4           activity of PRMT1 is critical for the cooperative effect,
and EGFR (Fig. 3e, f) in HCT116 cells, suggesting that       we enforced overexpression of wild-type PRMT1 or of
PRMT1 or SMARCA4 bound to the promoters and dir-             an enzymatic activity-associated deletion mutant,
ectly regulate transcription of TNS4 and EGFR. Further,      PRMT1-Δ, together with SMARCA4 in HCT116 and
we confirmed these proteins interacted on the promoters      SW620 cells. We obtained results similar to those from
of TNS4 and EGFR by a ChIP-reChIP strategy, in which         PRMT1 knockdown, in that deletion mutant PRMT1-Δ
chromatin immunoprecipitated with H4R3me2a antibody          did not show an additive effect on expression of TNS4
was re-immunoprecipitated with antibody to SMARCA4           and EGFR when co-expressed with SMARCA4 (Fig. 4e,
(Fig. 3g). Importantly, we found that enrichment of SMAR     f, and Additional file 1: Fig. S6e, S6f, S6k, S6l). These re-
CA4 on TNS4 or EGFR promoter was significantly de-           sults indicate that methyltransferase activity of PRMT1
creased (Fig. 3h, i, Fig. S8e) under these conditions, in-   is essential for the cooperative effect of PRMT1 and
cluding when PRMT1 was knocked down, or when                 SMARCA4 on transcriptional activation of TNS4 and
PRMT1-Δ was overexpressed in HCT116 cells, or when           EGFR expression.
HCT116 cells were treated with AMI-1, a PRMT1 methyl-
transferase inhibitor [53]. These results indicate that      SMARCA4 and PRMT1 combine to promote CRC cell
SMARCA4 bound to H4R3me2a in cells. In control exper-        proliferation through EGFR signaling
iments, we did not see a change of SMARCA4 protein           To determine the effect of SMARCA4 and PRMT1 on
levels after knocking down PRMT1 (Fig. 3d, left).            cell proliferation, we enforced overexpression of wild-
   Indeed, ChIP-Seq data demonstrated that SMARCA4           type PRMT1 or SMARCA4 or both in HCT116 and
bound TNS4 and EGFR gene sequences in colon HCT116           SW620 cells, and determined colony formation and mi-
cells, and the enrichment pattern was similar to active      gration capabilities of those cells. We found that PRMT1
promoter and enhancer marks H3K4me3, H3K4me1, and            and SMARCA4 individually promoted colony formation
H3K27ac genome-wide (Cistrome Data Browser). Also            and migration capabilities of both HCT116 and SW620
the SMARCA4 enrichment was largely overlapped with           cells, and their co-expression resulted in an additive ef-
ATAC-seq peaks at promoters, TSSs, and gene regions          fect, whereas SMARCA4 knockdown did not have such
(Fig. 3j). Unfortunately, our H4R3me2a ChIP-Seq experi-      an effect with PRMT1 (Fig. 5a, b, and Additional file 1:
ments were unsuccessful despite that we performed the        Fig. S7a, S7b, S7e, S7f). However, when PRMT1 was
experiment many times. This could be due to very low IP      knocked down, this additive effect was lost (Fig. 5c, d,
efficiency during ChIP-Seq analysis. Nevertheless, we        and Additional file 1: Fig. S7c, S7d, S7g, S7h). These re-
found that ATAC accessibility sites were enriched in         sults indicate that in combination PRMT1 and SMAR
HCT116 cells at sites of increased ChIP density for SMAR     CA4 cooperatively promote colony formation and mi-
CA4, H3K4me3, and H3K27ac (Additional file 1: Fig. S5).      gration capabilities of CRC cells. To further investigate
These data suggest that TNS4 and EGFR are direct down-       whether enzymatic activity is critical for this cooperative
stream transcriptional targets of SMARCA4 in CRC cells.      effect, we enforced overexpression of wild-type PRMT1
Yao et al. Genome Medicine          (2021) 13:58                                                                                                  Page 12 of 21

 Fig. 4 PRMT1 and SMARCA4 cooperatively activate TNS4 and EGFR transcription in HCT116 cells. a, b Quantitative real-time PCR analysis of indicated mRNAs
 normalized to GAPDH (a) and western blot analysis of indicated proteins normalized to histone H4 and Hsp70 (b) from HCT116 cells that had been transfected
 with EV (empty vector, MSCV) or PRMT1-WT, and transfected or not with a SMARCA4 expression construct. c, d Quantitative real-time PCR analysis of indicated
 mRNAs normalized to GAPDH (c) and western blot analysis of indicated proteins normalized to histone H4 and Hsp70 (d) from NC or PRMT1-KD in HCT116
 cells transfected or not with a SMARCA4 expression construct. e, f Quantitative real-time PCR analysis of indicated mRNAs normalized to GAPDH (e) and
 western blot analysis of indicated proteins normalized to histone H4 and Hsp70 (f) from HCT116 cells transfected with PRMT-WT or PRMT1-Δ constructs and
 transfected or not with a SMARCA4 expression construct. For a, c, and e, results are shown as mean ± s.d. from three independent experiments; *P < 0.05, **P <
 0.01 compared with the indicated control

or of the enzymatic activity-associated deletion mutant                             We next sought to determine whether PRMT1 pro-
PRMT1-Δ together with SMARCA4 in HCT116 and                                       moted cell proliferation through activating EGFR signal-
SW620 cells. Colony formation and migration results                               ing pathways, which include the Ras/MAPK pathway
were similar to the PRMT1 knockdown. The deletion                                 and the PI3K/AKT pathway [54]. We showed that over-
mutant PRMT1-Δ did not mediate an additive effect on                              expression of TNS4 and EGFR could restore the prolif-
cell proliferation when co-expressed with SMARCA4                                 eration of PRMT1 knockdown cells (Fig. 5e). We found
(Fig. 5a, b, and Additional file 1: Fig. S7a, S7b). These                         that knockdown of PRMT1 significantly decreased ex-
results indicate that the combination of SMARCA4 and                              pression of TNS4 and EGFR genes. More interestingly,
PRMT1 promotes CRC cell proliferation, and this effect                            knockdown of PRMT1 also reduced phosphorylated Akt
is dependent on methyltransferase activity of PRMT1,                              (p-Akt) and phosphorylated (p-ERK) but did not affect
consistent with fact that SMARCA4 recognizes                                      total protein levels. Importantly, the decrease in p-Akt
H4R3me2a, a PRMT1-mediated histone mark.                                          and p-ERK could be rescued by enforced ectopic
Yao et al. Genome Medicine       (2021) 13:58                                                                                         Page 13 of 21

 Fig. 5 SMARCA4 couples with PRMT1 to promote CRC cell proliferation through EGFR signaling in HCT116 cells. a Colony formation assay with
 HCT116 cells transfected with EV (empty vector, MSCV), PRMT1-WT, PRMT1-Δ, SMARCA4, PRMT1-WT + SMARCA4, or PRMT1-Δ + SMARCA4.
 Representative images (left panels) and quantitative analyses of colony formation (right panels) are shown. b Cell migration assays with HCT116
 cells transfected with MSCV, PRMT1-WT, PRMT1-Δ, SMARCA4, PRMT1-WT + SMARCA4, or PRMT1-Δ + SMARCA4. Representative images (left panels)
 and quantitative analyses of the migrated cells (right panels) are shown. c Colony formation assays from NC or PRMT1-KD transfected HCT116
 cells transfected or not with a SMARCA4 expression construct. Representative images (left panels) and quantitative analyses of the colony
 formation (right panel) are shown. d Cell migration assays from NC or PRMT1-KD transfected HCT116 cells transfected or not with a SMARCA4
 expression construct. Representative images (left panels) and quantitative analyses of the colony formation (right panel) are shown. e Colony
 formation assays and cell migration assays from NC or PRMT1-KD with ectopic expression of TNS4 or EGFR, or both. Representative images (left
 panels) and quantitative analyses of the colony formation (right panels) are shown. f Western blot analysis of the expression levels of PRMT1 and
 EGFR signaling pathway downstream molecules p-AKT, AKT, p-ERK, and ERK in HCT116 cells with ectopic expression of TNS4 or EGFR. GAPDH
 served as a loading control. All results are shown as mean ± s.d. from three independent experiments; **P < 0.01, *P < 0.05 compared with the
 indicated control
Yao et al. Genome Medicine      (2021) 13:58   Page 14 of 21

 Fig. 6 (See legend on next page.)
Yao et al. Genome Medicine       (2021) 13:58                                                                                         Page 15 of 21

 (See figure on previous page.)
 Fig. 6 PRMT1 deficiency protects Apcmin/+ mice against DSS-induced CRC progression. a Schematic diagram of DSS-induced CRC in C57BL/6 J-
 Apcmin/+ mice with high-fat diet and related treatments. Tissue collection, analysis, and survival end-point analyses were performed at day 150
 after the first DSS treatment. b Immunoblot analyses of PRMT1 and H4R3me2a in colon tissues (left) and hematoxylin and eosin (H&E) staining of
 colon tumors (right) from ApcMin/+-Ctrl and ApcMin/+-PRMT1KD mice after the indicated LV infection. c Numbers and size of colon tumors found in
 ApcMin/+-PRMT1KD mice (n = 12) compared with ApcMin/+-Ctrl mice (n = 12). Results are shown as mean ± s.d.; **P < 0.01 compared with the
 control mice. d Survival curves of ApcMin/+-Ctrl (n = 12) and ApcMin/+-PRMT1KD (n = 12) mice. Statistical significance was determined by Kaplan–
 Meier log-rank test; *P < 0.05. e, f Quantitative real-time PCR analysis of indicated mRNAs normalized to GAPDH (e) and western blot analysis of
 indicated proteins normalized to histone H4 and Hsp70 (f) from colon tissues from ApcMin/+-Ctrl and ApcMin/+-PRMT1KD mice. Results are shown
 as mean ± s.d. from 12 mice each; **P < 0.01 compared with the control mice. g Immunoblot analyses of PRMT1 and H4R3me2a in colon tissues
 (left) and hematoxylin and eosin (H&E) staining of colon tumors (right) from ApcMin/+-PBS and ApcMin/+-AMI-1 mice. h Numbers and size of colon
 tumors found in ApcMin/+-AMI-1 mice (n = 12) compared with ApcMin/+-PBS mice (n = 12). Results are shown as mean ± s.d.; *P < 0.05 compared
 with the control mice. i Survival curves of ApcMin/+-PBS (n = 12) and ApcMin/+-AMI-1 (n = 12) mice. Statistical significance was determined by the
 Kaplan–Meier log-rank test. *P < 0.05. j, k Quantitative real-time PCR analysis of indicated mRNAs normalized to GAPDH (j) and western blot
 analysis of indicated proteins normalized to histone H4 and Hsp70 (k) from colon tissues from ApcMin/+-PBS and ApcMin/+-AMI-1 mice. Results are
 shown as mean ± s.d. from 12 mice each; *P < 0.05, **P < 0.01 compared with the control mice. l Representative IHC staining of PRMT1,
 H4R3me2a, TNS4, EGFR, and Ki67 in colon tumor tissues of C57BL/6 J-ApcMin/+ mice from indicated groups

expression of either TNS4 or EGFR (Fig. 5f). Collect-                          To test the importance of PRMT1 methyltransferase
ively, these data suggest that PRMT1 and SMARCA4 co-                        activity for colon tumorigenesis in vivo, we utilized the
operatively promote CRC cell proliferation in a manner                      PRMT1 inhibitor AMI-1 [53, 57] to inhibit its methyl-
involving activating EGFR signaling and requiring                           transferase activity. We demonstrated that the AMI-1
PRMT1 methyltransferase activity.                                           treatment could mimick the phenotypes caused by the
                                                                            PRMT1-Δ on colony formation, migration capabilities,
PRMT1 deficiency protects mice against DSS-induced                          and expression of TNS4 and EGFR of CRC cells in a
Apcmin/+ CRC progression                                                    dose-dependent manner (Additional file 1: Fig. S8a-d).
APCMin/+ mice provide a robust model for studying                           Similar to ApcMin/+-PRMT1KD CRC mice, AMI-1 treat-
colon cancer progression. When raised conventionally,                       ment significantly reduced the formation of colorectal
these mice develop small intestinal tumors, but if treated                  adenomas in C57BL/6J-ApcMin/+ mice (ApcMin/+-AMI-1)
with 2% dextran sodium sulfate (DSS) in drinking water,                     compared to the PBS-treated mice (Fig. 6a, h, l). In
they develop colitis and colonic neoplasia at very high                     addition, the survival rate was significantly higher in
penetrance [55]. Additional dietary modification with                       AMI-1-treated mice than in PBS-treated mice (Fig. 6i).
high fat accelerates carcinogenesis, providing a model                      As expected, reduced levels of histone mark H4R3me2a
that reflects the development of CRC in humans [56].                        were confirmed in AMI-1-treated colon tissues com-
Using this model, we investigated whether PRMT1 par-                        pared to PBS-treated colon tissues (Fig. 6g). Quantitative
ticipated in colon tumorigenesis in the ApcMin/+ mouse.                     RT-PCR and Western blot analysis showed that colon
First, we examined the role of PRMT1 in colon tumori-                       tissues from AMI-1-treated mice had significantly lower
genesis by knocking down PRMT1 in C57BL/6 J-Apc-                            expression levels of TNS4 and EGFR genes compared to
Min/+
        mice fed a high-fat diet (Fig. 6a). Decreased                       PBS-treated mice (Fig. 6j, k). Consistent with our obser-
PRMT1 expression was observed in the colons of mice                         vation of the in vivo treatment response, Ki67 staining
after the indicated lentivirus virus (LV) infection                         showed that PRMT1 depletion or inhibition suppressed
(Fig. 6b). Reduced levels of histone mark H4R3me2a                          proliferation of colon tumor cells (Fig. 6l). More inter-
were confirmed in PRMT1 knockdown colon tissues                             estingly, combination treatment of APCmin/+ mice using
(Fig. 6b). As demonstrated by histologic examination                        AMI-1 and cetuximab, a therapeutic EGFR monoclonal
and hematoxylin and eosin (H&E) staining of mice colon                      antibody [57], showed significant synergy to reduce the
tissues, we found that C57BL/6 J-ApcMin/+ mice pre-                         formation of colorectal adenomas in mice (Additional
treated with DSS followed by LV infection-mediated                          file 1: Fig. S9). Taken together, these data indicate that
PRMT1 knockdown (ApcMin/+-PRMT1KD) developed                                PRMT1 depletion or inhibition ameliorates CRC tumori-
significantly fewer and smaller visible tumors and micro-                   genesis in vivo.
adenomas within their colons than did control scramble-
treated mice (ApcMin/+-Ctrl) (Fig. 6b, c, l). In addition,                  Upregulation of SMARCA4 positively correlates with
the survival rate was significantly higher in ApcMin/+-                     expression of EGFR and TNS4 in CRC and is associated
PRMT1KD mice than in ApcMin/+-Ctrl mice (Fig. 6d). As                       with poor prognosis of CRC patients
expected, colon tissues from ApcMin/+-PRMT1KD mice                          To investigate the clinical significance of SMARCA4 ex-
had reduced expression of TNS4 and EGFR genes                               pression in patients with CRC, we examined the protein
(Fig. 6e, f).                                                               expression profile of SMARCA4 in human CRC
Yao et al. Genome Medicine (2021) 13:58 Page 16 of 21 specimens and adjacent normal colon tissues. Consistent all CRC samples analyzed (Fig. 7d). These results indi- with previous observations from other groups [58–60], cate that SMARCA4 expression levels are upregulated in the immunohistochemical analysis showed significant human colorectal cancer tissues and correlate with poor upregulation of SMARCA4 expression in human CRC prognosis in colorectal cancer, indicating that SMAR specimens compared to normal tissues (Fig. 7a). Inter- CA4 may positively regulate TNS4 and EGFR expression estingly, SMARCA4 expression correlated with tumor to promote CRC proliferation during colorectal cancer size (Fig. 7b), although differences in tumor grade, TNM progression. stage, or lymph node metastasis were not significant (Additional file 2: Table S1). Kaplan–Meier survival ana- Discussion lysis showed that CRC patients with high levels of The methylation of arginine residues is catalyzed pri- SMARCA4 expression had shorter overall survival than marily by members of the protein arginine methyltrans- other CRC patients (Fig. 7c). Notably, the expression of ferase family, of which PRMT1 is the predominant PRMT1 and TNS4, PRMT1 and EGFR, SMARCA4 and member in mammalian cells [61]. Numerous studies TNS4, and SMARCA4 and EGFR correlated well across have addressed the regulatory mechanisms and roles of Fig. 7 Upregulation of SMARCA4 positively correlates with expression of EGFR and TNS4 and is associated with poor prognosis of CRC patients. a Hematoxylin and eosin (H&E) staining and IHC staining of SMARCA4 protein in adjacent normal colon tissue controls (NAT) and colorectal cancer (CRC) in human tissues. Representative micrographs are shown in original magnification (× 200) as indicated (left); total IHC score of SMAR CA4 in NAT and CRC tissues (n = 90); **P < 0.01 (right). Scale bar, 50 μm. b Correlation of SMARCA4 expression and tumor size in CRC patients; *P < 0.05. c Kaplan–Meier plot of overall survival of 90 patients with colorectal cancer, stratified by SMARCA4 expression; log-rank test, P < 0.0001. d Pearson correlation scatter plot of H scores of PRMT1 or SMARCA4, and TNS4 or EGFR in human colorectal cancer (n = 90)
You can also read