Dynamic changes in the urine proteome in two ovarian cancer rat models
←
→
Page content transcription
If your browser does not render page correctly, please read the page content below
bioRxiv preprint first posted online Apr. 10, 2019; doi: http://dx.doi.org/10.1101/604850. The copyright holder for this preprint
(which was not peer-reviewed) is the author/funder, who has granted bioRxiv a license to display the preprint in perpetuity.
                                    All rights reserved. No reuse allowed without permission.

             Dynamic changes in the urine proteome in two ovarian cancer

                                                             rat models

          Yuqiu Li 1,2, Linpei Zhang1,2, Wenshu Meng 1,2, Youhe Gao *1,2

          1. Department of Biochemistry and Molecular Biology, Beijing Normal University, Beijing 100875;
          2. Gene Engineering Drug and Biotechnology Beijing Key Laboratory, Beijing 100875
          *Corresponding author: Youhe Gao
          Email: gaoyouhe@bnu.edu.cn
          Phone: 86-10-5880-4382; Fax: 86-10-6521-2284

          Abstract: Ovarian cancer is the most lethal gynecological malignancy in women, and it is likely to
          metastasize and has a poor prognosis. The early and reliable diagnosis and monitoring of ovarian
          cancer is very important. Without a homeostasis mechanism, urine can reflect early systemic changes
          in the body and has a great potential to be used for the early detection of cancer. This study tested
          whether early changes could be detected in two ovarian cancer rat models. Two rat models were
          established by either intraperitoneal (i.p.) or orthotopic (o.t.) injection of NuTu-19 ovarian cancer cells
          in female Fischer344 rats. Urine samples from ovarian cancer rats were collected at five time points
          during cancer development, and urinary proteins from the rats were profiled by liquid chromatography
          coupled with tandem mass spectrometry (LC-MS/MS). Compared with pre-injection samples, 49
          differential proteins that have human orthologues were significantly changed in the orthotopically
          injected model. Among them, 24 of the differential proteins have previously been reported to be
          associated with ovarian cancer, six of which were reported to be biomarkers of ovarian cancer. On the
          7th day after orthotopic injection, four differential proteins (APOA1, OX2G, CHMP5, HEXB) were
          identified before obvious metastases appeared. In the intraperitoneal injection model, 76 differential
          proteins were changed during the course of ovarian cancer development. The results show that urine
          proteins could enable the early detection and monitoring of ovarian cancer progression and could lay a
          foundation for further exploration of the biomarkers of ovarian cancer.
          Keywords: Ovarian cancer; Proteomics; Urine; Biomarkers; Animal

          1. Introduction
                Ovarian cancer (OC) is the most lethal gynecological malignancy and it is the fifth leading cause
          of cancer death in women[1], mainly because OC can spread to intraperitoneal tissues, such as the
          omentum in the peritoneal cavity, by the time of diagnosis[2]. The strongest risk factors for this disease
          are an advanced age and a family history of ovarian cancer. Epithelial ovarian cancer (EOC) is the most
          common ovarian malignancy and comprises 90% of all ovarian cancers[3]. More than 75% of affected
          women ovarian carcinomas are not diagnosed until a late stage (stage III or IV) because early-stage
          disease is not obvious and early symptoms, as well as symptoms of late-stage disease, are nonspecific.
          Pelvic or abdominal pain, a feeling of pelvic mass and abdominal swelling are the main clinical
          symptoms, but these are not specific to OC[4]. Currently, women who have symptoms consistent with
          ovarian cancer usually undergo a physical examination, transvaginal ultrasonography, and
          measurement of biomarkers such as CA125, but imaging and serum biomarkers tests are of limited

                                                                       1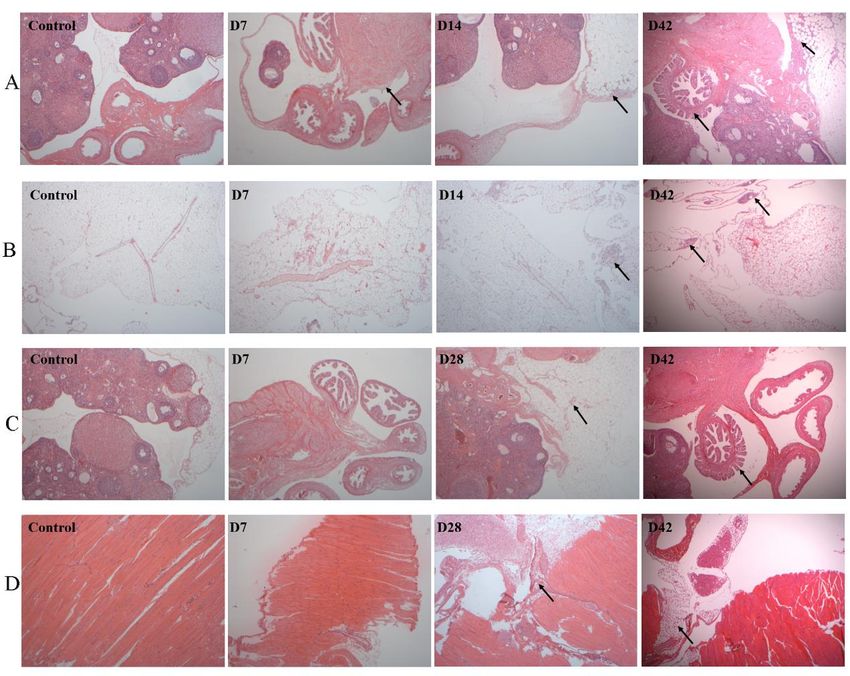
bioRxiv preprint first posted online Apr. 10, 2019; doi: http://dx.doi.org/10.1101/604850. The copyright holder for this preprint
(which was not peer-reviewed) is the author/funder, who has granted bioRxiv a license to display the preprint in perpetuity.
                                    All rights reserved. No reuse allowed without permission.

          value in the early diagnosis of the ovarian carcinomas[5]. The treatment of ovarian cancer usually
          involves surgery and intraperitoneal and intravenous chemotherapy[6]. At present, patients are typically
          diagnosed at the advanced stage when the cancer has disseminated within the peritoneal cavity, and
          complete surgical removal is impossible[3]. An early diagnosis is important, since the five-year survival
          rate for women diagnosed with stage I epithelial ovarian cancer is over 90% compared with a 25%
          five-year survival rate for stages III and IV[4]. An early diagnosis when tumors are small and still
          confined to the ovaries is the most important prognostic factor[6]. Therefore, early detection and cancer
          screening have the potential to decrease the mortality and morbidity of this cancer. If diagnosed earlier,
          effective measures would be used to prevent the development of ovarian cancer. Because of the variety
          of the pathology and an unclear mechanism and etiology, there are currently no tumor markers with
          both high specificity and sensitivity that could be applied to the early clinical diagnosis of ovarian
          cancer[2]. Thus, the problem of how to detect and diagnose ovarian cancer with better sensitivity in the
          early stages need to be urgently addressed. A novel systematic method with high sensitivity and
          specificity for the early diagnosis of OC and new ovarian cancer markers need to be identified.
                Biomarkers are measurable changes related to physiological or pathological processes [7]. Without
          a homeostasis mechanism, urine can sensitively reflect early changes in the body and has the potential
          to be used for the early detection of cancer. Technology advances in urinary proteomics have allowed it
          to play a significant role in tumor biomarker discovery[8]. Candidate biomarkers of different diseases
          have been detected in urine, and some of these biomarkers even perform better in urine than in serum
          [9]
             . We investigated whether the urinary proteome could reflect early changes in and the development of
          ovarian cancer. The urine accommodates a variety of changes, and urinary proteins were found to be
          associated with gender, age, diet, exercise, hormone status and other physiological conditions[10].
          Previous studies have identified several biomarkers in the clinical urine samples of women with
          ovarian cancer, including HE4[11], eosinophil-derived neurotoxin, a fragment of osteopontin[12],
          mesothelin[9] and Bcl-2[13]. Most of the collected clinical samples were from advanced cancer stages.
          Using clinical samples to find early biomarkers requires a large number of early-stage samples to
          balance the population and individual differences, which requires much time and carries a high cost.
          However, using simple animal models to study urine biomarkers can reduce the sample complexity,
          and it is also possible to monitor the process of disease development and observe related physiological
          changes in the early stages of the disease for early diagnosis[14]. Experimental models are crucial to
          understanding the biological factors that influence the phenotypic characteristics of the disease [15]. A
          research model that enables a focus on early-stage disease would prove beneficial. Biomarker research
          using animal models has been conducted to study various diseases, including obstructive
          nephropathy[16], pulmonary fibrosis[17], hepatic fibrosis[18], myocarditis[19] and glomerular diseases[20],
          chronic pancreatitis[21], Alzheimer’s disease[22], and subcutaneous tumors [23]. These studies have found
          potential urinary biomarkers in the early stages of diseases by applying proteomic technology.
                Epithelial ovarian cancer has four common subtypes: serous, endometrioid, clear cell, and
          mucinous carcinoma[24]. NuTu-19 is a surface epithelial cell line derived from serous epithelial ovarian
          cancer of Fischer 344 (F344) rats that underwent spontaneous malignant transformation in vitro. It was
          reported that the NuTu-19 cell line was injected into naive, immunocompetent F344 rats to determine
          tumor growth and animal survival[25]. This was a spontaneously arising, nonimmunogenic,
          experimental animal model of epithelial ovarian cancer that has the ability to mimic the development of
          ovarian cancer.
                Ovarian cancer is more likely to metastasize via intraperitoneal dissemination than by

                                                                       2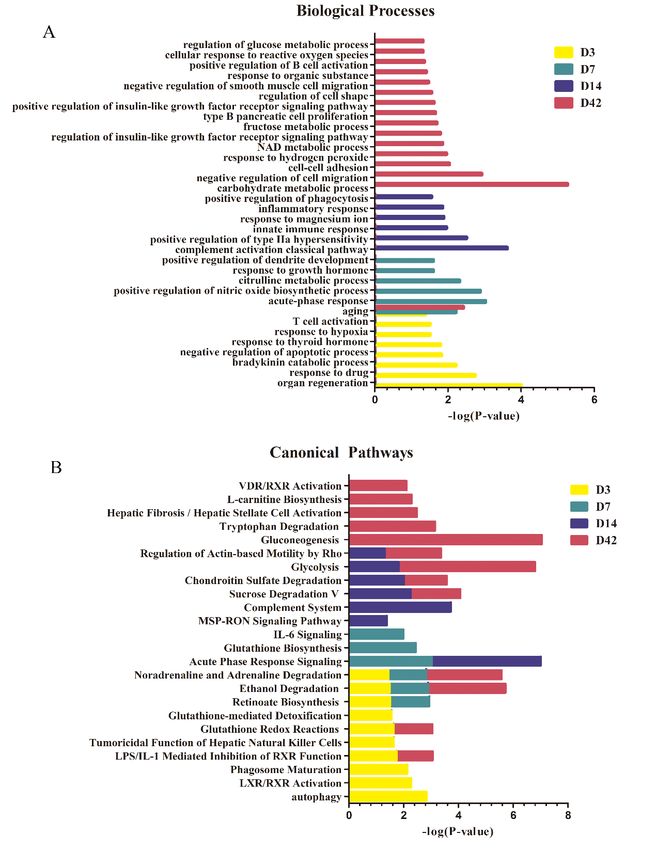
bioRxiv preprint first posted online Apr. 10, 2019; doi: http://dx.doi.org/10.1101/604850. The copyright holder for this preprint
(which was not peer-reviewed) is the author/funder, who has granted bioRxiv a license to display the preprint in perpetuity.
                                    All rights reserved. No reuse allowed without permission.

          hematogenous metastasis. Intraperitoneal spread appears to be an early event, which is why these
          cancers are only rarely detected at an early stage [26]. The physiological movement of ovarian cancer
          cells from the primary tumor to the peritoneum and omentum, as well as the direct expansion of tumor
          lesions to adjacent organs, has widely been recognized as the most common metastatic route of
          epithelial ovarian cancer[27]. One model utilizes the intraperitoneal injection of NuTu-19 cells in
          immunocompetent F344 rats. This is an inexpensive, reproducible and efficient preclinical model in
          which to study ovarian peritoneal carcinomatosis[28]. NuTu-19 cells injected intraperitoneally can grow
          progressively as numerous serosal nodules, exhibit local tissue invasion and form malignant ascites in a
          manner typical of human ovarian epithelial carcinomas[25]. This syngeneic model, which directly
          introduces the ovarian cancer cells into the peritoneum immediately produces extrapelvic extension
          that quickly creates metastases that resemble the spreading found in the late stages of the disease[29]. In
          addition, a previous study showed used a modified approach to combine surgical orthotopic
          implantation techniques with the syngeneic NuTu-19 cells. This created a novel model that initiates a
          primary lesion within the inherent microenvironment to mimic the early stages and natural progression
          of primary ovarian cancer[30]. The orthotopic model is more similar to the clinical process of human
          ovarian cancer. It offers a clinically relevant alternative for primary ovarian cancer research that
          enables the investigation of an early diagnosis for this disease process.
                In the current study, we attempted to answer the following questions: 1) Can urine proteins
          sensitively reflect the disease progression at various stages of ovarian peritoneal carcinomatosis or
          abdominal metastasis of cancer? 2) Can urinary proteins sensitively reflect early changes in early-stage
          primary ovarian cancer, and how could the urinary biomarkers before metastasis of the ovarian cancer
          be characterized for early diagnosis? We analyzed the urinary proteome in two ovarian cancer rat
          models by using LC-MS/MS. The workflow of the urinary proteomics analysis is shown in Fig. 1. Our
          aim was to identify differential urinary proteins associated with disease progression and early lesions
          and to provide some clues for monitoring the disease and early diagnosis of ovarian cancer.

          Fig. 1. The urinary proteome analysis workflow in ovarian cancer rats. Urine samples were collected in each
          phase, and histological analyses of the ovaries and other organs were conducted. Urinary proteins were identified
          at five time points by LC-MS/MS.

                                                                       3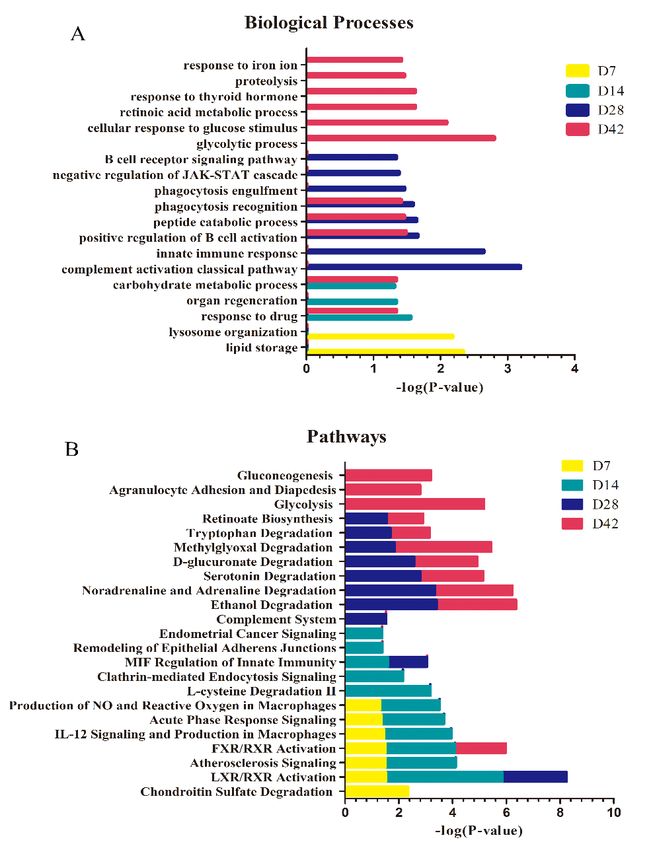
bioRxiv preprint first posted online Apr. 10, 2019; doi: http://dx.doi.org/10.1101/604850. The copyright holder for this preprint
(which was not peer-reviewed) is the author/funder, who has granted bioRxiv a license to display the preprint in perpetuity.
                                    All rights reserved. No reuse allowed without permission.

          2. Materials and methods
          2.1 NuTu-19 cell line and establishment of ovarian cancer rat models
                The cell line NuTu-19 was derived from epithelial ovarian cancer of F344 female rats (type:
          MXC290, brand: ATCC) and was purchased from Shanghai Meixuan Biotechnology Co., Ltd.
          (Meixuan, China). The cells were maintained in Roswell Park Memorial Institute (RPMI-1640) media
          (Corning, USA) supplemented with 1% penicillin–streptomycin and 10% fetal bovine serum (Gibco,
          USA) in an atmosphere of 95% air and 5% CO2 at 37 °C and passaged when they reached
          approximately 80% confluency. The cells were subcultured with trypsin ethylene-diaminetetraacetic
          acid (EDTA) every other day at split ratios of 1:3. The NuTu-19 cells were harvested using trypsin–
          EDTA to generate a single-cell suspension using physiological saline; these cells were stained with
          trypan blue (BioWhittaker) and counted using a hemocytometer (American Optical, Buffalo, NY) to
          test cell viability and determine the viable concentration.
                Specific pathogen-free 6–8-week-old (100-120 g) female Fischer 344 (F344) rats (purchased from
          Vital River Laboratory Animal Technology Co., Ltd., China) were housed at a constant temperature and
          relative humidity, with a standard 12 h light/12 h dark cycle and in a standard environment (room
          temperature 22 ± 1 °C, humidity 65%-70%). The animals were acclimated to the animal room for 1
          week before experiments. The animal license number was SCXK (Beijing) 2016-0011. The rats were
          given ad libitum access to feed and water. The experiment in this study was approved by the
          Institutional Animal Care Use & Welfare Committee of the Institute of Basic Medical Sciences, Peking
          Union Medical College (Animal Welfare Assurance Number: ACUC-A02-2014-007).
                The NuTu-19 ovarian cancer cell line with intraperitoneal injection to induce an ovarian peritoneal
          carcinomatosis rat model was established as follows[25]: A total of 26 female F344 rats from the first
          batch were randomly divided into two groups: the control group (n=6) and the experimental group
          (n=20). Rats in the experimental group were intraperitoneally injected with 2.5×10⁶ NuTu-19 cells in a
          total volume of 0.5 ml by 1 ml sterile syringe (BD, China). At the same time, rats in the control group
          were given an intraperitoneal injection of 0.5 ml normal saline. The injection site was in the right lower
          quadrant. The rats were observed daily and weighed weekly.
                The orthotopic injection of NuTu-19 cells induced the primary ovarian cancer rat model that was
          established by the epithelial ovarian cancer line as follows[30]: A total of 28 female F344 rats from the
          second batch were randomly divided into two groups: the control group (n=6) and the experimental
          group (n=22). All rats were anesthetized by intraperitoneal injection of 20 mg/kg body weight of 2%
          pentobarbital sodium (Sinopharm Chemical Reagent Co., Ltd. China). The anesthetized F344 rats were
          fixed on the rat plate. After local disinfection, all subsequent procedures were conducted under aseptic
          conditions. In the middle of the lower abdomen and 1 cm above the pubic symphysis, the scalpel was
          longitudinally incised approximately 1.5 cm. When the right side ovary was fully exposed, carefully
          stabilized with surgical instruments, and 5 µl of suspension was injected with a microinjection needle
          (Shanghai Gaoge Company, China) under the right ovarian capsule. In the experimental group, using
          an orthotopic injection technique, the 2×10⁴ NuTu-19 cells in a total volume of 5 µl were inoculated
          just below the epithelial bursa surrounding of the ovary. In the control group, the rats were given 5 µl
          of normal saline solution by using an orthotopic injection technique. After the animals were awake,
          they were returned to the cage and each rat was intraperitoneally injected with 0.25 ml of 80,000 units
          of penicillin and kept in a clean environment. These rats were observed and weighed weekly.

          2.2 Histological analysis of ovarian cancer rats
                In the intraperitoneal (i.p.) model, nine rats in the experimental group and three rats in the control
                                                                       4
bioRxiv preprint first posted online Apr. 10, 2019; doi: http://dx.doi.org/10.1101/604850. The copyright holder for this preprint
(which was not peer-reviewed) is the author/funder, who has granted bioRxiv a license to display the preprint in perpetuity.
                                    All rights reserved. No reuse allowed without permission.

          group were randomly sacrificed per week after injection. The organs (ovaries, omentum, diaphragm,
          bowl and liver) of the experimental rats and control rats were harvested on the 7th, 14th, 28th and 42nd
          day after the intraperitoneal injection. On the 42nd day, all rats were sacrificed and the abdominal
          organs were taken for pathology. In the orthotopic (o.t.) model, some rats in the experimental group and
          rats in the control group were randomly sacrificed weekly after injection. On the 7th, 14th, 28th and
          42nd day after the orthotopic injection of cancer cells, various organs including implanted side ovary,
          unimplanted side ovary, omentum and diaphragm of rats in the control group and the experimental
          group were collected. All rats were sacrificed on the 42nd day, and the organs were harvested for
          histological and morphometric analysis. For histopathology, the abdominal organs were fixed in
          formalin (10%) and embedded in paraffin. The histopathological lesions and invasion were evaluated
          with H&E staining.

          2.3 Urine collection and sample preparation
                The urine of the experimental group was collected as a self-control urine sample one day before
          the model was established. Urine samples were collected from the experimental group twice per week
          for six weeks. Without any special treatment, the rats were individually placed in metabolic cages
          overnight for 12 h to collect urine. During the collection, no water or food was supplied to avoid urine
          contamination. After collection, the urine samples were stored at -80 °C. Urine samples from the
          experimental and control groups were centrifuged at 12,000g for 30 min at 4 °C to remove impurities
          and large cell debris. After removing the pellets, three volumes of prechilled ethanol were added and
          incubated at -20 °C for 2 h. After centrifugation, lysis buffer (8 mol/L urea, 2 mol/L thiourea, 50
          mmol/L Tris, and 25 mmol/L DTT) was used to dissolve the pellets, which were then centrifuged at
          12,000 g for 30 min at 4 °C. The supernatant containing the resulting protein extract was placed into a
          new tube. The protein concentration was determined by the Bradford assay.
                The urinary protein samples at different time points were digested using the filter-aided sample
                                            [31]
          preparation (FASP) method            . A 100 μg aliquot of protein was transferred into a 10 kDa filter device
          (Pall, Port Washington, NY, USA). After sequentially washing with UA (8 mol/L urea, 0.1 mol/L
          Tris-HCl, pH 8.5) and 25 mmol/L NH4HCO3. Briefly, the proteins were denatured by dithiothreitol
          (DTT, Sigma), alkylated by iodoacetamide (IAA, Sigma), and the samples were centrifuged at 14,000 g
          for 30 min at 18 °C, followed by washing once with UA and three times with 25 mmol/L NH4HCO3.
          The samples were digested with trypsin (Promega, USA) (enzyme-to-protein ratio of 1:50) at 37 °C
          overnight. The digested peptides were desalted using Oasis HLB cartridges (Waters, Milford, MA) and
          then dried by vacuum evaporation (Thermo Fisher Scientific, Bremen, Germany) and stored at -80 °C.

          2.4 LC-MS/MS analysis
                The peptide samples resulting from the above digestion were separated by an EASY-nLC 1200
          HPLC system (Thermo Fisher Scientific, USA). First, the digested peptides were dissolved in 0.1%
          formic acid to a concentration of 0.5 μg/μl, and the BCA assay was used to determine the peptide
          concentration. Next, 1 μg of peptides from an individual sample was loaded onto a trap column
          (Acclaim PepMap®100, 75 μm×100 mm, 2 μm, Nano Viper C18). The elution gradient was 5%-40%
          mobile phase B (mobile phase A: 0.1% formic acid; mobile phase B: 89.9% acetonitrile, column flow
          rate 0.3 μl/min) over 60 min. The peptides were analyzed by an Orbitrap Fusion Lumos Tribrid mass
          spectrometer (Thermo Fisher Scientific, USA)[32]. MS data were acquired in data-dependent acquisition
          mode using the following parameters. Survey MS scans were collected by the Orbitrap in a 350–1550
          m/z range and MS scans at a resolution of 120,000. For the MS/MS scan, the resolution was set at
          30,000 screening in Orbitrap, and the HCD collision energy was 30, charge-state, dynamic exclusion
                                                                       5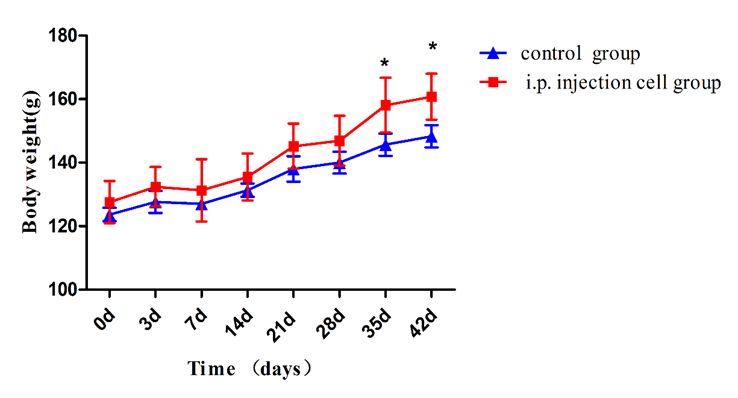
bioRxiv preprint first posted online Apr. 10, 2019; doi: http://dx.doi.org/10.1101/604850. The copyright holder for this preprint
(which was not peer-reviewed) is the author/funder, who has granted bioRxiv a license to display the preprint in perpetuity.
                                    All rights reserved. No reuse allowed without permission.

          (exclusion, duration 30 sec). Fifteen urine samples from three randomly selected i.p. injection-induced
          OC rats at five time points (on days 0, 3, 7, 14 and 42) were chosen for MS analysis. Additionally,
          twenty urine samples from three randomly selected o.t. injection-induced primary OC rats at five time
          points (on days 0, 7, 14, 28 and 42) were chosen for MS analysis. Two technical replicate analyses
          were performed for each urine sample.

          2.5 Label-free proteome quantification and data processing
                    All MS data were processed using Proteome Discoverer (PD) software (version 2.4.1, Matrix
          Science, London, UK), and then MS data were searched using Mascot Daemon software (version 2.5.1,
          Matrix Science, UK) with the SwissProt_2017_02 database (taxonomy: Rattus; containing 7992
          sequences). The search parameters were set as follows: The parent ion tolerance was set to 10 ppm, and
          the fragment ion mass tolerance was set to 0.05 Da; the carbamidomethyl of cysteine was set as a fixed
          modification; the oxidation of methionine was considered a variable modification; trypsin digestion
          was selected; and two sites of leaky cutting were allowed. The peptide and protein identifications were
          further validated using Scaffold (version 4.4.6, Proteome Software Inc., Portland, Oregon, USA). The
          setting conditions were as follows: Protein identification required a confidence score ≥ 95%; protein
          identifications were accepted at an FDR less than 1.0%; each protein contained at least 2 unique
          peptides; and spectral counting was used to compare protein abundance between different time points
          [33,34]
                    .
                    In the i.p.-induced OC rat model, the proteins identified on the 3rd, 7th, 14th and 42nd day were
          compared with those from day 0. In the o.t.-induced OC rat model, the proteins identified on days 7, 14,
          28 and 42 were compared with those from day 0. The changed urinary proteins were defined as those
          with a p value < 0.05 by a two-sided, unpaired t-test and a fold change >1.5 in the experimental groups
          when separately compared with self-control samples. Briefly, the differential proteins were selected
          with the following criteria: Each protein contained at least 2 unique peptides; fold change in the
          increased group ≥1.5 and fold change in the decreased group ≤0.67; and P < 0.05 by independent
          sample t-test. Moreover, the differential proteins at each time point showed a consistent trend in each
          experimental rat at that time point. Group differences resulting in P < 0.05 were identified as
          statistically significant. The statistical analysis was performed with GraphPad Prism version 5.0
          (GraphPad, San Diego, CA).

          2.6 Functional analysis of differential proteins
                    DAVID 6.8 (https://david.ncifcrf.gov/) was used to characterize the functional annotation of the
          differential urinary proteins identified at different time points in the i.p. and o.t. injection models. The
          detailed annotation included the biological process. All identified proteins were also analyzed by
          Ingenuity Pathway Analysis (IPA) software to enable a detailed annotation regarding canonical
          pathways.

          3. Results and discussion
          3.1.1 Characterization of the intraperitoneal injection ovarian cancer rat model
                    Rats in the control group had normal body weights. The body weight changes of the rats are
          shown in Fig. 2. After the 35th day after cell injection, the body weights of the intraperitoneal injection
          group were increased compared to those of the control group, and there was a significant difference.
          The weight change of the experimental rats may have been due to the presence of bloody ascites in the
          experimental group in the advanced stages of the disease. On the 35th day after intraperitoneal

                                                                       6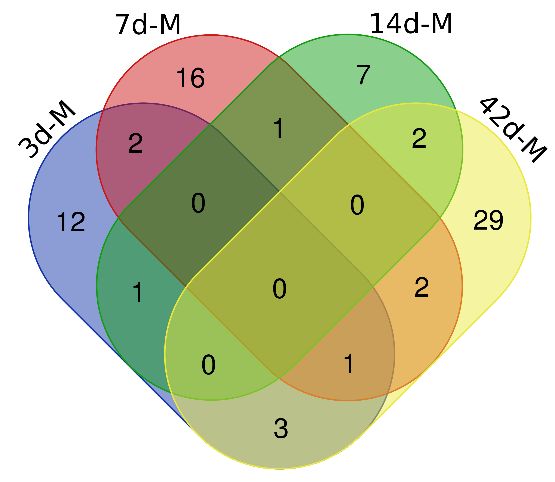
bioRxiv preprint first posted online Apr. 10, 2019; doi: http://dx.doi.org/10.1101/604850. The copyright holder for this preprint
(which was not peer-reviewed) is the author/funder, who has granted bioRxiv a license to display the preprint in perpetuity.
                                    All rights reserved. No reuse allowed without permission.

          injection, some experimental rats of the i.p. injection group showed a reduced consumption of drinking
          water, rough hair, and the gradual appearance of abdominal distension. On the 42nd day after
          intraperitoneal injection, there were obvious symptoms, such as frog-like abdomen distension, pale
          auricle, and anemia. Upon dissection, numerous tumor nodules were found in the abdominal cavity,
          along with omental contraction. The surfaces of the ovary, diaphragm, liver and bowl were covered
          with cancer cells, and a large amount of malignant bloody ascites was present.

          Fig. 2. Changes in rat body weight during the intraperitoneally injected NuTu-19 cell experiment. The red
          line indicates the control group, and the blue line indicates the intraperitoneal NuTu-19 ovarian cancer cell group.
          * indicates P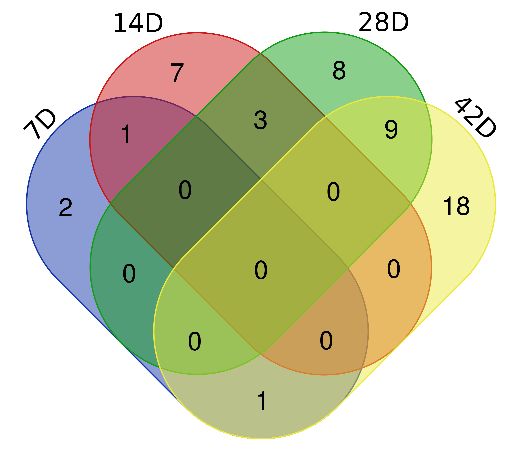
bioRxiv preprint first posted online Apr. 10, 2019; doi: http://dx.doi.org/10.1101/604850. The copyright holder for this preprint
(which was not peer-reviewed) is the author/funder, who has granted bioRxiv a license to display the preprint in perpetuity.
                                    All rights reserved. No reuse allowed without permission.

          Fig. 3. Histopathological characterization of organs in the NuTu-19 cell intraperitoneal injection rat model
          (40×). Organs were collected and prepared for microscopic examination using hematoxylin & eosin (H&E) stain.
          Metastases were identified in the A) omentum, B) ovaries, C) diaphragm, D) bowel, and F) liver. Each black arrow
          denotes the location of the metastasis in the tissue section.

          3.1.2 Urine proteome changes in NuTu-19 cell intraperitoneal-injection OC model
                To investigate how the urine proteome changes after the intraperitoneal injection of NuTu-19
          ovarian cancer cells, urine samples collected at five time points (days 0, 3, 7, 14 and 42) from three
          experimental rats were analyzed by LC-MS/MS. In total, 577 urinary proteins were identified and are
          listed in Table S1. Among these, 76 differential proteins that had human orthologues were evaluated
          and were found to be significantly changed in the three rats (fold change ≥1.5 or ≤0.67, P < 0.05; Table
          1). On the 3rd day, nineteen differential proteins were identified, two of which increased and seventeen
          of which decreased. On the 7th day, twenty-two differential proteins were identified, thirteen of which
          increased and nine of which decreased. On the 14th day, eleven differential proteins were identified, six
          of which increased and five of which decreased. On the 42nd day, thirty-seven differential proteins
          were identified, three of which increased and thirty-four of which decreased. Details of the differential
          proteins are presented in Table S2. Thirteen differential proteins were repeatedly identified at no less
          than one time point (Fig. 4), and the trend of the differential proteins was consistent at each time point
          in each rat. On the 3rd and 7th day, no obvious metastasis of the cancer tissue was found in the
          pathology of the abdominal organs, and 19 and 22 differential proteins were respectively identified in
                                                                       8
bioRxiv preprint first posted online Apr. 10, 2019; doi: http://dx.doi.org/10.1101/604850. The copyright holder for this preprint
(which was not peer-reviewed) is the author/funder, who has granted bioRxiv a license to display the preprint in perpetuity.
All rights reserved. No reuse allowed without permission.
the urine. Among the 76 differential proteins, 53 are reported to be associated with cancer.
Twenty-three proteins have been reported to be closely related to ovarian cancer and related diseases.
Nine proteins have been reported as biomarkers of ovarian cancer. The urine protein profile also
changed significantly as the NuTu-19 cell ovarian cancer cell proliferation in the abdominal cavity
progressed.
Fig. 4. Venn diagram of the differential urinary proteins identified on days 3, 7, 14 and 42 after
intraperitoneal injection of NuTu-19 cells.
Table 1
Differential urinary proteins in intraperitoneal injection NuTu-19 cell OC rats.
Fold change Reported to be
Accession Protein name Trend P value related to ovarian
0d 3d 7d 14d 42d
cancer
Q1WIM1 Cell adhesion molecule 4(CADM4) ↑ 1 1.77 — — — 3.94E-02 tissue, serum[36]
P06757 Alcohol dehydrogenase 1 (ADH1) ↑ 1 1.54 2.04 — — 3.14E-02 tissue[37]
Q6P734 Plasma protease C1 inhibitor (IC1) ↓ 1 0.66 — 0.62 — 2.11E-03
O70535 Leukemia inhibitory factor receptor (LIFR) ↓ 1 0.64 — — — 3.25E-02
P04906 Glutathione S-transferase P(GSTP1) ↓ 0.62 — — 0.50 2.41E-02 tissue[38]
P13852 Major prion protein(PRIO) ↓ 1 0.59 — — — 3.52E-02
P43303 Interleukin-1 receptor type 2 (IL1R2) ↓ 1 0.58 — — — 7.49E-03 tissue[39]
B5DFC9 Nidogen-2 (NID2) ↓ 1 0.58 — — — 1.38E-03 tissue[40]
Q63556 Serine protease inhibitor A3M(SPA3M) ↓ 1 0.58 — — — 3.48E-04
P00786 Pro-cathepsin H (CATH) ↓ 1 0.57 0.50 — — 5.90E-03
P47820 Angiotensin-converting enzyme(ACE) ↓ 1 0.55 — — — 2.73E-02 serum[41,42]
Q06000 Lipoprotein lipase (LIPL) ↓ 1 0.53 — — — 1.78E-02
O35331 Pyridoxal kinase (PDXK) ↓ 1 0.50 — — 0.00 2.57E-02
Q7TPB4 CD276 antigen (CD276) ↓ 1 0.46 — — — 2.49E-02
P14668 Annexin A5 (ANXA5) ↓ 1 0.43 — — — 3.90E-02
Q63083 Nucleobindin-1 (NUCB1) ↓ 1 0.43 0.55 — 0.37 2.24E-02
Q00238 Intercellular adhesion molecule 1(ICAM1) ↓ 1 0.37 — — — 2.66E-02 tissue[43]
Q80YN4 Atrial natriuretic peptide-converting enzyme(CORIN) ↓ 1 0.25 — — — 1.46E-02
Q920P6 Adenosine deaminase (ADA) ↓ 1 0.00 — — 0.00 2.89E-03 serum, acite [44]
N(G), N(G)-dimethylarginine dimethylamino hydrolase 1
O08557 ↑ 1 — 7.00 — — 3.27E-02
(DDAH1)
9bioRxiv preprint first posted online Apr. 10, 2019; doi: http://dx.doi.org/10.1101/604850. The copyright holder for this preprint
(which was not peer-reviewed) is the author/funder, who has granted bioRxiv a license to display the preprint in perpetuity.
All rights reserved. No reuse allowed without permission.
Q8VIF7 Methanethiol oxidase (SBP1) ↑ 1 — 4.00 — — 2.13E-02
Q63530 Phosphotriesterase-related protein (PTER) ↑ 1 — 3.75 — — 1.42E-02
P50399 Rab GDP dissociation inhibitor beta (GDIB) ↑ 1 — 3.67 — — 1.14E-02
Q9WTW7 Solute carrier family 23 member 1(S23A1) ↑ 1 — 2.78 — — 3.90E-02
Q91XT9 Neutral ceramidase (ASAH2) ↑ 1 — 2.50 — — 2.13E-02
P09034 Argininosuccinate synthase (ASSY) ↑ 1 — 2.00 — — 4.81E-03 tissue[45]
Q6AYT0 Quinone oxidoreductase (QOR) ↑ 1 — 1.88 — — 3.13E-02 Cell, tissue[46]
Q5RLM2 Solute carrier family 22 member 7 (S22A7) ↑ 1 — 1.74 — — 4.88E-02
Q9JJ40 Na (+)/H (+) exchange regulatory cofactor (NHRF3) ↑ 1 — 1.70 — — 3.84E-02
P19468 Glutamate--cysteine ligase catalytic subunit (GSH1) ↑ 1 — 1.54 — — 2.55E-02 tissue[47]
Q64319 Neutral and basic amino acid transport protein rBAT (SLC31) ↑ 1 — 1.51 — — 2.22E-02
P48199 C-reactive protein (CRP) ↓ 1 — 0.66 — — 2.75E-02 serum[48]
Q63621 Interleukin-1 receptor accessory protein (IL1AP) ↓ 1 — 0.54 — — 3.14E-02
P06866 Haptoglobin chain (HPT) ↓ 1 — 0.52 0.52 — 1.57E-02 serum[49]
Q9EQV6 Tripeptidyl-peptidase 1 (TPP-1) ↓ 1 — 0.50 — 0.50 2.95E-02
Q6IG02 Keratin(K22E) ↓ 1 — 0.46 — — 2.49E-02
P07171 Cabining (CALB1) ↓ 1 — 0.26 — 0.00 1.32E-02 tissue[50]
P26772 10 kDa heat shock protein (CH10) ↓ 1 — 0.17 — — 1.94E-02
Q91ZS3 45 kDa calcium-binding protein (CAB45) ↑ 1 — — 12.0 — 3.80E-02
Q32KJ6 N-acetylgalactosamine-6-sulfatase (GALNS) ↑ 1 — — 2.14 — 3.90E-02
P20759 Ig gamma-1 chain C region (IGHG1) ↑ 1 — — 1.86 2.77 2.52E-02
Q6AYS7 Aminoacylase-1A (ACY1A) ↑ 1 — — 1.84 — 4.51E-02
P48500 Triosephosphate isomerase (TPIS) ↑ 1 — — 1.58 — 1.20E-02 tissue[51]
Q00657 Chondroitin sulfate proteoglycan 4 (CSPG4) ↑ 1 — — 1.52 — 3.36E-02
Q63678 Zinc-alpha-2-glycoprotein (ZA2G) ↓ 1 — — 0.64 — 2.32E-02
P62963 Profilin-1 (PROF1) ↓ 1 — — 0.63 0.33 3.41E-02 tissue[52]
P01026 Complement C3 (CO3) ↓ 1 — — 0.61 — 1.05E-02 tissue[53]
P20760 Ig gamma-2A chain C region (IGG2A) ↑ 1 — — — 1.99 1.91E-02
P22057 Prostaglandin-H2 D-isomerase (PTGDS) ↑ 1 — — — 1.63 1.79E-02
P05544 Serine protease inhibitor A3L(SPA3L) ↓ 1 — — — 0.64 9.10E-03
P05545 Serine protease inhibitor A3K (SPA3K) ↓ 1 — — — 0.62 2.53E-03
P80067 Dipeptidyl peptidase 1(CATC) ↓ 1 — — — 0.61 7.63E-03
O70513 Galectin-3-binding protein (LG3BP) ↓ 1 — — — 0.54 4.70E-02 exosome[54]
P04797 Glyceraldehyde-3-phosphate dehydrogenase (G3P) ↓ 1 — — — 0.53 2.70E-02 tissue[55]
Q9JJ19 Na (+)/H (+) exchange regulatory cofactor (NHRF1) ↓ 1 — — — 0.51 1.17E-02
Q02974 Ketohexokinase (KHK) ↓ 1 — — — 0.50 7.76E-03
P04642 L-lactate dehydrogenase A chain (LDH-A) ↓ 1 — — — 0.47 1.61E-02
O88989 Malate dehydrogenase, cytoplasmic (MDHC) ↓ 1 — — — 0.45 4.53E-02
Q99MA2 Xaa-Pro aminopeptidase 2(XPP2) ↓ 1 — — — 0.43 4.23E-02
P15473 Insulin-like growth factor-binding protein 3 (IBP-3) ↓ 1 — — — 0.38 4.74E-02
Q6AXR4 Beta-hexosaminidase subunit beta (HEXB) ↓ 1 — — — 0.36 2.59E-02
Q07936 Annexin A2 (ANXA2) ↓ 1 — — — 0.33 8.05E-03 tissue[56]
P24594 Insulin-like growth factor-binding protein 5 (IBP5) ↓ 1 — — — 0.33 3.90E-02
P97574 Stanniocalcin-1 (STC-1) ↓ 1 — — — 0.32 1.76E-03
10bioRxiv preprint first posted online Apr. 10, 2019; doi: http://dx.doi.org/10.1101/604850. The copyright holder for this preprint
(which was not peer-reviewed) is the author/funder, who has granted bioRxiv a license to display the preprint in perpetuity.
All rights reserved. No reuse allowed without permission.
Q5XI73 Rho GDP-dissociation inhibitor 1 (GDIR1) ↓ 1 — — — 0.32 3.53E-02
Q9R066 Coxsackievirus and adenovirus receptor homolog (CXAR) ↓ 1 — — — 0.28 5.59E-03
P04764 Alpha-enolase (ENOA) ↓ 1 — — — 0.27 8.29E-03 tissue[51]
P20786 Platelet-derived growth factor receptor alpha (PGFRA) ↓ 1 — — — 0.27 3.29E-02 tissue[57]
Q4FZV0 Beta-mannosidase (MANBA) ↓ 1 — — — 0.26 1.14E-02
P57097 Tyrosine-protein kinase (MERTK) ↓ 1 — — — 0.25 2.13E-02
P19112 Fructose-1,6-bisphosphatase 1(F16P1) ↓ 1 — — — 0.21 2.85E-02
P51635 Alcohol dehydrogenase [NADP (+)] (AK1A1) ↓ 1 — — — 0.18 1.51E-04
Q9JLJ3 4-trimethylaminobutyraldehyde dehydrogenase (AL9A1) ↓ 1 — — — 0.08 3.27E-02
Q62638 Golgi apparatus protein 1(GSLG1) ↓ 1 — — — 0.07 1.52E-05
O88767 Protein/nucleic acid deglycase DJ-1 (PARK7) ↓ 1 — — — 0.07 1.14E-02
Q812E9 Neuronal membrane glycoprotein M6-a (GPM6A) ↓ 1 — — — 0.00 2.02E-04
— Indicates that the criteria, compared with day 0, were not met (fold change ≥2 or ≤0.5, P < 0.05).
Compared with the profiles before intraperitoneal injection, 19 differential proteins on the 3rd day
and 22 differential proteins on 7th day were significantly changed when there was no cancer cell
invasion in the pathology of rat abdominal organs, 17 of which were closely associated with ovarian
cancer. Four of these have been reported as biomarkers for ovarian cancer. Cell adhesion molecule
4(CADM4) is overexpressed in ovarian tumors, and its cleaved extracellular domain can be detected in
the serum of ovarian cancer patients. It is considered to be both a serum biomarker and a therapeutic
[36]
target for ovarian cancer . Alcohol dehydrogenase 1 (ADH) participates in the metabolism of some
biological substances, and its activity is typically increased in ovarian cancer, especially that of the
class I isoenzyme, which may be a factor for the metabolic disturbances of important biological
[37]
substances . It has been reported that intertumor differences in glutathione S-transferase P (GSTP1)
expression might influence the response to platinum-based chemotherapy in ovarian cancer patients [38].
Interleukin-1 receptor type 2 (IL1R2) is an important protector against the tumorigenic effects of IL-1
in ovarian cancer, and endometrioid ovarian cancer cells exhibit a specific decrease of IL1R2[39].
Nidogen-2 (NID2) is a new promising ovarian malignancy biomarker and is a screening and diagnostic
tool for ovarian cancer[58]. Serine protease inhibitor A3M (SPA3M) is a member of the serine protease
inhibitor superfamily that can regulate cell migration and cell matrix remodeling in cancer, and serine
[59]
protease inhibitor Kazal type 1 drives proliferation and anoikis resistance in some ovarian cancers .
Serum angiotensin-converting enzyme (ACE) levels are increased in patients with epithelial ovarian
cancer, and ACE was found to be the key peptidase of the renin-angiotensin system (RAS) that may be
associated with ongoing pathobiological events in ovarian carcinogenesis[42]. Intercellular adhesion
molecule 1 (ICAM1) is increased in serum samples of epithelial ovarian cancer patients and is
implicated in tumorigenesis and tumor progression[43]. Adenosine deaminase (ADA) levels were
found to be higher in the serum and peritoneal fluid of malignant ovarian neoplasm patients, and
ADA could be a useful biomarker in the diagnosis and management of ovarian cancer[44].
Argininosuccinate synthase (ASSY) is overexpressed in primary ovarian cancer and is regulated by
pro-inflammatory cytokines[45], and this trend was also found in our study. Quinone oxidoreductase
(QOR) is involved in inflammation and oxidative stress in the development of ovarian cancer[60]. It was
reported that overexpression of the glutamate-cysteine ligase catalytic subunit (GSH1) protects human
ovarian cancer cells against oxidative and gamma-radiation-induced cell death[47]. Neutral and basic
amino acid transport protein rBAT (SLC31) was reported to be a cysteine transporter and likely plays a
major role in the increase of GSH[61]. Serum C-reactive protein (CRP) is a widely used biomarker of
11bioRxiv preprint first posted online Apr. 10, 2019; doi: http://dx.doi.org/10.1101/604850. The copyright holder for this preprint
(which was not peer-reviewed) is the author/funder, who has granted bioRxiv a license to display the preprint in perpetuity.
All rights reserved. No reuse allowed without permission.
inflammation and has been previously shown to be a promising biomarker in patients with ovarian
cancer[48]. Haptoglobin (HPT) is a glycoprotein that regulates the immune response, and serum HPT
levels were found to be significantly higher in patients with advanced epithelial ovarian cancer (EOC)
with poor survival and were considered a potential biomarker of ovarian carcinoma[49,62]. Calbindin
(CALB1) is considered to be a mesothelial marker in ovarian cancer[50]. The abovementioned urine
proteins are closely associated with ovarian cancer and could be used for the detection and prognosis of
NuTu-19 cell metastasis progression. This indicates that urine proteomic data could reflect the
progression of ovarian cancer.
On the 14th day after intraperitoneal injection, the pathology showed that the omentum was
substantially invaded by NuTu-19 cells, and 11 differential proteins were identified in the urine. Among
them, three proteins have been reported to be involved in ovarian cancer metastasis and invasion. The
expression of triosephosphate isomerase (TPIS) was upregulated in ovarian cancers, and TPIS might
represent a biomarker for paclitaxel resistance in ovarian cancer[51]. Profilin-1 (PROF1) is differentially
expressed between early- and advanced-stage EOC patient tumor tissues, suggesting a clinical
relevance to disease progression, and it is considered as a key regulator of actin cytoskeleton/cell
adhesion and cell migration[52]. Complement C3 (CO3) is secreted by malignant epithelial cells and
promotes EMT in ovarian cancer [53].
On the 42nd day, the pathology results showed substantial tumor invasion and metastasis in the
omentum, ovary, diaphragm, intestine, and liver tissues. A total of 37 differential proteins were
identified in the urine, 10 of which have been reported to be involved in the invasion, metastasis and
metabolic disorders of ovarian cancer. Galectin-3-binding protein (LG3BP) is enriched in the
extracellular vesicles of the ovarian carcinoma and contains sialylated complex N-glycan; it is
considered to be a novel potential biomarker for ovarian cancer. Glyceraldehyde-3-phosphate
dehydrogenase (G3P) mediates apoptosis in ovarian cancer cells, and high G3P expression levels
indicate disease progression in advanced serous ovarian cancer [55,63]. These previous reports were
consistent with the changes in the urine proteins in the later stage of ovarian cancer in the current study.
It is reported that L-lactate dehydrogenase A chain (LDHA) is associated with the induction of ovarian
cancer cell apoptosis[64]. Malate dehydrogenase (MDHC) is found to be associated with an impaired
mitochondrial respiratory capacity in human ovarian and peritoneal cancer cells [65]. Annin A2 (ANXA2)
is overexpressed in carcinoma tissues compared with normal tissue and has a critical role in EOC cell
proliferation; it has the potential to be used as a novel therapeutic target for EOC[56]. Insulin-like
growth factor-binding protein 5 (IBP5) is overexpressed in high-grade serous carcinomas compared to
[66]
normal surface epithelium and might play a role in the development of this disease . Alpha-enolase
(ENOA) may be involved in the paclitaxel resistance of human ovarian cancer cells, and its expression
is higher in metastatic tumors than in primary tumors [51,67]. The increasing expression of platelet
derived growth factor receptor alpha (PGFRA) is found to be associated with a significantly poorer
overall survival of ovarian cancer patients[57]. The activity of alcohol dehydrogenase [NADP(+)]
(AK1A1) might be an important factor for the disturbances in the metabolism of biological substances
in ovarian cancer[37]. These urine proteins may indicate a metabolic disorder caused by bloody ascites
in the advanced stages (III, IV) of ovarian cancer.
Other differential proteins are found that have not yet been reported to be associated with ovarian
cancer but play important roles in the development, progression, migration, invasion and
epithelialization of cancer. These proteins may provide important clues regarding the metastasis and
invasion of ovarian cancer. For example, the 10 kDa heat shock protein (CH10) identified on days 7 is
12bioRxiv preprint first posted online Apr. 10, 2019; doi: http://dx.doi.org/10.1101/604850. The copyright holder for this preprint
(which was not peer-reviewed) is the author/funder, who has granted bioRxiv a license to display the preprint in perpetuity.
All rights reserved. No reuse allowed without permission.
also known as the cochaperone protein of Hsp60 during the protein folding process, and CH10 is an
immune-suppressive growth factor found in maternal serum[68]. The upregulated differential protein
calcium-binding protein (CAB45) (45 kDa) identified in urine on days 14 has been shown to regulate
cancer cell migration through various molecular mechanisms. Moreover, the overexpression of
CAB45 results in an altered expression of the molecular mediators of epithelial-mesenchymal
transition (EMT), and EMT is an important step in tumor metastasis[69]. Prostaglandin-H2D-isomerase
(PTGDS) is expressed abundantly in ovarian carcinoma and is regarded as a candidate biomarker for
the diagnosis of ovarian carcinoma [70].
3.1.3 Functional analysis of differential urine proteins in rats intraperitoneally injected with
NuTu-19 cells
The biological process functional annotation of the differential proteins found on the 7th, 14th,
28th and 42nd day in the intraperitoneal injection group was categorized using DAVID (Fig. 5A); the
functional analysis of the differential proteins was investigated using IPA software to explore the
biological pathways involved in these differential proteins (Fig. 5B). Seventy-six differential proteins
were annotated. Some biological processes were enriched by the differential proteins on the 3rd day.
Negative regulation of apoptotic processes and T-cell activation might play roles in cancer cell survival
and immunity during ovarian cancer progression. Responses to hypoxia synchronously induce tumor
VEGF production, and hypoxia-induced signals would be important factors for initiating and
maintaining an active synergistic angiogenic pathway mediated by VEGF in ovarian cancer [71]. The
biological processes include acute-phase response, positive regulation of nitric oxide biosynthetic
process, citrulline metabolic process response to growth hormones and positive regulation of dendrite
development, which were all enriched by the differential proteins on the 7th day. Furthermore, the
aging process was overrepresented on the 7th and 14th day. The differential proteins involved in
biological processes on the 14th day focused on immunoregulation, such as the complement activation
classical pathway, the positive regulation of type II hypersensitivity, the innate immune response, the
response to magnesium ions, the inflammatory response and the positive regulation of phagocytosis.
This indicated that the urine proteins could show a significant immune response on the 14th day after
the injection of tumor cells. In 80% of EOC patients, the cancer has usually spread to the omentum by
the time of diagnosis[35]. In the pathology findings of our study, the omentum was first invaded by on
day 14 in the model. The omentum is a lymphoid organ controlling the peritoneal cavity immune
response; omental adipocytes promote EOC metastasis by providing energy for rapid tumor growth
[35,72]
. The pathology changes in ovarian cancer corresponded to the changes in urinary proteins, which
suggests that urine could sensitively reflect the immune response process of cancer. The biological
processes of the differential proteins on the 42nd day include the carbohydrate metabolic process, the
response to hydrogen peroxide, the NAD metabolic process, the positive regulation of the insulin-like
growth factor receptor signaling pathway, cellular responses to reactive oxygen species and regulation
of the glucose metabolic process. Correspondingly, in the clinical symptoms, the rats in the
experimental group on the 42nd day showed cachexia and metabolic disorders, such as anemia, a
frog-like abdomen and bloody ascites. The pathological results showed that multiple organs, including
the omentum, diaphragm, ovaries, liver and bowl, harbored cancer metastases and invasion. It has been
suggested that urinary proteins can reflect the pathological and metabolic disorders of advanced
ovarian cancer. The biological processes of negative regulation of cell migration, the cell-cell adhesion
regulation of cell shape, and the negative regulation of smooth muscle cell migration are associated
with ovarian cancer tumorigenesis, and cell adhesion molecules have been reported to be induced
13bioRxiv preprint first posted online Apr. 10, 2019; doi: http://dx.doi.org/10.1101/604850. The copyright holder for this preprint
(which was not peer-reviewed) is the author/funder, who has granted bioRxiv a license to display the preprint in perpetuity.
All rights reserved. No reuse allowed without permission.
during the early progression of EOC to promote tumor cell migration[73].
Fig. 5. Functional analysis of differential proteins on the 3rd, 7th, 14th and 42nd day in rats
intraperitoneally injected with NuTu-19 cells. (A) Biological process; (B) Canonical pathway. (P < 0.05).
Recent evidence has suggested that ovarian cancer cells primary disseminate within the peritoneal
cavity and are only superficially invasive[27]. Intra-abdominal dissemination occurs at an early stage
and is hard to detect. The tumor microenvironment and the involved growth factors and cytokines
induced EMT through which tumor cells acquired explosive motility[26]. In the canonical pathways of
the intraperitoneal injection model, some pathways were closely related to the processes of ovarian
cancer, or other cancer, tumorigenesis and invasion.
14bioRxiv preprint first posted online Apr. 10, 2019; doi: http://dx.doi.org/10.1101/604850. The copyright holder for this preprint
(which was not peer-reviewed) is the author/funder, who has granted bioRxiv a license to display the preprint in perpetuity.
All rights reserved. No reuse allowed without permission.
Among the pathways in which the differential proteins were involved on the 3rd day, it was shown
that autophagy could be an effective cancer cell immune escape mechanism, and this mechanism has
been implicated in the development of resistance in a variety of cancer types [74]. The tumoricidal
function of hepatic natural killer cells is related to congenital lymphoid NK cells that have antitumor
defense functions, and this pathway mediated antitumor defenses and contributed to the activation and
orientation of adaptive immune responses[75]. Glutathione redox reactions and the glutathione mediated
detoxification pathway were enriched on the 3rd day, and the glutathione biosynthesis pathway was
enriched on the 7th day. GSH-activated T cells produce reactive oxygen species (ROS), which triggers
an antioxidant glutathione (GSH) response and prevents cell damage; the antioxidant GSH pathway is
critical for the inflammatory phase T-cell response by regulating metabolic activity[76]. The IL-6
signaling pathway was enriched on the 7th day. Interleukin-6 (IL-6) has been found to be an effective
pro-inflammatory cytokine and it plays an important role in the regulation of the immune system in
tumorigenesis. According to previous studies, IL-6 transduction is found to mediate tumor cell
proliferation and inhibited apoptosis[77]. In the MSP-RON signaling pathway (which was enriched on
day 28), increasing macrophage stimulating protein (MSP) signaling is elevated in approximately 40%
of breast cancers. The activation of the MSP signaling pathway in the bone microenvironment
promotes osteolytic bone metastasis[78]. The regulated pathway of actin-based movement by Rho was
coenriched on the 28th and 42nd days. Recent studies have suggested that the Rho/Rho-associated
protein kinases (ROCK) pathway plays a critical role in the regulation of cancer cell motility and
invasion, and controlling cell motility via the actin cytoskeleton creates the potential for regulating
tumor cell metastasis[79]. In the L-carnitine biosynthesis pathway (found on the 42nd day), L-carnitine
has a vital role in improving immune system cell function, especially in the lymphocytes, possibly
through its antioxidant action[80]. In the VDR/RXR activation pathway, RXR is a coactivator of the
retinoic acid receptor, and VDR is a vitamin D receptor. The VDR/RXR activation pathway regulates
gene expression through a series of metabolic pathways, including the immune response and tumor
activation pathways[81].
3.2.1 Characterization of orthotopically injected ovarian cancer rat model
After the NuTu-19 cells were orthotopically injected into the left side of the ovary, there were no
obvious clinical abnormalities in the experimental group. On the 35th day after injection, the
experimental group rats showed rough hair and a reduced diet, but no frog-like abdomen or bloody
ascites. Fig. 6 shows the changes in body weight of the o.t.-injected rats. Compared with the body
weights of the control rats, there were no significant differences in the body weights of the o.t.-injected
experimental group. This indicated that the primary ovarian cancer tumorigenesis was relatively hidden,
and any early-stage symptoms were not obvious. Moreover, it also showed that it is not easy to detect
ovarian cancer through changes in body weight, and changes in the urine could potentially be seen
before there were changes in body weight.
15bioRxiv preprint first posted online Apr. 10, 2019; doi: http://dx.doi.org/10.1101/604850. The copyright holder for this preprint
(which was not peer-reviewed) is the author/funder, who has granted bioRxiv a license to display the preprint in perpetuity.
All rights reserved. No reuse allowed without permission.
Fig. 6. Weight changes in the orthotopically injected ovarian cancer rat model.
The control group presented normal tissues. Histopathological examinations (H&E staining) of the
implanted side ovary, unimplanted side ovary, omentum and diaphragm of rats were performed to
reveal the progress of the NuTu-19 cells that were orthotopically injected. The control group showed
normal tissue results. On day 7 after o.t. injection, the results of the HE staining showed no tumor
metastasis of the o.t. group, and tumors were confined to the orthotopic injection side of the ovary
compared with the control group (Fig. 7). At 14 days after o.t. injection, there was slight tumor
metastasis of the omentum. Twenty-eight days after the injection, the implanted side ovary,
unimplanted side ovary (Fig. 7C) and the diaphragm (Fig. 7D) were also invaded by cancer cells. On
the 42nd day, the peritoneal organs such as the omentum, diaphragm and ovaries were seriously
invaded by tumor cells. Microscopically, the tumor cells were disordered and their size and shape were
abnormal. This was consistent with the pathological features of EOC. These pathological changes
indicated that the primary ovarian cancer rat model was successfully constructed via the o.t. injection
of NuTu-19 cells.
16bioRxiv preprint first posted online Apr. 10, 2019; doi: http://dx.doi.org/10.1101/604850. The copyright holder for this preprint
(which was not peer-reviewed) is the author/funder, who has granted bioRxiv a license to display the preprint in perpetuity.
All rights reserved. No reuse allowed without permission.
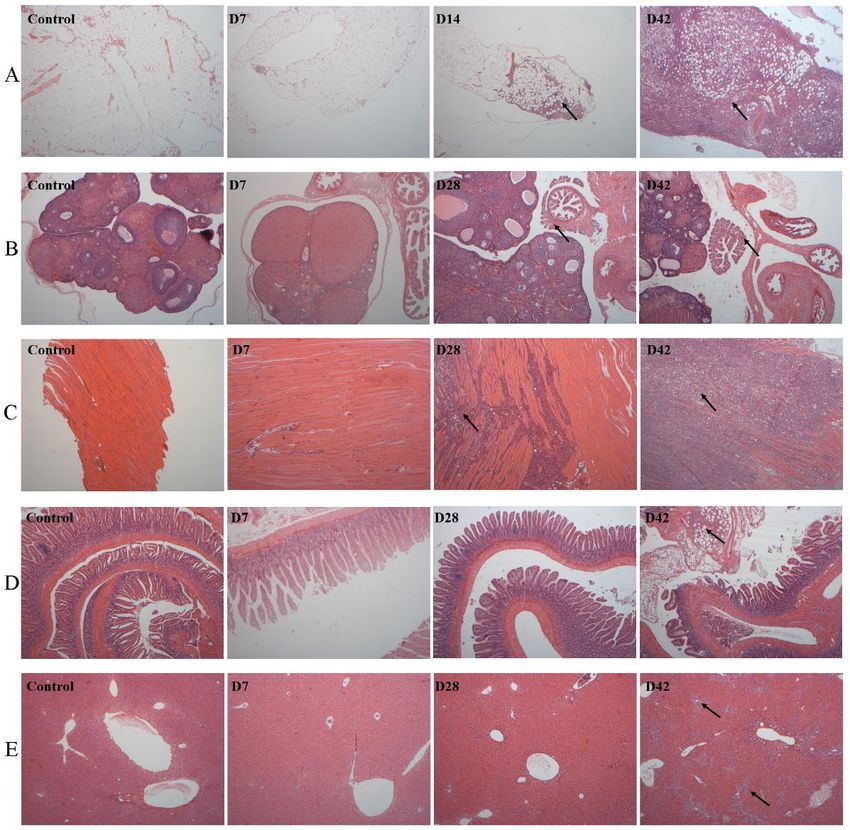
Fig. 7. Histopathological characterization of organs in NuTu-19 cell orthotopic injection rat model (40×).
Organs were prepared for microscopic examination using H&E stain. Metastases were identified in the A)
implanted side ovary, B) omentum, C) unimplanted side ovary and D) diaphragm at different times. Each black
arrow denotes the location of the metastasis in the tissue section.
3.2.1 Urine proteome changes in the NuTu-19 cell orthotopic injection OC rat model
Twenty urine samples were randomly collected at five time points (on days 7, 14, 28 and 42) from
four experimental rats and were analyzed by LC-MS/MS. In total, 602 urinary proteins were identified,
and all proteins are listed in Table S3. Among them, 49 differential proteins that had human
orthologues were evaluated and had significant changes in all four rats (fold change ≥1.5 or ≤0.67, P <
0.05) (Fig. 8). On the 3rd day, nineteen differential proteins were identified, of which two increased
and seventeen of which decreased. On the 7th day, four identified differential proteins were
downregulated. On the 14th day, eleven differential proteins were identified, four of which increased
and seven of which decreased. On the 28th day, twenty differential proteins were identified, twelve of
which increased and eight of which decreased. On the 42nd day, twenty-eight differential proteins were
identified, three of which increased and thirty-four of which decreased. The differential proteins are
shown in Table S4. The trends of the differential proteins were consistent at each time point in four rats.
Interestingly, on the 7th day, no obvious cancer metastases were found in the abdominal organs, and
four differential proteins were identified in the urine of these four rats. Among the 49 differential
proteins, 24 differential proteins were closely associated with the proliferation and invasion of ovarian
cancer, and seven were reported to be biomarkers of ovarian cancer. The urine protein profile changed
significantly in the NuTu-19 cell orthotopic injection OC rat model compared to the control.
Fig. 8. Venn diagram of the differential urinary proteins identified on days 7, 14, 28 and 42 after orthotopic
injection of NuTu-19 cells.
Table 2
Differential urinary proteins in OC rats orthotopically injected with NuTu-19 cells.
Fold change Reported to be related
Accession Protein name Trend P value
0d 7d 14d 28d 42d to ovarian cancer
P04639 Apolipoprotein A-I (ApoAI) ↓ 1 0.65 0.48 — — 1.17E-02 Serum[82] ,ascites[83]
P04218 OX-2 membrane glycoprotein (OX2G) ↓ 1 0.65 — — 0.58 4.78E-02 cell[84]
Charged multivesicular body protein 5
Q4QQV8 ↓ 1 0.63 — — — 3.08E-02
(CHMP5)
17You can also read