Short-term consumption of sucralose with, but not without, carbohydrate impairs neural and metabolic sensitivity to sugar - bioRxiv
←
→
Page content transcription
If your browser does not render page correctly, please read the page content below
bioRxiv preprint first posted online Feb. 22, 2019; doi: http://dx.doi.org/10.1101/557801. The copyright holder for this preprint
 (which was not peer-reviewed) is the author/funder, who has granted bioRxiv a license to display the preprint in perpetuity.
                              It is made available under a CC-BY-NC-ND 4.0 International license.

    Short-term consumption of sucralose with, but not without, carbohydrate impairs neural
                             and metabolic sensitivity to sugar

        Authors: Jelle R. Dalenberg1,†, Barkha P. Patel1,2,†, Raphael Denis3, Maria G. Veldhuizen1,
              Yuko Nakamura1,4, Petra C. Vinke1,5, Serge Luquet3, and Dana M. Small1,6,7*

   Affiliations:
   1
   Modern Diet and Physiology Research Center (MDPRC), Department of Psychiatry, Yale
   University School of Medicine, New Haven, CT06510, United States.
   2
       Division of Endocrinology, The Hospital for Sick Children, Toronto, ON, M5G 1X8, Canada.
   3
   Unite de Biologie Fonctionnelle et Adaptative, Centre National la Recherche Scientifique, Unité
   Mixte de Recherche 8251, Université Paris Diderot, Sorbonne Paris Cité, 75205 Paris, France
   4
       Center for Evolutionary Cognitive Science at the University of Tokyo, Tokyo, Japan
   5
   Department of Neuroendocrinology, Groningen Institute for Evolutionary Life Sciences,
   University of Groningen, Groningen, The Netherlands
   6
       Department of Psychology, Yale University, New Haven, CT06510, United States.
   7
   Institute for Diabetes Research and Metabolic Diseases of the Helmholtz Center Munich at the
   University of Tübingen, Otfried Müller Strasse 47, Tübingen, 72076, Germany

   * Correspondence to: dana.small@yale.edu
   † These authors made equal contribution to this work.
bioRxiv preprint first posted online Feb. 22, 2019; doi: http://dx.doi.org/10.1101/557801. The copyright holder for this preprint
(which was not peer-reviewed) is the author/funder, who has granted bioRxiv a license to display the preprint in perpetuity.
It is made available under a CC-BY-NC-ND 4.0 International license.
Summary
There is a general consensus that overconsumption of sugar sweetened beverages contributes
to the prevalence of obesity and related comorbidities such as type 2 diabetes (T2D). Whether a
similar relationship exists for no, or low-calorie “diet” drinks is a subject of intensive debate and
controversy. Here, we show that metabolic dysfunction, coupled with reduced central sensitivity
to sweet, but not sour, salty or bitter taste, occurs when sucralose is repeatedly consumed with,
but not without, a carbohydrate over a two-week period in healthy humans. A similar exposure
to sucralose, with, but not without, a carbohydrate altered substrate utilization in mice. More
specifically, greater energy intake was required for the animals to shift from fatty acid to
carbohydrate oxidation, indicating a reduced sensitivity to carbohydrate. These findings
demonstrate that consumption of sucralose in the presence of a carbohydrate rapidly impairs
glucose metabolism and may contribute to the rise in T2D.
Keywords: low-calorie sweetener, glucose tolerance, fMRI, midbrain, insula, mice, diabetes,
obesity, indirect calorimetry, taste perception, substrate utilization
Figures, Tables, Data list:
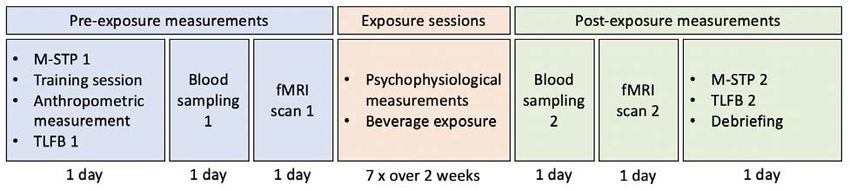
Figure 1. Human Study overview.
Figure 2. Changes in insulin sensitivity and brain response to sweet taste in humans
Figure 3. Metabolic changes in mice.
Figure S1. OGTT 120 min
Figure S2. Gustatory Manifold & System
Figure S3. Intensity perception changes across taste solutions and groups.
Figure S4. Intake, activity, fat oxidation, and energy expenditure in mice.
Table 1. Negative relation between Δ insulin iAUC0-30m and brain response to sucrose.
Table S1: Detailed Participant demographics and beverage consumption
Table S2. Group comparisons for the OGTT indices.
Data S1. TLFB Questionnaire, Sweet taste preference and Psychophysiological measurementsbioRxiv preprint first posted online Feb. 22, 2019; doi: http://dx.doi.org/10.1101/557801. The copyright holder for this preprint
(which was not peer-reviewed) is the author/funder, who has granted bioRxiv a license to display the preprint in perpetuity.
It is made available under a CC-BY-NC-ND 4.0 International license.
Introduction
Significant controversy exists over the effects of consuming no, or low-calorie sweeteners (LCS)
on health. Human studies have reported that consumption of LCS is positively associated with
weight gain and/or diabetes [1–4], positively associated with lower BMI and weight loss [5–7], or
unrelated to metabolic and body weight measures [8,9], possibly due to methodological
limitations [10]. A similar inconsistency exists in the animal literature, with three recent reviews
reaching three different and mutually exclusive conclusions [1,9,11]. Given the growing use of
LC [12], especially in relation to the obesity and diabetes pandemics, it is of pressing
importance to resolve the controversy surrounding LCS consumption.
Central to resolving this debate is defining and testing biologically plausible mechanisms by
which LCS could lead to metabolic impairment. Several have been proposed [13–16]. The
binding of LCS to extra-oral taste receptors in the pancreas and intestine could influence
glucose absorption by affecting glucose transporters SGLT-1 and GLUT2 or by altering glucose
metabolism by promoting incretin release. Central mechanisms could also play a role. For
example, it has been suggested that uncoupling sweet taste from energy receipt leads to a
weakening of conditioned responses to sweet taste [17]. In this case, sweetness-elicited
conditioned responses, such as release of incretins, which help regulate glucose metabolism, is
hypothesized to be reduced, leading to the subsequent development of glucose intolerance [17].
Support for this uncoupling hypothesis comes from a series of studies in rodents reporting
weight gain or glucose intolerance in rats consuming yogurts sweetened inconsistently with
sucrose and LCS compared to rats consuming yogurts consistently sweetened with only
sucrose [14,18–22].
In the current study we set out to test the sweet uncoupling hypothesis in humans. Forty-five
healthy humans were randomly assigned to consume: (1) beverages sweetened with sucralose
(sweet uncoupled from calories - LCS), (2) beverages sweetened with maltodextrin (sweet
coupled with calories - Carb), or (3) beverages sweetened with sucralose and combined with
maltodextrin (Combo). Oral glucose tolerance test (OGTTs), sensory tests, and neuroimaging
were conducted before and after participants consumed seven of their assigned beverages over
2-weeks in the laboratory. We reasoned that if the uncoupling hypothesis is correct, then
participants in the LCS, but not the Carb or Combo groups should have reduced insulin
sensitivity coupled with decreased brain and sensory response to sweet, but not sour, salty or
savory taste. A parallel study was conducted in adolescents and a follow-up study in mice.bioRxiv preprint first posted online Feb. 22, 2019; doi: http://dx.doi.org/10.1101/557801. The copyright holder for this preprint
(which was not peer-reviewed) is the author/funder, who has granted bioRxiv a license to display the preprint in perpetuity.
It is made available under a CC-BY-NC-ND 4.0 International license.
Results
Human Studies
Forty-five healthy young adults aged 18-45 who were non-regular consumers of LCS. A parallel
study was conducted with adolescents, aged 13-17, since adolescents go through a period of
transient insulin resistance [23], a time of increased preference for sweet beverages and of
intensive brain development [24–28], especially for dopaminergic and prefrontal cortical circuits
[29]. In these studies, we assessed glucose tolerance and taste perception before and after
participants consumed seven 355ml novel-flavored equi-sweet beverages over two weeks using
randomized double-blind designs. These beverages were sweetened with either 0.06g
sucralose (0 Kcal, uncoupled stimulus), equi-sweet 30.38g sucrose (120 Kcal, coupled stimulus)
or a control beverage containing the same dose of sucralose plus 31.83g of the non-sweet
carbohydrate maltodextrin (120 Kcal, coupled stimulus). In addition, we measured brain
response to sweet, sour, salty and savory taste using functional magnetic resonance imaging
(fMRI). We reasoned that if uncoupling sweet taste from energy affects sweet taste guided
feeding and conditioned responses, then uncoupling should result in glucose intolerance and
reduced brain and perceptual responses to the sweet taste of sugar relative to other tastes in
the uncoupled stimulus group, but not in the other two groups. A study overview is given in
Figure 1. Detailed participant demographics are provided in Table S1.
Insulin sensitivity is reduced following consumption of sucralose with, but not without,
maltodextrin
Glucose tolerance was assessed in young adults using the incremental area under the curve
(iAUC) of blood plasma insulin and glucose during an Oral Glucose Tolerance Test (OGTT). We
found a significant difference between the groups for first phase insulin response (time 0-30
min, F(2,36)=3.88, P=0.03) (Figure 1A) while we found no group differences in the first phase
glucose response (F(2,36)=0.43,p=0.65) (Figure S1 and Stars Methods). Contrary to the
uncoupling hypothesis, post hoc tests revealed a larger first phase insulin response in the
Combo group (i.e., exposed to sucralose plus maltodextrin) compared to the LCS and Carb
groups (exposed to sucrose alone or sucralose alone; false discovery rate corrected t tests;
β=37.00%, P=0.03 and β=39.59%, P=0.03, respectively). In the adolescent group, glucose
tolerance was assessed using a single timepoint blood draw to measure fasting blood plasmabioRxiv preprint first posted online Feb. 22, 2019; doi: http://dx.doi.org/10.1101/557801. The copyright holder for this preprint
(which was not peer-reviewed) is the author/funder, who has granted bioRxiv a license to display the preprint in perpetuity.
It is made available under a CC-BY-NC-ND 4.0 International license.
insulin and glucose. Based on our findings in the adults we halted the adolescent trial to
examine the data for adverse effects. We found that HOMA-IR levels elevated from 12.9 in 2 out of 3 participants in the sucralose plus maltodextrin group. This elevation was
driven by an increase in fasting blood plasma insulin levels (Figure 2B). We reported this
adverse event to the Human Investigations Committee, which recommended trial termination.
While the small group numbers currently do not permit us to draw any firm conclusions,
permutation testing (n=1000) indicated that the HOMA-IR difference scores of the Combo group
are significantly different from the LCS and Sugar groups together (p=0.043).
Response to sweet, but not sour, salty, or savory taste in the ventral tegmental area, insula,
putamen, and anterior cingulate cortex is inversely associated insulin sensitivity in the Combo
group.
To investigate the effect of beverage exposure on brain response to sweet taste and other basic
tastes (sweet, sour, salty and umami – bitter was not used because of its lingering after-taste),
we assessed blood-oxygen-level dependent (BOLD) changes in the brain using functional
Magnetic Resonance Imaging (fMRI) in the adult study. We calculated fMRI-BOLD difference
maps (post minus pre-beverage exposure) per taste on a single-subject level using mass
univariate regression. At the group-level, we performed a mass univariate ANCOVA per basic
taste to test whether brain response changed as a function of beverage exposure group while
assessing the effect of insulin change as a covariate. Contrasting BOLD-difference maps
between groups for each basic taste did not show any difference surviving a cluster-wise
familywise error (FWE) correction threshold. However, regressing insulin iAUC difference
scores on the BOLD-difference maps for sweet taste showed a strong negative relation in
several limbic and mesolimbic areas (Figure 2C, Table 1) in the Combo group. In this group,
the left anterior insula, right posterior insula, anterior cingulate, right ventral tegmental area
(Figure 2D), right putamen, and several cortical areas in the superior temporal gyrus and
postcentral gyrus showed a decreased fMRI-BOLD response to sweet taste as a function of
iAUC. We found no association between insulin change and central processing of umami, salty,
or sour taste nor any associations between insulin change and taste perception in the LCS and
Carb groups.
Taste intensity perception and preference is unaffected.bioRxiv preprint first posted online Feb. 22, 2019; doi: http://dx.doi.org/10.1101/557801. The copyright holder for this preprint
(which was not peer-reviewed) is the author/funder, who has granted bioRxiv a license to display the preprint in perpetuity.
It is made available under a CC-BY-NC-ND 4.0 International license.
To investigate the effects of LCS consumption on taste perception, we measured taste intensity
ratings for sucrose, sucralose, citric acid (sour), sodium chloride (salty), monopotassium
glutamate (umami), and sucralose+citric acid prior to each beverage exposure (7 times) across
the two-week time period (Figure 1, Figure S3 and Data S1). We also assessed sweet
concentration preference using a sucrose preference test pre and post beverage exposure. We
found no differences in intensity perception or sucrose preference across the groups nor did we
find an association between plasma insulin change and these measures (Figure S3 and Data
S1).
Summary Human Studies
Collectively, the findings from the two human studies refute the hypothesis that uncoupling
sweet taste from caloric content causes metabolic dysfunction or decreases in the potency of
sweet taste as a conditioned stimulus. Rather, the results reveal that metabolic dysfunction,
coupled with reduced central sensitivity to sweet taste, occurs when an LCS is repeatedly
consumed with, but not without a carbohydrate. Critically, while these findings fail to support the
uncoupling hypothesis, they are nevertheless consistent with the results of the studies on which
the hypothesis is based. More specifically, in these studies, LCS were added to yogurts that
contained a number of nutrients including carbohydrates and thus metabolic dysfunction
followed repeated simultaneous consumption of LCS and carbohydrates [14,18,20–22].
Mouse Study
One possible mechanism by which an LCS could acutely alter carbohydrate metabolism is by
influencing the glucose absorption rate [30,31]. Since altered glucose absorption would be
expected to lead to changes in substrate utilization, we next turned to a mouse model where we
could use calorimetric chambers to test whether consuming an LCS-sugar combination could
alter nutrient partitioning (i.e. the substrate - lipids vs. carbohydrate - that the body uses for
fuel). Young adult, fourteen-week-old C57BL/6J mice were individually housed in calorimetric
chambers in a controlled environment with a 12:12 light-dark cycle with lights off at 19:00h. Mice
were divided into 3 experimental groups and presented daily with a drink bottle containing a
drinkable sweet solution at 14:00h for nine days. The three groups received sucrose (Sugar
group: 0.25M, 0.337 kcal/ml), equi-sweet sucralose (LCS group: 0.425 mM, 0 Kcal) or equi-
sweet sucrose plus sucralose (Combo group: 0.125 mM and 0.212 mM, respectively) containing
half the caloric load of the sucrose solution (0.168 kcal/ml). We chose to mix sucralose withbioRxiv preprint first posted online Feb. 22, 2019; doi: http://dx.doi.org/10.1101/557801. The copyright holder for this preprint
(which was not peer-reviewed) is the author/funder, who has granted bioRxiv a license to display the preprint in perpetuity.
It is made available under a CC-BY-NC-ND 4.0 International license.
sucrose instead of maltodextrin because rodents show a strong taste preference for
maltodextrins [32]. This also allowed us to determine if effects would be observed for
carbohydrates other than maltodextrin. Volumes of 1.5ml were selected to be roughly equivalent
to the human study where one 335ml beverage was consumed daily for nine days. Animals had
ad libitum access to drinking water and food and every day, food intake (gram and kcal), liquid
intake (ml), and locomotor activity (beam breaks/h) was measured every 15 minutes. To assess
substrate utilization, we measured oxygen consumption (VO2) and carbon dioxide production
(VCO2), and used these measures to determine Energy Expenditure (EE), Respiratory
Exchange Rate (RER/RQ), and fat oxidation (FO).
Nutrient partitioning is altered in mice when sucralose is consumed with, but not without
sucrose.
All groups fully consumed the solutions in a six-hour time window with no group differences in
hourly consumption rate (Figure 3A); however, RER in mice consuming Sugar shifted more
towards carbohydrate oxidation compared to mice in the LCS and Combo groups (false
discovery rate corrected t tests; all PbioRxiv preprint first posted online Feb. 22, 2019; doi: http://dx.doi.org/10.1101/557801. The copyright holder for this preprint
(which was not peer-reviewed) is the author/funder, who has granted bioRxiv a license to display the preprint in perpetuity.
It is made available under a CC-BY-NC-ND 4.0 International license.
sensitivity to carbohydrates, which is consistent with our human experiments and with previous
studies showing that glucose intolerance is associated with a metabolic shift towards fat
oxidation [34]. Additional information on intake, activity, fat oxidation, and energy expenditure
are reported in Figure S4.
Discussion
The results of our studies in humans and mice demonstrate that consuming sucralose with, but
not without a carbohydrate rapidly impairs glucose metabolism. More specifically, in healthy
human adults we observed reduced insulin sensitivity and blunted brain response to sucrose
following consumption of seven 355ml beverages over two weeks, whereas no changes were
observed following equal consumption of beverages with sucralose or sucrose alone. Likewise,
in mice consuming 1.5 mls of a liquid containing sucrose and sucralose every day for seven
days we observed reduced carbohydrate metabolism, whereas consuming equivalent volumes,
but lower doses, of sucrose or sucralose alone had no effect. These results do not support the
sweet uncoupling hypothesis. Rather, they suggest that sucralose consumption alters the
metabolism of simultaneously consumed glucose to rapidly produce deleterious effects on
metabolic health. Since the extent of this exposure is very likely experienced in a natural setting,
our results provide evidence that LCS consumption contributes to the rise in the incidence of
impaired glucose tolerance. They also indicate that the mechanism underlying this relationship
involves acute LCS-induced alterations in glucose metabolism.
The sweet uncoupling hypothesis
The current findings are consistent with the results of studies in rodents showing impaired
glucose metabolism following repeated consumption of foods with added LCS (e.g., yogurt plus
sucralose (Swithers refs); however, they refute the hypothesis that the impairment results from a
decoupling of sweet taste with energy. First, in healthy adults who are non-regular consumers of
LCS, repeated consumption of the sucralose beverage (i.e., group LCS), did not significantly
influence glucose metabolism and produced no effects on brain or perceptual responses to
sweet taste, despite being clearly rated as sweet-tasting and being decoupled from calories.
Rather, in direct contradistinction, consuming a similarly sweet beverage containing the same
dose of sucralose appropriately coupled to calories rapidly decreased insulin sensitivity.
Second, the magnitude of the reduced insulin sensitivity was closely coupled to decreases in
brain response to the sweet taste stimulus, whereas no main effects or correlations were
observed with the responses to taste in the LCS and Malto groups. Although it is not possible tobioRxiv preprint first posted online Feb. 22, 2019; doi: http://dx.doi.org/10.1101/557801. The copyright holder for this preprint
(which was not peer-reviewed) is the author/funder, who has granted bioRxiv a license to display the preprint in perpetuity.
It is made available under a CC-BY-NC-ND 4.0 International license.
discern if this association results from altered central responses contributing to reduced insulin
sensitivity or vice versa, it does suggest that central circuits, like peripheral glucose tolerance
are altered by the exposure to the LCS only when it is coupled, rather than decoupled from
calories. Third, the data from the adolescent study, though preliminary, are not only consistent
with the adult findings, but also suggest that the negative impact of consuming sucralose and
maltodextrin together is greater in youth, with 2 out of 3 participants in the combination group
showing a clinically significant change in HOMA-IR. Finally, the rodent data align with the
observations in humans, again pointing to an effect of LCS on metabolism only when consumed
concomitant to a carbohydrate, in this case sucrose. This result is particularly impressive
because the dose of sucralose was half that consumed by the LCS group and the caloric load
from sucrose was half that consumed by the Sugar group. Nevertheless, it was the Combo
group that displayed reduced carbohydrate oxidation in the context of similar overall liquid and
food intake. Collectively, the results from all three experiments are consistent and lead to the
conclusion that consumption of the LCS sucralose with, but not without a carbohydrate,
produces metabolic dysfunction.
Possible mechanisms
Our findings argue that uncoupling sweet taste from calories cannot be responsible for
associations that are observed between LCS consumption and impaired glucose metabolism.
Rather they point towards a mechanism that operates when LCS and carbohydrate are
consumed concurrently. LCSs, including sucralose, bind to T1R2/T1R3 sweet taste receptors
that are expressed in a variety of tissues including the oral cavity, intestine, liver, pancreas and
brain [35]. Activation of sweet taste receptors expressed in the intestine by LCSs produce up-
regulation of sodium/glucose co-transporter SGLT-1[31], which plays a role in glucose
absorption and are implicated in the ability of dietary supplementation of LCS in piglets to
increase weight gain [36]. The binding of LCS to intestinal taste receptor cells may also
influence absorption via the translocation of GLUT2 [15,30,37]. Considering the current study,
maltodextrin is quickly metabolized into glucose, which would then be available to bind to
intestinal taste receptor cells. Simultaneous binding of maltodextrin-derived glucose and
sucralose could therefore increase glucose transport (by SLT-1 and/or GLUT2) beyond optimal
levels for the amount of glucose present, resulting in acutely perturbed glucose homeostasis.
Consistent with this possibility, in obese, but glucose tolerant humans, consuming sucralose
compared to water prior to an OGTT, results in higher peak plasma glucose concentrations,
increased insulin concentration and AUC, and decreased insulin sensitivity (Pepino et al., 2013).bioRxiv preprint first posted online Feb. 22, 2019; doi: http://dx.doi.org/10.1101/557801. The copyright holder for this preprint
(which was not peer-reviewed) is the author/funder, who has granted bioRxiv a license to display the preprint in perpetuity.
It is made available under a CC-BY-NC-ND 4.0 International license.
Importantly, this work excluded individuals who self-reported consuming more than the
equivalent of 1 diet soda per week. In contrast, studies that have not excluded regular users
have failed to find effects of LCS consumption on glucose metabolism [38–41]. However, as
suggested by Pepino and colleagues, negative results would be expected if regular
consumption of LCS impaired glucose tolerance. Our findings align with this proposal. Like
Pepino and colleagues, we excluded individuals who self-reported consuming LCS more than
three times per month. Further, examination of the TLFB questionnaire data indicated that
participants consumed an average of 260 mls of diet drinks per week - which is less than three
355ml bottles per month. In this case, our intervention (seven, 355, ml bottles in two weeks)
clearly increased consumption above baseline levels and as would be predicted from the acute
effects observed by Pepino and colleagues, resulted in a longer term decrease in insulin
sensitivity. Critically, in our study sucralose was not consumed prior to the OGTT. Therefore, the
observed decrease in insulin sensitivity must be attributed to a chronic effect of consuming the
Combo beverage on glucose tolerance.
It is also possible that altered substrate utilization plays a role in the development of glucose
intolerance. We observed that mice consuming the sucralose plus sucrose solution had altered
substrate utilization favoring fatty acid over carbohydrate oxidation. More specifically, shifting
from lipid to carbohydrate oxidation (i.e., substrate utilization) required higher energy intake in
the sucrose plus sucralose group compared to the other groups. As in our studies in humans,
this shift reflects a decreased sensitivity to carbohydrates, which could over time promote
increased adiposity and decreased glucose tolerance. Interestingly, similarly altered substrate
utilization is well known to occur in T2D, but it is unknown whether this precedes or follows
insulin resistance [42]. Our results suggest that diet can rapidly alter substrate utilization and
may therefore precede impaired metabolism. In future work, it will be important to determine
whether consuming an LCS with a carbohydrate produces similar effects in substrate utilization.
An alternative, or possibly adjunct possibility, is that change in insulin sensitivity is regulated by
diet-induced changes in dopamine signaling. Manipulating central dopamine circuits can
influence peripheral insulin sensitivity [43]. In the adult study, peripheral changes in insulin
sensitivity were strongly associated with central changes in BOLD responses to sweet taste in
the insular taste cortex as well as dopaminergic source and target areas. This effect did not
result from a general influence on taste processing since associations were not observed with
salty, sour or umami tastes. It is also unlikely to reflect sensory processing of taste sincebioRxiv preprint first posted online Feb. 22, 2019; doi: http://dx.doi.org/10.1101/557801. The copyright holder for this preprint
(which was not peer-reviewed) is the author/funder, who has granted bioRxiv a license to display the preprint in perpetuity.
It is made available under a CC-BY-NC-ND 4.0 International license.
perception was unaltered, or satiety signaling because the amount of each substance
consumed during the course of the fMRI study was negligible (e.g. less than 20 mls per
stimulus). It is also unlikely to reflect a learned decrease in the nutritive value of sweet taste
since no associations were observed with the LCS alone condition. Rather, we suggest that
consuming the Combo beverage decreased either peripheral or central insulin sensitivity, which
then led to blunted dopamine response to carbohydrates reflected in decreased BOLD response
to sweet taste. This possibility is consistent with a number of related findings. In humans,
peripheral insulin resistance is associated with decreased insulin induced activation in the
ventral striatum [44] and correlates with dopamine type 2 receptor availability [45]. In fruit flies,
chronic exposure to sucralose alters the equivalent of insulin and dopamine systems leading to
hyperactivity, insomnia, glucose intolerance, enhanced sweet taste perception and increased
food intake [46]. In rodents, diet-induced reduced central insulin sensitivity is known to blunt Akt
(protein kinase B) induced mobilization of the dopamine transporter (DAT) leading to blunted
striatal response to amphetamine evoked dopamine response [47]. We therefore speculate that
blunted brain response is a consequence rather than a cause of insulin resistance. However,
the alternative cannot be ruled out.
Resolving the inconsistencies in the literature.
As mentioned above, although our results fail to support the uncoupling hypothesis, they are
nevertheless consistent with the results of the studies on which this hypothesis is based since
LCS was added to carbohydrate-containing foods and therefore parallel our Combo groups. In
many rodent studies reporting a negative impact of LCS on metabolism, LCS (e.g., saccharin,
aspartame, sucralose, AceK) were either added to a carbohydrate or a carbohydrate-containing
yogurt stimuli ranging from 0.4 to 0.6 kcal/g [18,21,22,48,49]. Similarly, in human randomized
control trials (RCTs) reporting that LCS consumption impairs metabolism, LCS were consumed
concomitant to carbohydrates [50–53]. Critically, when study protocols promote consumption of
LCS alone or in capsules at home during meal times, studies fail to find a negative impact on
metabolism [54–57]. This suggests that LCS may have different effects depending on how they
are consumed, with greater likelihood for impairment when LCS are provided in conjunction with
carbohydrate.
Another important factor, as proposed by Pepino and colleagues is that results may depend on
individual factors like prior experience consuming LCS. More specifically, including individuals
who are regular users of LCS may bias towards negative findings because these individualsbioRxiv preprint first posted online Feb. 22, 2019; doi: http://dx.doi.org/10.1101/557801. The copyright holder for this preprint
(which was not peer-reviewed) is the author/funder, who has granted bioRxiv a license to display the preprint in perpetuity.
It is made available under a CC-BY-NC-ND 4.0 International license.
might already be affected and would therefore be less likely to show a change upon additional
limited small exposures. A further important issue is that LCS are biochemically heterogeneous
and have diverging bioactive effects. Sucralose is the most commonly used LCS, but there are
several other in frequent use and possessing different pharmacokinetics (i.e. absorption,
distribution, metabolism and excretion) [58]. Several studies (reviewed in [59]) suggest that the
effects of LCS on glucose transporters and subsequent absorption are strongest for Ace-K and
weak, or absent for aspartame. For example, sucralose and Ace-K, but not aspartame, increase
SGLT-1 mRNA expression, which correlates with absorption rate [31]. In addition, Ace-K and
sucralose, but not aspartame, increase insulin secretion [60,61]. One reason why aspartame
may produce less effects on incretins and glucose absorption is that it is rapidly metabolized in
the small intestine and would therefore have less opportunity to bind to taste receptor cells or
glucose transporters. Given the potential for insights into mechanisms as well as importance for
health, future work should focus on comparing different categories of LCS within the same
study.
Summary and Implications
The results from our studies demonstrate that LCS consumption produces metabolic
dysfunction when it is consumed with, rather than uncoupled from, a carbohydrate. This implies
that (a) carbohydrate metabolism is altered in the presence of the LCS sucralose and (b) that
this alteration leads to decreases in peripheral and central sensitivity to sugar and sweet taste.
Of particular relevance to the potential significance of this work, the metabolic changes
observed following a very limited exposure that almost certainly occurs in freely living humans -
especially if one considers the consumption of a diet drink along with a meal. This raises the
possibility that the combination effect may be a major contributor to the rise in the incidence of
type two diabetes and obesity.
Acknowledgements
We would like to acknowledge those volunteers who participated in our study, the MR
technicians, as well as several colleagues, including Barry Green, Ivan de Araujo and Wolfgang
Meyerhof for insightful discussions and comments on design, interpretation or prior drafts of this
manuscript. Funding: NIH NIDCDR01 DC006706-06A1.
Author Contributions
Conceptualization: DMS, SL, MGV, BPPbioRxiv preprint first posted online Feb. 22, 2019; doi: http://dx.doi.org/10.1101/557801. The copyright holder for this preprint
(which was not peer-reviewed) is the author/funder, who has granted bioRxiv a license to display the preprint in perpetuity.
It is made available under a CC-BY-NC-ND 4.0 International license.
Data Curation: JRD, BPP, RD
Formal Analysis: JRD, RD, BPP, MGV
Funding Acquisition: DMS
Investigation: BPP, RD, YN, PCV
Methodology: DMS, JRD, RD, MGV, SL
Project Administration: JRD, BPP, RD, MGV, SL, DMS
Resources: SL, DMS
Software: JRD, MGV, RD
Supervision: SL, DMS
Validation: JRD, BPP, RD
Visualization: JRD, RD
Writing – Original Draft Preparation: JRD, DMS
Writing – Review & Editing: JRD, BPP, RD, MGV, YN, PCV, SL, DMS
Competing interests: Authors declare no competing interests.
Declaration of Interests
Authors declare no competing interests.
References
1. Fowler, S.P.G. (2016). Low-calorie sweetener use and energy balance: Results from
experimental studies in animals, and large-scale prospective studies in humans. Physiol.
Behav. 164, 517–523.
2. Fowler, S.P., Williams, K., Resendez, R.G., Hunt, K.J., Hazuda, H.P., and Stern, M.P.
(2008). Fueling the obesity epidemic? Artificially sweetened beverage use and long-term
weight gain. Obesity 16, 1894–1900.
3. Imamura, F., O’Connor, L., Ye, Z., Mursu, J., Hayashino, Y., Bhupathiraju, S.N., and
Forouhi, N.G. (2015). Consumption of sugar sweetened beverages, artificially sweetened
beverages, and fruit juice and incidence of type 2 diabetes: systematic review, meta-
analysis, and estimation of population attributable fraction. Bmj 351.
4. Nettleton, J., Lutsey, P., Wang, Y., Lima, J., Michos, E., and Jacobs, D. (2009). Diet Soda
Intake and Risk of Incident Metabolic Syndrome and Type 2 Diabetes in the Multi-Ethnic
Study of Atherosclerosis. Diabetes Care 32, 688–694.
5. Greenwood, D.C., Threapleton, D.E., Evans, C.E.L., Cleghorn, C.L., Nykjaer, C.,
Woodhead, C., and Burley, V.J. (2014). Association between sugar-sweetened andbioRxiv preprint first posted online Feb. 22, 2019; doi: http://dx.doi.org/10.1101/557801. The copyright holder for this preprint
(which was not peer-reviewed) is the author/funder, who has granted bioRxiv a license to display the preprint in perpetuity.
It is made available under a CC-BY-NC-ND 4.0 International license.
artificially sweetened soft drinks and type 2 diabetes: systematic review and dose–
response meta-analysis of prospective studies. Br. J. Nutr. (2014), 112, 725–734.
6. Wiebe, N., Padwal, R., Field, C., Marks, S., Jacobs, R., and Tonelli, M. (2011). A
systematic review on the effect of sweeteners on glycemic response and clinically
relevant outcomes Natasha. BMC Med. 9.
7. Miller, P.E., and Perez, V. (2014). Low-calorie sweeteners and body weight and
composition: a meta-analysis of randomized controlled trials and prospective cohort
studies. Am. J. Clin. Nutr., 1–13.
8. Grotz, V.L., Pi-Sunyer, X., Porte, D., Roberts, A., and Trout, J.R. (2017). A 12-week
randomized clinical trial investigating the potential for sucralose to affect glucose
homeostasis. Regul. Toxicol. Pharmacol. 88, 30126–5.
9. Rogers, P.J., Hogenkamp, P.S., de Graaf, C., Higgs, S., Lluch, A., Ness, A.R., Penfold,
C., Perry, R., Putz, P., Yeomans, M.R., et al. (2016). Does low-energy sweetener
consumption affect energy intake and body weight? A systematic review, including meta-
analyses, of the evidence from human and animal studies. Int. J. Obes. 40, 381–394.
10. Toews, I., Lohner, S., Küllenberg De Gaudry, D., Sommer, H., and Meerpohl, J.J. (2019).
Association between intake of non-sugar sweeteners and health outcomes: systematic
review and meta-analyses of randomised and non-randomised controlled trials and
observational studies. Bmj 364, 4718.
11. Glendinning, J.I. (2016). Do low-calorie sweeteners promote weight gain in rodents?
Physiol. Behav. 164, 509–513.
12. Sylvetsky, A.C., Welsh, J.A., Brown, R.J., and Vos, M.B. (2012). Low-calorie sweetener
consumption is increasing in the United States. Am. J. Clin. Nutr. 96, 640–646.
13. Burke, M. V., and Small, D.M. (2016). Effects of the modern food environment on striatal
function, cognition and regulation of ingestive behavior. Curr. Opin. Behav. Sci. 9, 97–
105.
14. Davidson, T.L., and Swithers, S.E. (2004). A Pavlovian approach to the problem of
obesity. Int. J. Obes. Relat. Metab. Disord. 28, 933–935.
15. Pepino, M.Y. (2015). Metabolic effects of non-nutritive sweeteners. Physiol. Behav. 152,
450–455.
16. Sylvetsky, A.C., and Rother, K.I. (2018). Nonnutritive Sweeteners in Weight Management
and Chronic Disease: A Review. Obesity 26, 635–640.
17. Swithers, S.E. (2013). Artificial sweeteners produce the counterintuitive effect of inducing
metabolic derangements. Trends Endocrinol. Metab. 24, 431–441.bioRxiv preprint first posted online Feb. 22, 2019; doi: http://dx.doi.org/10.1101/557801. The copyright holder for this preprint
(which was not peer-reviewed) is the author/funder, who has granted bioRxiv a license to display the preprint in perpetuity.
It is made available under a CC-BY-NC-ND 4.0 International license.
18. Davidson, T.L., Martin, A. a, Clark, K., and Swithers, S.E. (2011). Intake of high-intensity
sweeteners alters the ability of sweet taste to signal caloric consequences: implications
for the learned control of energy and body weight regulation. Q. J. Exp. Psychol. (Hove).
64, 1430–1441.
19. Swithers, S.E., Sample, C.H., and Davidson, T.L. (2013). Adverse effects of high-intensity
sweeteners on energy intake and weight control in male and obesity-prone female rats.
Behav. Neurosci. 127, 262–274.
20. Swithers, S.E., Laboy, A.F., Clark, K., Cooper, S., and Davidson, T.L. (2012). Experience
with the high-intensity sweetener saccharin impairs glucose homeostasis and GLP-1
release in rats. Behav. Brain Res. 233, 1–14.
21. Feijó, F. de M., Ballard, C.R., Foletto, K.C., Batista, B.A.M., Neves, A.M., Ribeiro, M.F.M.,
and Bertoluci, M.C. (2013). Saccharin and aspartame, compared with sucrose, induce
greater weight gain in adult Wistar rats, at similar total caloric intake levels. Appetite 60,
203–207.
22. Foletto, K.C., Melo Batista, B.A., Neves, A.M., de Matos Feijó, F., Ballard, C.R., Marques
Ribeiro, M.F., and Bertoluci, M.C. (2016). Sweet taste of saccharin induces weight gain
without increasing caloric intake, not related to insulin-resistance in Wistar rats. Appetite
96, 604–610.
23. Moran, A., Jacobs, D.R., Steinberger, J., Hong, C.P., Prineas, R., Luepker, R., and
Sinaiko, A.R. (1999). Insulin resistance during puberty: Results from clamp studies in 357
children. Diabetes 48, 2039–2044.
24. Casey, B.J., Jones, R.M., and Hare, T.A. (2008). The adolescent brain. Ann. N. Y. Acad.
Sci. 1124, 111–126.
25. Giedd, J.N., Blumenthal, J., Jeffries, N.O., Castellanos, F.X., Liu, H., Zijdenbos, A., Paus,
T., Evans, A.C., and Rapoport, J.L. (1999). Brain development during childhood and
adolescence: a longitudinal MRI study. Nat. Neurosci. 2, 861–863.
26. Paus, T., Zijdenbos, A., Worsley, K., Collins, D.L., Blumenthal, J., Giedd, J.N., Rapoport,
J.L., and Evans, A.C. (1999). Structural Maturation of Neural Pathways in Children and
Adolescents: In Vivo Study. Science (80-. ). 283, 1908–1911.
27. Mills, K.L., Lalonde, F., Clasen, L.S., Giedd, J.N., and Blakemore, S.J. (2014).
Developmental changes in the structure of the social brain in late childhood and
adolescence. Soc. Cogn. Affect. Neurosci. 9, 123–131.
28. Mills, K.L., Goddings, A.L., Clasen, L.S., Giedd, J.N., and Blakemore, S.J. (2014). The
developmental mismatch in structural brain maturation during adolescence. Dev.bioRxiv preprint first posted online Feb. 22, 2019; doi: http://dx.doi.org/10.1101/557801. The copyright holder for this preprint
(which was not peer-reviewed) is the author/funder, who has granted bioRxiv a license to display the preprint in perpetuity.
It is made available under a CC-BY-NC-ND 4.0 International license.
Neurosci. 36, 147–160.
29. Reichelt, A.C. (2016). Adolescent Maturational Transitions in the Prefrontal Cortex and
Dopamine Signaling as a Risk Factor for the Development of Obesity and High Fat/High
Sugar Diet Induced Cognitive Deficits. Front. Behav. Neurosci. 10, 189.
30. Mace, O.J., Affleck, J., Patel, N., and Kellett, G.L. (2007). Sweet taste receptors in rat
small intestine stimulate glucose absorption through apical GLUT2. J. Physiol. 582, 379–
392.
31. Margolskee, R.F., Dyer, J., Kokrashvili, Z., Salmon, K.S.H., Ilegems, E., Daly, K., Maillet,
E.L., Ninomiya, Y., Mosinger, B., and Shirazi-Beechey, S.P. (2007). T1R3 and gustducin
in gut sense sugars to regulate expression of Na+-glucose cotransporter 1. Proc. Natl.
Acad. Sci. 104, 15075–15080.
32. Poole, R.L., Aleman, T.R., Ellis, H.T., and Tordoff, M.G. (2016). Maltodextrin acceptance
and preference in eight mouse strains. Chem. Senses 41, 45–52.
33. Jéquier, E., Acheson, K., and Schutz, Y. (1987). Assessment of Energy Expenditure and
Fuel Utilization in Man. Annu. Rev. Nutr. 7, 187–208.
34. Grandl, G., Straub, L., Rudigier, C., Arnold, M., Wueest, S., Konrad, D., and Wolfrum, C.
(2018). Short-term feeding of a ketogenic diet induces more severe hepatic insulin
resistance than a obesogenic high-fat diet. J. Physiol. 19, 4597–4609.
35. Laffitte, A., Neiers, F., and Briand, L. (2014). Functional roles of the sweet taste receptor
in oral and extraoral tissues. Curr. Opin. Clin. Nutr. Metab. Care 17, 379–385.
36. Shirazi-Beechey, S.P., Daly, K., Al-Rammahi, M., Moran, A.W., and Bravo, D. (2014).
Role of nutrient-sensing taste 1 receptor (T1R) family members in gastrointestinal
chemosensing. Br. J. Nutr. 111, S8–S15.
37. Kellett, G.L., Brot-Laroche, E., Mace, O.J., and Leturque, A. (2008). Sugar Absorption in
the Intestine: The Role of GLUT2. Annu. Rev. Nutr. 28, 35–54.
38. Ma, J., Chang, J., Checklin, H.L., Young, R.L., Jones, K.L., Horowitz, M., and Rayner,
C.K. (2010). Effect of the artificial sweetener, sucralose, on small intestinal glucose
absorption in healthy human subjects. Br. J. Nutr. 104, 803–806.
39. Ford, H.E., Peters, V., Martin, N.M., Sleeth, M.L., Ghatei, M.A., Frost, G.S., and Bloom,
S.R. (2011). Effects of oral ingestion of sucralose on gut hormone response and appetite
in healthy normal-weight subjects. Eur. J. Clin. Nutr. 65, 508–513.
40. T., W., B.R., Z., M.J., B., H.L., C., M., B., T.J., L., R.L., Y., K.L., J., and M., H. (2012).
Effects of different sweet preloads on incretin hormone secretion, gastric emptying, and
postprandial glycemia in healthy humans. Am. J. Clin. Nutr. 95, 78–83.bioRxiv preprint first posted online Feb. 22, 2019; doi: http://dx.doi.org/10.1101/557801. The copyright holder for this preprint
(which was not peer-reviewed) is the author/funder, who has granted bioRxiv a license to display the preprint in perpetuity.
It is made available under a CC-BY-NC-ND 4.0 International license.
41. Brown, A.W., Bohan Brown, M.M., Onken, K.L., and Beitz, D.C. (2011). Short-term
consumption of sucralose, a nonnutritive sweetener, is similar to water with regard to
select markers of hunger signaling and short-term glucose homeostasis in women. Nutr.
Res. 31, 882–888.
42. Archer, E., Pavela, G., McDonald, S., Lavie, C.J., and Hill, J.O. (2018). Cell-specific
“competition for calories” drives asymmetric nutrient-energy partitioning, obesity, and
metabolic diseases in human and non-human animals. Front. Physiol. 9, 1–22.
43. Ter Horst, K.W., Lammers, N.M., Trinko, R., Opland, D.M., Figee, M., Ackermans, M.T.,
Booij, J., Munckhof, P. van den, Schuurman, P.R., Fliers, E., et al. (2018). Striatal
dopamine regulates systemic glucose metabolism in humans and mice. Sci. Transl. Med.
10, 1–11.
44. Anthony, K., Reed, L.J., Dunn, J.T., Bingham, E., Hopkins, D., Marsden, P.K., and Amiel,
S.A. (2006). Attenuation of Insulin-Evoked Responses in Brain Networks Controlling
Appetite and Reward in Insulin Resistance. Diabetes 55, 2986–2992.
45. Dunn, J.P., Kessler, R.M., Feuer, I.D., Volkow, N.D., Patterson, B.W., Ansari, M.S.,
Marks-Shulman, P., and Abumrad, N.N. (2012). Relationship of Dopamine Type 2
Receptor Binding Potential With Fasting Neuroendocrine Hormones and Insulin
Sensitivity in Human Obesity. Diabetes Care 35, 1105–1111.
46. Wang, Q.P., Lin, Y.Q., Zhang, L., Wilson, Y.A., Oyston, L.J., Cotterell, J., Qi, Y., Khuong,
T.M., Bakhshi, N., Planchenault, Y., et al. (2016). Sucralose Promotes Food Intake
through NPY and a Neuronal Fasting Response. Cell Metab. 24, 75–90.
47. Barry, R.L., Byun, N.E., Williams, J.M., Siuta, M.A., Tantawy, M.N., Speed, N.K.,
Saunders, C., Galli, A., Niswender, K.D., and Avison, M.J. (2018). Brief exposure to
obesogenic diet disrupts brain dopamine networks. PLoS One 13, 1–14.
48. Suez, J., Korem, T., Zeevi, D., Zilberman-Schapira, G., Thaiss, C.A., Maza, O., Israeli,
D., Zmora, N., Gilad, S., Weinberger, A., et al. (2014). Artificial sweeteners induce
glucose intolerance by altering the gut microbiota. Nature 514, 181–186.
49. Swithers, S.E., Baker, C.R., and Davidson, T.L. (2009). General and Persistent Effects of
High-Intensity Sweeteners on Body Weight Gain and Caloric Compensation in Rats.
Behav. Neurosci. 123, 772–780.
50. Pepino, M., Tiemann, C., Patterson, B., Wice, B., and Klein, S. (2013). Sucralose affects
glycemic and hormonal responses to an oral glucose load. Diabetes Care 36, 2530–
2535.
51. Temizkan, S., Deyneli, O., Yasar, M., Arpa, M., Gunes, M., Yazici, D., Sirikci, O., Haklar,bioRxiv preprint first posted online Feb. 22, 2019; doi: http://dx.doi.org/10.1101/557801. The copyright holder for this preprint
(which was not peer-reviewed) is the author/funder, who has granted bioRxiv a license to display the preprint in perpetuity.
It is made available under a CC-BY-NC-ND 4.0 International license.
G., Imeryuz, N., and Yavuz, D.G. (2015). Sucralose enhances GLP-1 release and lowers
blood glucose in the presence of carbohydrate in healthy subjects but not in patients with
type 2 diabetes. Eur. J. Clin. Nutr. 69, 162–166.
52. Sylvetsky, A.C., Brown, R.J., Blau, J.E., Walter, M., and Rother, K.I. (2016). Hormonal
responses to non-nutritive sweeteners in water and diet soda. Nutr. Metab. (Lond). 13,
71.
53. Brown, R.J., Walter, M., and Rother, K.I. (2009). Ingestion of diet soda before a glucose
load augments glucagon-like peptide-1 secretion. Diabetes Care 32, 2184–2186.
54. Steinert, R.E., Frey, F., Tpfer, A., Drewe, J., and Beglinger, C. (2011). Effects of
carbohydrate sugars and artificial sweeteners on appetite and the secretion of
gastrointestinal satiety peptides. Br. J. Nutr. 105, 1320–1328.
55. Baird, I.M., Shephard, N.W., Merritt, R.J., and Hildick-Smith, G. (2000). Repeated dose
study of sucralose tolerance in human subjects. Food Chem. Toxicol. 38, 123–129.
56. Grotz, V.L., Pi-Sunyer, X., Porte, D., Roberts, A., and Richard Trout, J. (2017). A 12-week
randomized clinical trial investigating the potential for sucralose to affect glucose
homeostasis. Regul. Toxicol. Pharmacol. 88, 22–33.
57. Grotz, V.L., Henry, R.R., Mcgill, J.B., Prince, M.J., Shamoon, H., Trout, J.R., and Pi-
Sunyer, F.X. (2003). Lack of effect of sucralose on glucose homeostasis in subjects with
type 2 diabetes. J. Am. Diet. Assoc. 103, 1607–1612+1711.
58. Schiffman, S.S. (2012). Rationale for further medical and health research on high-
potency sweeteners. Chem. Senses 37, 671–679.
59. Chan, C., Hashemi, Z., and Subhan, F. (2017). The impact of low and no-caloric
sweeteners on glucose absorption, incretin secretion and glucose tolerance Journal:
Appl. Physiol. Nutr. Metab. 42, 793–801.
60. Liang, Y., Steinbach, G., Maier, V., and Pfeiffer, E.F. (1987). The effect of artificial
sweetener on insulin secretion 1. The Effect of Acesulfame K on Insulin Secretion in the
Rat (Studies In Vivo). Horm. Metab. Res. 19, 233–238.
61. Liang, Y., Maier, V., Steinbach, G., Lalić, L., and Pfeiffer, E.F. (1987). The Effect of
Artificial Sweetener on Insulin Secretion II . Stimulation of Insulin Release from Isolated
Rat Islets by Acesulfame K ( In Vitro Experiments ) Acesulfame K is an artificial
sweetener which has been used in the food industry for some years (. Horm. Metab. Res.
19, 285–289.
62. Dempster, P., and Aitkens, S. (1995). A new air displacement method for the
determination of human body composition. Med. Sci. Sports Exerc. 27, 1692–1691.bioRxiv preprint first posted online Feb. 22, 2019; doi: http://dx.doi.org/10.1101/557801. The copyright holder for this preprint
(which was not peer-reviewed) is the author/funder, who has granted bioRxiv a license to display the preprint in perpetuity.
It is made available under a CC-BY-NC-ND 4.0 International license.
63. Green, B.G., Dalton, P., Cowart, B., Shaffer, G., Rankin, K., and Higgins, J. (1996).
Evaluating the “Labeled Magnitude Scale” for measuring sensations of taste and smell.
Chem. Senses 21, 323–34.
64. Bartoshuk, L.M., Duffy, V.B., Green, B.G., Hoffman, H.J., Ko, C.W., Lucchina, L.A.,
Marks, L.E., Snyder, D.J., and Weiffenbach, J.M. (2004). Valid across-group comparisons
with labeled scales: The gLMS versus magnitude matching. Physiol. Behav. 82, 109–114.
65. Veldhuizen, M.G., Bender, G., Constable, R.T., and Small, D.M. (2007). Trying to detect
taste in a tasteless solution: modulation of early gustatory cortex by attention to taste.
Chem. Senses 32, 569–81.
66. Bender, G., Veldhuizen, M.G., Meltzer, J.A., Gitelman, D.R., and Small, D.M. (2009).
Neural correlates of evaluative compared with passive tasting. Eur. J. Neurosci. 30, 327–
38.
67. de Araujo, I.E., Lin, T., Veldhuizen, M.G., and Small, D.M. (2013). Metabolic regulation of
brain response to food cues. Curr. Biol. 23, 878–883.
68. Joly-Amado, A., Denis, R.G.P., Castel, J., Lacombe, A., Cansell, C., Rouch, C., Kassis,
N., Dairou, J., Cani, P.D., Ventura-Clapier, R., et al. (2012). Hypothalamic AgRP-neurons
control peripheral substrate utilization and nutrient partitioning. EMBO J. 31, 4276–4288.
69. Bruss, M.D., Khambatta, C.F., Ruby, M.A., Aggarwal, I., and Hellerstein, M.K. (2010).
Calorie restriction increases fatty acid synthesis and whole body fat oxidation rates. Am.
J. Physiol. Metab. 298, E108–E116.
70. Josse, J., and Husson, F. (2013). Handling missing values in exploratory multivariate
data analysis methods. J. la SFdS 153, 79–99.
71. Matsuda, M., and DeFronzo, R.A. (1999). Insulin sensitivity indices obtained from oral
glucose tolerance testing: Comparison with the euglycemic insulin clamp. Diabetes Care
22, 1462–1470.
72. Abdul-Ghani, M.A., Matsuda, M., Balas, B., and DeFronzo, R.A. (2007). Muscle and liver
insulin resistance indexes derived from the oral glucose tolerance test. Diabetes Care 30,
89–94.
73. Friston, K.J., Williams, S., Howard, R., Frackowiak, R.S., and Turner, R. (1996).
Movement-related effects in fMRI time-series. Magn. Reson. Med. 35, 346–55.
74. Galgani, J.E., Moro, C., and Ravussin, E. (2008). Metabolic flexibility and insulin
resistance. AJP Endocrinol. Metab. 295, E1009–E1017.
75. Flatt, J.P. (1993). Dietary Fat, Carbohydrate Balance, and Weight Maintenance. Ann. N.
Y. Acad. Sci., 122–140.bioRxiv preprint first posted online Feb. 22, 2019; doi: http://dx.doi.org/10.1101/557801. The copyright holder for this preprint
(which was not peer-reviewed) is the author/funder, who has granted bioRxiv a license to display the preprint in perpetuity.
It is made available under a CC-BY-NC-ND 4.0 International license.
76. Prentice, A.M. (2005). Macronutrients as sources of food energy. Public Health Nutr. 8,
932–939.
77. Pinheiro, J., and Bates, D. (2000). Mixed effects models in S and S-PLUS 1st ed.
(Springer).
78. Kuznetsova, A., Brockhoff, P.B., and Christensen, R.H.B. (2014). lmerTest: Tests for
random and fixed effects for linear mixed effect models (lmer objects of lme4 package).bioRxiv preprint first posted online Feb. 22, 2019; doi: http://dx.doi.org/10.1101/557801. The copyright holder for this preprint
(which was not peer-reviewed) is the author/funder, who has granted bioRxiv a license to display the preprint in perpetuity.
It is made available under a CC-BY-NC-ND 4.0 International license.
Figures
Figure 1: Human Study overview. Participants visited the lab 13 times. Measurements were
divided into pre-exposure measurements, exposure sessions and post-exposure
measurements. NQ: Nutrition Questionnaire; M-STP: Monell forced-choice sweet taste
preference test; TLFB: time line follow back; fMRI: functional magnetic resonance imaging.
Figure 2. Changes in insulin sensitivity and brain response to sweet taste in humans
Changes in insulin sensitivity and brain response to sweet taste in humans
(A) Relative change in first phase OGTT plasma glucose (left) and insulin (right) iAUC0-30 from
pre to post beverage exposure. Post beverage exposure, insulin levels were significantlybioRxiv preprint first posted online Feb. 22, 2019; doi: http://dx.doi.org/10.1101/557801. The copyright holder for this preprint
(which was not peer-reviewed) is the author/funder, who has granted bioRxiv a license to display the preprint in perpetuity.
It is made available under a CC-BY-NC-ND 4.0 International license.
elevated in the sucralose plus maltodextrin group compared to the sucrose and sucralose
groups (false discovery rate corrected t tests; both P=0.03). (B) Change in plasma glucose (left)
and insulin (right) plotted per individual and per group in the adolescents study. The adolescent
study was terminated because two participants in the sucralose plus maltodextrin group showed
highly elevated insulin (and HOMA-IR) levels post beverage exposure. Permutation testing
(n=1000) indicated that the difference scores of this group are significantly different from the
sucrose and sucralose groups together (p=0.043). (C) Relative change in plasma insulin iAUC0-
30m from pre to post beverage exposure is significantly related to fMRI BOLD change in the
sucralose plus maltodextrin young adults group during sucrose ingestion. The relation indicates
that percent increase in blood insulin, decreases fMRI BOLD responses to sucrose in the
anterior cingulate, left anterior insula, right substantia nigra/ventral tegmental area (VTA), right
posterior insula and right putamen. All reported clusters are corrected for a cluster-wise FWE
correction threshold of PbioRxiv preprint first posted online Feb. 22, 2019; doi: http://dx.doi.org/10.1101/557801. The copyright holder for this preprint
(which was not peer-reviewed) is the author/funder, who has granted bioRxiv a license to display the preprint in perpetuity.
It is made available under a CC-BY-NC-ND 4.0 International license.
Figure 3. Metabolic changes in mice. (A) Hourly ad libitum drink intake of the presented 1.5ml
solution across groups. We found no differences across groups in total intake, and average rate
of intake between 14:00 and 20:00. (B) Hourly change in respiratory exchange ratio (RER)
across groups. RER in the sucrose group deviated from the sucrose plus sucralose and
sucralose groups (false discovery rate corrected across 3x24 t tests; all highlighted PbioRxiv preprint first posted online Feb. 22, 2019; doi: http://dx.doi.org/10.1101/557801. The copyright holder for this preprint
(which was not peer-reviewed) is the author/funder, who has granted bioRxiv a license to display the preprint in perpetuity.
It is made available under a CC-BY-NC-ND 4.0 International license.
difference across groups between 14:00h and 20:00h. (*) Sucrose plus sucralose vs sucrose,
(#) sucrose plus sucralose vs sucralose, (&) sucrose vs sucralose. We found no group
differences across all measures on a 24h time scale.
Tables
Cluster MNI {mm}
Region p(FWE) size k (2x2x2mm) T x y z
L Insula < 0.001 385 8.95 -46 12 -8
L Insula 4.73 -38 10 -14
L Rolandic
4.69 -58 4 8
operculum
R STG < 0.001 901 6.1 50 -20 6
R STG 6.02 66 -26 6
R pInsula 5.54 38 -4 -2
SN/VTA < 0.001 265 5.54 8 -26 -18
R Cerebellum 5.49 16 -36 -20
R Cerebellum 5.29 22 -42 -26
ACC < 0.001 462 5.47 -8 14 36
ACC 5.27 8 12 42
SMA 4.79 0 -2 62
R STG 0.041 103 5.44 62 -36 20
L PCG < 0.001 255 5.25 -58 -20 20
L PCG 4.69 -60 -20 34
L PCG 4.62 -50 -22 26
L PCG 0.026 115 4.68 -30 -44 58
L PCG 4.25 -30 -32 62
L PCG 3.67 -24 -28 72
Table 1. Negative relation between Δ insulin iAUC0-30m and brain response to sucrose. The
table shows the cluster-wise FWE corrected peak coordinates that show a decreased response
when tasting sucrose as a function of increases in plasma insulin levels during the first 30
minutes of the OGTT in the sucralose plus maltodextrin adult group. The contrast was masked
for grey matter only voxels. L: left; R: right; STG: superior temporal gyrus; SN: substantia nigra;
VTA: ventral tegmental area; ACC: anterior cingulate cortex; SMA: supplementary motor area;
PCG: postcentral gyrus.You can also read