The Relationship Between the Burnout Syndrome Dimensions and Body Mass Index as a Moderator Variable on Obese Managers in the Mexican Maquiladora ...
←
→
Page content transcription
If your browser does not render page correctly, please read the page content below
ORIGINAL RESEARCH
                                                                                                                                             published: 04 February 2021
                                                                                                                                        doi: 10.3389/fpsyg.2021.540426

                                            The Relationship Between the
                                            Burnout Syndrome Dimensions and
                                            Body Mass Index as a Moderator
                                            Variable on Obese Managers in the
                                            Mexican Maquiladora Industry
                                            Oziely Armenta-Hernández 1 , Aidé Maldonado-Macías 2* ,
                                            María del Rocío Camacho-Alamilla 2 , Miguel Ángel Serrano-Rosa 3 ,
                                            Yolanda Angélica Baez-Lopez 4 and Cesar Omar Balderrama-Armendariz 5
                                            1
                                             Electric and Computing Engineering Department, Universidad Autónoma de Ciudad Juárez (Autonomous University of
                                            Ciudad Juarez), Ciudad Juarez, Mexico, 2 Industrial Engineering and Manufacturing, Universidad Autonoma de Ciudad
                          Edited by:        Juárez (Autonomous University of Ciudad Juarez, Ciudad Juarez, Mexico, 3 Department of Psychobiology, Universidad de
                 Ana Jiménez-Zarco,         Valencia (University of Valencia), Valencia, Spain, 4 Facultad de Arquitectura, Ingeniería y Diseño, Universidad Autónoma de
  Open University of Catalonia, Spain       Baja California (Autonomous University of Baja California), Baja California, Mexico, 5 Department of Industrial Design,
                                            Universidad Autónoma de Ciudad Juárez (Autonomous University of Ciudad Juarez), Ciudad Juarez, Mexico
                       Reviewed by:
               Stanislava Harizanova,
   Plovdiv Medical University, Bulgaria
                                            Burnout syndrome (BS) and obesity are two growing conditions that affect employees’
                            Ilaria Setti,
             University of Pavia, Italy     health and company productivity. Recently, several studies have pointed to a possible
                  *Correspondence:          relationship between both phenomena. However, such a relationship has not been
              Aidé Maldonado-Macías         clearly defined. This research analyzes the relationship between BS dimensions and
                   amaldona@uacj.mx
                                            body mass index (BMI), the latter being treated as a moderator variable among
                   Specialty section:       obese senior and middle managers in the Mexican maquiladora industry through a
         This article was submitted to      structural equation model. A total of 361 senior and middle managers (124 of them
          Organizational Psychology,
               a section of the journal     classified as obese under the World Health Organization’s criteria) completed both the
               Frontiers in Psychology      Maslach Burnout Inventory-General Survey [with emotional exhaustion (EE), cynicism,
          Received: 26 March 2020           and professional efficacy (PE) as subscale dimensions] and a sociodemographic
         Accepted: 11 January 2021
                                            questionnaire (which included BMI). The results showed a statistically significant
        Published: 04 February 2021
                                            relationship between EE and PE (P < 0.001; β = -0.320), with BMI acting as a moderator
                              Citation:
                 Armenta-Hernández O,       variable. The results showed that when BMI increases as a moderator variable, the
                  Maldonado-Macías A,       strength of the relationship between EE and PE also changes. For example, although
                Camacho-Alamilla MdR,
    Serrano-Rosa MÁ, Baez-Lopez YA          PE had a negative value of 0.14 before the moderator effect, the value increased up to
       and Balderrama-Armendariz CO         0.32 when the BMI was factored into the relationship. Therefore, maquiladora industries
      (2021) The Relationship Between
                                            are being advised to increase their investments on the identification and prevention of
   the Burnout Syndrome Dimensions
and Body Mass Index as a Moderator          employees’ EE and obesity. Such interventions would promote a better quality of life
           Variable on Obese Managers       and could prevent economic losses resulting from poor employee performance.
 in the Mexican Maquiladora Industry.
            Front. Psychol. 12:540426.      Keywords: obesity, Burnout Syndrome (BS), professional efficacy, middle and senior management, maquiladora
      doi: 10.3389/fpsyg.2021.540426        industry, body mass index

Frontiers in Psychology | www.frontiersin.org                                      1                                         February 2021 | Volume 12 | Article 540426
Armenta-Hernández et al. Relationship of BMI and Burnout Dimensions
INTRODUCTION (Zhang and Feng, 2011). In addition, employee attrition (Van
Bogaert et al., 2010; Schaufeli et al., 2009; Tong et al., 2020)
There are two large health problems in Mexico: high levels of earlier departure from work (Bosqued, 2008), poor performance,
work stress, whose chronic form is known as Burnout Syndrome production errors (Ross, 1993), and quality issues (Srivastava
(BS), and an increasing number of obese people. The literature and Barmola, 2011; Dai et al., 2021). Work relationships can be
suggests that both problems could be related to each other. This deteriorated because of cynicism (Rubio, 2003; Ahola et al., 2012;
paper aims to explore such a relationship more deeply. According Tavella et al., 2020). According to the American Institute of Stress,
to surveys conducted by the Mexican Social Security Institute all these consequences cost the US industry more than $300
(I), Mexico features a high rate of incidence of work stress billion dollars a year. Additionally, in industrial employees under
as 75% of Mexican employees experience it at work, whereas 45 years old, the risk of mortality has increased by 26% because
in China (73%) and the United States percentages drop to 73 of exhaustion, by 29% due to cynicism, and by 22% because of
and 59%, respectively (Estrés Laboral, 2013). Moreover, results lack of PE (Schaufeli et al., 2009). In addition, diverse occupations
from a recent study conducted by the Universidad Autónoma de worldwide have been affected by BS (Bouza et al., 2020). Clearly,
Nuevo León (Autonomous University of Nuevo Leon) among 500 the BS is affecting productivity.
Mexican professionals showed all the study subjects to feature a The second problem, already mentioned, is obesity. The
certain degree of BS and more than 60% of them to experience it Mexican population shows high rates of obesity, which is
in high levels (CIDICS 2018). Finally, because both obesity and currently considered a national health priority since more than
work stress are related to cardiovascular and metabolic diseases, 70% of the adult population is overweight. Among individuals
they lead directly to high rates of premature death or diseases, in middle and senior management positions, specifically, obesity
which takes a toll on the productivity of organizations. is on the rise. The World Health Organization (WHO) defines
The BS is an affective state characterized by feelings of obesity as a condition characterized by abnormal or excessive
emotional exhaustion (EE), physical fatigue, and cognitive fat accumulation (Dávila-Torres et al., 2015) resulting from
weariness, all of which lead to a depletion of energetic resources several and complex factors and an imbalance between the
as a result of the constant exposure to chronic work and life calories consumed and those expended (Proper et al., 2013;
stress (Armon et al., 2010; Tavella et al., 2020). Additionally, Fox et al., 2019). Body mass index (BMI), which considers a
BS can have a negative impact on cognitive performance and person’s weight (kg) and height (m), is normally used as an
mood affecting employees’ productivity and performance (Penz obesity/overweight indicator. In this regard, the WHO describes
et al., 2018). The condition consists of three dimensions: EE, a person as overweight when his/her BMI is equal to or higher
cynicism, and professional efficacy (PE). The first one (EE) is than 25 kg/m2 ; obese, when the BMI is equal to or higher than
characterized by weariness and fatigue, which can be either 30 kg/m2 ; and featuring normal weight, when the BMI ranges
physical or mental. Cynicism, on the other hand, refers to an between 18.5 and 24.9 kg/m2 (World Health Organization, 2020).
attitude of indifference, personal devaluation, and detachment The effects of obesity in working environments are
from work, and defensiveness toward exacting job demands productivity loss, compensations for disability and extra
(Moreno-Jiménez et al., 2001; Cohan and Davenport, 2018; deployment of support services for sufferers (Finkelstein et al.,
Tavella et al., 2020). Finally, PE is associated with poor work 2010; Bomberg et al., 2017). Consequently, the economic losses
performance and lack of productivity (Maslach and Jackson, derived from health issues among full-time workers in the
1981; Cohan and Davenport, 2018). Consequently, the BS United States reach an estimate of 73.1 billion dollars each year
has adverse effects on employees’ wellbeing and performance (Erazo, 2012). Moreover, obesity is related to feelings of work
(Bianchi et al., 2015b). A national survey conducted by an insecurity among workers (Han et al., 2011), idleness (Luckhaupt
insurance company in the United States found that 25% of et al., 2014), a hostile work environment (Hellerstedt and
workers perceive their job as their main stressor and that for Jeffery, 1997), perceptions of high psychological job demands
seven out of ten employees; work is a common cause of health (Blandina-Fernández and González-Jaimes, 2014), and scarce or
problems and decreased productivity (Hudson, 2005; Bianchi deficient managerial support (Honkonen et al., 2006). Similarly,
et al., 2015a). Furthermore, a study conducted by Global HR other studies have aimed to analyze the effects of little physical
Consulting in the departments of engineering, manufacturing, activity, which is typical of the new sedentary jobs (Eberly and
and marketing for a wide range of companies revealed that one Feldman, 2010; Moueleu Ngalagou et al., 2019), the long work
out of seven managers had lost one or more staff members as shifts (Charles et al., 2009), and the prolonged working hours
result of BS and that a third of the sample had seen a decline in (Luckhaupt et al., 2014). Among the consequences found are an
productivity (van den Berg et al., 2011). increase in somnolence (Kivimäki et al., 2006) and alterations in
Currently, the three main causes for productivity decrease are employees’ eating habits (Berset et al., 2011).
lack of control over one’s job, insufficient skills, and high work As can be seen, two of industrialized society’s most important
demands (Srivastava and Barmola, 2011; Aranda et al., 2014). problems coexist in Mexico, which makes this country a special
Additionally, some authors have related these causes to other place to study the relationship between both phenomena.
mental conditions as depression (Bianchi et al., 2015a; Parker Specifically, in Mexico, an important portion of the industrial
and Tavella, 2021). Regarding the BS, low productivity is a result sector focuses on export manufacturing. This sector is known as
of physical and EE (Borritz et al., 2010; Tavella et al., 2020), the maquiladora industry and consists of 5,171 manufacturing
which, in turn, contribute to high levels of employee absenteeism companies, which employ 2,730,816 workers, billing around
Frontiers in Psychology | www.frontiersin.org 2 February 2021 | Volume 12 | Article 540426Armenta-Hernández et al. Relationship of BMI and Burnout Dimensions
$7,233.37 million US dollars yearly and making up 60% of and PE. The rationale of the analysis understands the employees’
the nation’s total exporting goods (INEGI, 2019). The Mexican performance as a dependent variable affecting their subjective
state of Chihuahua alone generates 13.6% of the Mexican involvement. Thus, employees’ performance and productivity
manufacturing, transnational industry’s entire income. Within depend on their skills and knowledge, emotional and physical
Chihuahua, Ciudad Juarez is one of the ten most important variables as well; that is, the feeling of PE is a variable that
industrial cities in Mexico and the most important United States- we consider fundamental to understand managers’ involvement,
Mexico border city in terms of industrial development as it performance, and productivity. Additionally, this variable can
employs 279,900 workers across its approximately 324 different be influenced by the emotional state of workers (reflected in
manufacturing companies. Additionally, Ciudad Juarez ranks EE and cynicism). Accordingly, physical variables such as BMI
first in industrial employment per capita as well as in exports. can influence PE perception, which reflects a sedentary and
The city is also responsible for the creation of 20% of the nation’s unhealthy lifestyle among obese managers. This interdisciplinary
industrial jobs (INEGI, 2019), which makes up about 14.2% of and comprehensive approach aims to explore the complexity of
the industrial workforce in Mexico. Furthermore, Ciudad Juarez these employees’ behavior. This behavior depends not only on
can reach the highest rates of production as well as the highest psychosocial variables but also on physical ones as BMI, which
number and variety of industrial job positions nationwide. could be just the tip of the iceberg to increasing knowledge
Finally, although the maquiladora production is exported mainly of this lifestyle.
to the United States, other countries such as China and Korea are Although the BS is studied as a whole, several studies
also active participants in this economic activity. have approached its dimensions and the relationships among
Such level of growth in the maquiladora industry has them by questioning their dependence or independence (Shirom
entailed high mental job demands and highly stressful work et al., 2006). Thus, EE and cynicism (two central dimensions
environments, which can increase the incidence of the BS among of the BS) are strongly associated to each other, while PE
employees. Managers in the maquiladora industry regularly work has weaker associations with the other dimensions (Kim and
long shifts in sedentary work conditions, which force them to Ji, 2009). In this sense, the associations among the three
adopt straining postures (Valadez-Torres et al., 2017; Armenta- dimensions could reflect the order of appearance. Leiter and
Hernandez et al., 2020). Furthermore, the maquiladoras’ Maslach (1988) suggested that the BS process typically follows
multicultural work environment places considerable mental these stages: EE is followed by cynicism, which results in
burdens on them and demands additional job skills for lower PE. However, from a person-oriented methodology,
which employees’ mental resources may be insufficient, all this the manifestation of the BS symptoms would vary across
resulting in BS. In addition, company managers are constantly individuals (Mäkikangas and Kinnunen, 2016). In fact, the
engaged in complex decision-making processes inside contexts BS was originally described as a dynamic process resulting
of uncertainty; where their very permanence on their jobs is from "untreated, long-lasting work stress” (Maslach and Leiter,
at times just as uncertain. Such work conditions can affect 2016); that is, a condition where the body is constantly
the company’s organizational environment (Salgado and Mejía, exposed to stressful situations that can lead to BS by means
2008; Dyrbye et al., 2020). On the other hand, the long hours of the homeostasis mechanism alteration. This system has
(up to 36 h in a row) that managers must sometimes work two main components: the sympathetic nervous system and
often compromise their eating habits and can, in turn, cause the hypothalamic–pituitary–adrenal (HPA) axis (Foss and
obesity (Montiel et al., 2014; Sirén et al., 2018). Lastly, one of Dyrstad, 2011; Gómez-Alcaina et al., 2014). The first one is
the factors affecting managers the most is the constant need responsible for preparing the body to respond to a fight-or-
to interact with the people they oversee while trying to meet flight situation. However, a constantly activated nervous system
their superiors’ demands (Guerrero and Vicente, 2001; Macias- does not allow the organs to recover, and the person might
Velasquez et al., 2019; Armenta-Hernandez et al., 2020). As was develop several disorders, including cardiovascular, respiratory,
mentioned before, the maquiladora industry is the main source gastrointestinal, muscular, dermatologic, sexual, endocrine, and
of employment and foreign investment in Mexico, and because immune problems (Llaneza Alvarez, 2003; Lever-van Milligen
of their key role in it, middle and senior managers are exposed to et al., 2020). The second component of the stress system, the
highly stressful circumstances. HPA axis, becomes activated in the face of EE (Parent-Lamarche
and Marchand, 2018); then the cortisol hormone is released
(Björntorp, 2001) causing neural, physiological, coronary, and
THEORETICAL FRAMEWORK: immunological effects in human organism (Lateef et al., 2020).
RELATIONSHIPS AMONG BS This hormone causes fat accumulation in the abdominal tissue
DIMENSIONS AND BMI (Kyrou and Tsigos, 2009) and is usually considered to be
a biomarker for the BS (Dallman, 2010; Parent-Lamarche
The initiative to study the relationship between BS and obesity is and Marchand, 2018; Penz et al., 2018; Penz et al., 2019;
an attempt to increase the understanding of both conditions as Lever-van Milligen et al., 2020).
worldwide problems since they both involve psychophysiological Additionally, it is known that obesity and metabolic
responses that cause negative changes in individuals’ behaviors deregulation impair the HPA axis; thus, their relationship is
(De Vriendt et al., 2009). This paper focuses on the BS; specifically bidirectional. Specifically, obesity and metabolic deregulation
on the mediating role that BMI plays in the relationships among influence the HPA axis for different reasons: over activation, a
the BS dimensions centering in detail in that one between EE decreased sensitivity to negative feedback mechanisms, or a loss
Frontiers in Psychology | www.frontiersin.org 3 February 2021 | Volume 12 | Article 540426Armenta-Hernández et al. Relationship of BMI and Burnout Dimensions
in the sensitivity of peripheral tissues to glucocorticoid activity the BS dimensions and BMI by analyzing normal, overweight,
(Seimon et al., 2013). Another recent meta-analysis has associated and obese individuals. These authors found that the model for
stress with BMI (Tenk et al., 2018), and greater abdominal managers featuring normal weight has a larger explanatory power
obesity has been associated with a greater HPA responsiveness. than the models developed with overweight and obese employees.
Moreover, stressors (psychological and physiological) can also Recently, another study (Armenta-Hernandez et al., 2020) found
trigger cortisol secretion, thus causing weight gain and, therefore, that both BS and physical activity are factors that have a direct
obesity (Incollingo Rodriguez et al., 2015). All these mechanisms effect on the BMI of obese managers, and their research is
are related to stress by means of the HPA activation. Thus, obesity currently conducting examinations in search for more explicative
could increase the sensitivity of physiological stress mechanisms. models. For instance, it was found that PE is related to normal
Some other reasons why stress has an influence on obesity could weight because when employees feel efficient at work, they worry
be that in critical moments (e.g., after a dismissal), people are about their health, take care of their physical appearance, and
more likely to start or resume unhealthy habits (e.g., smoking, even improve their relationships at work (Eberly and Feldman,
drinking); they might experience sleep disorders, and they can 2010). Similarly, EE and cynicism have been associated with high
abruptly modify their eating habits (Nevanperä et al., 2012; Ahola BMI since both dimensions can alter eating habits and increase a
et al., 2012). Similarly, because employees usually have little time person’s caloric intake. In fact, eating disorders are usually a result
to prepare healthy meals, they often resort to unhealthy eating of stress-related emotions (Kouvonen et al., 2005; Nevanperä
(Barattucci, 2011). Also, stressed managers might forget or skip et al., 2012). Such findings point to BMI as a possible moderator
breakfast (Montiel et al., 2014) or might replace healthy meals variable, but so far, BMI as a moderator of the BS has been
with tea and soft and caffeinated drinks (Druce et al., 2004), insufficiently studied. Accordingly, a moderator effect of the BMI
which increase anxiety, irritability, and exhaustion since they was thought to be focused on obese individuals.
cause sharp rises in blood sugar (Wang et al., 2013). Likewise, a Recent advances have found relationships between the BS
fat-rich diet causes leptin resistance (Carlo et al., 2007). All these and BMI in obese managers, for example (Armenta-Hernández
factors could be related to the connection between brain and gut, et al., 2018) and those that relate microbiome, brain and gut
known as brain-gut axis, where it is depicted how microbiomes activity, (brain-gut axis). Furthermore, the contributions of those
influence the brain and some psychiatric pathologies associated authors that have studied the mental disorders such as (Bioque
with emotions and cognition (Bioque et al., 2020). et al., 2020). It is important to test the possible mediating role of
Therefore, if stress influences the BS and obesity, an BMI in the relationships among the BS dimensions; specifically,
association between the two is highly likely. In fact, a more the core dimensions (EE and cynicism) with PE, which would
specific research study related to the BS dimensions has shown be more related to productivity, in the sense that workers with
that EE and cynicism are associated with low physical activity low PE would reduce their motivation and consequently their
and alcohol consumption, while a reduced perceived PE is productivity (Banerjee, 2015). Consequently, this research aims
associated with obesity (Andreyeva et al., 2014). Therefore, the to address this gap by analyzing the relationships within the BS
literature points to the BS and obesity as resulting from the dimensions and the mediating role of BMI, treating the latter as a
adverse conditions of the work environment (Borak, 2011) and moderator variable among obese senior and middle managers in
as potentially leading to serious economic and health concerns. the maquiladora industry of Ciudad Juarez.
Nevertheless, the scientific community has not yet managed to Specifically, in this study we will test the following hypotheses:
establish a clear relationship between obesity and the BS (Iversen
et al., 2012; López-Morales and Garcés, 2012; Nevanperä et al., H1a: BMI moderates the negative relationship between
2012; Scott and Johnstone, 2012; Solovieva et al., 2013). Hence, Emotional Exhaustion and Professional Efficacy in such
considering that the BS and obesity have visible negative effects a way that the relationship is stronger under a high BMI
on employees’ health in both the behavioral and the psychological as opposed to under a low BMI.
aspect as well as in the working environment where they interact
most of the workday, studying the relationship between both The tentative hypothesis is that EE is related to PE because
phenomena becomes urgent. However, the literature where a the increase in BMI would cause a sensation of fatigue (difficulty
relationship between both conditions is established is scarce, of movement, breathless, discomfort), which would, in turn,
especially in the case of studies considering the effect of increase physical exhaustion, affecting emotions and influencing
individuals’ BMI on the three BS dimensions. One exception is negatively on PE.
the research carried out by Ahola et al. (2012), who found that
only low PE was significantly associated with obesity, while the H1b: BMI moderates the negative relationship
dimensions of EE and Cynicism were significantly related to low between Cynicism and Professional Efficacy since
physical activity. In addition, the study of Moueleu Ngalagou the relationship is stronger under a high BMI as opposed
et al. (2019), associated BS with low physical activities leisure to under a low BMI.
and sport practice among employees. Additionally, some authors
have found evidence of the relationship between the BS and Considering that Cynicism reduces risk perception (i.e.,
obesity among middle and senior managers of the Mexican disregarding healthy behaviors such as eating), this tentative
manufacturing industry. This is the case of the study by Armenta- hypothesis intends to prove that high cynicism and BMI will
Hernández et al. (2018), who studied the relationship between negatively influence PE.
Frontiers in Psychology | www.frontiersin.org 4 February 2021 | Volume 12 | Article 540426Armenta-Hernández et al. Relationship of BMI and Burnout Dimensions
Conceptual Model to Test the BS. It consists of 16 questions or items grouped into
To respond to these hypotheses, the hypothetical model using three dimensions: EE, (Emo Exha, five items), cynicism
Partial Least Squares-Structural Equation Modeling (PLS-SEM) (Cynicism, five items), and PE (Prof_Eff, six items)
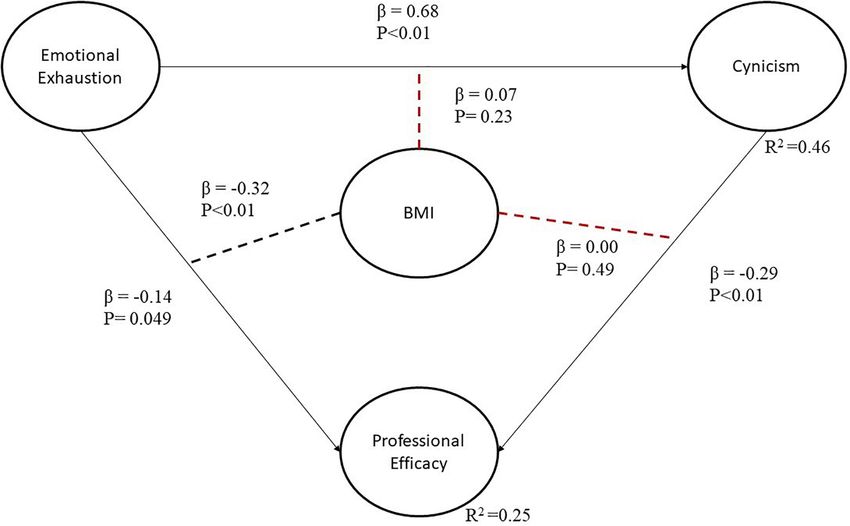
will be used. Figure 1 shows the effects of BMI on the relation of (Moreno-Jiménez et al., 2001).
the BS dimensions. Note that EE, cynicism, and PE are treated Eight field experts, six industrial managers and two scholars,
as endogenous latent variables. In turn, EE has five indicators, evaluated the survey to make sure the items were properly
cynicism has four, and PE has five. On the other hand, BMI formulated, considering the research context.
is treated as an endogenous latent variable made up of two MBI-GS had to be answered using a seven-point Likert scale
indicators (weight and height). The latter is a moderator variable, where: 0 = never, 1 = rarely throughout the year, 2 = sometimes
and the relationships are shown as discontinued lines in Figure 1. throughout the year, 3 = on many occasions throughout the
year, 4 = frequently throughout the year, 5 = almost every day,
and 6 = every day.
MATERIALS AND METHODS
Descriptive Analysis of the Sample
Participants The SPSS 24.0 statistical software was used to analyze the
R
The data were collected from staff in six maquiladora industries sociodemographic information of the obese sample (i.e., gender,
located in Mexico. Three of these companies are automotive level of studies, marital status, and type of contract, seniority,
manufacturers, two are electrical manufacturing companies, and and current position). Additionally, crosstabs were built between
one assembles miscellaneous products. The sample included variables to better understand the prevalence of obesity and
senior managers from different departments such as production, occupational stress among middle and senior managers. Finally,
human resources, maintenance, environment, and quality. The average scores for each dimension, as well as the BS degrees and
middle management positions involved in the survey included levels were estimated for the descriptive analysis of the BS.
supervisors, technicians, group leaders, and administrative staff. The statistical procedure used to test the hypotheses of the
A total of 361 questionnaires were collected and classified model followed several steps. First, the SPSS 24.0 statistical
R
according to the respondent’s BMI values. However, the software was used to feed the collected data into a database.
study considered only the surveys of the 124 respondents Then, that database was screened so that missing and extreme
classified as obese. values could be identified. Missing values are items that are left
Regarding the sociodemographic characteristics of the unanswered because participants do not know how to answer a
complete sample, 69% of the interviewed managers were men, question or do not want to respond to it (Ketkar et al., 2012). In
while 31% were women. Additionally, the results showed this research, the missing values of a survey were replaced with
supervisors and technicians to be the population that suffers the median value of the item if the missing rate was less than
most frequently from obesity and overweight. The ages of the 10%; otherwise, the survey was removed from the analysis (Wold
people in the sample ranged from 18 to 60 years old, with an et al., 2001; Lin et al., 2015; Sovilj et al., 2016). As for outliers,
arithmetic mean of 37 years and a standard deviation of 9.2 years. every item was standardized, and only those with a value ranging
Finally, employee seniority ranged from 1 to 372 months, from -4 to 4 were included in the analysis. Finally, absolute values
with an arithmetic mean of 103.12 months and a standard equal to or higher than 4 were considered outliers and replaced
deviation of 83.9 months. by the median (González-Arteaga et al., 2016). The median was
The sample included senior and middle managers, namely used instead of the mean because the data collected was ordinal
supervisors, technicians, group leaders, and administrative staff. (Mani et al., 2016). Once these steps were done, SEM required the
After each participant signed a consent form, face-to-face latent variable validation. This procedure is further explained in
interviews were conducted for the MBI-GS. On the other hand, the following section.
BMI measures were collected by having participants provide Once the previous statistical procedure was done and data
their height (m) and weight (kg) measurements (anthropometric were screened, the latent variables were validated to determine
variables), and a recommended 2.5 cm was subtracted from whether their predictive power to explain the dependent
each participant’s height values (Kharin and Voloshko, 2011). variables was good. This analysis was conducted with the
Nonetheless, once respondents recorded their values, the medical help of the WarPLS software, and the following coefficients
staff (industrial nurses) took such anthropometric measures were estimated: Cronbach’s alpha and composite reliability,
properly, using the available calibrated equipment provided by Average Variance Extracted (AVE), Predictive validity indices
each company. These were the measurements that were used (Coefficients R2 and adjusted R2 were estimated), and Variance
in the analyses. The BMI was used as moderator variable, Inflation Factors (VIF).
classifying it according to the WHO’s criteria; however, only the
obese participants’ data was analyzed; that is, the data of those Model Evaluation
individuals with a BMI of 30 kg/m2 or greater. The model was tested using WarpPLS 5.0, whose main R
algorithms are based on partial least squares (PLS) – widely
Measures recommended for small-sized samples (Braunscheidel and
The Spanish translated version of the Maslach Burnout Suresh, 2009). The model’s reliability was tested through a
Inventory-General Survey (MBI-GS) was used to measure re-sample bootstrapping procedure, which uses randomized
Frontiers in Psychology | www.frontiersin.org 5 February 2021 | Volume 12 | Article 540426Armenta-Hernández et al. Relationship of BMI and Burnout Dimensions
FIGURE 1 | Hypothetical model.
samples taken from the original sample in order to improve average scores of BS are usually compared with respect to national
model stability (Hayes and Preacher, 2010). An important part average scores. However, national BS scores for Mexico are still
of the model’s evaluation involved checking for discriminant unknown. Table 2 shows the average scores of the three BS
validity and observing the model efficiency indices. Additionally, dimensions: EE, cynicism, and PE.
direct, indirect, and total effects of significant relationships In addition, Table 3 shows the degrees of BS in the
among variables needed to be determined as well as obese sample. The results reveal a medium level of BS
the effect sizes. in EE and cynicism and a low level in PE. It is worth
In this research, all the effects were statistically tested mentioning that the cutoff points of the 33rd and 66th percentile
for a 95% confidence level (Ibarra and García, 2016; determined the grades.
Luque-Reca et al., 2014).
Latent Variables Validation
Table 4 presents the latent variable coefficients. According to
RESULTS the R-squared and adjusted R-squared values, all the latent
variables have good predictive power to explain the dependent
Descriptive Information From Obese variables. Similarly, based on the Q-squared coefficient values,
Participants all the latent variables have predictive validity from a non-
Regarding the respondents’ anthropometric information, the parametric perspective. The composite reliability coefficient
minimum height reported was 1.435 m, and the maximum was and the Cronbach’s alpha index also show that all the latent
1.875 m, with 1.672 m as the arithmetic mean and 0.092 m variables have acceptable internal validity. Likewise, the AVE
as the standard deviation. Likewise, the minimum body weight values confirm that there is enough convergent validity. Finally,
reported was 70 kg, while 115 kg was the maximum. In this case, according to the full collinearity VIFs, none of the latent variables
92.71 kg was the arithmetic mean, and 11.453 kg was the standard has collinearity problems since the values do not exceed the cut-
deviation. An additional descriptive analysis in Table 1 revealed off value of 3.3. Thus, the model and the independent variables
that it is more frequent to find obese men than obese women included for this research have good predictive validity.
(68.55% vs. 31.45%, respectively).
Model Evaluation
Burnout Syndrome Descriptive Analysis Results of Discriminant Validity Analysis
Burnout Syndrome is a three-dimensional syndrome; therefore, The results presented by the heterotrait–monotrait ratio of
to measure the presence of BS in the obese sample, the average correlations (HTMT) method indicate that all constructs are
score of each BS dimension was estimated. In scientific research, different from each other. This fact points to good discriminant
Frontiers in Psychology | www.frontiersin.org 6 February 2021 | Volume 12 | Article 540426Armenta-Hernández et al. Relationship of BMI and Burnout Dimensions
TABLE 1 | Descriptive information – obese managers sample. TABLE 4 | Validation of latent variables.
Variables N (%) Variables N (%) Coefficients Emotional Cynicism Professional BMI
Exhaustion Efficacy
Gender Marital status
Men 85 68.5 Single 29 23.4 R-squared 0.386 0.146
Women 39 31.5 Married 79 63.7 Adjusted R-squared 0.381 0.132
Age (years) Free union 12 9.7 Composite reliability 0.943 0.889 0.916 1.000
≤30 16 12.9 Widowed 1 0.8 Cronbach’s alpha 0.924 0.831 0.886 1.000
31–40 43 34.7 Divorced 3 2.4 Average variance extracted 0.766 0.670 0.687 1.000
41–50 55 44.4 Missing data 0 0 Full collinearity VIFs 1.634 1.710 1.156 1.000
≥51 10 8.1 Worked hours per week Q-squared 0.395 0.147
Missing data 0 0 32 5 4.0
Level of studies 42 28 16.1 TABLE 5 | Correlations AVEs.
Middle school 11 8.9 45 25 20.2
Emotional Cynicism Professional BMI
High school 28 22.6 48 46 37.1
exhaustion efficacy
Bachelor’s degree 71 57.3 ≥56 28 22.6
Graduate degree 12 9.7 Missing data 0 0 Emotional exhaustion 0.875 0.619 −0.241 −0.077
Missing data 2 1.6 Seniority (months) Cynicism 0.619 0.818 −0.300 −0.076
Type of contract ≤12 15 12.1 Professional efficacy −0.241 −0.300 0.808 0.125
Indefinite 112 90.3 13–24 7 5.6 BMI −0.077 −0.076 0.125 1.000
Temporary 7 5.6 25–48 20 16.1
Other 4 3.2 49–72 8 6.5 TABLE 6 | HTMT ratios.
Missing data 1 0.8 ≥73 74 59.7
Missing data 0 0 Emotional Cynicism Professional
Current job position exhausted efficacy
Manager 17 13.7 Emotional exhausted
Supervisor 42 33.9 Cynicism 0.704
Technician 20 16.1 Professional efficacy 0.271 0.358
Group leader 21 16.9
Manufact. admin. 6 4.8
TABLE 7 | Cross-loadings.
Non-Manuf. admin 16 12.9
Missing data 2 1.6 Emotional Cynicism Professional
exhaustion efficacy
TABLE 2 | Average scores of BS in the obese managers sample.
Emotional exhaustion (1) 0.895 0.567 −0.215
Dimension Mean Emotional exhaustion (2) 0.892 0.506 −0.168
Emotional exhaustion (3) 0.869 0.547 −0.187
Emotional exhaustion 9.5403 Emotional exhaustion (4) 0.866 0.542 −0.237
Cynicism 4.9758 Emotional exhaustion (5) 0.854 0.549 −0.250
Professional efficacy 28.8468 Cynicism (1) 0.563 0.880 −0.302
Cynicism (2) 0.566 0.901 −0.268
TABLE 3 | Degrees of BS for obese managers sample. Cynicism (3) 0.478 0.795 −0.244
Cynicism (4) 0.402 0.678 −0.152
Grade Emotional exhaustion Cynicism Professional efficacy
Professional efficacy (1) −0.085 −0.113 0.766
Low ≤6 ≤2 12 >7 >33 Professional efficacy (4) −0.166 −0.256 0.800
Degree, emotional exhaustion, cynism and professional efficacy values in bold are Professional efficacy (5) −0.327 −0.345 0.794
the actual average values obtained for each BS dimension in the obese managers
sample. These values are located in the reference given ranges to determine the
degrees of BS for each dimension.
Table 6 shows the ratio values of the HTMT analysis, whose
results indicate a good discriminant validity with respect to the
validity for each variable. Tables 5–7 show the resulting discrimination criteria since they show values lower than 0.85.
analysis values. Additionally, to confirm the constructs’ discriminant validity,
As can be seen in Table 5, the values in the diagonal are greater Table 7 includes the values of the cross-loadings of the items used
than the values shown above and below it. Thus, the square root to conform each dimension. Discriminant validity is established
of the AVE of each construct is higher than the construct’s highest when a certain item loading on a construct is higher than all of its
correlation with any other construct in the model. correspondent cross-loadings with other constructs. In this case,
Frontiers in Psychology | www.frontiersin.org 7 February 2021 | Volume 12 | Article 540426Armenta-Hernández et al. Relationship of BMI and Burnout Dimensions
each item included in a certain construct has the highest value Direct Effects
for the loading with its corresponding construct, while all cross- The direct effects demonstrate why two hypotheses from Figure 2
loadings with other constructs are considerably lower. Hence, (i.e., H2 and H3) were removed from the model (i.e., they were
both the HTMT method and the cross-loading criterion provide not statistically significant at a 95% confidence level). Significant
evidence of each construct’s discriminant validity for this study. direct effects are shown in black, continuous line segments. All
the relationships have a β value and a corresponding p value for
the statistical hypothesis test. For instance, in the relationship
Results of Model Efficiency Indices between EE and PE, β indicates that when the first latent variable
Once the latent variables were validated, they were integrated into increases by one standard deviation, the second latent variable
the model depicted in Figure 2. Note that the figure shows two decreases by 0.14 standard deviations or 14%. In the case of
red discontinued line segments to represent the two moderator BMI as a moderator, the results show that when workers are
effects that are statistically not significant at a 95% confidence emotionally exhausted and obese, PE decreases 32%. In other
level (i.e., the p values that are higher than 0.05). That said, before words, if BMI increases as a moderator variable, the strength
interpreting the model, it is important to analyze the model of the relationship between EE and PE changes. Accordingly, it
efficiency indices. Table 8 explains the correspondent efficiency is to be noted that PE had a negative value of 0.14 before the
indicators’ reference values and results. moderator effect, but the value increased to 0.32 when BMI was
The model fit indices shown in Table 8 demonstrate that the included in the relationship. The remaining relationships in the
model is efficient, since all the p values are lower than 0.05. model can be similarly interpreted.
In addition, the results demonstrate that the model has good Based on the standardized values of the parameters in
predictive and explanatory powers, the latter according to the Figure 3, the following equations can be formulated:
GoF index. In conclusion, the model is efficient.
Cynicism = 0.62 x emotional exhaustion + error
Once the model was tested and validated through the model
fit and quality indices, it was possible to interpret it by analyzing
the direct, indirect, and total effects. Professional efficacy = 0.14 x emotional exhaustion + 0.29 x
In the model, the two red discontinued line segments cynicism + 0.32 x (BMI x emotional exhaustion) + error
in Figure 2 represent the two moderator effects that are
statistically not significant at a 95% confidence level. However, Every dependent latent variable has an R2 value. This value
the final model, illustrated in Figure 3, has only significant indicates the percentage of variance explained by independent
causal relationships. latent variables. The results in Table 9 show that three
FIGURE 2 | Model with all relationships between latent variables.
Frontiers in Psychology | www.frontiersin.org 8 February 2021 | Volume 12 | Article 540426Armenta-Hernández et al. Relationship of BMI and Burnout Dimensions
TABLE 8 | Model efficiency indices. statistically significant indirect effect, that of EE on PE (P < 0.001;
β = -0.162). In other words, when EE increases by one standard
Indicators Value Decision criteria
deviation, PE increases by 0.162 standard deviations. As for
Average path coefficient (APC) 0.343 P < 0.001 the effect sizes, EE explains 4.3% of the variance of PE (since
Average R-squared (ARS) 0.320 P < 0.001 R2 = 0.043) through cynicism.
Average adjusted R-squared (AARS) 0.308 P < 0.001 The model presents a unique indirect effect among the
Average blockVIF (AVIF) 3.690 Acceptable if ≤5, dimensions of BS, namely the relationship between the EE
ideally ≤3.3 variable and the PE variable through the cynicism variable, where
Average full collinearity VIF (AFVIF) 4.077 Acceptable if ≤5, the EE variable contributes with -0.13 units to the decrease in PE.
ideally ≤3.3
Tenenhaus (GoF) 0.495 Small ≥0.1, medium
≥0.25, large ≥0.36
Total Effects
Table 10 shows the sum of the direct and indirect effects
of every relationship. Each parameter includes a p value to
independent latent variables contribute to the variance of PE, determine the statistical significance of the effects. Similarly, the
whose R2 value equals 0.25; where EE explains 4.3%, cynicism table includes the effect sizes. Note that all the total effects are
explains 10.4%, and BMI × emotional exhaustion explains 10.7%. statistically significant at a 95% confidence level since all the
In addition, EE explains up to 38.6% of the variability of p values are lower than 0.05. As for the relationship between
Cynicism. This analysis can be appreciated in Table 7. BMI and PE, it was concluded that when the first latent variable
Concerning the direct effects among the BS dimensions, the increases by one standard deviation, the second latent variable
direct effect between EE and cynicism was found to be the decreases by 0.320 standard deviations. Likewise, the percentage
largest since when the EE variable increased by one unit, the of variance explained by the independent variable is 10.7%. All
cynicism variable increased by 0.62 units. The second largest the relationships can be similarly interpreted.
effect observed was the direct effect between cynicism and
professional performance: when the cynicism variable increased
by one unit the PE variable decreased by 0.29 units. DISCUSSION
Indirect Effects This study aimed to test the relationships between the BS
Latent variables can have indirect effects on other variables dimensions, specifically that of EE and Cynicism with PE,
through different segments. In this model, there is only one factoring in the mediating role of BMI. First the relationships
FIGURE 3 | Final model with only significant relationships.
Frontiers in Psychology | www.frontiersin.org 9 February 2021 | Volume 12 | Article 540426Armenta-Hernández et al. Relationship of BMI and Burnout Dimensions
TABLE 9 | Contribution to the R-squared. Nevanperä et al. (2012), show the fact that EE is related to
uncontrolled eating and emotions in the working population,
Emotional Cynicism BMI × emotional R2
exhaustion exhaustion while Proper et al. (2013), address the changes in BMI.
Furthermore, physiologically speaking, the stress system is
Cynicism 0.386 0.386 activated by EE, which is, in turn, linked to the release of cortisol,
Professional Efficacy 0.043 0.104 0.107 0.25 the hormone responsible for obesity (Gómez-Alcaina et al., 2014;
Epel et al., 2001; Kyrou and Tsigos, 2009; Foss and
TABLE 10 | Total effects between latent variables. Dyrstad, 2011; Marchand et al., 2014; Newman et al., 2007;
Torres and Nowson, 2007).
Emotional Exhaustion Cynicism BMI
Consequently, both hypotheses are proven. As was indicated
Cynicism β = 0.621 (P < 0.001) in the introduction, both hypotheses were tentative, considering
ES = 0.386 that although the literature suggested a relationship between
Professional β = 0.322 (P < 0.001) β = −0.29 β = −0.320 these variables, the direction or the nature is not clear. From this
efficacy (P < 0.001) (P < 0.001) study’s point of view, a possible explanation could be that people
ES = 0.095 ES = 0.104 ES = 0.107 with high EE and Cynicism and a high BMI will increase their
probability of feeling less PE. These results are interesting, but
from the standpoint of this research, they are but the surface of a
between these dimensions without the mediating role of BMI highly complex relation.
were explored. The results indicated that EE and Cynicism are A tentative explanation would be that the increase in
related to PE, thus confirming the first two hypotheses (Leiter BMI would increase fatigue sensation (difficulty of movement,
and Maslach, 1988; Shirom et al., 2006). Therefore, our study breathless, among others), which would, in turn, increase
contributes to the understanding of the relationship among the physical exhaustion, affecting emotions and causing a negative
BS dimensions by concluding that dimensions are dependent influence on PE. However, EE and BMI could be bidirectionally
and are part of the same phenomena (Kim and Ji, 2009). Hence, related, making the main (or first) factor difficult to elucidate. The
EE and Cynicism reduce PE, which would lead to a reduction same explanation could apply to Cynicism. Hence, more studies
in productivity. would be necessary to understand the nature and the direction of
Once the relationship between the BS dimensions was tested, such relationships with PE.
the next step was to investigate the mediating role of BMI on such Another important issue is the explanation of why BMI
relationships. The results support both hypotheses, by showing mediates in the relation between EE and Cynicism and PE.
that BMI does exert a role in the relation between EE, Cynicism, From a behavioral point of view, both BS dimensions could
and PE. In such a relationship, the higher the EE and BMI, the modify the eating behavior habits resulting from anxiety and
greater the negative influence on PE. These results are consistent could cause risky behaviors (unhealthy eating) as it has been
with the theory that BMI is related to the BS dimensions as has reported to happen when people suffer from a highly stressful
been shown before (Ahola et al., 2012; Armenta-Hernández et al., situation. Complementarily, these behaviors could modify the
2018). These results are also in line with the findings in previous microbiome, depending on the type of food (usually not healthy).
research works, where EE has appeared as the main BS dimension Thus, if stress increases the risk of unhealthy eating and the
associated with BMI. For instance, Nevanperä concluded that release of cortisol, both factors would modify the microbiome,
burned out employees tend to eat uncontrollably because of which is associated with brain changes that affect emotions.
negative emotions (Nevanperä et al., 2012) and EE (Kouvonen This, then, could be the way the BS dimensions and BMI could
et al., 2005). Moreover, this study is consistent with Luckhaupt be interacting, causing difficulties in regulating emotions and
et al. (2014), who concluded that office workers, administrative increasing the probability of BS.
staff, architects, and engineers are more likely to suffer from Nonetheless, while the above is a plausible explanation, more
overweight and obesity (Luckhaupt et al., 2014). On the other controlled studies are needed to explain the nature of these
hand, according to Luque-Reca et al., middle managers suffer findings. However, the authors consider this an important topic
from greater levels of perceived stress than senior managers do that could be addressed in future studies, and which could lead
since they work more hours and must follow their superiors’ to new insights from the organizational point of view. That is,
orders (Luque-Reca et al., 2014). the BS appears to be a complex syndrome that depends not
Armenta-Hernández et al. (2018), associated the dimensions only on psychosocial variables but on other variables such as
of the BS with the different BMI classifications, namely BMI. This future research could explain the relationships between
normal weight, overweight and obesity, by showing EE psychological factors (stress and burnout) with obesity and other
and Cynicism as the dimensions with the highest indirect metabolic syndromes.
effect on BMI (Armenta-Hernández et al., 2018). They also In short, this paper leaves different questions unanswered,
mention the need to consider other factors such as physical which are worth addressing. The first one relates to the matter
activity and eating habits to better describe obesity and of how the different BS dimensions are related to each other
overweight. Our results are also consistent with those of and how the BMI variable mediates in such a relationship.
other studies. For example, Ahola found that low Professional Secondly, the extent to which Microbiome-Gut-Brain Axis
Efficiency is directly related to obesity (Ahola et al., 2012). (Bioque et al., 2020) is related to BS along with other mental
Frontiers in Psychology | www.frontiersin.org 10 February 2021 | Volume 12 | Article 540426Armenta-Hernández et al. Relationship of BMI and Burnout Dimensions
illnesses, including how stress-related hormones are related to quality of life. This type of research can also help industries to
inflammatory markers, should be explored, as well as the way better understand the magnitude of the problem and develop
such an interaction may affect mood disorders (Schatzberg, 2015; efficient organizational strategies to prevent occupational stress
Soria et al., 2018). and public health problems.
CONCLUSION DATA AVAILABILITY STATEMENT
This work offers several contributions. First, it describes the The datasets generated for this study are available on request to
relationship between the three BS dimensions and BMI among the corresponding author.
obese managers, demonstrating how one important variable that
would affect work productivity (PE) (Maslach and Jackson, 1981)
is affected by both conditions. In addition, the structural equation ETHICS STATEMENT
model proposed shows this behavior in standard deviations to
help maquiladora companies identify, and eventually prevent and The studies involving human participants were reviewed and
reduce, BS incidence and its negative effects, one of which is approved by Institutional Ethics and Bioethics Committe of
BMI. In fact, targeting BS and BS-related problems can prevent the Autonomous University of Ciudad Juarez-Veredict Number
economic losses derived from employees’ poor performance CIEB-2019-43. The patients/participants provided their written
and health issues. This research support Mexican maquiladora informed consent to participate in this study. Written informed
industry in their efforts toward a healthier work environment, consent was obtained from the individual(s) for the publication of
by providing relevant knowledge on the effects of obesity on any potentially identifiable images or data included in this article.
their employees’ PE.
AUTHOR CONTRIBUTIONS
INDUSTRIAL IMPLICATIONS OA-H, AM-M, and MC-A performed the data collection. OA-H
and AM-M wrote the manuscript. AM-M acquired the funding.
The BS and obesity have serious industrial implications. Data OA-H and MC-A analyzed the model. MS-R contributed to the
on the prevalence of these conditions are widely available models’ psychophysiological understanding. YB-L reviewed the
for developed countries; therefore, these nations have been statistical procedure. CB-A improved the writing and readability
able to take corrective actions to prevent and manage the of the manuscript. All authors contributed to the article and
incidence of obesity and the BS in the workplace (Jalali et al., approved the submitted version.
2019). However, in developing countries such as Mexico, the
scientific community still needs to explore the occurrence of
these conditions, their relationship, and the implications of FUNDING
such relationships for the industrial sector. Studies on BMI,
obesity and BS in developing countries are often exclusive to This research was funded by the CONACYT (National Institute
some professions, and the information sources are unknown. of Science and Technology), which provided financial support
Additionally, obesity is one of the main public health problems through the CONACYT-INS (FRONTERAS CIENCIA) 2016-01-
in Mexico. In this research, BMI as a moderator variable is 2433 project.
associated with the three-burnout dimensions among obese
individuals to measure and analyze the effects of the resulting
relationships on work performance. From this perspective, ACKNOWLEDGMENTS
this work promotes and contributes to the study of both
obesity and the BS in Mexico when the moderator effect of We thank the participating companies for their invaluable
BMI intervenes, highlighting the importance of controlling contributions and involvement. Likewise, we thank the
psychosocial factors at work, particularly work stress. We propose UACJ (Autonomous University of Ciudad Juarez) and the
that organizations could prevent obesity by controlling the weight CONACYT (National Institute of Science and Technology)
of their workers and reducing the existence of unhealthy food for the financial support granted through the CONACYT-
in the workplace. Complementarily, reducing EE and Cynicism INS (FRONTERAS CIENCIA) 2016-01-2433 project. We also
by means of preventive programs would improve the sense acknowledge the SEMAC (Ergonomics Society of Mexico) for
of personal efficacy and therefore increasing productivity. In contacting the maquiladoras’ association, INDEX JUAREZ,
developing countries, encouraging research on obesity and the especially its health and safety council and the medical members
BS, as well as on the moderator effect of BMI, can have from the maquiladora industries. Finally, we thank Leslie Y.
positive implications for those industries seeking to improve Cedeño for her exceptional assistance in the translation and
their performance by taking into consideration the employees’ improvement of this article.
Frontiers in Psychology | www.frontiersin.org 11 February 2021 | Volume 12 | Article 540426Armenta-Hernández et al. Relationship of BMI and Burnout Dimensions
REFERENCES Dai, Y.-D., Altinay, L., Zhuang, W.-L., and Chen, K.-T. (2021). Work engagement
and job burnout? Roles of regulatory foci, supervisors’ organizational
Ahola, K., Pulkki-Råback, L., Kouvonen, A., Rossi, H., Aromaa, A., and Lönnqvist, embodiment and psychological ownership. J. Hospitality Tourism Manage. 46,
J. (2012). Burnout and behavior-related health risk factors. J. Occup. Environ. 114–122. doi: 10.1016/j.jhtm.2020.12.001
Med. 54, 17–22. doi: 10.1097/jom.0b013e31823ea9d9 Dallman, M. F. (2010). Stress-induced obesity and the emotional nervous system.
Andreyeva, T., Luedicke, J., and Wang, Y. C. (2014). State-level estimates of Trends Endocrinol. Metab. 21, 159–165.
obesity-attributable costs of absenteeism. J. Occup. Environ. Med. 56, 1120– Dávila-Torres, J., González-Izquierdo, J. J., and Barrera-Cruz, A. (2015).
1127. Panorama de la obesidad en México. Rev. Med. Inst. Mex. Seguro Soc. 53,
Aranda, C., Pando, M., and Berenice, M. (2014). Apoyo social y síndrome de 240–249.
quemarse en el trabajo o burnout: una revisión. Psicol. Salud 14, 79–87. De Vriendt, T., Moreno, L. A., and De Henauw, S. (2009). Chronic stress
Armenta-Hernández, O., Maldonado-Macías, A., García-Alcaraz, J., Avelar- and obesity in adolescents: scientific evidence and methodological issues for
Sosa, L., Realyvasquez-Vargas, A., and Serrano-Rosa, M. (2018). Relationship epidemiological research. Nutr. Metab. Cardiovasc. Dis. 19, 511–519.
between burnout and body mass index in senior and middle managers from Druce, M. R., Small, C. J., and Bloom, S. R. (2004). Minireview: Gut peptides
the Mexican manufacturing industry. Int. J. Environ. Res. Public Health 15:541. regulating satiety. Endocrinology 145, 2660–2665.
doi: 10.3390/ijerph15030541 Dyrbye, L. N., Major-Elechi, B., Taylor Hays, J., Fraser, C. H., Buskirk, S. J., and
Armenta-Hernandez, O. D., Maldonado-Macias, A. A., Ortiz Solís, M., Serrano- West, C. P. (2020). Relationship between organizational leadership and health
Rosa, M. Á, Baez-López, Y. A., and Hernández-Arellano, J. L. (2020). Effects of care employee burnout and satisfaction. Mayo Clinic Proc. 95, 698–708. doi:
job content and physical activity on body mass index among obese managers of 10.1016/j.mayocp.2019.10.041
the mexican manufacturing industry. Int. J. Environ. Res. Public Health 17:3969. Eberly, R., and Feldman, H. (2010). Obesity and shift work in the general
doi: 10.3390/ijerph17113969 population. Internet J. Allied Health Sci Pract. 8:10.
Armon, G., Melamed, S., Shirom, A., and Shapira, I. (2010). Elevated burnout Epel, E., Lapidus, R., McEwen, B., and Brownell, K. (2001). Stress may add bite
predicts the onset of musculoskeletal pain among apparently healthy to appetite in women: a laboratory study of stress-induced cortisol and eating
employees. J. Occup. Health Psychol. 15, 399–408. behavior. Psychoneuroendocrinology 26, 37–49.
Banerjee, A. (2015). Integrating human motivation in service productivity. Proc. Erazo, M. (2012). Visión global en relación a la obesidad. Rev. Méd. Clín. Las
Manufacturing 3, 3591–3598. doi: 10.1016/j.promfg.2015.07.726 Condes 23, 196–200. doi: 10.1016/s0716-8640(12)70298-5
Barattucci, Y. (2011). Estrés y Alimentación. Mar de Plata: Universidad Fasta, Estrés Laboral (2013). Instituto Mexicano del Seguro Social. Available online at:
Facultad de Ciencias en Nutricion, 1–81. http://www.imss.gob.mx/salud-en-linea/estres-laboral (accessed July 1, 2018).
Berset, M., Semmer, N. K., Elfering, A., Jacobshagen, N., and Meier, L. L. (2011). Finkelstein, E. A., DiBonaventura, M. D., Burgess, S. M., and Hale, B. C. (2010).
Does stress at work make you gain weight? A two-year longitudinal study. The costs of obesity in the workplace. J. Occup. Environ. Med. 52, 971–976.
Scand. J. Work Environ. Health 37, 45–53. doi: 10.5271/sjweh.3089 doi: 10.1097/jom.0b013e3181f274d2
Bianchi, R., Schonfeld, I. S., and Laurent, E. (2015a). Burnout-depression overlap: Foss, B., and Dyrstad, S. M. (2011). Stress in obesity: cause or consequence? Med.
a review. Clin. Psychol. Rev. 36, 28–41. Hypotheses 77, 7–10. doi: 10.1016/j.mehy.2011.03.011
Bianchi, R., Schonfeld, I. S., and Laurent, E. (2015b). Is it time to consider the Fox, A., Feng, W., and Asal, V. (2019). What is driving global obesity trends?
“burnout syndrome” a distinct illness? Front. Public Health 3:158. Globalization or “modernization”? Globalization Health 15:32. doi: 10.1186/
Bioque, M., González-Rodríguez, A., Garcia-Rizo, C., Cobo, J., Monreal, J. A., s12992-019-0457-y
and Usall, J. (2020). Targeting the microbiome-gut-brain axis for improving Gómez-Alcaina, B., Montero-Marín, J., Demarzo, M. M. P., Pereira, J. P., and
cognition in schizophrenia and major mood disorders: a narrative review. Prog. García-Campayo, J. (2014). Utilidad de los marcadores biológicos en la
Neuropsychopharmacol. Biol. Psychiatry 105, 110–130. detección precoz y prevención del síndrome de burnout. Rev. Psicopatol.
Björntorp, P. (2001). Do stress reactions cause abdominal obesity and Psicología Clín. 18:245. doi: 10.5944/rppc.vol.18.num.3.2013.12924
comorbidities? Obes. Rev. 2, 73–86. González-Arteaga, T., Alcantud, J. C. R., and De Andrés Calle, R. (2016). A
Blandina-Fernández, J. A., and González-Jaimes, N. L. (2014). Factores psico- new consensus ranking approach for correlated ordinal information based on
sociales-laborales asociados al IMC en trabajadores de la industria de Mahalanobis distance. Information Sci. 372, 546–564. doi: 10.1016/j.ins.2016.
manufactura textil. Rev. Mex. Sal. Trab. 6, 14–19. 08.071
Bomberg, E., Birch, L., Endenburg, N., German, A. J., Neilson, J., Seligman, H., et al. Guerrero, E., and Vicente, F. (2001). Síndrome de Burnout o Desgaste Profesional y
(2017). The financial costs, behaviour and psychology of obesity: a one health Estrés en el Profesorado. Servicio. Badajoz: Universidad de Extremadura.
analysis. J. Comp. Pathol. 156, 310–325. Han, T. S., Tajar, A., and Lean, M. E. J. (2011). Obesity and weight management in
Borak, J. (2011). Obesity and the workplace. Occup. Med. 61, 220–222. doi: 10.1093/ the elderly. Br. Med. Bull. 97, 169–196. doi: 10.1093/bmb/ldr002
occmed/kqr030 Hayes, A. F., and Preacher, K. J. (2010). Quantifying and testing indirect
Borritz, M., Christensen, K. B., Bültmann, U., Rugulies, R., Lund, T., Andersen, effects in simple mediation models when the constituent paths are nonlinear.
I., et al. (2010). Impact of burnout and psychosocial work characteristics on Multivariate Behav. Res. 45, 627–660.
future long-term sickness absence. Prospective results of the Danish PUMA Hellerstedt, W., and Jeffery, R. (1997). The association of job strain and health
Study among human service workers. J. Occup. Environ. Med. 52, 964–970. behaviours in men and women. Int. J. Epidemiol. 26, 575–583. doi: 10.1093/
Bosqued, M. (2008). Quemados: El Síndrome del Burnout: ¿Qué es y Cómo ije/26.3.575
Superarlo? España: Paidós Ibérica. Honkonen, T., Ahola, K., Pertovaara, M., Isometsä, E., Kalimo, R., and Nykyri,
Bouza, E., Gil-Monte, P. R., and Palomo, E. (2020). Work-related burnout E. (2006). The association between burnout and physical illness in the general
syndrome in physicians in Spain. Rev. Clin. Esp. 220, 359–363. population—results from the Finnish Health 2000 Study. J. Psychosom. Res. 61,
Braunscheidel, M. J., and Suresh, N. C. (2009). The organizational antecedents 59–66. doi: 10.1016/j.jpsychores.2005.10.002
of a firm’s supply chain agility for risk mitigation and response. J. Operations Hudson (2005). Employee Burnout, Burnout Britain: Raising the Alarm for
Manage. 27, 119–140. doi: 10.1016/j.jom.2008.09.006 Employers. A Hudson Report. Available online at: https://www.yumpu.com/en/
Carlo, A. S., Pyrski, M., Loudes, C., Faivre-Baumann, A., Epelbaum, J., and document/view/38486132/burnout-britain-raising-the-alarm-for-employers-
Williams, L. M. (2007). Leptin sensitivity in the developing rat hypothalamus. hudson (accessed September 15, 2020).
Endocrinology 148, 6073–6082. Ibarra, J., and García, F. (2016). Las demandas de factores productivos en la
Charles, L. E., Burchfiel, C. M., Gu, J. K., Andrew, M. E., Fekedulegn, D., and industria maquiladora. Estudios Económicos, Vol. 31. México, D.F: El Colegio de
Violanti, J. M. (2009). Sleep duration and biomarkers of metabolic function México.
among police officers. Ann. Epidemiol. 19:666. doi: 10.1016/j.annepidem.2009. Incollingo Rodriguez, A. C., Epel, E. S., White, M. L., Standen, E. C., Seckl, J. R.,
07.036 and Tomiyama, A. J. (2015). Hypothalamic-pituitary-adrenal axis dysregulation
Cohan, R. H., and Davenport, M. S. (2018). Productivity, meet burnout. Acad. and cortisol activity in obesity: a systematic review. Psychoneuroendocrinology
Radiol. 25, 1513–1514. 62, 301–318.
Frontiers in Psychology | www.frontiersin.org 12 February 2021 | Volume 12 | Article 540426You can also read


