Indoor-Air Microbiome in an Urban Subway Network: Diversity and Dynamics - Applied ...
←
→
Page content transcription
If your browser does not render page correctly, please read the page content below
Indoor-Air Microbiome in an Urban Subway Network: Diversity and
Dynamics
Marcus H. Y. Leung, David Wilkins, Ellen K. T. Li, Fred K. F. Kong, Patrick K. H. Lee
School of Energy and Environment, City University of Hong Kong, Hong Kong
Subway systems are indispensable for urban societies, but microbiological characteristics of subway aerosols are relatively un-
known. Previous studies investigating microbial compositions in subways employed methodologies that underestimated the
diversity of microbial exposure for commuters, with little focus on factors governing subway air microbiology, which may have
public health implications. Here, a culture-independent approach unraveling the bacterial diversity within the urban subway
network in Hong Kong is presented. Aerosol samples from multiple subway lines and outdoor locations were collected. Target-
ing the 16S rRNA gene V4 region, extensive taxonomic diversity was found, with the most common bacterial genera in the sub-
way environment among those associated with skin. Overall, subway lines harbored different phylogenetic communities based
on ␣- and -diversity comparisons, and closer inspection suggests that each community within a line is dependent on architec-
tural characteristics, nearby outdoor microbiomes, and connectedness with other lines. Microbial diversities and assemblages
also varied depending on the day sampled, as well as the time of day, and changes in microbial communities between peak and
nonpeak commuting hours were attributed largely to increases in skin-associated genera in peak samples. Microbial diversities
within the subway were influenced by temperature and relative humidity, while carbon dioxide levels showed a positive correla-
tion with abundances of commuter-associated genera. This Hong Kong data set and communities from previous studies con-
ducted in the United States formed distinct community clusters, indicating that additional work is required to unravel the mech-
anisms that shape subway microbiomes around the globe.
P eople in modern societies spend over 90% of their time in-
doors; thus, they are constantly exposed to contents present in
this primary habitat (1). Indoor air consists of a myriad of solid
concentrations between samples, with crude analysis on the com-
position of microbial communities. While these cultivation-based
studies demonstrated the roles ridership (10, 11, 17), time (18–
aerosol particles, including inhalable bioaerosols, which recently 20), and station location and design (8, 12, 13, 15) play in micro-
have been the focus of scientific research because of their impacts bial concentrations and diversity in subway air, it is not known
on public health (2). Microbial causative agents of adverse health whether this difference is representative of the entire phylogenetic
conditions have been documented in aerosols of different indoor spectrum present given the methodologies employed. According
built environments (3, 4), and such agents can be transmitted to the only sequencing-based subway microbiome study con-
between individuals in close proximity. Therefore, characteriza- ducted to date (21), subway air is made up predominantly of a
tions of indoor microbial compositions will provide information small number of microbial phyla and families, and its community
regarding the nature and extent to which individuals in indoor composition resembles that of outdoor air. While this study pro-
settings are exposed to microbial life and the breadth of microbial vides a more complete analysis of the subway microbiome, it is
life in which transmission can occur. Given its importance, micro- currently unknown whether the findings from the study can be
bial community assessments have been conducted in numerous extrapolated to subway networks of different regions around the
indoor air and surface environments (3, 5–7). globe, as different subway networks are architecturally distinct,
Of the many indoor infrastructures, subways have become in- and variations in geographic and demographic factors also may
separable elements of urban centers. Global commuters spend contribute to variations in microbiomes of built environments
sizable fractions of their times daily in this particular mode of (22–24). Moreover, as all previous studies analyzed only air sam-
transportation. Subway networks are present and are being built ples collected in stationary locations along platforms or con-
in many cities and are used regularly by an ever-increasing num- courses of a limited number of stations, the microbial communi-
ber of individuals. Therefore, the use of subways by commuters ties described may not necessarily represent the repertoire of
and their dependence on the subway are sure to be more wide- microorganisms a typical commuter is exposed to.
spread on a global scale for years to come. Unfortunately, the
microbiological contents of the aerosol in this unique built envi-
ronment are relatively unknown. The majority of current micro- Received 11 July 2014 Accepted 21 August 2014
biological assessments of subway networks had been limited to Published ahead of print 29 August 2014
conventional culture methods (8–17) or limited culture-indepen- Editor: G. T. Macfarlane
dent methods (18, 19), which are likely to underestimate the true Address correspondence to Patrick K. H. Lee, patrick.kh.lee@cityu.edu.hk.
spectrum of microorganisms present. Culture-based studies are Supplemental material for this article may be found at http://dx.doi.org/10.1128
also inherently restrictive in the comparison of microbial commu- /AEM.02244-14.
nities between samples, as the organisms cultivated for analysis are Copyright © 2014, American Society for Microbiology. All Rights Reserved.
dependent on the selective growth conditions chosen. As a result, doi:10.1128/AEM.02244-14
these studies are limited to insensitive comparisons of microbial
6760 aem.asm.org Applied and Environmental Microbiology p. 6760 – 6770 November 2014 Volume 80 Number 21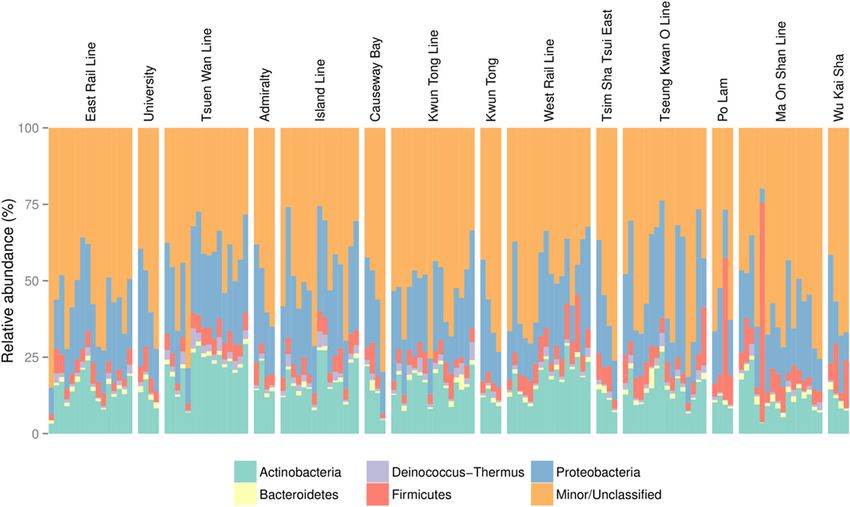
Microbial Community in Subway Bioaerosols
In this study, a comprehensive microbial community analysis performed over a span of an average of 15 days. Each sampling event on a
of bioaerosols collected in numerous subway lines within the line included air collected during entry into the paid zone, the platform
Hong Kong subway network, in addition to selected outdoor lo- environment, and inside the carriage. For each MTR sampling session,
cations throughout the city, is described. Hong Kong is one of the sampling began in the paid zone of the station concourse. Samplers
most densely populated cities in the world (6,620 persons/km2), boarded the first train arriving at the platform, disembarked after three
stops, and waited by the same platform until the third train arrived onto
and the Hong Kong subway network is among the busiest in the
the platform. The same procedure was repeated in one direction until the
world. To provide a more representative account of the breadth of
terminus station, and the samplers would board trains operating at the
microorganisms a subway passenger is exposed to, bioaerosols opposite direction and continue the sampling. After 2 h, the samplers
from subway rides rather than individual stations and concourse exited the paid zone, and this marked the end of a sampling session. Thus,
locations were collected to provide an integrated description of a sample represents a time-controlled and integrated assessment of po-
the microbial community of each sample. Using the Illumina se- tential microorganism exposure to simulate the typical commuting event
quencing technology targeting the 16S rRNA gene, communities of a passenger, combining air collected on concourse, train, and platform
from subway air collected in the different subway lines, times, and of a given line. In addition, outdoor air samples were collected at seven
days are also compared. different locations on the ground level adjacent to one of the stations
along the representative subway line. These locations were chosen so that
MATERIALS AND METHODS each location is accessible from at least one of the seven sampled lines, and
these locations are accessible regardless of the directionality of the train. A
MTR characteristics and ventilation system. The Hong Kong Mass set of four replicates, each on a different day, was performed for each
Transit Railway (MTR) network is among the world’s busiest subway outdoor location (12:15 to 14:15) during the sampling of the respective
system by patronage, with an annual ridership of approximately 1.5 lines. For all samples, environmental parameters, including temperature,
billion (http://gia.info.gov.hk/general/201106/08/P201106080126_0126 relative humidity, and carbon dioxide (CO2) concentrations, were mea-
_79963.pdf; accessed January 2014). The network consists of 10 rail lines
sured, logged, and recorded at 2-s intervals using the Q-Trak indoor air
and 84 stations (at the time of manuscript preparation), and it spans 174.7
quality monitor (TSI Inc., Shoreview, MN, USA) over the course of sam-
km of railroad tracks across the urban metropolis. Within the seven lines
plings. Instruments were calibrated prior to use.
sampled, the stations and platforms of four lines (Tsuen Wan Line
Sample collection. Air samples were collected using Leland Legacy
[TWL], Island Line [ILL], Kwun Tong Line [KTL], and Tseung Kwan O
portable sample pumps (SKC Inc., Eighty Four, PA, USA), each at a flow
Line [TWOL]) are predominantly underground and indoor. The stations
rate of 9 liters/min for 2 h. Autoclaved cellulose nitrate filters (diameter,
of these lines contain screen doors between the train tunnel and the plat-
25 mm; pore size, 0.2 m; Whatman, Maidstone, United Kingdom) were
forms as security and safety measures (see Fig. S1 in the supplemental
used to collect air samples by impaction using a Sioutas Cascade Impactor
material). For the remaining three lines (East Rail Line [ERL], West Rail
(SKC Inc., Eighty Four, PA, USA) with a D-plate accelerator (collects
Line [WRL], Ma On Shan Line [MOSL]), the trains mostly travel out-
particles with a diameter size of ⱖ0.25 m). At any given sampling time,
doors and above ground. For these three outdoor lines, the station plat-
four pumps were in operation simultaneously, and a total of 4.32 m3 of air
forms in ERL and MOSL are open to ambient air, whereas screen doors are
present in station platforms of the WRL. Trains are air conditioned, and a was collected for each sample. Prior to sampling, impactors were disas-
sophisticated ventilation system is required to ensure the efficient opera- sembled and irradiated with UV, rubber tubings were soaked in 3% so-
tion of the MTR in a subtropical climate, where heat-sink effects alone are dium hypochlorite, and all openings were sealed to prevent air entering
not sufficient to cool down the subway environment (http://www.legco into the sampling system when apparatuses were not in use. Between
.gov.hk/yr10-11/chinese/panels/tp/tp_rdp/papers/tp_rdp0506cb1-2125 sampling, filters were replaced using aseptic techniques, and the sampling
-2-ec.pdf; accessed 10 March 2014). Briefly, the MTR ventilation system apparatus, including impactors and other equipment used for handling
focuses on the underground tunnel and station areas. When piston effect the sampling apparatus, were sterilized with 70% ethanol and 3% sodium
is generated due to train movement across an underground tunnel, air is hypochlorite. Following sampling, filters were immediately stored at
pushed out toward the forward ventilation shafts, while ambient air ⫺80°C until genomic DNA (gDNA) extraction. Filters were processed
is drawn back into the tunnel at the rear of the train. When the train is within 1 month of storage at ⫺80°C. During extraction, the four filters
stationary, the piston effect is absent and air is drawn in and out of the were combined into one DNA extraction reaction mixture in order to
tunnel by intake and exhaust fans, respectively. Additional fans are pres- acquire sufficient biomass for downstream applications and analyses, as
ent on platforms to replenish ambient air of the track area during pro- microbial loads in the atmosphere tend to be lower than those of samples
longed stoppages at a station, where fresh air is supplied from below the obtained from other environments (25). Negative controls, including
platforms and air is extracted via ducts above the trains. Each station is sterile filters not exposed to MTR/outdoor aerosols, and a no-filter con-
installed with two (or more for stations with interchanges) such ventila- trol was included for extraction as well as PCR and sequencing.
tion systems, one on each side of the platform. All underground lines are Genomic DNA extraction. Following sampling, cellulose nitrate fil-
equipped with safety screen doors at station platforms, with the doors ters were subjected to gDNA extraction using the PowerSoil DNA isola-
extending to the ceilings of the station platforms. tion kit (MO BIO Laboratories, Carlsbad, CA, USA) (25), with slight
Experimental design and environmental parameters. Seven lines on methodological modifications. Briefly, tubes containing filters and C1
the Hong Kong subway network, ILL, TWL, KTL, ERL, WRL, TKOL, and lysis solution were incubated at 70°C for 10 min, followed by mechanical
MOSL, were included in this analysis. Sample collection was not per- beating using a Mini-Bead Beater 16 (Biospec Products, Bartlesville, OK,
formed on public holidays and days with extreme weather conditions, USA) for 10 min. The remaining steps were performed according to the
such as those with heavy rain and typhoon warnings (as issued by the manufacturer’s instructions. Eluted gDNA was sent to Health GeneTech
Hong Kong Observatory), to minimize any possible influence these con- Corporation (Taipei, Taiwan) for 16S rRNA gene amplification, sequence
ditions have on microbial communities. For each line, four sampling library construction, and sequencing.
times were selected: two during peak commute hours (07:45 to 09:45 and PCR, library preparation, and 16S rRNA gene sequencing. The 515f/
17:45 to 19:45) and two during nonpeak hours (10:15 to 12:15 and 15:15 806r primer pair was used to target and amplify the V4 hypervariable
to 17:15). Samples also were classified as collected during morning (a.m.) region of the 16S rRNA gene (26). The 16S region was selected because it
hours (07:45 to 09:45 and 10:15 to 12:15) as well as afternoon and evening provides a better resolution of bacterial phyla (27). PCR amplification was
(p.m.) hours (15:15 to 17:15 and 17:45 to 19:45). Four replicates were performed in a 20-l reaction volume containing 10 l 2⫻ Phusion HF
performed for each line at the times indicated above, with each replicate master mix (New England BioLabs, Ipswich, MA, USA), 0.5 M each
November 2014 Volume 80 Number 21 aem.asm.org 6761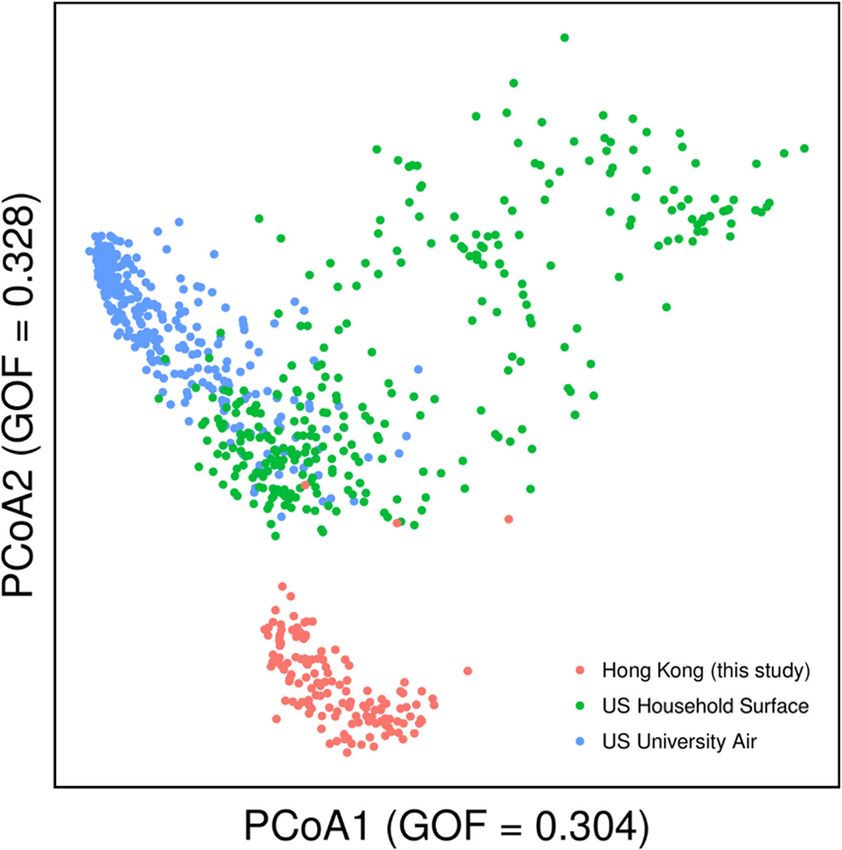
Leung et al.
forward and reverse primer, consisting of customized barcodes present on performed to compare microbial communities from our study to indoor
both primers for multiplex sequencing, and 50 to 150 ng DNA template. samples collected from air and surface samples from previous reports (5,
The PCR conditions consisted of an initial 98°C for 30 s, followed by 30 36). These reports were selected because they targeted the same V4 16S
cycles of 98°C for 10 s, 54°C for 30 s, and 72°C for 30 s, as well as a final rRNA gene region using the Illumina sequencing platform. Sequences
extension of 72°C for 5 min. Positive amplification was verified next by from all three studies were clustered against the filtered Greengenes data-
agarose gel electrophoresis. Amplicons in triplicates were pooled and pu- base in addition to de novo sequences from the current study, based on
rified using AMPure XP beads (Agencourt, Brea, CA, USA) and quantified 97% sequence identity. Sequences from the other studies which did not
using a Qubit double-stranded DNA HS assay kit on a Qubit fluorometer cluster were placed into singleton clusters. The similarity percentage
(Invitrogen, Carlsbad, CA, USA), all according to the respective manufac- (SIMPER) algorithm was run in PRIMER to identify major bacterial gen-
turers’ instructions. For sequencing the library preparation, Illumina era contributing to any community compositional differences detected.
adapters were attached to amplicons using the Illumina TruSeq DNA To examine potential relationships between communities in the MTR
sample preparation kit, v3. Purified libraries were applied for cluster gen- lines and corresponding outdoor locations, the Bayesian SourceTracker
eration and sequencing on the Illumina MiSeq platform using paired-end algorithm (37) was employed, with MTR samples designated sinks and
300-bp reads. outdoor samples designated sources.
Sequence analysis. FASTX-Toolkit (http://hannonlab.cshl.edu/fastx Statistical analysis. Comparisons of environmental measurements
_toolkit) and the QIIME pipeline (v.1.8.0) (28) were used to process the between two sample types were performed using the nonparametric
raw sequences, and sequence chimera filtering was performed with Chi- Mann-Whitney test, and a Kruskal-Wallis test was employed for compar-
meraSlayer via the QIIME “parallel_identify_chimeric_seqs.py” script. isons of more than two sample types. Pearson’s correlation coefficient was
Nonchimeric sequences with a minimum acceptable Phred quality score computed to determine significant correlations between environmental
of 20 in terminal bases and ⱖ20 for 70% of their length were retained for conditions (temperature, relative humidity, and CO2 levels) and relative
downstream analysis. Following quality filtering and trimming, sequences abundance of bacterial taxa (only OTUs with average relative abundance
shorter than 100 bp were removed. The forward and reverse reads gave of ⬎1% were considered; a significance threshold of P ⬍ 0.05 with Bon-
similar results, and the reverse reads were used for analysis. Unless other- ferroni correction was done during comparison). The Mann-Whitney test
wise described, data and statistical analyses were performed using R and was used for comparisons for significant differences in OTU richness be-
Perl scripts. High-quality sequences were clustered into operational tax- tween two sample types (e.g., a.m. versus p.m., peak versus nonpeak,
onomic units (OTUs) against the Greengenes rRNA gene sequence data- underground versus above ground, etc.), and the Kruskal-Wallis one-way
base (ftp://greengenes.microbio.me/greengenes_release/gg_13_5/gg_13 analysis of variance was used to detect significant OTU richness differ-
_8_otus.tar.gz; 97% rep set, filtered to remove sequences without taxo- ences between at least three sample types (e.g., subway lines and outdoor
nomic information down to the genus level, total of 35,435 sequences locations). Line connectedness was calculated using a distance matrix,
retained in the database; retrieved 27 December 2013) using the where distance between two lines sharing interchange stations (i.e., con-
nected lines) is represented by 1/x, where x is the number of interchange
UCLUST-based open-reference OTU clustering pipeline implemented in
stations shared and an integer for distance in the smallest number of stops
QIIME’s “pick_open_reference_otus.py” script, with a 97% sequence
and/or line change between nonconnected lines with no interchange sta-
identity cutoff (28–30). Sequences with ⬍97% identity to database se-
tion. A Mantel test (significance determined with 999 random permuta-
quences were allowed to form de novo clusters with no taxonomic classi-
tions) was performed to examine correlations between the connectedness
fication. As part of the QIIME pipeline, a preclustering filtering step is
of subway lines and abundance-weighted UniFrac distances of their com-
used such that data sequences below 60% identity to the reference data set
munities.
are removed. Global singleton OTUs were removed, and in downstream
Sequence read accession numbers. A total of 6,591,522 raw se-
steps requiring relative abundances, OTU proportions were standardized
quences have been deposited in the NCBI Sequence Read Archive un-
to the total number of high-quality reads. For downstream steps requiring
der BioProject accession number PRJNA230428 and study accession
phylogenetic tree construction (Faith’s phylogenetic diversity [FPD],
number SRP039009.
UniFrac distances), representative sequences for OTU clusters were se-
lected based on the most abundant sequence within each cluster and RESULTS
aligned against the Greengenes reference alignment using PyNAST (31), Overview of the subway bioaerosol microbiome. A total of 140
as implemented in the QIIME script “align_seqs.py”. samples were collected on the MTR network and selected corre-
To generate rarefaction curves for each of the three ␣-diversity matri-
sponding outdoor locations (Fig. 1). One sample (ILLAMP2)
ces (observed OTUs, FPD, and Chao1) per sample, 10 increments of sam-
pling depth between 10 and 35,640 (corresponding to the median depth
yielded a low number of reads (⬍1,000) and was removed from
across 139 samples) were selected, and for each increment, the averages of downstream analysis. Following quality filtering of the remaining
10 repeated richness measurements were plotted, as implemented in the 139 samples, a total of 5,456,084 high-quality sequences were clus-
QIIME script “alpha_rarefaction.py”. As the sample with the fewest se- tered into 55,703 unique operational taxonomic units (OTUs).
quences had 7,210 reads (the third a.m. peak sample on the West Rail Line, On average, 39,252 reads (from 7,210 to 113,729 reads) contrib-
WRLAMP3), samples were normalized at this sequence depth for subse- uted to 2,473 OTUs (from 696 to 6,955 OTUs) in each sample. To
quent ␣- and -diversity measurements. For ␣-diversity, taxonomic account for differences in sequencing depth, rarefaction of 7,210
(based on the number of OTUs present), phylogenetic (FPD) (32), and reads per sample was performed for subsequent analysis. The
singleton-based (Chao1) (33) richness measurements were computed. numbers of sequences and OTUs for each sample are listed in
For -diversity, both the unweighted and abundance-weighted UniFrac Table S1 in the supplemental material. Approximately 48% of
distances were computed to compare phylogenetic dissimilarities of de- sequences shared over 97% identity to microbial sequences in the
tected communities between sample types (34, 35). UniFrac distance
Greengenes database (Fig. 2), and over 45% of the sequences
matrices were used to construct principal coordinate analysis (PCoA)
plots using the R package vegan (http://vegan.r-forge.r-project.org/). The
formed de novo OTU clusters, a proportion similar to that of an
analysis of similarities (ANOSIM) test was performed in PRIMER (v.6; urban outdoor aerosol study (38). The remaining 7% of the se-
PRIMER-E, Plymouth, United Kingdom) to determine whether the ma- quences were singletons removed from subsequent analysis. As
jor sample factors (MTR line, MTR line type, indoors/outdoors, time, documented in other urban environments (39, 40), archaeal se-
peak/nonpeak, sampling day) had significantly different microbial com- quences consisted of the Euryarchaeota and Crenarchaeota phyla
munities. UniFrac distance calculations, PCoA, and ANOSIM were also and constituted a minimal portion (⬍0.1%) of the assigned reads.
6762 aem.asm.org Applied and Environmental Microbiology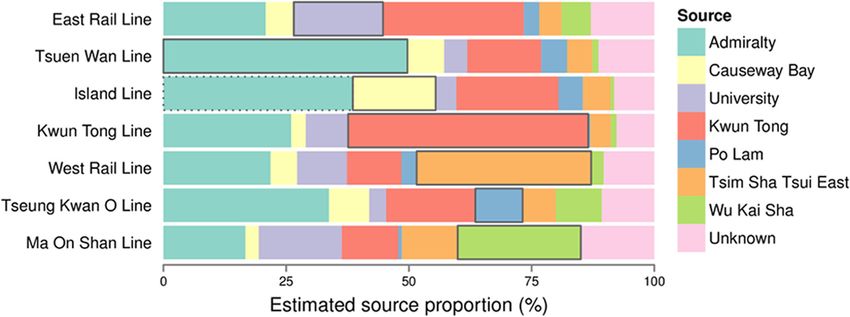
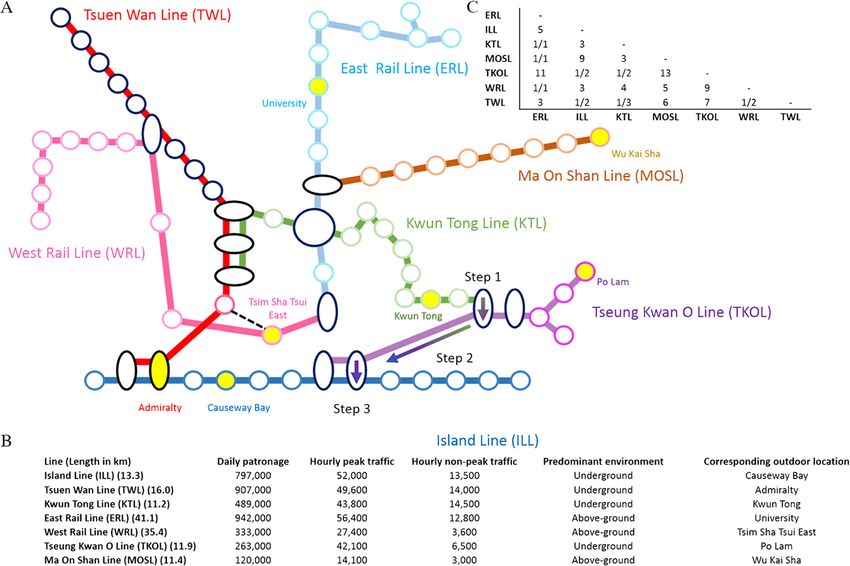
Microbial Community in Subway Bioaerosols FIG 1 Hong Kong MTR network map and information, including ridership information and connectedness of lines included in this study. (A) Schematic representation of MTR lines sampled in this study. The network map is not drawn to scale. Lines are color coded, and corresponding outdoor locations are indicated with the same color as the lines; the station is shaded yellow. (B) MTR line and ridership information are based on 2010 figures (http://gia.info.gov .hk/general/201106/08/P201106080126_0126_79963.pdf). (C) Pairwise comparisons between the lines are represented as a matrix. To systematically represent connectedness between lines, a system was devised considering the number of interchange stations (stations with oval shapes) between lines and the shortest distance between two lines if no interchange station is shared. Matrix of line-to-line connectedness for the line pair with interchange stations are represented as 1/x, where x is the number of shared interchange stations. For example, the Island (blue) and Tsuen Wan (red) Lines share two stations; hence, their connect- edness is 1/2. The interchange stations allow one to go from one line to another in both directions. For lines with no sharing station, the distance is represented by the shortest unit distance separating the two lines, where one step is traveling from one station to the next or the change of a line. For example, as illustrated, from Kwun Tong Line (green) to Island Line (blue), a minimum of three steps are required, with a change from the Kwun Tong to the Tseung Kwan O (purple) Line (step 1), followed by traveling one station (step 2), and then changing from the Tseung Kwan O to the Island Line (step 3). The dotted line adjacent to the station Tsim Sha Tsui East can be treated as an interchange station for the study. Proteobacteria (average prevalence of 23.4% across 139 samples), The fourth sample taken in the Po Lam outdoor location (PL4) Actinobacteria (15.6%), Firmicutes (6.3%), and Deinococcus-Ther- contained high proportions of sequences belonging to the plant- mus (1.6%) were the most prevalent bacterial phyla detected, sim- associated Clostridium cellulovorans (45.2% versus and average of ilar to the findings of Robertson et al. (21), with the exception of 0.28% for the other samples) and the marine genus Synechococcus Bacteroidetes, seen in New York City (NYC), instead of Deinococ- (6.5% versus an average of 0.056% for other samples), and the first cus-Thermus. These bacterial phyla also are among the most com- p.m. nonpeak sample on the Ma On Shan Line (MOSLPMNP1) monly detected in aerosols of other indoor built environments contained a high proportion of Leuconostoc sequences (54.4% ver- (39, 41). Skin-associated genera Micrococcus (4.9%), Enhydrobac- sus an average of 0.43% for other samples). ter (3.1%), Propionibacterium (2.9%), Staphylococcus (1.8%), and The effects of spatial, temporal, and architectural attributes Corynebacterium (1.5%) were among the most commonly de- on ␣- and -diversities. We compared the within-sample diver- tected genera in our data set (see Table S2 in the supplemental sities (␣-diversities) between samples using taxonomic-based, material). In addition, the soil-associated Sphingobium and fresh- phylogenetic-based (FPD), and singleton-based (Chao1) ap- water-dwelling Blastomonas also were among the most common proaches (see Table S1 and Fig. S2 in the supplemental material). genera detected, with generally higher abundances in outdoor All three ␣-diversity indices provided consistent results for a given samples for both genera. Despite the general trends described, comparison. Collectively, outdoor locations had a higher taxo- distinctive and unique communities could be observed for some nomic and phylogenetic diversity than the MTR environment samples, similar to observations reported by Robertson et al. (21). (P ⬍ 0.05 for all three approaches) (see Fig. S3A). In addition, the November 2014 Volume 80 Number 21 aem.asm.org 6763
Leung et al.
FIG 2 Major phyla detected in MTR and outdoor samples. Each group represents the collection of samples within a given sample type, either a particular line
or an outdoor location. The plot is arranged by similarities in proportions of phyla between samples. The corresponding outdoor samples are placed to the right
of a set of train line samples. Taxonomic assignment was performed using the open-reference method, based on 97% sequence identity cutoff against a filtered
Greengenes database to include only sequences with taxonomic information down to the genus level. The top five phyla present across the data set are indicated.
Minor/unclassified includes sequences assigned to the remaining phyla according to the Greengenes database and de novo sequences with no Greengenes
sequences sharing ⱖ97% identity.
10 samples with the most OTUs following normalization all be- cance between sample types (Table 1). With the exception of the
longed to outdoor samples or samples from MTR lines predomi- outdoor versus outdoor and peak versus nonpeak comparisons,
nantly outdoors and above ground. MTR lines did not show sig- both unweighted and weighted analyses gave consistent results for
nificantly different ␣-diversity, and when MTR samples were a given comparison. In contrast to what was observed for ␣-diver-
grouped by their architectural design, lines that were predomi- sity indices, the bacterial community in MTR air as a whole was
nantly indoors and underground were similar in diversity to those not significantly different from that of outdoor locations, consis-
outdoors and above ground. Diversity differences also were not tent with observations seen in NYC (21). When considering only
observed between different outdoor samples. Temporal charac- MTR samples, however, community phylogenetic variations were
teristics appeared to play roles in bacterial richness on the MTR, observed between different lines, and communities in MTR lines
where afternoons and evenings (p.m.) exhibited a higher diversity above ground and outdoors showed significantly different phylo-
on the MTR than the morning (a.m.) (P ⬍ 0.05 for all three ap- genetic communities compared to those below ground. In con-
proaches) (see Fig. S3B), which was consistent in all three ␣-di- trast, significant phylogenetic dissimilarity was not observed be-
versity indices. In contrast, commuter traffic, as measured by tween the different outdoor locations based on weighted UniFrac
comparing peak and nonpeak commute hour samples, did not phylogenetic distances. Within-day temporal characteristics also
appear to influence ␣-diversity.
As we collected a total of four replicates per line, with each
replicate collected within an average span of 15 days, we analyzed
TABLE 1 Comparison of -diversity between sample types according to
whether ␣-diversities differ significantly on different days within
unweighted and weighted UniFrac distances
the same line. For a particular line, samples collected on the same
day, consisting of the four a.m. and p.m. peak and nonpeak sam- Comparison by structure Global R Global R
and time (unweighted) P valuea (weighted) P valuea
ples, were combined, and comparisons were made between differ-
ent days for a single line. Of the seven lines analyzed, two of the Spatial/architectural
lines, both above ground (East Rail and Ma On Shan Lines), MTR vs outdoor ⫺0.023 NS 0.046 NS
Outdoor vs outdoor 0.161 0.021 ⫺0.003 NS
showed significant ␣-diversity changes on different days based on
Line vs line 0.207 0.001 0.082 0.001
taxonomic richness and FPD (see Fig. S3C in the supplemental
Underground vs above 0.232 0.001 0.064 0.004
material). None of the lines showed day-to-day changes in Chao1 ground
diversity.
The phylogenetic dissimilarity of communities (-diversity) Temporal
observed for each sample type was determined using both un- a.m. vs p.m. 0.062 0.001 0.029 0.03
weighted and abundance-weighted UniFrac distances, and analy- Peak vs nonpeak ⫺0.005 NS 0.109 0.001
sis of similarity (ANOSIM) was computed to determine signifi- a
NS, not significant (P ⬎ 0.05). Boldfaced values indicate statistical significance.
6764 aem.asm.org Applied and Environmental MicrobiologyMicrobial Community in Subway Bioaerosols
FIG 3 Relationship between MTR line community composition and corresponding outdoor locations. A Bayesian source-tracking approach (37) was used to
represent the mean proportions of contributions of each outdoor-location bacterial community on each line. An overlap between line (sink) and outdoor
(source) microbiomes is represented by ⱖ97% identity between sequences of the two sample environments. Sequences in which SourceTracker could not
confidently assign a source environment are placed in the unknown category. The outdoor location corresponding to a specific line is indicated with a black
bracket for each bar. While Causeway Bay was chosen as the corresponding location for the Island Line, Admiralty (dotted bracket) is also along the Island Line;
hence, it also should be considered a source for this line.
contributed to community compositions, where a.m. and p.m. between different lines. Each outdoor location contributed a
samples had marginal changes in communities. The effect of com- range of 0.41% to 50% of a given line’s microbiome, and with
muter traffic (peak versus nonpeak), a quasitemporal variable the exceptions of the East Rail Line and Tseung Kwan O Line, the
possibly better defined as a function of commuter traffic, showed corresponding outdoor locations contributed the greatest to the
significant differences only when abundance-weighted UniFrac microbial community of each line. It should be noted that both
was considered. Similarity percentage (SIMPER) analysis com- Admiralty and Causeway Bay are accessible by the Island Line
parison based on Bray-Curtis measure of dissimilarity revealed (Fig. 1), and these two outdoor locations together contributed
that the increased abundances of skin-associated OTUs, such as over 55% of the community seen on this line. Thus, adjacent out-
Micrococcus spp., Enhydrobacter spp., and Staphylococcus spp., on door locations play prominent roles in shaping the microbial
the MTR explained the community differences between MTR communities of corresponding MTR lines.
and the outdoors (see Table S3 in the supplemental material). The effects of line connectedness on the similarity of micro-
Within the MTR, higher abundances of these skin-associated biomes. In addition to the effects of nearby outdoor environ-
OTUs in the underground lines during peak and p.m. hours also ments, we hypothesized that the microbiome of an MTR line is
explained assemblage differences between lines, peak/nonpeak, shaped in part by adjacent lines, where lines that are connected by
and a.m./p.m. hours. interchanging stations would share more similar communities
Relationships between the MTR and outdoor microbiomes. than those without interchanges. Specifically, we examined if the
Analysis of the most common microbial members detected in the community differences observed for individual MTR lines follow
air of MTR lines revealed that these genera included not only a distance- (or connectedness-) dependent trend, similar to what
normal inhabitants of the skin but also soil, water, and leaf-asso- was observed in microbial communities of residential air (42, 43).
ciated organisms, such as OTUs of the Sphingobium, Blastomonas, To address this, we determined the correlation between the con-
Acinetobacter, and Xanthomonas genera (see Table S2 in the sup- nectedness of MTR lines to the phylogenetic similarities of their
plemental material), reflecting the potential roles of these specific bacterial communities. Connectedness between lines was repre-
outdoor locations in shaping the MTR microbiome. We investi- sented as a geographical distance matrix where the distance be-
gated whether the microbiomes from outdoor locations along the tween two lines sharing interchange stations is represented by 1/x,
subway lines also can act as sources of the MTR microbiome. We with x being the number of interchange stations shared between
selected representative outdoor locations where they can be ac- two lines. If the two lines are not connected (no interchange sta-
cessed by at least one of the MTR lines sampled, and we employed tion shared), an integer is given for the shortest number of steps
the Bayesian SourceTracker approach to determine the propor- between two lines, where a step is defined as either changing a line
tions of contributions of the different outdoor sources, assuming or going from one station to the next (Fig. 1A). A pairwise com-
that the bacterial community observed within a line (sink com- parison matrix of line-to-line connectedness is present in Fig. 1C.
munity) originated from the sampled outdoor locations (source A Mantel test of MTR line connectedness and weighted UniFrac
communities), each contributing to a particular proportion of the distances indicated that closely connected MTR lines shared more
line microbiome (Fig. 3). The strength of this model is that it similar microbial communities than pairs that are further apart
provides a quantitative account of the potential contribution of (R ⫽ 0.47, P ⫽ 0.03), consistent with the suggestion that micro-
each source, as supposed to the qualitative description seen in biome exchanges are more likely to occur between closely con-
principal coordinate analysis (PCoA) plots derived from UniFrac nected lines, possibly by distance-dependent dispersal and trans-
distances. All outdoor locations could act as sources for the MTR ferring commuters.
microbiome, but different sources contributed different propor- The effects of environmental conditions on microbiomes
tions within a given line, and each source contributed differently and relative abundances of genera. Temperature, carbon dioxide
November 2014 Volume 80 Number 21 aem.asm.org 6765Leung et al.
(CO2), and relative humidity measurements were logged over 2-s
intervals and averaged over the 2-h sampling time for each sample
type (see Table S4 in the supplemental material). MTR samples
showed significantly lower average temperatures (P ⫽ 4.1 ⫻ 10⫺10
by Mann-Whitney test) (see Fig. S4A) and higher average levels of
CO2 (P ⫽ 3.5 ⫻ 10⫺15 by Mann-Whitney test) (see Fig. S4B)
compared to those of outdoor samples. CO2 is likely to be a reflec-
tion of commuter density, as peak samples also showed signifi-
cantly higher levels of CO2 than samples taken during off-peak
hours (see Fig. S4C), and that the two lines with the lowest rider-
ship figures (Tseung Kwan O and Ma On Shan Lines) (Fig. 1B)
showed lower average CO2 levels (see Table S4). A Kruskal-Wallis
test showed overall significant variations in all three environmen-
tal parameters between lines (see Fig. S4D to F); however, the
variations in the three parameters could not be explained by
whether the lines were underground or above ground (P ⬎ 0.05 by
Mann-Whitney test for all three environmental comparisons).
Furthermore, environmental conditions were similar between
a.m. and p.m. samples, as well as between different outdoor loca-
tions.
We investigated whether the environmental conditions were
correlated with changes in sample diversity within the MTR. For
both taxonomic (based on rarefied sample OTU numbers) and
phylogenetic (based on rarefied FPD) diversities, temperature (see FIG 4 PCoA plot of phylogenetic dissimilarity between samples of different
Fig. S5A and B in the supplemental material) and relative humid- geographical regions. Comparison was performed between Hong Kong sam-
ity (see Fig. S5C and D) were inversely and proportionally corre- ples collected in this study and previous works investigating urban environ-
ments in the United States (5, 36). The plot was constructed based on abun-
lated with diversities, respectively, while significant correlations dance-weighted UniFrac phylogenetic distance. GOF represents the goodness
between CO2 levels and diversity were not detected. However, the of fit, an indication of the representation of the PCoA plot to the UniFrac
removal of outliers based on normalized numbers of OTUs (all distance data. PCoA dimensions 1 and 2 show 30% and 33% of the variances,
outliers belong to samples taken on outdoor/aboveground MTR respectively.
lines) rendered these correlations nonsignificant, suggesting that
these environmental parameters have a greater impact on diver-
sity in outdoor lines than on those indoors. Environmental con- A UniFrac-based comparison between the Hong Kong and the
ditions also affected the relative abundances of selected genera, NYC subway (21) aerosol microbial community was not feasible,
with the Pearson’s test revealing significant positive correlations as the latter study utilized Roche 454 pyrosequencing technology
between CO2 concentrations and abundances of members of En- with lower sequence depth. Thus, a much lower rarefied read
hydrobacter spp. ( ⫽ 0.41, P ⫽ 9.8 ⫻ 10⫺7) and Micrococcus spp. depth would be necessary, and the representation of the rarefied
( ⫽ 0.46, P ⫽ 3.2 ⫻ 10⫺8) across the entire data set. However, as community in our sample would be questionable. However, tax-
the genus comparisons were performed with both MTR and non- onomic-based comparison of these communities revealed that
MTR outdoor samples, the correlations observed could be gov- some common genera were not shared between the studies. For
erned by sampling locations. However, more modest but similar example, soil-dwelling genera, such as Arthrobacter and Psychro-
CO2-associated correlations were observed for Enhydrobacter bacter, which were among the common genera documented in
( ⫽ 0.33, P ⫽ 0.0004) and Micrococcus ( ⫽ 0.35, P ⫽ 0.0001) NYC, all were detected at ⬍0.5% across the Hong Kong data set.
within the MTR. In addition, inverse correlations between tem- Conversely, Enhydrobacter, a genus previously detected in high
perature on the MTR and abundances of soil-dwelling Sphingo- proportions in Chinese young adults (44), were among the top
bium ( ⫽ ⫺0.29, P ⫽ 0.002) and Blastomonas ( ⫽ ⫺0.30, P ⫽ skin-associated genera on the MTR but not considered to be a
0.002) were detected. Therefore, we provided evidence that hu- common genus in the NYC subway. Such differences call for the
midity, temperature, and CO2 play roles in sample diversity additional metagenomic analysis of subway systems around the
and/or abundances of certain genera in the MTR. world to determine whether additional geographical and/or cul-
Comparison of Hong Kong subway microbial community to tural/ethnic factors play roles in driving differences in aerosol mi-
those in other microbiome studies. As one of the few large-scale crobiomes.
studies investigating aerosol microbial community composition
in Asia, we were interested in comparing our subway and outdoor DISCUSSION
data sets to those of indoor microbiome studies conducted else- Urbanization has led to dependence on public transportation, in-
where. We have chosen studies investigating the bioaerosols of a cluding subway networks. Despite its role in modern societies,
university building in Oregon (36) and the household surface mi- little is known pertaining to the microbial exposure of commuters
crobial compositions in North Carolina homes (5). PCoA plots during subway use. The characterization of subway bioaerosols
based on weighted UniFrac distances clearly showed that the using high-throughput, culture-independent techniques is still in
Hong Kong cluster is distinct from the American groups (global its nascency, conducted with the intention of improving one’s
R ⫽ 0.34, P ⫽ 0.001 by ANOSIM) (Fig. 4). understanding of public health risks and in biodefense prepara-
6766 aem.asm.org Applied and Environmental MicrobiologyMicrobial Community in Subway Bioaerosols
tion (19–21). Instead, the main focus of this study was to link introduced into the platform area during train stoppage because
patterns of observed microbial communities with intrinsic char- of the screen doors. This restricted influence of outdoor air is less
acteristics of subway usage patterns and architectural designs. We so for aboveground lines, as most of the aboveground platforms
believe that the works presented in this study will pave the way for are open to ambient air. As our integrated sampling approach
future bioaerosol investigations of subways to better understand included air taken on the platforms, the presence of screen doors
microbiological profiles of this unique built environment. may further restrict outdoor air entering into the underground
As the first study unraveling the microbial diversity of an urban platform areas. In addition, although additional information,
subway network in Asia using sequencing technology, we describe such as station depths, was not obtained, stations deeper below
the Hong Kong subway bioaerosols as taxonomically diverse, ground also have been shown to contain more varied communi-
more so than was seen in previous culture-independent reports of ties (8, 9, 12, 13). Thus, we believe that understanding microbial
subway microbial communities (19, 21). We detected residents of communities of the subway requires a thorough assessment of
various ecological habitats, including soil (Sphingobium and Acin- various features of its architecture.
etobacter), water (Blastomonas), and leaf (Xanthomonas). In addi- Analysis of -diversity using weighted UniFrac distances de-
tion, Micrococcus, Propionibacterium, and Staphylococcus were tected no significant difference in compositions between different
among the most commonly detected host-associated genera in outdoor locations. It was previously documented that different
our study, an observation also recorded in other indoor built- terrain types may reveal different microbial communities (49).
environment studies (4, 41, 45). While these members constitute However, our selection of outdoor locations may vary less in
the normal human skin and oral flora (46), recent reports of an- terms of land use types than in the degree of urbanization. Indeed,
tibiotic-resistant microorganisms in subways underscore the need previous investigations of the effects of urbanization on microbial
for the active surveillance of microbial communities in this envi- communities in Hong Kong revealed no variation between urban
ronment (19, 47), as a crowded and enclosed MTR environment and rural areas (50). Alternatively, geographical variations that
encourages the horizontal transmission of microorganisms be- may explain differences in outdoor and/or indoor microbial com-
tween large numbers of commuters. munities may need to be on a regional rather than a local scale (22,
The effects of architecture, namely, indoor ventilation, has 23, 51), mediated by great variations in climates in the atmosphere
been demonstrated to play roles in shaping the extent to which (52). In agreement, the microbial communities in the Hong Kong
microbial communities from outdoor air influence various in- MTR were distinct from those of other studies in the United States
door spaces (4, 36, 41, 42). We hypothesize that similar phenom- (5, 36), revealing clustering based on continental geography.
ena apply to the subway. A recent study employing conventional While it is possible that different indoor building functions and
Sanger and pyrosequencing on the NYC subway indicated a lack types selected played roles in such observed community varia-
of difference in bacterial communities between subway and out- tions, taxonomy-based comparison between MTR and the NYC
door air (21). The lack of mechanical ventilation in the NYC sub- subways revealed differences in some of the common environ-
way and the mixing of outdoor and subway air was proposed to mental and human-associated genera detected, favoring some ge-
contribute to the lack of distinct microbial profiles detected. In ography-governing community differences. Also, because occu-
Hong Kong, the MTR microbiome also had no significant varia- pants have a great impact on the indoor air microbiomes,
tion compared to the outdoor microbiome, suggesting equilib- variations in microbiomes of different population groups may
rium and complete air mixing of the microbial communities be- influence air microbial assemblages (24), a phenomenon that has
tween the two environments. However, multiple observations in been reported in studies investigating indoor surfaces (22, 53).
this study suggest that complete outdoor and MTR air mixing One of the common genera detected in this study, Enhydrobacter,
does not take place: (i) the greater ␣-diversity observed outdoors is a documented resident on the human skin but may be present in
compared to inside the MTR in this study, (ii) the presence of higher proportions in Chinese individuals (44). Such observations
community assemblage variations between MTR lines, (iii) the underscore the need to take the occupants’ microbiomes into ac-
differences in contributions on MTR microbial assemblages de- count when examining indoor microbial assemblages.
pending on the outdoor locations, and (iv) the correlation be- Marginal intraday microbial differences were observed on the
tween community phylogenetic distances and connectedness be- MTR overall, with p.m. hours showing higher ␣-diversity than
tween MTR lines. a.m. hours. Each of the a.m. and p.m. groups is an accumulation of
Thus, we postulate that while some air mixing occurs between 4 h within a line, which may dampen any greater variations seen
outdoor locations and the MTR, other factors contributed to within shorter time frames (54). While meteorological factors
shaping the MTR microbial community. Specifically, the presence may explain intraday differences in communities with low human
of mechanical ventilation may play an important role in shaping activity (55, 56), in urban settings such as that of samples collected
microbial communities in the MTR. Of the seven MTR lines sam- in this study, human factors are likely to take greater part in shap-
pled, three (East Rail, West Rail, and Ma On Shan Lines) are op- ing day-to-day assemblage variations (19). The effect of commut-
erated predominantly outdoors and are predominated by natural ers on MTR microbial communities is further exemplified by our
ventilation on the station platforms, and these aboveground lines observation that increases in skin-associated genera during peak
showed community differences compared to the mechanically hours contributed to differences in the peak and nonpeak com-
ventilated, indoor underground lines. The presence of screen munities. The increased number of commuters naturally will re-
doors along the platforms of the indoor and underground stations sult in the increased shedding of skin-associated organisms into
would restrict air exchanges between the tunnel track and the the subway environment (19, 57). In addition, daily variations in
passenger platform areas in these lines (48). Outdoor air taken ␣-diversity were observed in aboveground lines, and interday
from the intake ventilation systems would fill up the tunnel area community variations were observed in both MTR and outdoor
predominantly, but only small volumes of outdoor air will be environments. Interday distinct communities within the same lo-
November 2014 Volume 80 Number 21 aem.asm.org 6767Leung et al.
cations are consistent with the day-to-day idiosyncrasy observed have greater insights into the microbial life in the air of this unique
by Robertson et al. (21), as well as those in other urban (51) and built environment that serves millions of passengers daily.
rural (25) locations. These unique communities, usually domi-
nated by a small number of genera, may be explained by sporadic ACKNOWLEDGMENTS
anthropogenic factors (organism release via skin shedding, sneez- This research was supported by the Research Grants Council of Hong
ing, talking, and coughing) and other source factors in the vicinity Kong through project 124412.
rather than environmental factors associated with seasonal com- We thank Wai Shan Chow, Catherine Chung, Ka Yan Ng, Yuet Ying
munity differences (54, 58). Therefore, commuters using the sub- Wong, and Flora Yeh for sampling assistance and Zhi Ning and Fenhuan
way on a regular basis at different times and days are more likely to Yang for their support with instruments. We thank Wei Chi Wang and the
be exposed to a greater breadth of microbial life. members of Health GeneTech Corporation for sample processing and
sequence analysis.
Decreasing temperature (within a range of ⬃30°C to 24°C) and
increasing relative humidity (within a range of ⬃50% to 90%) REFERENCES
within the MTR were associated with an increase in taxonomic 1. Klepeis NE, Nelson WC, Ott WR, Robinson JP, Tsang AM, Switzer P,
and phylogenetic diversities. Similarly, other studies investigating Behar JV, Hern SC, Engelmann WH. 2001. The National Human Activ-
effects of temperature on microbial communities in residential ity Pattern Survey (NHAPS): a resource for assessing exposure to environ-
aerosols showed negative correlations between indoor tempera- mental pollutants. J. Expo. Anal. Environ. Epidemiol. 11:231–252. http:
//dx.doi.org/10.1038/sj.jea.7500165.
ture and bacterial survival (59). Tang (60) proposes that an in-
2. Douwes J, Thorne P, Pearce N, Heederik D. 2003. Bioaerosol health
crease in temperature from 24°C decreases the survival of different effects and exposure assessment: progress and prospects. Ann. Occup.
airborne bacterial species. Whether this observation can be ap- Hyg. 47:187–200. http://dx.doi.org/10.1093/annhyg/meg032.
plied and generalized to bacteria in aerosols and to those of differ- 3. Kettleson E, Kumar S, Reponen T, Vesper S, Méheust D, Grinshpun
ent indoor environments is unknown. Nonetheless, one should SA, Adhikari A. 2013. Stenotrophomonas, Mycobacterium, and Strepto-
myces in home dust and air: associations with moldiness and other home/
use caution in such generalizations and comparisons, as environ- family characteristics. Indoor Air 23:387–396. http://dx.doi.org/10.1111
mental effects such as temperature and humidity on microbial /ina.12035.
community assemblages are likely to be influenced by sample lo- 4. Kembel SW, Jones E, Kline J, Northcutt D, Stenson J, Womack AM,
cations, method of sampling, and the microbial members and Bohannan BJ, Brown GZ, Green JL. 2012. Architectural design influ-
ences the diversity and structure of the built environment microbiome.
communities in question (17, 59, 60). When outlier samples based
ISME J. 6:1469 –1479. http://dx.doi.org/10.1038/ismej.2011.211.
on their high taxonomic diversity were removed, the effects of 5. Dunn RR, Fierer N, Henley JB, Leff JW, Menninger HL. 2013. Home life:
temperature and humidity on MTR ␣-diversity no longer were factors structuring the bacterial diversity found within and between homes.
significant. Thus, it is possible that fluctuations in environmental PLoS One 8:e64133. http://dx.doi.org/10.1371/journal.pone.0064133.
properties would be more influential in the observed microbial 6. Hospodsky D, Qian J, Nazaroff W, Yamamoto N, Bibby K, Rismani-
Yazdi H, Peccia J. 2012. Human occupancy as a source of indoor airborne
community on outdoor rather than indoor MTR lines, where bacteria. PLoS One 7:e34867. http://dx.doi.org/10.1371/journal.pone
commuters and anthropogenic factors are likely to play more im- .0034867.
portant roles. The observation that only outdoor lines showed 7. Bonetta S, Bonetta S, Mosso S, Sampò S, Carraro E. 2010. Assessment
significant interday ␣-diversity variations appear to support this. of microbiological indoor air quality in an Italian office building equipped
with an HVAC system. Environ. Monit Assess. 161:473– 483. http://dx.doi
We found that temperatures on the MTR were inversely corre-
.org/10.1007/s10661-009-0761-8.
lated with relative abundances of Sphingobium and Blastomonas, 8. Gilleberg S, Faull J, Graeme-Cook K. 1998. A preliminary survey of aerial
both of which are within the Sphingomonadales order. The rela- biocontaminants at six London Underground stations. Int. Biodeterior. Bio-
tionship between temperature and these genera commonly de- degrad. 41:149 –152. http://dx.doi.org/10.1016/S0964-8305(98)00005-5.
tected in soil (27) and aquatic (61) environments is unknown; 9. Awad AHA. 2002. Environmental study in subway metro stations in
Cairo, Egypt. J. Occup. Health 44:112–118. http://dx.doi.org/10.1539/joh
however, their presence in residential and other urban environ- .44.112.
ments and their abilities to acquire antibiotic resistance (62) de- 10. Seino K, Takano T, Nakamura K, Watanabe M. 2005. An evidential
serve further analysis of how environmental parameters in urban example of airborne bacteria in a crowded, underground public con-
environments affect their survival. We believe that CO2 levels course in Tokyo. Atmos. Environ. 39:337–341. http://dx.doi.org/10
.1016/j.atmosenv.2004.09.030.
within the MTR is a function of commuter density, as the CO2
11. Cho J, Min K, Paik N. 2006. Temporal variation of airborne fungi
level was higher on the MTR than outdoors and higher during concentrations and related factors in subway stations in Seoul, Korea. Int.
peak than nonpeak hours, concomitant with positive correlations J. Hyg. Environ. Health 209:249 –255. http://dx.doi.org/10.1016/j.ijheh
between CO2 levels and the abundance of skin-associated bacteria. .2005.10.001.
The changes observed in these environmental attributes took 12. Bogomolova E, Kirtsideli I. 2009. Airborne fungi in four stations of the St.
Petersburg underground railway system. Int. Biodeter. Biodegr. 63:156 –
place on relatively short time scales (two hours between peak and 160. http://dx.doi.org/10.1016/j.ijgo.2012.03.027.
nonpeak times). Therefore, further investigations on the relation- 13. Hwang S, Yoon C, Ryu K, Paik S, Cho J. 2010. Assessment of airborne
ships between such parameters and microbial assemblage changes environmental bacteria and related factors in 25 underground railway
in indoor environments will shed light on the microbial commu- stations in Seoul, Korea. Atmos. Environ. 44:1658 –1662. http://dx.doi.org
/10.1016/j.atmosenv.2010.01.047.
nity dynamics of this unique indoor environment.
14. Dong S, Yao M. 2010. Exposure assessment in Beijing, China: biological
In conclusion, we have performed an integrated characteriza- agents, ultrafine particles, and lead. Environ. Monit. Assess. 170:331–343.
tion of the microbial community of an urban subway network http://dx.doi.org/10.1007/s10661-009-1236-7.
using a high-throughput culture-independent method, demon- 15. Kawasaki T, Kyotani T, Ushiogi T, Izumi Y, Lee H, Hayakawa T. 2010.
strating that the air in MTR contained extensive microbial diver- Distribution and identification of airborne fungi in railway stations in
Tokyo, Japan. J. Occup. Health 52:186 –193. http://dx.doi.org/10.1539
sity. The detected differences in assemblages between space and /joh.O9022.
time are likely to be due to a complex interplay between architec- 16. Kim K, Kim Y, Kim D, Kim H. 2010. Exposure level and distribution
tural, meteorological, and anthropogenic factors. Overall, we now characteristics of airborne bacteria and fungi in Seoul metropolitan
6768 aem.asm.org Applied and Environmental MicrobiologyYou can also read