Introducing a Computerized Figural Memory Test Based on Automatic Item Generation: An Analysis With the Rasch Poisson Counts Model - KOPS
←
→
Page content transcription
If your browser does not render page correctly, please read the page content below
ORIGINAL RESEARCH
                                                                                                                                                published: 10 June 2020
                                                                                                                                         doi: 10.3389/fpsyg.2020.00945

                                            Introducing a Computerized Figural
                                            Memory Test Based on Automatic
                                            Item Generation: An Analysis With
                                            the Rasch Poisson Counts Model
                                            David Jendryczko 1,2* , Laura Berkemeyer 2 and Heinz Holling 2
                                            1
                                             Institute for Psychology, Universität Konstanz, Konstanz, Germany, 2 Institute for Psychology, Westfälische
                                            Wilhelms-Universität Münster, Münster, Germany

                                            An automatic item generator for figural memory test items called figumem was
                                            developed. It is available in R. A cognitive model allowed the generation of hypothetically
                                            parallel items within three difficulty levels determined by visual information load. In a
                                            pilot study, participants solved three items for each level of visual load. Within an item
                        Edited by:          response theory approach, the Rasch Poisson counts model and modifications of it
              Dominique Makowski,
    Nanyang Technological University,
                                            were fitted to the data. Results showed overall satisfying fit. Visual information load
                          Singapore         explained most of the variance in item difficulty. Differences in difficulty between items of
                      Reviewed by:          the same family were comparatively low, displaying the utility of the item generator for
                    Philippe Blondé,
                                            the creation of parallel test forms. Implications, limitations, and suggestions for the use
      EA7536 Laboratoire Mémoire,
     Cerveau et Cognition (MC2Lab),         and extensions of figumem are discussed.
                              France
                     Purya Baghaei,         Keywords: figural memory, short-term memory, visual information load, parallel test forms, automatic item
                                            generation, item response theory, Rasch Poisson counts model
         Islamic Azad University, Iran
                 *Correspondence:
                   David Jendryczko
   david.jendryczko@uni-konstanz.de
                                            INTRODUCTION
                                            Automatic item generation (AIG) is a modern approach for developing items and tasks, especially
                   Specialty section:
         This article was submitted to
                                            for tests measuring cognitive abilities. It is usually based on theoretically and empirically validated
              Quantitative Psychology       quality control mechanisms. Thus, it avoids misinterpretations in item writing by human item
                    and Measurement,        writers and facilitates an enhanced interpretation of test scores (Lai et al., 2009). If the generating
               a section of the journal     rules are known, AIG can be used to automatically produce large numbers of high-quality
               Frontiers in Psychology      items. AIG is the computer algorithm–controlled creation of tasks/items under a predefined item
        Received: 19 February 2020          prototype called item model (Gierl and Lai, 2012). This means that computer algorithms are used
           Accepted: 16 April 2020          instead of conscious decisions to generate families of items from a smaller set of parent items
          Published: 10 June 2020           (Glas et al., 2010).
                            Citation:          The construction of an item model can be enriched if it is based on a theory that predetermines
    Jendryczko D, Berkemeyer L and          the level of item difficulty, among other measurement properties (Irvine, 2002). Radicals (Irvine,
         Holling H (2020) Introducing       2002) are structural elements that significantly affect item parameters (such as item difficulty) and
 a Computerized Figural Memory Test
                                            provide the item with certain cognitive requirements. One or more radicals of the item model
Based on Automatic Item Generation:
  An Analysis With the Rasch Poisson
                                            can be manipulated in order to produce parent items with different difficulty levels. Each parent
                       Counts Model.        can then grow its own item family by manipulating other elements that Irvine called incidentals.
              Front. Psychol. 11:945.       Incidentals are surface features that vary randomly from item to item within the same family. Items
     doi: 10.3389/fpsyg.2020.00945          that have the same structure of radicals and only differ in incidentals are usually labeled isomorphs

Frontiers in Psychology | www.frontiersin.org                                      1                                                 June 2020 | Volume 11 | Article 945

                                                         Konstanzer Online-Publikations-System (KOPS)
                                                URL: http://nbn-resolving.de/urn:nbn:de:bsz:352-2-cwxinn28mt3w1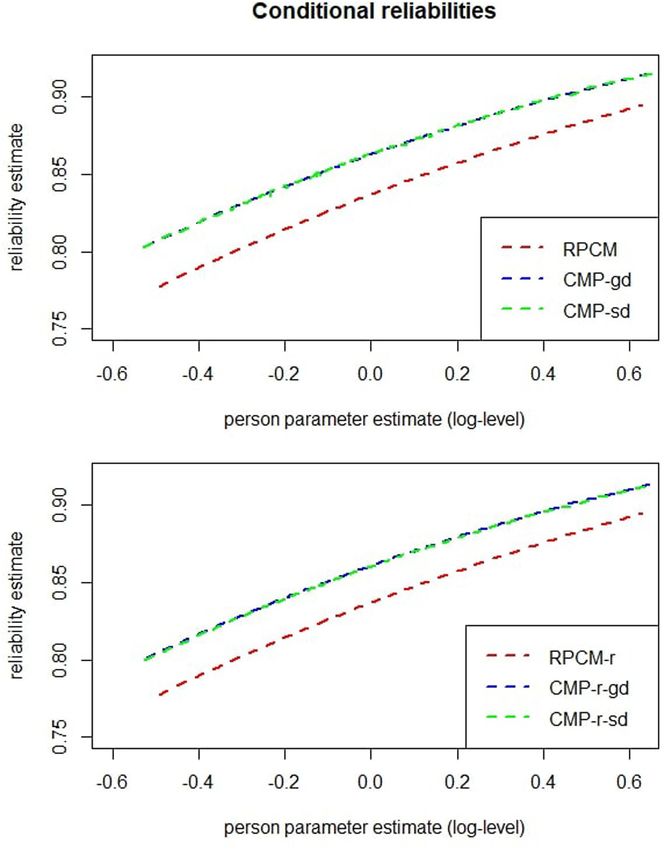
Jendryczko et al.                                                                                                             AIG for Figural Memory

(Bejar, 2002) or clones (Arendasy and Sommer, 2012). The                   retest effects emerging from repeated exposure to the same
variation of items’ surface characteristics should not significantly       test items (see Reeve and Lam, 2005; Jendryczko et al., 2019).
influence the testee’s responses, which is the reason why it is            Alternative versions for short-term memory (STM) items are
believed that incidentals produce only slight differences among            essential, as repeatedly presenting the same items to testees
the item parameters of the isomorphs.                                      will confound their STM performance with effects of long-term
   Automatic item generation so far has mostly been used for               memory retrieval. This is especially relevant for various clinical
the construction of reasoning tests with figural (e.g., Bejar, 1990;       populations, as an ongoing decay in memory functions due to a
Embretson, 2002; Arendasy and Sommer, 2005, 2010; Gierl et al.,            disease or disorder must be validly measured and documented.
2008; Zeuch et al., 2011; Bertling, 2012; Blum et al., 2016; Loe,          The same applies to improvements of memory functions due
2019), numerical (e.g., Arendasy et al., 2006; Gierl et al., 2008;         to an intervention. In this regard, a multitude of automatically
Holling et al., 2009; Arendasy and Sommer, 2012; Bertling, 2012;           generated items can also effectively be used for training purposes.
Loe et al., 2018; Loe, 2019) and verbal (e.g., Gierl et al., 2008;         Examples from clinical neuropsychology, where some or all of
Loe, 2019) material but was also employed for the measurement              these benefits apply, are given with syndromes, disorders, or
of other cognitive abilities, comprehensively described in the             diseases in which learning of new information is impaired, such
Berlin intelligence structure model (BIS; Jäger et al., 2006).             as Korsakoff syndrome (Lloyd et al., 2019), Alzheimer’s disease
In this model, the four cognitive traits of reasoning, mental              (Liang et al., 2016), Huntington disease (Clemensson et al.,
speed, creativity, and memory are conceptualized to operate with           2017), Parkinson’s disease (Rolinski et al., 2015), anterograde
figural, numerical, and verbal contents for a measurement of               amnesia (Stöllberger et al., 2019), and post-traumatic amnesia
general intelligence (or psychometric g). Doebler and Holling              (De Simoni et al., 2016).
(2016) presented test generators for mental speed with all of                 Many of the commonly used STM tests have few or no
these contents of stimulus material. Generators for creativity and         parallel test forms. For example, the internationally most often-
memory have received less attention. Regarding the former, the             used memory test battery (Thöne-Otto, 2009), the Wechsler
measurement of creativity per se is problematic, as it is difficult        Memory Scale—Revised (WMS-R; Bornstein and Chelune,
to clearly define the cognitive operations at hand when new                1988), currently holds no alternative test version. Similarly,
ideas are produced. Moreover, the response format is usually               commonly applied visual STM tests as the Benton-test (Benton
open, and the determination of test scores requires trained raters         et al., 1996), the Rey–Osterrieth complex figure test (Rey,
(see Forthmann et al., 2019c). Regarding the latter, the lack              1941), the non-verbaler Lerntest (Eng.: non-verbal learning test;
of AIG-based item generators for short-term and long-term                  NVLT; Sturm and Willmes, 1999), the recognition memory test
memory items presents a void in the scientific literature that             (Warrington, 1984), and the doors test (Baddeley et al., 1994)
demands to be filled.                                                      either have no parallel versions at all, or their true psychometrical
   Automatic item generation has a number of benefits, especially          equivalence is questionable, as respective studies are missing
compared to traditional test creation (see Bertling, 2012). If the         (Thöne-Otto and Markowitsch, 2004; Schellig et al., 2009; Thöne-
item model and its cognitive basis are properly articulated and            Otto, 2009). This might not be surprising, given that alternatives
the stimulus material carefully selected, then items are created           to complex, figural materials are more difficult to create and
quickly, efficiently, and with comparatively low cost. A test of the       implement digitally compared to alternative words or numbers.
item model can simultaneously be considered a quality control              Two positive examples for visual memory tests delivering
for the item generator and a check for construct validity of the           alternative test forms are the Lern- und Gedaechtnistest-3 (Eng.:
proposed cognitive ability. One major drawback of fixed sets               learning and memory test-3; LGT-3; Bäumler, 1974), which has
of traditionally created items is that they cannot be used once            a total of three equivalent test versions, and the Visueller und
they have been exposed to the public. People then have the                 Varbaler Merkfaehigkeitstest (Eng.: visual and verbal memorizing
opportunity to learn the correct solutions prior to the assessment         ability test; VVM; Schellig and Schächtele, 2001), that offers four
instead of actually engaging in the test tasks during the test             parallel forms. For an overview of commonly applied memory
session. This problem is obviously magnified in an increasingly            testing procedures, see Schellig et al. (2009).
interconnected world. One example for this from the memory
domain is given with the Rey–Osterrieth complex figure test (Rey,          Research Purpose
1941). The figure has been depicted in various textbooks (e.g.,            The purpose of the current work is to introduce “figumem,” a new
Banich and Compton, 2018, p. 210; Kolb and Whishaw, 2015,                  computerized test for figural memory based on AIG that is readily
p. 419; Schellig et al., 2009, p. 527) and can be looked up with           available to researchers and practitioners in the free software “R”
an online search engine.                                                   (R Core Team, 2018). The test itself and a user’s manual are
   One particularly important advantage of AIG is that if an               available as online Supplementary Material to this article.
item model for the creation of test items can be properly                     We focused on figural STM (although the test may be useful
defined, a multitude of parallel items, which differ in their              for the assessment of long-term memory as well, as explained
presentational features but are identical (or at least very                in the section “Discussion”), because the lack of parallel visual
similar) in their psychometrical properties (such as difficulty),          memory tests is particularly prominent and because the use of
can be created. Parallel test versions are often required in               figural test material is less dependent on the testee’s language
longitudinal studies and diagnostic assessments to separate actual         skills and mathematical knowledge. We display a theoretical
temporal improvements of the cognitive ability from mere                   item model based on the visual information load phenomenon

Frontiers in Psychology | www.frontiersin.org                          2                                          June 2020 | Volume 11 | Article 945
Jendryczko et al.                                                                                                              AIG for Figural Memory

(Alvarez and Cavanagh, 2004) to introduce figural memory tests              in a stimulus and is operationalized with a visual search task.
into the AIG approach. We report the results of a study in                  The more the objects load visually, the longer it takes to identify
which the item model was probed in the frameworks of item                   these objects among other similar objects, and the less objects
response theory. In that context, we explain the utility of the             can be stored in visual STM. Importantly, Ueno et al. (2010) and
Rasch Poisson counts model (RPCM; Rasch, 1960/1980) for a                   Ueno et al. (2011) later demonstrated that visual information load
statistical representation of our item model.                               of an object can at least partially be determined by bindings of
    The rest of the paper is structured as follows: We introduce the        stimulus features (e.g., shape and colors), as long as this increases
item-generation model specified for figumem. We then proceed                the similarity of the objects (see also Jiang et al., 2009). To give
to illustrate the RPCM. Finally, we present an empirical study that         an example from Alvarez and Cavanagh’s experiment: A square
incorporates the RPCM to examine the statistical properties of              with a certain color in an array of differently colored squares
the item generator.                                                         of the same size can be found relatively quickly because these
                                                                            stimuli are all distinctively defined by the single feature of color.
                                                                            In contrast, finding a three-dimensional cube with a certain
A Cognitive Model for the Automatic                                         orientation and a certain pattern of shadings along its visible
Generation of Figural Short-Term                                            surfaces among several differently oriented and shaded cubes
Memory Items                                                                takes comparatively longer. These stimuli contain more visual
The distinction between a visual and an auditory STM remains                detail and less salient differences, as orientation and shading
a largely undisputed concept across various memory models.                  must be considered simultaneously for detection in the search
The Baddeley model of working memory (WM; Baddeley and                      task. The authors measured the search rate for different kinds
Hitch, 1974; Baddeley, 1978, 1992) was among the first models to            of visual stimuli such as these and investigated the relationship
present a clearly articulated relation of these sensory modalities to       between the average search rate and the average visual STM
memory functions. While the details of the underlying processes             capacity for the respective objects. They found that STM capacity
are still subject to current research, the model still serves as a          decreases for visually more loaded objects. Visual information
general framework (see, for example, Kosslyn, 2005; Baddeley                load (operationalized as visual search rate) explained 99.2% of the
et al., 2011; Logie, 2011; Baddeley, 2012; Slana Ozimič and                variance in visual STM capacity.
Repovš, 2020). In order to avoid confusion, it should be stressed              This finding represents the base for the radical of our
that “the memory system or systems responsible for STM form                 implemented item model. Its translation into the item format is
part of the working memory system” (Baddeley et al., 2015, p. 41).          explained in the next two sections.
This means that the assessment of STM differs from that of
WM only in the type of the presented task. Whereas the former               Item Format of Choice
merely requires learning of stimulus material for immediate                 Generally, tests that measure visual STM can be distinguished
or only slightly delayed recall, the latter additionally requires           into tests that require the memorization of the spatial layout of
manipulation of the learned material. Consequences of the type              a scene, such as a marked way through a maze (e.g., Schellig
of stimulus material and the modality it is processed with apply            and Schächtele, 2001), and tests that require the memorization
to both memory systems.                                                     of specific figures or the association between specific figures
   The model contrasts a visuospatial sketchpad of memory                   (e.g., Bäumler, 1974). We refer to the former as spatial memory
responsible for the maintenance and manipulation of visual                  tests and to the latter as figural memory tests. Whereas both
information from the phonological loop that coordinates                     item formats require visual STM performance, it is debatable
processing of audible information. Research showed that,                    whether or not both formats actually measure the same trait.
generally, human beings are able to phonologically hold numbers             Findings from neuropsychological research converge into the
and verbal material in their STM without affecting the processing           separation of visual memory into a spatial and an object domain
of visual material and vice versa (e.g., Sanders and Schroots,              (Funahashi et al., 2004; Todd and Marois, 2004, 2005; Logie
1969; Logie et al., 1990; Duncan et al., 1997; Cocchini et al.,             and Van der Meulen, 2008; see Wager and Smith, 2003, for a
2002). Figural memory tests are used to assess the visuospatial             meta-analysis). We decided to design our item generator based
sketchpad, specifically.                                                    on figural memory tests that incorporate figural associations. In
   Fundamental research on the functionality of STM has focused             such tests, testees have to memorize which figure from a pool A
on memory capacity (e.g., Luck and Vogel, 1997; Vogel et al.,               was presented alongside which figure from a pool B. We made
2001; Wheeler and Treisman, 2002; Alvarez and Cavanagh, 2004;               this decision for various reasons. The most obvious one is that
Allen et al., 2006). In other words, researchers investigated the           our cognitive framework specifically stresses the importance of
number of units of information human beings can hold in                     visual load of figures instead of spatial layouts. A transfer to
their STM. It became clear that the term “units of information”             spatial layouts is not straightforward. Moreover, attempts at AIG
is difficult to unambiguously define in general and for visual              of spatial memory items have already been made (Hornke, 2002;
material in particular. Alvarez and Cavanagh (2004) found that              Arendasy et al., 2008), rendering the demand for an automatically
the capacity of visual STM is determined by not only the number             item-generating figural memory test more contemporary. Finally,
of visual objects but also the visual information load (or just             tests that require the memorization of figural associations offer
“visual load”) each individual object holds. In their conception,           a certain flexibility regarding the answer format. The tester can
visual information load is given by the amount of visual detail             demand a reproduction (that is, a drawing) of a figure that

Frontiers in Psychology | www.frontiersin.org                           3                                          June 2020 | Volume 11 | Article 945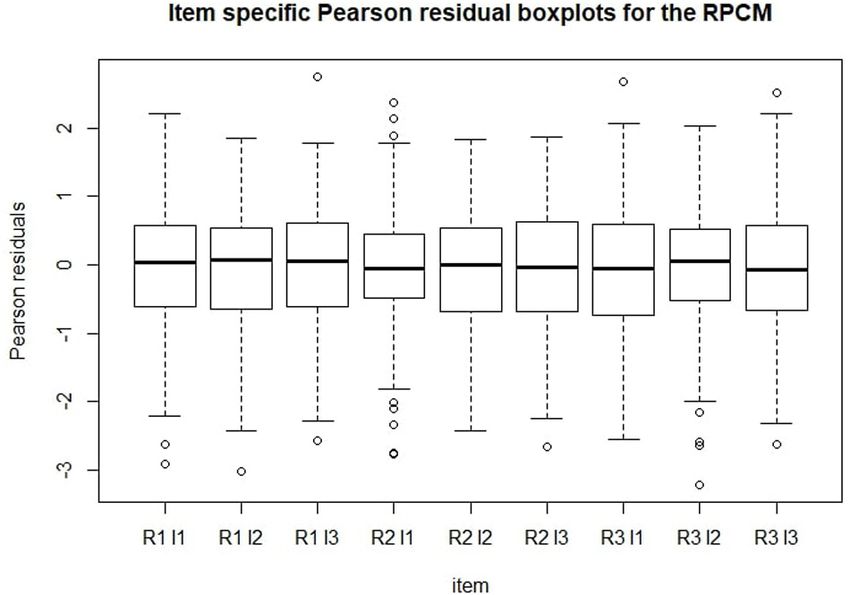
Jendryczko et al.                                                                                                                        AIG for Figural Memory

was associated with a different figure during the memorization                 For items with high visual load, the frames from the second
phase (open response format). This is, however, more difficult              item family are maintained. Only four of the original emblems
to implement into online surveys and hence unpractical if one               are still used: the right triangle, the black circle with the missing
aims at an efficient and fast recruitment of study participants.            quadrant in the top right, the black circle with the prong
Alternatively, researchers can use a closed recall format in which          in the top right, and the “L”-shape. For each of these, three
the testee has to choose the correct figure from a selection                additional variants were created by rotating the emblem 90◦ ,
of figures. This is convenient for online testing procedures                180◦ , and 270◦ . This results in 16 emblems. Four additional
but increases the probability of guessing the correct answers.              emblems were created by taking the black ring from the original
Figumem was constructed with the latter format in mind, but                 20 emblems and editing out a piece at the top, at the right,
alternatives corresponding to a free answer format are already              at the bottom, and at the left. In items from this family, the
implemented and elaborated on in the section “Discussion” and               increased similarities between the frames from the second item
in the test manual.                                                         family are still present, but similarities between the emblems are
    The following concrete format for figumem items was                     additionally increased. To differentiate the emblems from each
determined: In every item, 20 emblems are presented to the testee           other, one has to simultaneously consider the features of shape
in a 5 × 4 matrix. Each emblem is surrounded by a frame (see                and direction. This increases visual load even further compared
Figure 1 for examples). The testee has 1 min to learn which frame           to the first two item families (examples in the third column
surrounds which emblem. After the time elapses, the emblems are             of Figure 1).
presented again in a new screen in a 5 × 4 matrix but in a different           Three item presentation features were considered incidentals
order. Under each emblem, four frames are presented, of which               that can occur randomly: (1) the assignment of an emblem to
one resembles the frame the emblem was surrounded by in the                 a frame; (2) the order of the 20 emblem–frame units along the
previous screen. The other three are distractors. The testee’s task         cells of the 5 × 4 matrix; and (3) the three frames that are used
is it to mark the correct frame for each emblem. The score for this         as distractors for each emblem in the closed answer format (not
task is given by the sum of correctly marked frames and can range           depicted in Figure 1). An important constraint was made so that
between 0 and 20.                                                           each frame appeared equally often as a distractor in the closed
                                                                            answer format, since otherwise, test-specific strategies (exclusion
Designing the Item Generator                                                of specific distractors) could determine the outcome of an item
We created 20 original emblems and 20 original frames as                    (see, for example, Millman et al., 1965; Tarrant et al., 2009).
PNG data files. Additional stimulus material was produced by                   Note that between the items within each row of Figure 1,
modifying some of the emblems and some of the frames. A radical             the families and thus the radical levels, the employed stimulus
with three different levels and incidentals were determined                 material, and the hypothesized item difficulties differ. In contrast,
that govern the rules for combining the various stimuli for                 within each column of Figure 1, all three items consist of the
the creation of three different figumem parent items and their              same stimulus material because they stem from the same item
respective families. Figure 1 presents three example figumem                family. Only the incidentals of concrete emblem–frame units and
items for every radical level (i.e., for every item family). This           presentation order are different1 . The nine items from Figure 1
figure can ease the understanding of the following explanations.            represent those that were incorporated into the current study.
    The radical levels correspond to three different levels of              The Supplementary Material to this article contains a script
visual load. Visual load itself increases with increasing similarity        for the replication of these items with figumem. Each item is
between the visual stimuli within an item by adding additional              uniquely identified by its radical level (or family; 1, low visual
visual features. This in turn implies an increase in item difficulty.       load; 2, medium visual load; 3, high visual load) and its level
For items with low visual load, all 20 original emblems and all 20          on a categorical index variable (incidental-ID) that encapsulates
original frames are used. They are all distinctively defined by the         the item’s random realizations on the incidentals. The actual
feature of figural shape. Hence, visual load is comparatively low,          production of the visual material within figumem is accomplished
as only the feature of shape needs to be remembered to correctly            by reading in the PNG data files containing the emblems and
replicate the associations between emblems and frames (examples             frames and then editing them with the “magick” software package
in the first column of Figure 1).                                           (Ooms, 2018) in R.
    For items with medium visual load, the use of the 20 original              In a nutshell, the difficulty of an item is determined by
emblems is maintained. However, only four of the original frames            the radical of visual load. At the easiest difficulty level, all
are still present in items from this family: the rectangle, the             frames are identified by their shape, and the same applies to
trapeze, the pentagon, and the hexagon. For each of these,                  the emblems (low visual load). At an intermediate difficulty
four additional variants were created by erasing one line of                level, a different subset of frames is used, and these frames
the respective frame, which results in 20 different frames in               are only identifiable by simultaneously considering their shape
total again. The frames of items from this item family have                 and the completeness of lines or position of a missing line
more similarities to one another, as some frames have the same              (medium visual load). At the highest difficulty level, a different
shape and can only be differentiated from each other by also
considering the feature of the missing line (or completeness of             1
                                                                             Due to the random sampling, a specific emblem–frame combination can occur
lines). This increases visual load (examples in the second column           across different items by chance, and the position of a specific emblem or a specific
of Figure 1).                                                               frame can remain unchanged across different items by chance.

Frontiers in Psychology | www.frontiersin.org                           4                                                   June 2020 | Volume 11 | Article 945
Jendryczko et al. AIG for Figural Memory
FIGURE 1 | The nine figumem items that were incorporated into the current study. The Supplementary Material to this article contains a script for the replication of
these items with figumem. The radical of visual load determines item difficulty (increasing item difficulty with increasing magnitude of visual load). For each condition
of visual load, three items were produced. They are differentiated by different (randomly occurring) assignments of emblems to frames and by presentation order of
the emblem–frame units along the 5 × 4 matrix. These different realizations on the incidentals are encapsulated by one index variable (incidental-ID). Understanding
this figure as a 3 × 3 table of figumem items, item difficulty is expected to vary within the rows and to be constant within the columns.
subset of emblems is additionally used. These emblems are remembered associations for an item in this case) with item and
only identifiable by simultaneously considering their shape and person parameters. This model is known as the Rasch Poisson
direction (high visual load). For each item family, the particular counts model (RPCM). In this model, it is assumed that the
emblem–frame combinations and their presentation order are probability for a score Yνi of person ν on item i follows a Poisson
considered incidentals. A constraint is made so that every frame distribution:
appears equally often as a distractor in the closed answer format. y
e−µνi µνiνi
At this point, the item difficulty dependence on the radical and P Yνi = yνi = (1)
the statistical equivalence of isomorphs were only given on the yνi !
hypothetical level. For an actual test of these hypotheses, the item
model needed to be translated into a statistical model. Here µνi reflects the expected score for person ν on item i. The
crucial assumption within the RPCM is that this expected score is
A Statistical Representation of the Item given with the product of a person’s ability parameter θν and an
Model item’s easiness parameter σi :
Based on the Poisson distribution, Rasch (1960/1980) proposed
a model that predicts an item score (the sum of correctly µνi = θν σi (2)
Frontiers in Psychology | www.frontiersin.org 5 June 2020 | Volume 11 | Article 945Jendryczko et al. AIG for Figural Memory
The RPCM can be understood as a generalized linear model MATERIALS AND METHODS
(GLM) with a log-link that contains persons and items as
predictors: Sample
log (µνi ) = θ̃ν + σ̃i (3) Participants were recruited via social network services that reach
out to university students with scholarships and members of
with θ̃ν = log (θν ) and σ̃i = log (σi ). the academic club CdE e.V. and via flyers at the university
Because of the person parameters, the model holds the of Münster and at the university of Konstanz. A total of 234
property of an increasing amount of parameter estimations with examinees completed the online survey. 26 participants had to be
increasing sample size. In most cases (such as the current study) excluded because they reported that their screen did not always
the item parameters are of primary interest, as the model is display the complete item. The final sample consisted of N = 208
usually used to investigate the psychometric characteristics of participants (146 reported to be female, 61 reported to be male,
a test. This property is, thus, disadvantageous because it also 1 person did not state his or her gender). The mean age was
implies enlarged standard errors for item parameters when the 22.51 years (SD = 6.18). One hundred eighty-one examinees were
joint maximum likelihood estimation method is used. For this university students, among which 123 studied psychology. 11
reason, the model is usually estimated as a generalized linear participants were secondary school students, and 16 participants
mixed model (GLMM) using marginal maximum likelihood. already worked in their professions. The psychology students had
Within this approach, person parameters (on the log-scale) can the opportunity to gain course credit for their participation. The
be conceptualized as realizations of a random intercept variable remaining examinees participated as a favor to the second author.
following a normal distribution (Doebler and Holling, 2016):
θ̃ν ∼ N(0, ζ ).
Material
In order to evaluate an automatic item generator, as many
The mean of this distribution can be fixed to zero for model items as possible from each item family should be presented to
identification, and only the variance (ζ) of the distribution needs participants. This number will, however, always be constrained
to be estimated. Within this approach, σi holds the convenient by reasonability considerations. Figural memory items exhaust
interpretation of the expected score on item i given average concentration and cognitive resources rather rapidly. During
(cognitive) ability. the pre-study testing phase, we came to the conclusion that
Item models in the AIG framework assert that the radicals participants should not be required to work on more than nine
determine item difficulty. In order to verify this claim, the item figumem items in one session.
parameters themselves can be explained with a combination A total of 12 figumem items (4 for every difficulty level) were
of radicals (Fischer, 1973; Zeuch, 2010). In figumem, only one generated. These items were implemented into the online-survey
categorical radical (visual load) with three possible outcomes software Questback. One item of each difficulty level served as a
is given that can be cell-mean coded for convenient parameter mere example item for illustration purposes; the other nine (see
interpretations. Let xil represent the condition l (with l = 1, 2, 3) Figure 1) were used for data collection. It was not possible to
of visual load (1, low; 2, medium; 3, high) that is active (xil = 1) or implement our original answering format for the retrieval phase
inactive (xil = 0) in item i. It follows that into Questback. Instead of being displayed in a 5 × 4 matrix,
emblems were presented one below the other with four options
σ̃i = η1 xi1 + η2 xi2 + η3 xi3 (4) for frames arranged underneath each of them (see Figure 2). The
order of emblems was random. Testees had to click on the frame
and of choice for one emblem and scroll down to make the decision
for the next emblem. Both the original answering format and
log (µνi ) = θ̃ν + η1 xi1 + η2 xi2 + η3 xi3 . (5)
this format are available in figumem (see the manual from the
Here eηl represents the expected item score on items with radical Supplementary Material).
level l given average ability. The link to the study was distributed to the participants. It
If the RPCM (regardless whether the items themselves or the was ensured that the survey runs smoothly in every mainstream
radicals are used as predictors) fits, it should be used because internet browser.
it holds some of the same statistical properties as the widely
recognized Rasch 1PL model for dichotomous data (see De Procedure
Ayala, 2009; Eid and Schmidt, 2014). The sum of the item raw Upon clicking on the study link, participants were directed to the
scores serves as a sufficient test statistic, and specific objective first site of the survey. Here they were greeted and informed about
comparisons between persons and between items can be made. the length of the test and the opportunity for psychology students
In the following, we describe an empirical study in which we to gain course credit. Furthermore, participants were informed
investigate the fit of the RPCM for tests created with figumem. about anonymity, voluntariness of participation, and their right
We determine whether the radical sufficiently explains item to cancel participation at any time. Informed consent was asked
difficulty and evaluate the variability of item difficulty within item for. Next, participants were requested to concentrate during the
families. In the section “Analytic Strategy,” we describe how we test and to abstain from the usage of supporting devices like paper
make use of the models listed here for these purposes. and pencil. The survey went on to present participants a black
Frontiers in Psychology | www.frontiersin.org 6 June 2020 | Volume 11 | Article 945Jendryczko et al. AIG for Figural Memory
FIGURE 3 | Experimental sequence design of the study. The nine study items
were distributed across three different blocks. Each block contains one item
with low visual load (L), one item with medium visual load (M), and one item
with high visual load (H). The numbers after the letters represent the
incidental-ID of the respective item (see Figure 1). All participants passed the
three blocks in the same order. Participants were pseudo-randomly assigned
to one of three conditions, meaning that the random number generator
FIGURE 2 | Example of the answering format for figumem items implemented
targeted an equal distribution of participants across the conditions. The
in the current study. In contrast to the originally conceptualized format, the
condition determined the order of items within each block. For block 1, the
emblems and their respective option pools for frames are not presented in a
order of items was the same for all conditions (from easiest to most difficult).
5 × 4 matrix but one below the other in a random order. The three dots at the
For blocks 2 and 3 the order of items was varied. Within blocks 2 and 3, every
top and at the bottom indicate the rest of the 20 emblems and their pools of
magnitude of visual load appeared once in every order-position (from 1 to 3)
frames of a figumem item that are not depicted. The item generator can
across the conditions.
produce both this and the original format (see the manual from the
Supplementary Material).
a warm-up phase for all participants. In blocks 2 and 3, the
order of item difficulties was rotated so that in each block, each
rectangle in the size of a figumem item. Participants were asked item difficulty level appeared once at every position (first, second,
only to proceed with their monitor fully displaying this rectangle. third) across the conditions (see Figure 3). The algorithm of the
They were given the chance to switch to a different device if this survey tool aimed at a randomized assignment of participants to
condition was not fulfilled. the conditions while simultaneously maintaining roughly equal
Afterward, the procedure of the figural memory test was sizes of condition groups. Since the algorithm could not consider
explained, and one example item for every difficulty level was the cancelation of participation of some examinees and could
shown. Practice material with only two emblems and two frames (obviously) not predict the exclusion of some participants (see
was presented. On the next page, the two emblems with a the section “Sample”), group sizes were not equal in the end but
selection of four frames each were given for familiarization with still fairly balanced. 63 participants were in condition group 1, 76
the answering format. Participants had to click on the correct in condition group 2, and 69 in condition group 3.
frames to select them as their answers. At the end of the survey, participants were asked for
After these introductions, the remaining nine figumem items their socio-demographic information. Psychology students were
were successively presented to each participant. To control for informed about the procedure they had to undertake to gain
sequence effects, the order of these nine items was varied across their course credit.
examinees. Instead of completely randomizing the order of
items, their difficulty should be controlled for in the sequences. Analytic Strategy
Presenting several difficult items at the beginning, for example, We first fitted the general RPCM containing the items themselves
can have detrimental effects on participant motivation and as predictors (Eq. 3) as a GLMM to the data. Model fit was
performance. We therefore decided to restrict the possible evaluated by several measures.
presentation orders, systematically assign participants to groups Firstly, we compared the model to a “person-only” model
defined by presentation order, and empirically check sequence via a likelihood-ratio test. In this person-only model, person
effects via group comparisons. We oriented the design for this parameters are modeled as a random intercept, but item
on Latin squares (e.g., Jacobson and Matthews, 1996): One easiness parameters are not included, thereby assuming equal
item of each family was assigned to a block, resulting in three difficulty for every item. Secondly, we computed the dispersion
different blocks with three different items each. All participants index. If the expectation and variance of the outcome are
went through all the blocks in the same order. However, we identical (equidispersion), as the Poisson distribution requires
varied the order in which the three items of varying difficulty (see Baghaei and Doebler, 2018), the dispersion index equals
of a single block were presented between participants. At the 1. Overdispersion (variance is greater than the expectation) is
beginning of the survey, participants were assigned to one of given by values greater than 1. Underdispersion (variance is
three conditions. In all conditions, the three items of the first lower than the expectation) is given by values smaller than
block were presented in order of increasing difficulty to create 1. While overdispersion in the data leads to underestimation
Frontiers in Psychology | www.frontiersin.org 7 June 2020 | Volume 11 | Article 945Jendryczko et al. AIG for Figural Memory
of standard errors, underdispersion leads to overestimation A data set and an R-script containing all analyses are available as
thereof. Hence, underdispersion may be considered less of a online Supplementary Material.
problem because it generally makes the scientific approach more
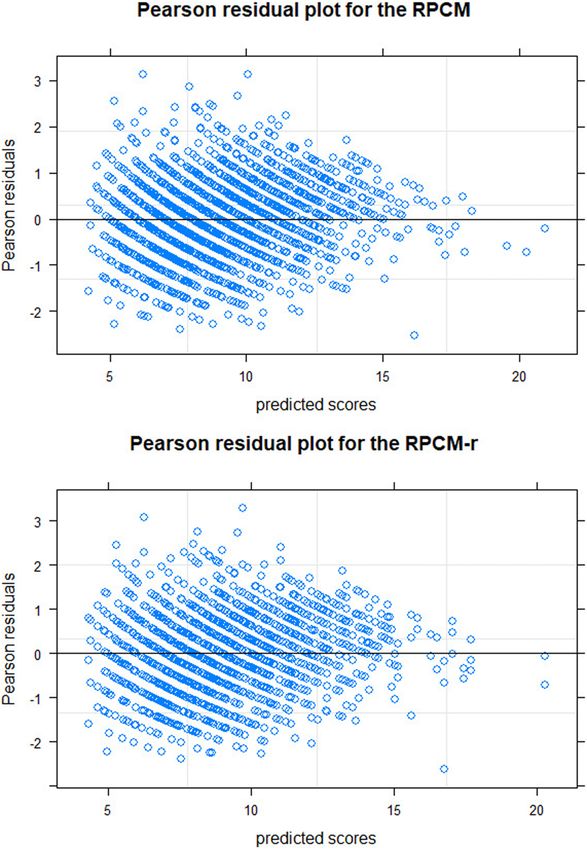
conservative. Thirdly, we examined the Pearson residual plot
for the complete model and Pearson residual boxplots for the RESULTS
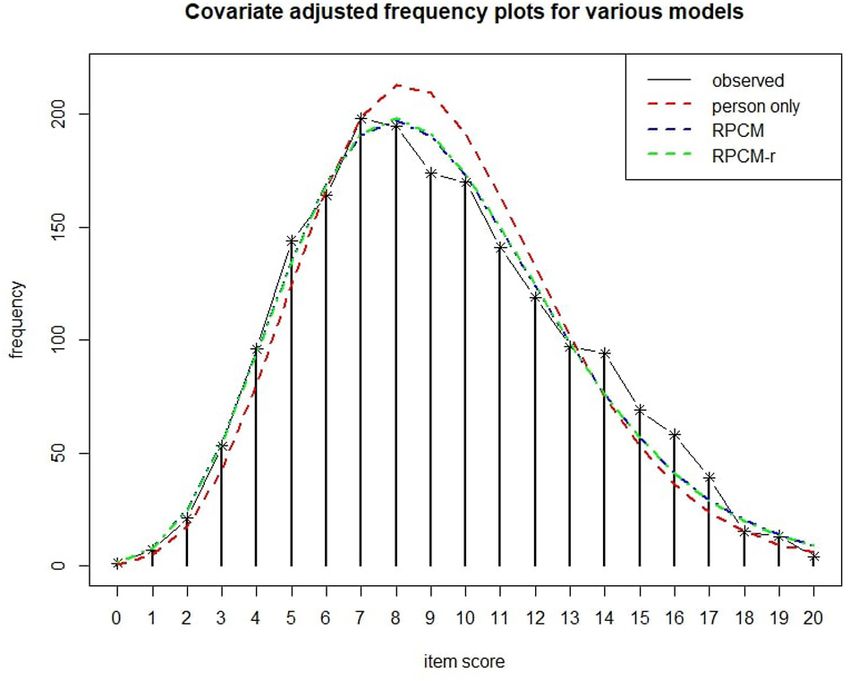
single items. Additionally, the covariate adjusted frequency plot
(Holling et al., 2013) was employed for a graphical model check. Table 1 shows descriptive statistics of all test items. Mean scores
Fourthly, we checked item fit by χ2 -tests as suggested by Baghaei decreased with increasing visual load as determined by the
and Doebler (2018). Here, we ordered participants by their radical, and so did item score standard deviations. The easiest
total scores and placed them into five groups corresponding item (radical level 1, incidental-ID 3) had a mean score of
to the 0.20, 0.40, 0.60, 0.80, and 1.00 quantiles of total score 11.46 (SD = 4.18) correctly remembered associations. The most
distribution. For every item, a test statistic was computed that difficult item (radical level 3, incidental-ID 3) had a mean score
is based on a comparison of expected and observed item scores of 7.12 correctly remembered associations (SD = 2.90). No part–
across the different groups. If the model holds, then this test whole corrected discrimination parameter of any item fell below
statistic asymptotically follows a χ2 -distribution with the degrees 0.40. Cronbach’s alpha for the complete test was α = 0.85 (95%
of freedom equal to the number of groups (= 5 in this case). confidence interval = [0.82; 0.88]). Table 2 displays the Pearson
A non-significant test result suggests good fit of the item. Fifthly, correlations of the items.
a differential item functioning analysis was utilized to compare
the three different condition groups (that encountered the items Rasch Poisson Counts Model With Items
in different orders). For this approach, the RPCM is enhanced as Predictors
by including group variables and their interactions with the The RPCM fitted the data significantly better as a person-only
items. Non-significant interaction terms signal identical item model that omits the item parameters [χ2 (8) = 512.93, p < 0.001].
difficulty across groups. If that can be assumed for the complete The standard deviation of the ability parameters from the RPCM
test, another extended RPCM is estimated and interpreted that was estimated to be 0.229 (95% confidence interval = [0.203;
contains the group variables without interactions. An absence 0.258]). The third column of Table 3 displays item parameters
of significant group effects in this model suggests equal mean of the RPCM on the counts level. The expected item score
ability of the persons across the condition groups. The RPCM and decreased with increasing visual load, yet parameters also differed
these two extended versions of it were compared via likelihood- within item families. The dispersion index was ϕ = 0.72. Thus,
ratio tests (see Baghaei and Doebler, 2018, for details). Lastly, the data were underdispersed. Underdispersion should be considered
reliability of the test grounded in the RPCM for the estimation for diagnostic purposes, as it also underestimates the reliability
of the person parameters was examined. In the RPCM, test of person parameter estimates. We investigate the problem
reliability increases for increasing person parameter values. It is of underdispersion for the current case at the end of the
defined as “Results” section.
s2θ̃ /(s2θ̃ + s2v ) The top graph of Figure 4 shows the Pearson residual plot.
Residuals roughly ranged from -2 to 2 with a few outliers. They
where s2 gives the estimated variance of the person parameters are fairly symmetrical against the zero-axis. The residual variance
θ̃
(on log-level) and s2v represents the squared standard error for was reduced for higher predicted scores, again displaying
the ability parameter for person v (Baghaei and Doebler, 2018). the underdispersion in the data. Overall, the plot displays a
We then estimated a new model in which the item parameters satisfactory model fit.
of the RPCM are replaced with the radical levels of the Figure 5 shows Pearson residual boxplots for item-specific
item model (Eq. 5). We refer to this model as the RPCM-r. predicted scores. Generally, the same conclusions can be derived
A likelihood-ratio test between the RPCM and RPCM-r revealed from this graph as from Figure 4. Mean residuals were
whether implementing the assumption that item parameters around zero for every item. As expected, most residuals settled
can be completely explained by the radical decreased model fit between -2 and 2.
significantly. Based on the RPCM, we investigated the differences The blue dashed line in Figure 6 shows the expected frequency
in expected item score between items from the same family with of item scores as predicted by the RPCM. As can be seen, the line
different incidental-IDs. approaches the observed scores closely.
The correlation of the item parameters from the RPCM and The last two columns of Table 1 deliver the results of the
predicted item parameters from the RPCM-r was investigated. item-based χ2 -tests. All p-values were above 0.20, suggesting
We examined the correlation between the person parameters of satisfactory fit for every item.
the RPCM and the person parameters of the RPCM-r, as well. The differential item functioning approach revealed a
Finally, we judged overall fit of the RPCM-r via graphical model significant difference for the difficulty of the item with radical
checks and investigated the reliability of its produced person level 3 and incidental-ID 1 between the first and the second
parameter estimates. group (β = −0.17, z = −2.06, p = 0.039). However, the
For further information on the procedures, we refer to Baghaei multiple-testing issue due to several groups and items must
and Doebler (2018) and Holling et al. (2013). All models were be considered in this approach (see Baghaei and Doebler,
estimated with the “lme4” software package (Bates et al., 2015). 2018). Some significant differences were expected to occur by
Frontiers in Psychology | www.frontiersin.org 8 June 2020 | Volume 11 | Article 945Jendryczko et al. AIG for Figural Memory
TABLE 1 | Descriptive statistics and χ2 -tests of item fit.
Item Statistic
R I Median Mean SD Minimum Maximum Discrimination χ 2 (df = 5) p-value
1 1 11.00 10.70 3.58 2 18 0.48 4.23 0.517
1 2 11.00 11.09 3.82 1 19 0.65 6.32 0.277
1 3 11.50 11.46 4.18 2 20 0.64 4.66 0.458
2 1 9.00 9.48 3.26 2 19 0.58 1.09 0.955
2 2 10.00 9.80 3.60 2 20 0.67 1.08 0.956
2 3 8.00 8.66 3.72 1 18 0.66 0.83 0.975
3 1 7.00 7.22 3.02 2 18 0.49 2.31 0.804
3 2 7.00 7.58 2.86 0 19 0.53 6.33 0.276
3 3 7.00 7.12 2.90 1 17 0.49 4.37 0.498
N = 208; R = radical level; I = incidental-ID; SD = standard deviation; discrimination = part–whole corrected discrimination parameter. Radical determined visual load (1,
low; 2, medium; 3, high).
TABLE 2 | Pearson correlations of study items.
R1 I1 R1 I2 R1 I3 R2 I1 R2 I2 R2 I3 R3 I1 R3 I2
R1 I2 0.400*** – – – – – – –
R1 I3 0.396*** 0.608*** – – – – – –
R2 I1 0.370*** 0.427*** 0.378*** – – – – –
R2 I2 0.456*** 0.519*** 0.527*** 0.447*** – – – –
R2 I3 0.346*** 0.496*** 0.536*** 0.442*** 0.515*** – – –
R3 I1 0.243*** 0.325*** 0.296*** 0.409*** 0.381*** 0.351*** – –
R3 I2 0.214** 0.388*** 0.352*** 0.376*** 0.355*** 0.482*** 0.319*** –
R3 I3 0.196** 0.312*** 0.311*** 0.337*** 0.359*** 0.379*** 0.432*** 0.454***
N = 208. **p < 0.01, ***p < 0.001.
TABLE 3 | Item easiness parameters (counts level) for various models (95% confidence interval bounds in rectangular brackets).
Item Model
R I RPCM CMP-gd CMP-sd RPCM-r CMP-r-gd CMP-r-sd
1 1 10.43 [9.90; 10.98] 10.41 [9.91; 10.94] 10.41 [9.90; 10.96] – – –
1 2 10.81 [10.26; 11.37] 10.79 [10.28; 11.33] 10.79 [10.29; 11.32] 10.80 [10.38; 11.23] 10.79 [10.38; 11.21] 10.79 [10.38; 11.21]
1 3 11.16 [10.60; 11.74] 11.15 [10.62; 11.70] 11.15 [10.61; 11.72] – – –
2 1 9.24 [8.74; 9.75] 9.23 [8.77; 9.71] 9.23 [8.79; 9.69] – – –
2 2 9.55 [9.05; 10.07] 9.54 [9.07; 10.03] 9.54 [9.08; 10.02] 9.08 [8.71; 9.45] 9.07 [8.71; 9.43] 9.07 [8.72; 9.43]
2 3 8.44 [7.98; 8.92] 8.43 [8.00; 8.89] 8.43 [7.99; 8.90] – – –
3 1 7.04 [6.63; 7.46] 7.03 [6.65; 7.43] 7.03 [6.64; 7.44] – – –
3 2 7.38 [6.96; 7.82] 7.37 [6.98; 7.79] 7.37 [6.99; 7.77] 7.12 [6.82; 7.43] 7.11 [6.82; 7.41] 7.11 [6.82; 7.41]
3 3 6.93 [6.53; 7.36] 6.92 [6.55; 7.32] 6.92 [6.54; 7.33] – – –
N = 208. RPCM = Rasch Poisson counts model with items as predictors; CMP-gd = Conway–Maxwell–Poisson model with items as predictors and a global dispersion
parameter; CMP-sd = Conway–Maxwell–Poisson model with items as predictors and item-specific dispersion parameters; RPCM-r = Rasch Poisson counts model with
the radical as a predictor; CMP-r-gd = Conway–Maxwell–Poisson model with the radical as a predictor and a global dispersion parameter; CMP-r-sd = Conway–Maxwell–
Poisson model with the radical as a predictor and radical level–specific dispersion parameters. Parameters reflect expected item scores given average ability.
chance. No other interaction effect was significant (range of p = 0.564, 95% confidence interval = [−0.11; 0.06]; β3 = −0.03,
p-values = 0.058–0.919). A likelihood-ratio test revealed no z = −0.59, p = 0.559, 95% confidence interval = [−0.11; 0.06]).
significant decline in model fit when interactions between items A likelihood-ratio test revealed no significant difference in fit
and group variables were restricted to zero and only additive between this model and the RPCM [χ2 (2) = 0.44, p = 0.803],
effects of the group variables were maintained in the model suggesting equal mean ability across groups.
[χ2 (16) = 16.93, p = 0.390]. When the group variables were The red dashed line in the top graph of Figure 7 plots
added into the RPCM without any interaction terms, they had the estimated reliability of ability estimation against the person
no significant effect on the item score (β2 = −0.02, z = −0.58, parameters as estimated within the RPCM. The smallest
Frontiers in Psychology | www.frontiersin.org 9 June 2020 | Volume 11 | Article 945Jendryczko et al. AIG for Figural Memory
FIGURE 6 | Covariate adjusted frequency plot (Holling et al., 2013) for various
models. The person-only model contains only person parameters as a
random intercept for score prediction.
the non-psychology students did not receive any reimbursement
for participation and should therefore do worse on the tasks. We
refitted the RPCM to the data and included a binary variable that
indicated whether a participant was a psychology student or not.
The model predicted the psychology students to remember 2.24%
less figural associations than the non-psychology students, but
FIGURE 4 | Pearson residual plots for the RPCM (Rasch Poisson counts this difference was not significant (p = 0.528). Hence, no evidence
model with items as predictors; upper graph) and for the RPCM-r (Rasch for this type of motivational bias was present in the data.
Poisson counts model with the radical as a predictor; lower graph).
Influence of the Radical and the
Incidentals
The person parameter standard deviation and its 95% confidence
interval bounds within the RPCM-r were identical to the
respective statistics from the RPCM when rounded to the third
decimal. The sixth column in Table 3 presents estimates and
95% confidence intervals of item easiness for every level of
the radical variable on the counts level. The non-overlapping
confidence intervals reveal that the expected item score decreased
significantly with increased visual load. In other words, items
with higher visual load were significantly more difficult. The
dispersion index for the model was ϕ = 0.74.
A likelihood-ratio test between the RPCM and the RPCM-r
revealed a significant decline in model fit when item parameters
were assumed to be fully explained by the radical [χ2 (6) = 24.21,
FIGURE 5 | Item-specific Pearson residuals boxplots for the RPCM. p < 0.001]. Table 4 contains differences in expected item
R = radical level; I = incidental-ID. scores between items with the same radical level (i.e., from
the same family) but with different incidental-IDs. Incidentals
did not impact the expected score on items with high visual
conditional reliability was α = 0.78. As already mentioned, this load. Within the family of low visual load, two items had a
reflects an underestimation due to underdispersion, and a better significantly different difficulty. Within the family of medium
estimate will be given at the end of the “Results” section. visual load, one item difficulty was significantly different from
During the revision of this article, one of the reviewers pointed the others. The practical implications will be evaluated in the
out that a motivational bias might have impacted the results since section “Discussion.”
Frontiers in Psychology | www.frontiersin.org 10 June 2020 | Volume 11 | Article 945Jendryczko et al. AIG for Figural Memory
is nearly identical to the predictions of the RPCM indicating no
decline in the accuracy of the expected scores when the radical
is used as a predictor of item easiness instead of estimating item
parameters directly. The red line in Figure 6 shows the fit of the
person-only model in which items were not assumed to differ in
difficulty. As our cognitive model is rather simple and implies a
uni-dimensionality of visual load, this model fitted the data rather
well, too. However, it substantially underestimated the frequency
of lower item scores and overestimated the frequency of medium
item scores by not taking the difficulty of items into account.
The red dashed line in the bottom graph of Figure 7 displays
reliability estimates of person parameters for the RPCM-r.
A comparison with the top graph of Figure 7 reveals no cutbacks
on reliability when the RPCM-r was used instead of the RPCM.
Post hoc Analyses for the
Underdispersion
Underdispersion violates a core assumption of the RPCM.
However, even for underdispersed data, the RPCM (or the
RPCM-r in the current case) may still be a useful and valid
approximation of the true model with regard to the estimation
of person and item parameters. It depends on the robustness of
parameter estimates against the violation of equidispersion.
Brooks et al. (2017) published the R package “glmmTMB,”
which allows the estimation of Conway–Maxwell–Poisson
(CMP) counts models. These models can be considered
FIGURE 7 | Conditional reliabilities of person parameters for models with generalized Poisson counts models that relax the assumption of
items as predictors (upper graph) and for models with the radical as a
equidispersion by either estimating a global dispersion parameter
predictor (lower graph). CMP-gd = Conway–Maxwell–Poisson model with
items as predictors and a global dispersion parameter; or several item (or, more generally, predictor) specific dispersion
CMP-sd = Conway–Maxwell–Poisson model with items as predictors and parameters (Forthmann et al., 2019a,b). We modified the RPCM
item-specific dispersion parameters; CMP-r-gd = Conway–Maxwell–Poisson into a CMP model containing a global dispersion parameter
model with the radical as a predictor and a global dispersion parameter; (referred to as the CMP-gd) and into a CMP model with
CMP-r-sd = Conway–Maxwell–Poisson model with the radical as a predictor
and radical level–specific dispersion parameters.
item-specific dispersion parameters (referred to as the CMP-
sd). Similarly, we modified the RPCM-r into a CMP model
containing a global dispersion parameter (CMP-r-gd) and into
a model containing radical level–specific dispersion parameters
The correlation between item parameter estimates of the (CMP-r-sd). Table 5 shows comparisons of nested models with
RPCM and predicted item parameters of the RPCM-r was likelihood-ratio tests and Akaike information criteria (AICs) and
r = 0.977 (p < 0.001). Hence, the radical explained 95.41% of Bayesian information criteria (BICs).
the variance in item difficulty in the general RPCM (adjusted As can be seen, for both the RPCM and the RPCM-r, the
R2 = 0.939). The correlation between the person parameters of modification with the inclusion of a global dispersion parameter
the two models was r = 1. improved model fit significantly. This is to be expected when
The bottom graph of Figure 4 displays the residual plot for the underdispersion was found in a Poisson model. Modeling item
RPCM-r. It is very similar to the residual plot for the RPCM and or radical level–specific dispersion parameters, however, had no
suggests satisfying model fit. The green line in Figure 6 shows significant incremental effect on model fit. The fourth and fifth
the expected frequency of item scores based on the RPCM-r. It columns of Table 3 reveal that item parameter estimates within
TABLE 4 | Differences in expected item scores between items with different incidental-IDs for each level of the test radical.
Difference Radical level = 1 Radical level = 2 Radical level = 3
ID 2 - ID 1 +3.57% (+0.38) +3.34% (+0.31) +4.81% (+0.35)
ID 3 - ID 1 +6.82% (+0.74)* −9.01% (−0.80)** −1.48% (−0.10)
ID 3 - ID 2 +3.24% (+0.36) −12.36% (−1.11)*** −6.29% (−0.45)
N = 208. Radical level determined visual load (1, low; 2, medium; 3, high). Numbers in parentheses give the expected difference in item score for a person with average
cognitive ability. Significant differences are printed in bold. *p < 0.05, **p < 0.01, ***p < 0.001.
Frontiers in Psychology | www.frontiersin.org 11 June 2020 | Volume 11 | Article 945Jendryczko et al. AIG for Figural Memory TABLE 5 | Model comparisons between Rasch Poisson models and Conway–Maxwell–Poisson models. Model 1χ 2 (df) p-value AIC BIC RPCM – – 9,422.10 9,477.50 CMP-gd 34.18 (1)
Jendryczko et al.                                                                                                            AIG for Figural Memory

participants reached the maximum score of 20 for the item                   in general coexist and differ in their degrees of psychometrical
with radical level 1 and incidental-ID 3, It is important to                and neuropsychological grounding. Different working definitions
keep in mind that our sample consisted mainly of students and               for memory are used in order to achieve specific aims, like
academics, who are expected to be well above average on the                 the explanation of certain memory phenomena or the precise
ability spectrum.                                                           diagnosis of a neurological condition (Murdock, 1962; Glanzer
   The item families with more visual load should be considered             and Cunitz, 1966; Baddeley, 1992; Frankland and Bontempi,
with regard to construct validity, as they present potential for            2005; Purves et al., 2013; Goldstein, 2014). The use of specific
further studies on memory. In this study, visual information load           test material can be adjusted in accordance with the working
predicted most of the variance in item easiness (95.41%). This              definition. For a simple example, the Rey–Osterrieth complex
can be seen as a strong confirmation of our cognitive model                 figure test (Rey, 1941) is often used to assess visual STM, as the
(Arendasy et al., 2008). Moreover, our results thereby fall in              testees must reproduce (i.e., draw) a figure in an open response
line with the findings of Alvarez and Cavanagh (2004), although             format immediately after visually inspecting it. Then, after some
we used different stimulus material, different measurement                  time has elapsed and the testees have worked on different tasks,
techniques, and an overall different experimental design. While             they must draw it again from memory. This is then considered a
this might also hint toward high construct validity, future studies         performance of visual long-term memory retrieval because the
are required to explore the correlations of test performances               different tasks during the delay period should have occupied
on figumem items and already established testing procedures                 STM and WM. Figumem can be used in the same way. An open
and experimental assessment techniques. In that context, a                  response format is implemented in the software. It can be used
broader framework that extends STM to the multiple facets of                to produce a matrix of emblem–frame units. Templates only
WM should be established. While STM can be differentiated                   containing the emblems can be generated alongside. The testee’s
from WM by the given task (memorization vs. manipulation;                   task is to draw the frames around the emblems of this template.
see above), it is not obvious that the memorization of more                    With respect to different models of memory, extensions of
complex (i.e., more visually loaded) stimulus material does not             the cognitive model of the item generator should be considered.
occupy the same cognitive processes such as attention, imagery,             Unlike fluid reasoning, in which inductive and deductive
and executive functions that are debated to be central to WM                cognitive processes are rather precisely defined (Cattell, 1987;
(Kosslyn, 2005; Baddeley et al., 2011; Logie, 2011; Baddeley,               McGrew, 2009), the scientific definition of basic STM relates
2012; Slana Ozimič and Repovš, 2020). For example, in order to             to mere capacity, not processes. As previously discussed, the
memorize figural associations from figumem items with medium                concept of WM goes beyond that of STM because elements
and high visual load, it might be necessary to not only rehearse            must be not only remembered but manipulated as well. This
the associations in an inner scribe (the rehearsal mechanism                implies specific forms of conscious cognitive processing. In that
of the visuospatial sketchpad; see Baddeley, 2012, p. 13) but               context, the actual differences between WM and fluid reasoning
also actively compare two similar frames with regard to the                 are debated (e.g., Kyllonen and Christal, 1990; Kane et al., 2004).
emblems they contain. From this perspective, one would expect               Extending figumem for the measurement of WM is possible
higher correlations between more demanding WM tasks and                     as item formats in which testees must manipulate the placing
visually more loaded figumem items compared to visually less                of missing lines of the frames and orientation of the emblems
loaded figumem items.                                                       themselves are feasible. The number of radicals can be increased
                                                                            to contain, for example, colors for the emblems and dashed and
                                                                            dotted presentations of frame lines. This would further require an
Practical Implications and Additional                                       extension of the cognitive model and its statistical representation
Features of Figumem                                                         (see Freund et al., 2008).
Within every item created by figumem, all 20 emblems and all
20 frames available for the respective item family are used. This           Limitations
raises the question of how many items that substantially differ             We drew a sample of nine figumem items for the empirical
in their presentation features can be truly created. Participants           investigation of the item generator. This is obviously a very
of our study were mainly recruited among academics, and the                 small sample size, and our results should be generalized with
field test revealed restricted variance of test outcomes not to be          caution. Replications of the test of figumem should include
an issue (Table 1 and Figure 6). When using figumem for the                 a larger number of incidental realizations for every radical
diagnosis of people from the average of the ability spectrum or             level. This can be problematic from a practical viewpoint,
from clinical populations, the amount of presented emblem–                  as visual memory tests are perceived as rather cumbersome
frame units can be reduced, which in turn increases the amount              by participants. An expedient alternative in study design
of concrete figural associations that can appear in an item. This           is to randomly sample the incidentals for every individual
feature is already implemented in figumem. Alternatively, more              participant instead of using a fixed set of items across all
figures can be created to enhance the item generator. This would            examinees. This requires the production of test items “on
demand a repeated empirical evaluation of the item model.                   the fly.” If one aims at conducting the inquiry online, then
    Although the implemented cognitive model of figumem                     this approach is bound to advanced survey tools that are
relates to visual STM, the test should not be regarded as a distinct        not readily available to any researcher. However, such a
measure of STM alone. Various models of memory functions                    study design is especially useful for better estimating the

Frontiers in Psychology | www.frontiersin.org                          13                                        June 2020 | Volume 11 | Article 945
You can also read


