Hyperspectral data as a biodiversity screening tool can differentiate among diverse Neotropical fishes
←
→
Page content transcription
If your browser does not render page correctly, please read the page content below
www.nature.com/scientificreports
OPEN Hyperspectral data as a biodiversity
screening tool can differentiate
among diverse Neotropical fishes
M. A. Kolmann1,2*, M. Kalacska3, O. Lucanus4, L. Sousa5, D. Wainwright6,
J. P. Arroyo‑Mora7 & M. C. Andrade8
Hyperspectral data encode information from electromagnetic radiation (i.e., color) of any object
in the form of a spectral signature; these data can then be used to distinguish among materials or
even map whole landscapes. Although hyperspectral data have been mostly used to study landscape
ecology, floral diversity and many other applications in the natural sciences, we propose that
spectral signatures can be used for rapid assessment of faunal biodiversity, akin to DNA barcoding
and metabarcoding. We demonstrate that spectral signatures of individual, live fish specimens can
accurately capture species and clade-level differences in fish coloration, specifically among piranhas
and pacus (Family Serrasalmidae), fishes with a long history of taxonomic confusion. We analyzed 47
serrasalmid species and could distinguish spectra among different species and clades, with the method
sensitive enough to document changes in fish coloration over ontogeny. Herbivorous pacu spectra
were more like one another than they were to piranhas; however, our method also documented
interspecific variation in pacus that corresponds to cryptic lineages. While spectra do not serve as
an alternative to the collection of curated specimens, hyperspectral data of fishes in the field should
help clarify which specimens might be unique or undescribed, complementing existing molecular and
morphological techniques.
The biological sciences face two dire and disturbing issues: (1) increases in extinctions of animals across all con-
tinents and o ceans1–4, as well as (2) a shrinking pool of taxonomists trained to identify these o
rganisms5–7. The
need to find, categorize, and curate biodiversity is both critical for the prioritized deployment of conservation
resources and for maintaining a record of biodiversity before such organisms are lost. Complementing surveys
and natural history collections, there are methods like DNA barcoding and meta-barcoding which have been
developed to catalog biodiversity, for both previously known and unknown organisms7. Rapid identification
of phenotypic diversity in the field gives biodiversity researchers the ability to streamline their collections and
surveys, as well as brings assessment of phenotypic variation back to the forefront of systematics. However,
both traditional morphological taxonomy and molecular barcoding still require considerable benchwork: i.e.,
an intensively trained taxonomist who completes microscopy and meristics to identify phenotypic structures
or a technician that performs PCR reactions and sequencing for barcoding. What if another method for rapid
identification of polymorphism in natural populations existed? Moreover, what if assessment of phenotypic
polymorphism could be undertaken in the field while living organisms are held in person, rather than in a lab
far away? We propose that hyperspectral assessment of live organisms, and the generation of spectral signatures
for individual taxa (or operational taxonomic units, OTUs) can provide: (1) rapid assessment of phenotypic
variability in the field, (2) discriminate organisms along meaningful categories like taxonomy or ontogeny, and
(3) complement or even reconcile morphological taxonomy with molecular barcoding methods.
Hyperspectral analysis is a well-established methodology in the Earth sciences with roots in chemistry and
physics. By analyzing how light (electromagnetic radiation) interacts with matter (even an organism), it is pos-
sible to determine an object’s chemical composition and physical structure. As such, hyperspectral analysis
differs from conventional analysis of photographs or other digital media (e.g.8,9). Matter reflects, absorbs, and
emits radiation in varying proportions at different wavelengths, creating what is known as a spectral signature,
1
University of Michigan, Museum of Paleontology, 1105 N University Ave, Ann Arbor, MI 48109, USA. 2Royal
Ontario Museum, 100 Queens Park, Toronto, ON M5S 2C6, Canada. 3Applied Remote Sensing Lab, McGill
University, Montreal, QC H3A 0B9, Canada. 4Below Water Inc., Vaudreuil‑Dorion, QC J7V 0K4, Canada. 5Laboratório
de Ictiologia de Altamira, Universidade Federal do Pará, Altamira, PA, Brazil. 6Yale University (Peabody Museum),
New Haven, CT, USA. 7National Research Council Canada, Ottawa, ON, Canada. 8Núcleo de Ecologia Aquática e
Pesca da Amazônia, Universidade Federal do Pará, Belém, PA, Brazil. *email: mkolmann@gmail.com
Scientific Reports | (2021) 11:16157 | https://doi.org/10.1038/s41598-021-95713-0 1
Vol.:(0123456789)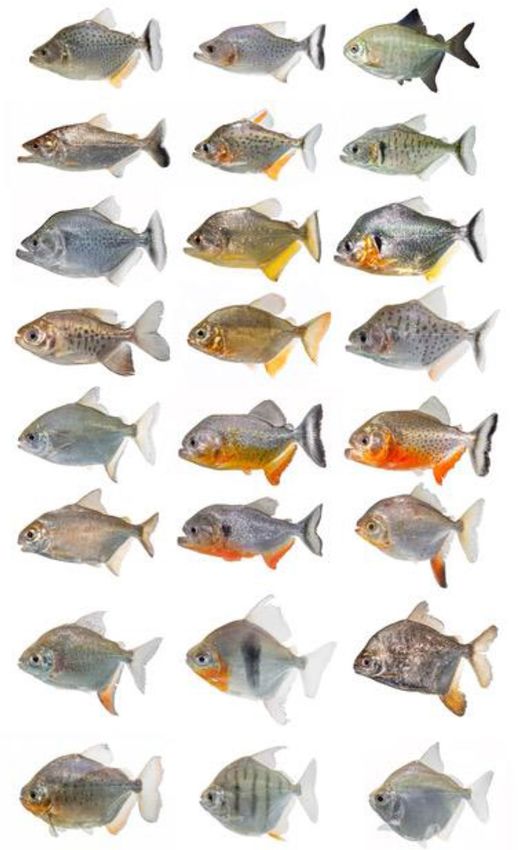
www.nature.com/scientificreports/
measured light encoded with information. It is therefore possible to assess the chemical composition of an
organism’s anatomy and use this same anatomical region as a point of comparison among other related species.
Moreover, whereas existing biodiversity survey methods like DNA barcoding and traditional morphological
taxonomy incur sustained costs, like the purchase of reagents, field spectroradiometers represent a one-time
cost comparable even in the short-term to molecular labs.
Early applications for biodiversity assessment with spectroradiometry date back six decades to investigations
on plants10 and reptiles11. Since then, it has become a widely applied approach for mapping vegetation biodi-
versity (e.g.12) with large-scale mapping campaigns carried out in a range of ecosystems worldwide (e.g.13,14).
For studying animals, its application is far less common. Early work examined the potential for hyperspectral
analysis to rapidly assess community numbers in remote regions by testing it on polar m ammals15. Hyperspec-
tral analysis has also been used in a limited number of studies to differentiate amphibian and reptile species16–18
and insects19. In aquatic environments, this technology is even more rarely used, but early attempts at monitor-
ing coral beds20–22, identifying deep sea megafauna23 and studying camouflage in marine taxa24,25 have shown
promising results. Like DNA barcoding, taxonomic spectroradiometry (i.e., spectral signatures) could ‘invert’
traditional taxonomy when used as a ‘taxonomic screening tool’ whereby predefined, spectrally distinctive groups
are examined for trait variation according to what phenotypic characters morpho-taxonomists are interested i n26.
Analysis of the naturally occurring variability in the spectral signatures for any particular species suggests that
natural historians and taxonomists can use hyperspectral data to discriminate among distinct species or perhaps
even different populations of organisms in the field, however the use of hyperspectral data in this way has not
been rigorously tested. We remedy this by studying how effective hyperspectral data are in distinguishing taxa
along three categorical lines of interest, in particular: (1) phylogenetic and taxonomic relatedness, (2) ecological
similarity, and (3) ontogenetic stage. We did this by analyzing the spectral signatures of South American characi-
form fishes (piranhas and pacus: family Serrasalmidae), as these animals are difficult to distinguish even under
controlled conditions (Fig. 1) and because the effort of sampling for aquatic organisms is typically more difficult
than terrestrial or even volant species, which are more easily observable. We hypothesize that each species will
have its own unique deterministic spectrum, making this metric suitable for rapid species identification in the
field as well as elsewhere (markets, aquariums, aquaculture, commercial fishing, etc.). Analysis of the spectral
signatures appears robust to inter-individual variation, assuming that organisms are not damaged in anatomical
regions of interest.
Why use pacus and piranhas (Serrasalmidae) as a case study for surveying spectral signature diversity? The
serrasalmid fishes hold important ecological, economic, and cultural significance in South American river basins
and yet are plagued by centuries of taxonomic uncertainty. This system is particularly appropriate system for
demonstrating how new methods of rapid field identification can improve our understanding of biodiversity at
local and regional scales. Attempts to reconcile taxonomic uncertainty and bring about an evolutionary under-
standing of the family through molecular methods have corroborated the dubious taxonomic past of the family
and continue to find issues with morpho-taxonomic genera designations. Currently, there are about 40 species of
piranhas in five genera and 60 species of pacus in eleven genera, found in nearly all habitats in South America27.
Around half of serrasalmid genera are non-monophyletic (Tometes, Mylesinus, Myleus, Myloplus, Serrasalmus and
Pristobrycon) while the remainder are less speciose or monotypic (Piaractus, Mylossoma, Colossoma, Acnodon,
Ossubtus, Pygocentrus, Catoprion, and Pygopristis)28,29. Within these genera, recent barcoding efforts suggest
that some 30% of lineages harbor cryptic diversity or undescribed s pecies30. Moreover, serrasalmids and many
other tropical fishes are under significant pressure from overfishing, pollution, and especially from habitat loss
or alteration. Dams, local and global climate change-induced drought, and changes in water conditions (turbid-
ity, pollution) may affect the sensitive balance needed for plant and animal communities to thrive, particularly
primary mesopredators and grazers like serrasalmid fi shes31.
Results
Spectral measurements. To standardize our sampling procedure and reduce measurement error, we
assessed how spectral signatures varied across regions of the body in serrasalmid fishes. The spectral signatures
of fishes varied depending on where the probe was placed (Figs. 2, 3), as fish body shape also varies greatly across
clades32. For comparative purposes, it is therefore important that the probe is always placed in a standard loca-
tion (Fig. 2). In Fig. 3, we show an example pacu (M. schomburgkii) and piranha (S. geryi), which demonstrate
that the spectra differ in both spectral shape and amplitude (i.e., brightness) between species, but also within the
same individual (depending on probe placement). Although close-up photographs show similarities among spe-
cies at each given sampling location, there can be marked differences in spectra. For example, the caudal spec-
trum has a different shape between the two species, but examination of the photograph illustrates that visually
they are similar in color, texture, and pattern. Similarly, the dorsal spectra are different in shape despite similarity
in the scales, with the reflectance increasing to 40% on the pacu at wavelengths longer than 700 nm, whereas for
the piranha the reflectance is constant at ~ 18% in that same wavelength range.
Spectral dissimilarity. We demonstrate that when spectra of individual fishes are matched to spectral
libraries (i.e., collection of spectra of different species), these individuals can be distinguished from related spe-
cies, as well as from conspecifics at different ontogenetic stages and from different geographic regions. Our
measurements indicate that spectra vary in shape across the 79 samples (Fig. 4). The mean α from the all-
pairwise comparison ranges from 0.13 ± 0.09 (Serrasalmus elongatus, adult, Amazon lowlands) to 0.53 ± 0.12
(Piaractus mesopotamicus, Pantanal). The smallest spectral angle (α = 0.011) was found between a piranha, Ser-
rasalmus odyssei (Amazon lowlands), and a pacu, Colossoma macropomum (juvenile, Amazon lowlands). The
largest spectral angle (α = 0.688) was also found between a piranha Serrasalmus geryi (juvenile, Araguaia) and a
Scientific Reports | (2021) 11:16157 | https://doi.org/10.1038/s41598-021-95713-0 2
Vol:.(1234567890)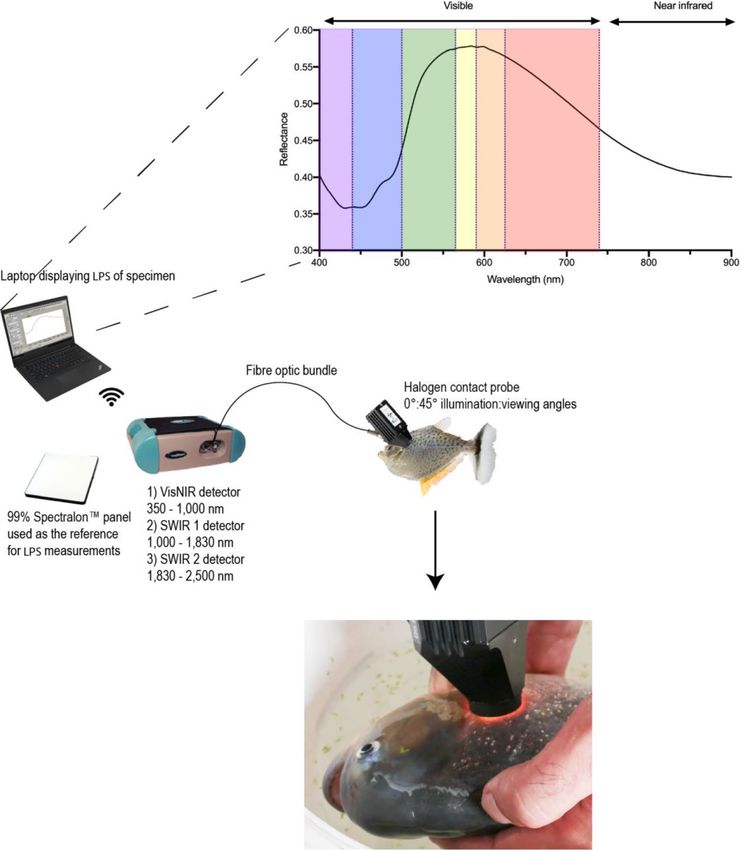
www.nature.com/scientificreports/
Figure 1. Example of serrasalmid diversity from seven regions: Amazon Lowlands, Orinoco, Pantanal, Tapajos,
Tocantins, Araguaia, and Xingu. Species shown include both piranhas and pacus. Species names omitted
to illustrate the challenge with identification due to the similarity among species. Photographs taken under
standardized conditions as white screen photographs which emphasize the color and pattern of each taxon.
Under non-ideal conditions of observation species are more difficult to differentiate (see Figure S7).
pacu, P. mesopotamicus (Pantanal). Overall, samples with the most distinctive spectra (i.e., largest α) were found
to be P. mesopotamicus (Pantanal), Pygocentrus nattereri (Araguaia) and P. nattereri (Amazon lowlands) with
93.7, 92.1 and 86.7% of α > 0.3. Species with the least distinctive spectra (i.e., lowest α) were found to be Serrasal-
mus hollandi (Amazon lowlands) and Myloplus schomburgkii ‘big bar’ (Xingu) with 46% of α < 0.1.
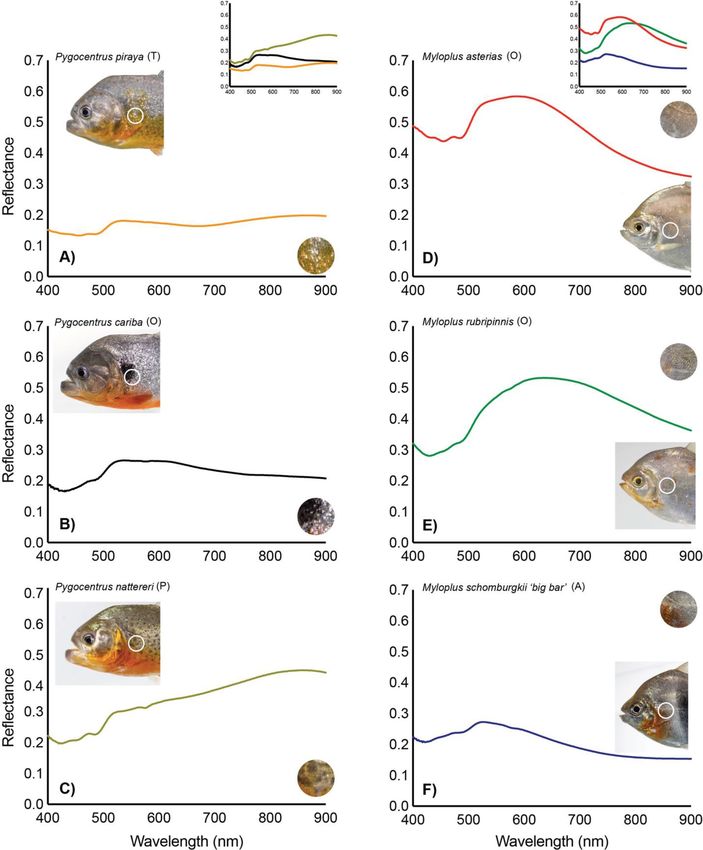
Figure 4 illustrates the spectra for three piranhas from the genus Pygocentrus (i.e., P. cariba, P. piraya and P.
nattereri) and three pacus from the genus Myloplus (i.e., M. asterias, M. rubripinnis, and M. schomburgkii ‘big
bar’). Despite close phylogenetic relationship between these taxonomic species of the same genera, the spectra
vary in shape between each species. This difference is accentuated by the first derivative (Fig. 5) which illustrates
the wavelengths at which local minima and maxima are found (i.e., absorption features and peaks). Between
the three piranhas, the greatest difference in the first derivate of the spectra can be seen in the 400–480 nm and
530–570 nm ranges. Between the three pacus, the first derivative of spectral signatures shows the greatest dif-
ference in the 400–460 nm and 530–610 nm ranges.
The hierarchical clustering of α (Figure S1) indicates that there are three clusters, each with piranha and pacu
samples. A broad range of taxonomic species are grouped together in each cluster. However, samples representing
Scientific Reports | (2021) 11:16157 | https://doi.org/10.1038/s41598-021-95713-0 3
Vol.:(0123456789)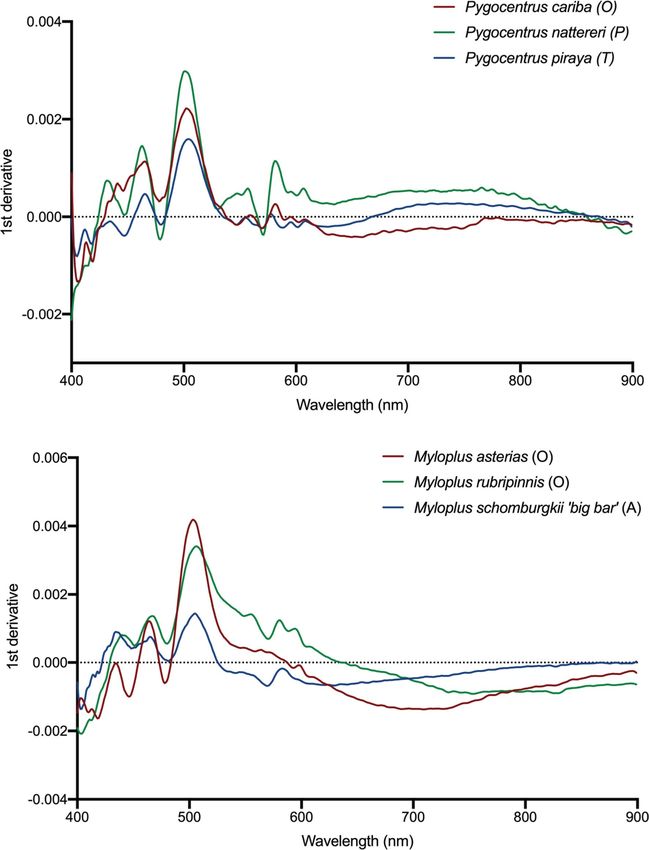
www.nature.com/scientificreports/

                                            Figure 2.  ASD Fieldspec 3 spectroradiometer with fish during measurement. Inset shows a typical spectral
                                            signature included in the analyses from 400 to 900 nm: the wavelength range collected by both models of
                                            spectroradiometers. The visible wavelengths are shown based on the ‘color’ they represent along with the
                                            near infrared region at longer wavelengths. Photograph shows a Pygocentrus nattereri being measured at the
                                            Laboratório de Ictiologia do IMASUL in Campo Grande, Brazil.

                                            the same taxonomic pacu species from different locations are in the same cluster except for Tometes ancylo-
                                            rhynchus (Xingu and Araguaia), which has notable color differences among basins and the juvenile specimen
                                            of Myloplus asterias (Araguaia) in cluster 1 is separated from the adult specimens from the Araguaia, Tapajos,
                                            Orinoco, and Xingu rivers all in cluster 2. However, the fidelity of clustering is more variable for piranhas. Adult
                                            and juvenile samples cluster together (S. elongatus, S. geryi, S. humeralis) but samples from different locations
                                            vary across clusters (e.g., S. rhombeus (P) is in cluster 3, S. rhombeus (A) is in cluster 1). For other piranhas (e.g.,
                                            S. altuvei) samples from different locations cluster together.
                                                The spectra of multiple individuals from the same sample (e.g., Metynnis maculatus (T)) are consistent in
                                            shape (Fig. 6). Amplitude variability can be seen between individual spectra but the overall shape within a species

          Scientific Reports |   (2021) 11:16157 |                https://doi.org/10.1038/s41598-021-95713-0                                                      4

Vol:.(1234567890)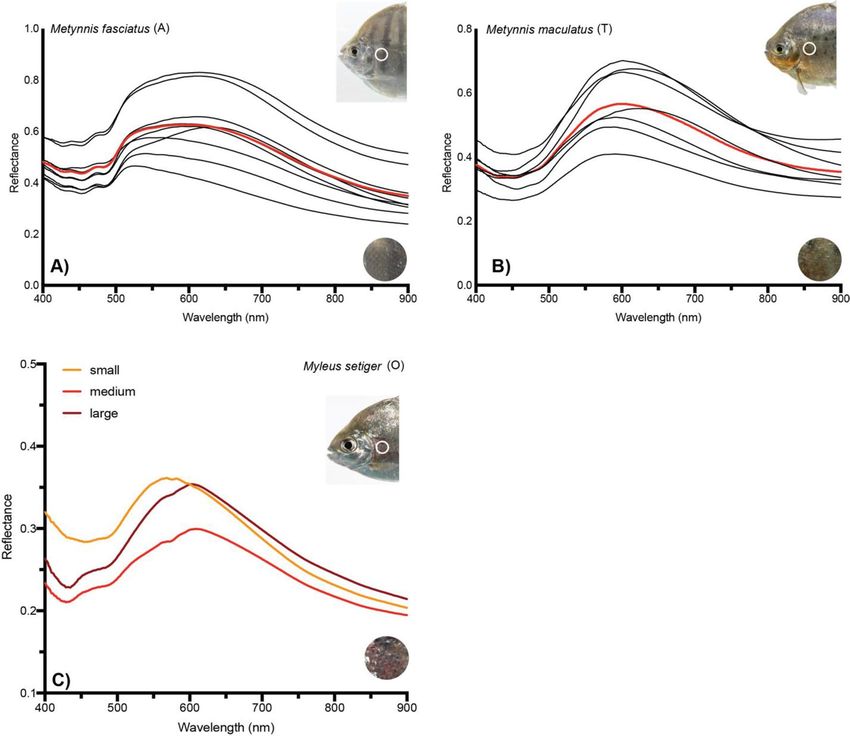
www.nature.com/scientificreports/
Figure 3. Comparative spectral signatures from four different body regions of a pacu (Myloplus schomburgkii)
(right) and a piranha (Serrasalmus geryi) (left). The four lines correspond to the spectral signatures from the
four different locations on the body where the measurements were made. The circular cut-outs illustrate a
close-up view of the portion of the fish contributing to each spectral signature. Visually there is a high degree of
similarity in the close-up view of the 0.79 cm2 (1 cm diameter) spot sizes of the same location between the pacu
and piranha (i.e., RGB color, texture, pattern), however, the spectral signatures between these two species are
different at each location measured on the body.
is more similar than among species (Fig. 7). This suggests that although spectral signatures are sensitive enough
to detect interspecific plasticity, the plasticity itself is not stochastic enough to preclude species identification.
The fishes with the weakest ACE match (M. setiger, M. rubripinnis, M. schomburgkii) are pacus (subfamily
Myleinae) that are some of the most phenotypically variable across broad geographic regions. In contrast, spe-
cies from the subfamily Serrasalminae (P. nattereri and M. luna) which are also phenotypically variable across
broad geographic regions are amongst the strongest ACE matches. For samples with multiple individuals, ACE
identified the correct known species (Fig. 7). The strength of the match varied from Serrasalmus altuvei (O) with
ACE = 0.4 to Myloplus rubripinnis (P) with ACE = 0.06 with all other non matches across samples at 0–0.001. For
one S. altuvei (P) individual, ACE returned a second lower potential match to Pygocentrus cariba (P) ACE = 0.13
(in contrast to the 0.3 for the correct match). Similarly, for one P. cariba (P) individual, ACE returned a second
lower potential match to S. altuvei (P) ACE = 0.13 (in contrast to the 0.28 for the correct match).
The four phenotypic varieties of the M. schomburgkii species complex (Figure S2) show variability in spec-
tra, indicating the importance of regional differences. The spectra suggest at least two cryptic species among
the specimens measured. The most similar spectra (α = 0.046) were found between M. schomburgkii ‘thin bar’
(X) and M. schomburgkii ‘wash bar’ (O). The most different spectra (α = 0.182) were between M. schomburgkii
‘big bar’ (A) and M. schomburgkii ‘big bar’ (O). Consistently, M. schomburgkii (O) had largest spectral angle in
comparison to the other three varieties indicating it is the most unique spectrum of the four. All individuals of
the four varieties were correctly matched to the correct label through ACE (Fig. 7).
General patterns of spectral separability between piranha and pacu lineages indicated an optimal 38 bands
(Figure S3) concentrated in the 400–450 nm range and 525–560 nm (Figure S3) reaching a nearest neighbor cri-
terion value of 0.85 (max = 1). In contrast, 58 bands were required for optimal differentiation between subfamily
classes concentrated in the 450–525 nm range. These ranges are like the regions highlighted by the first deriva-
tive analysis (Fig. 5) differentiating between the three piranha and pacus species. All four classification methods
indicated a similar accuracy for separating between piranha and pacu lineages with a best result of 81.3% (linear
discriminant). Overall, there was lower separability between subfamily classes with a maximum nearest neighbor
criterion value of 0.67 (Figure S3). The resultant classification accuracy of subfamily classes also decreased with
a best result of 68.8% (neural network). The optimal wavelengths separating subfamily classes are clustered in
the same wavelengths of sensitivity (λmax) in fish v ision33 from all five levels of chromacy (monochromacy–pen-
tachromacy) whereas λmax of cones for h uman34, otter35 and b ird36 color vision are more similar to the optimal
wavelength regions for differentiating between piranhas and pacus (Figure S4).
Gross scale morphology. We might suspect that differences in scale morphology might be driving overt
distinctions in spectral signature; if so, then we would expect scale morphology to vary or co-vary as substan-
tially among species and clades as spectral signature appears to do. So, we measured scale topology and mac-
rostructure, finding that five of our six selected species have smooth-edged cycloid scales (the exception being
Scientific Reports | (2021) 11:16157 | https://doi.org/10.1038/s41598-021-95713-0 5
Vol.:(0123456789)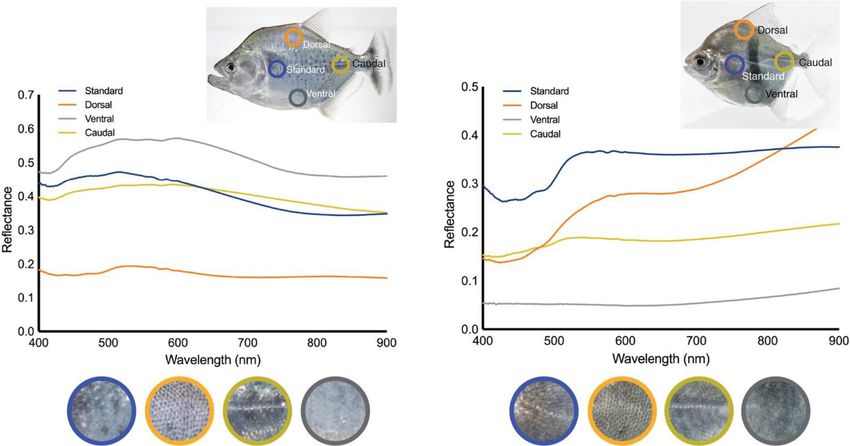
www.nature.com/scientificreports/

                                            Figure 4.  Comparative spectral signatures from three piranha (a–c) and three pacu (d–f) species. The circular
                                            cut-outs illustrate a close-up view of the portion of the fish contributing to each measurement. Differences
                                            among species’ spectral signatures can either be changes to the shape of the curve (wavelength) or shifts in the
                                            amplitude (brightness).

                                            Myloplus schomburgkii) with typical morphological features such as a curved posterior edge, a highly overlap-
                                            ping pattern, and concentric growth lines (circuli) that form ridges on the surface of each scale (Figure S5). The
                                            scales of these fishes are generally small (< 1 mm exposed length) and therefore create surfaces with low rough-

          Scientific Reports |   (2021) 11:16157 |               https://doi.org/10.1038/s41598-021-95713-0                                                    6

Vol:.(1234567890)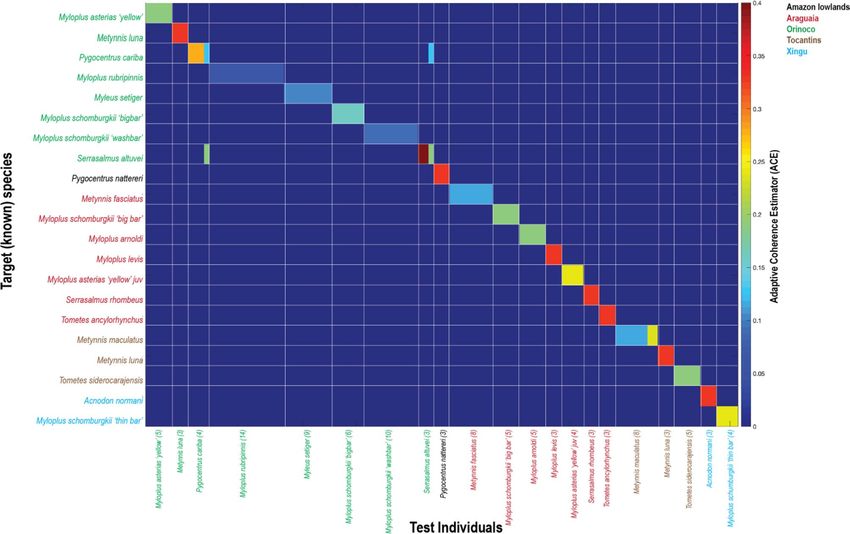
www.nature.com/scientificreports/

                                  Figure 5.  First derivative of the spectral signatures from three piranha (a–c) and three pacu (d–f) species
                                  shown in Fig. 4.

                                  ness (4–14 µm root-mean-square roughness). This low roughness accentuates the directional specular reflective
                                  properties of the fishes. Scales from each species have distinct shapes, but all within normal variation between
                                  species. Myloplus schomburgkii exhibits the largest difference, as it has scales with a weakly serrate posterior
                                  edge, and therefore we would classify these scales as weakly crenate. Myloplus schomburgkii also has a higher
                                  roughness than the other species (21–25 µm root-mean-square roughness), which is true even accounting for
                                  the larger size and (therefore) scales of the imaged specimens of this species. In short, although there are slight
                                  differences among species, the scales of these six taxa have typical cycloid and crenate scales.

Scientific Reports |   (2021) 11:16157 |               https://doi.org/10.1038/s41598-021-95713-0                                                     7

                                                                                                                                                 Vol.:(0123456789)
www.nature.com/scientificreports/
Figure 6. Intraspecific spectral signatures comparisons within select serrasalmid taxa. Variation within (a)
Metynnis fasciatus and (b) Metynnis maculatus. Each line represents the spectral signature of an individual.
Mean spectral signature is shown in red. (c) Ontogenetic change in spectral signature variation in Myleus setiger.
Inset photograph shows a ‘medium’ individual. The shift in peak spectral signature towards red wavelengths can
be seen from medium and large individuals. Circular close-up of the measurement area shows a red coloration
of the scales. This is absent in small individuals.
Phylogenetic signal. Finally, we might expect that spectral signature might vary predictably with phy-
logeny (evolutionary relationships among related species), i.e., that spectral signatures are more similar among
sister species, relative to another more distant relative. We trimmed a published molecular phylogeny (from
Thompson et al.29) to the 34 terminal taxa that we were able to measure spectral signature from (Figure S6).
Results for phylogenetic signal show no correlation between phylogeny and composite spectral signals as repre-
sented by our first two PC axes (PC1: K = 0.163, p = 0.375, λ < 0.0001, p = 1.0; PC2: K = 0.158, p = 0.467, λ < 0.0001,
p = 1.0). Estimates of lambda (λ) range between zero (no correlation between species) and 1.0 (some correlation
between species), relative to a Brownian Motion (random motion) expectation for trait evolution. Conversely,
K roughly approximates how trait variance is distributed along the phylogeny: if K > 1 then variance tends to
be among clades, while K < 1 suggests variance is within clades. There appears to be no phylogenetic signal to
spectral data for this group, suggesting perhaps that these values evolve in a random fashion, or according to
environmental factors we cannot yet identify.
Discussion
Consistent differences among species’ spectral signatures confirms that we can use hyperspectral data to dis-
criminate among different fish species, as demonstrated with pacus and piranhas as a proof-of-concept. Species
generally differed from one another in their spectral signatures in accordance with changes to either spectral
shape and/or amplitude. The application of this method to different aspects of biodiversity and natural history
research is considerable, as spectra can be used to: (1) rapidly assess lineage diversity along field transects, (2)
act as a ‘first-pass’ screening method for new species delimitation, and as (3) a potential means for assessing
species en masse, e.g., using remote sensing coupled with machine learning as a tool for better management of
ornamental fish exportation. Moreover, since the basis of a lineage’s spectral signature relates to phenotypic
Scientific Reports | (2021) 11:16157 | https://doi.org/10.1038/s41598-021-95713-0 8
Vol:.(1234567890)www.nature.com/scientificreports/
Figure 7. Adaptive Coherence Estimator (ACE) spectral signature ‘matching’. Taxa on the x axis indicate the
target, or ‘known’ species. Taxa on the y axis are the test individuals that are matched to the most similar ‘known’
species through ACE. The numbers in brackets indicate the number of individuals of a given species included in
the test set. Each specimen is matched individually. Higher values of ACE indicate a stronger match. Although
the strength of the ACE match can vary within species (e.g., Metynnis maculatus), a species’ ACE value is shown
to be more like its own species than even close relatives. The taxa with the lowest ACE matches are typically
those with the broadest geographical ranges (e.g., Myleus setiger, Myloplus rubripinnis, Myloplus schomburgkii
‘wash bar’ Orinoco from the M. schomburgkii species complex) and therefore the greatest potential for cryptic
lineages through low population connectivity.
aspects of scale morphology and pigmentation37–41, this method serves as rapid, morphology-based means of
assessing biodiversity like how DNA barcoding complements other molecular methods in phylogenetics, popula-
tion demography, and community ecology. With biodiversity losses at an all-time high, we believe that spectral
characterization of distinct lineages will aid traditional morphological taxonomy and molecular methods of
surveying biodiversity.
We also highlight differences in the spectra within lineages that may be of interest to taxonomists: Myloplus
schomburgkii, for example, appears to harbor several distinct lineages that equate with different rivers across their
large range. This correlates with observations on the ecological and phenotypic differences among populations
of M. schomburgkii, as well as documented differences in the population genetics of this species c omplex42. In
accordance with the findings of Machado et al.30, we document distinctive M. schomburgkii lineages from the
Xingu River and Araguaia Rivers, which are in turn distinctive from an Orinoco/Guiana Shield lineage. This
method’s ability to discriminate among juveniles and adults, as well as tease apart morphological patterns among
species complexes, will aid taxonomic descriptions and re-appraisals in addressing ontogenetic changes within
certain lineages, an issue that continues to plague morpho-taxonomy.
What defines the spectral signatures of a given species? It appears as if phylogenetic relatedness does not
overtly contribute to spectral signature variation as much as physiological or ecological differences in habitat
may; there are differing selective regimes acting on the visual ecology of fishes living in different microhabitats43
or in rivers with different water types: blackwater, whitewater, and clearwater (Figure S7). Convergence along
biologically relevant regions of the visual light curve in different species suggests a burgeoning area of research for
those interested in camouflage24,25, crypsis44, intra- and/or inter-specific signaling45,46. As such, we demonstrate
that although individuals are near identical at distinct size classes for example, we see changes to the spectra of
species as they navigate ontogeny (Fig. 6). It is difficult to distinguish among the sexes in many Neotropical fishes,
but it is quite possible, especially given seasonal dimorphism in fishes like p acus47, that spectral signatures can
be used to investigate visual evolution and signaling as they pertain to sexual selection in fishes.
We live in a time of biodiversity crisis, particularly when institutional funding for conservation and envi-
ronmental sustainability are limited. Lean times require prioritization of resources and before anything else, an
Scientific Reports | (2021) 11:16157 | https://doi.org/10.1038/s41598-021-95713-0 9
Vol.:(0123456789)www.nature.com/scientificreports/
accurate, comprehensive catalog of our living resources48. One of the concerns with DNA barcoding technologies
is that they can precipitate a scenario where biodiversity is quantified but never described (but see Packer et al.7).
Measurement of spectral signatures offers a rapid, intuitive method for quantifying phenotypic diversity in the
field or lab and furthers inclusivity, digitization, and coordination in natural history collections, and can help
morphological taxonomists delineate cryptic lineages49–52. In particular, the spectra do not serve as an alternative
to or discourage the collection of physical specimens, but instead should help clarify which specimens might be
the most unique48. Considering that not all taxonomic efforts take place immediately after field expeditions, but
in many cases, years or decades later when specimens are re-examined53; our next effort is to determine how the
preservation process alters the spectral signature of specimens. Therefore, we propose that reconciling histori-
cal museum collections with cutting-edge remote sensing efforts will streamline and expand the international
scientific community’s ability to assess biodiversity and prioritize taxonomic efforts along shorter timescales.
One of the benefits of other rapid diversity assessment tools like DNA barcoding and metabarcoding is the
efficiency of such methods in performing broad, community-level sampling. A common barrier to researchers
interested in applying new methods like ours, is cost. Portable spectroradiometers suitable for field conditions
range anywhere from $15,000–20,000; however, these devices incur a one-time cost without consumables. Stein
et al.54 estimated the cost of DNA barcoding methods relative to traditional taxonomic evaluations of field
diversity and found that both Sanger and next-gen sequencing platforms were one and a half to three times
as expensive as morphology-based taxonomy. As opposed to both traditional morphological approaches and
molecular methods, the spectral signature method allows for biodiversity assessment almost instantaneously in
the field. Field work requires additional funding burden on other methods of taxonomic c ataloging54, whereas
these costs are integrated into the operation of our spectral signature method.
We informally compared the start-up costs for DNA extraction and amplification equipment needed for
DNA barcoding (while considering that actual sequencing would be outsourced to dedicated sequencing facili-
ties). We suggest that the start-up costs for barcoding or our spectral signature method would be similar (mean
cost for barcoding estimated below as $17 k, while high quality, well characterized portable spectroradiometers
start at $15 k), albeit for molecular techniques, costs are spread out across individual machines, reagents, etc.,
whereas purchasing a spectroradiometer is a one-time expenditure. Stein et al.54 estimated the operating costs
for DNA barcoding (i.e., once a working lab is established), to be around $5 USD per sample or about $1500 for a
200-sample plate. These consumable costs are largely avoided with spectroradiometry. Another major difference
in cost/effort between Sanger sequencing and spectroradiometry is the possibility for PCR reactions to fail to
amplify or amplify the wrong loci or non-overlapping sections of the same loci. While this hurdle necessitates
some tweaking of primers and thermocycler routines, when a fish moves during the acquisition of its spectrum,
the 10 s procedure is simply repeated, whereas redoing PCR reactions requires several hours before results can
be visualized again and checked for quality. Like molecular barcoding results, early processing and analysis for
spectral data requires detailed training, but because the output from most spectroradiometers are standard ASCII
files which can be read with most analytical software (e.g., Excel, R, MATLAB, etc.), these methods are not any
more enigmatic (perhaps even less so), than the sort of training that goes into interpreting chromatograms,
aligning sequences, and running phylogenetic or phenetic analyses on molecular data. Hardware for acquisi-
tion of spectra has an initial start-up cost, but that is comparable to established morphological and molecular
taxonomic methods in the long term.
Moving forward, questions remain about spectra and their use for biodiversity research in ichthyology. For
example, what specific aspects of scale morphology and pigmentation, both microstructural and biochemical,
are shaping differences among species’ spectral signatures? Modern teleost scales are composite structures of
laminate sheets of cellular and acellular bone (predominantly the latter). The hydroxyapatite structure of these
scales can reflect and refract light given differences in thickness, density, and material composition. The interac-
tion of light moving through these bony layers with the underlying pigment (not to mention overlying mucus
ossibilities55,56. Surely the visual environment of different riverine habitats
coating of fishes), is rife with research p
promotes altering selective regimes on coloration through changes to pigment and scale phenotypes.
Methods
Spectral measurements. Measurements from live animals took place at a commercial facility (Below-
Water, Montreal, Quebec), on site in Brazil (Salobra river), at the Laboratório do Ictiologia de Altamira, Federal
University of Para in Altamira, Brazil and the Laboratório de Ictiologia do IMASUL in Campo Grande, Brazil.
Specimens measured in Brazil were collected under permit SISBIO 31089-2 and in Canada animals were han-
dled by staff from the commercial facility (BelowWater, Montreal, Quebec) and according to the guidelines and
regulations of McGill University (Montreal, Quebec, Canada), no separate animal care certificate was required.
We measured the spectral signatures of live fishes from 47 species (27 pacus, 20 piranhas) representing all 16
serrasalmid genera (Fig. 1, Table S1), originating from river systems in Brazil, Colombia, Peru, and Suriname.
Twelve of the species were obtained from multiple river systems and each was treated as a unique sample in our
analysis. Six of the species were available in two sizes (adult and subadult) which were also kept separate in the
analysis. In total, 79 unique samples were retained. Thirty-six of the unique samples were represented by multi-
ple individuals. For the other species it was not possible to obtain multiple individuals. A total of 176 fish were
measured, ranging from 2.0 to > 30 cm in standard length (SL). We purposely chose to use specimens from the
pet trade, for which we also had accurate locality collection data, as well as specimens measured on site in Brazil
in Pantanal and in the Xingu to demonstrate the utility of spectral signatures in discriminating among spe-
cies. Specimens were identified according to traditional meristics and m orphometrics57–59, and when possible,
through next-gen sequencing technologies60.
Scientific Reports | (2021) 11:16157 | https://doi.org/10.1038/s41598-021-95713-0 10
Vol:.(1234567890)www.nature.com/scientificreports/
The samples in Canada were measured with an Analytical Spectral Devices (ASD) Fieldspec 3 spectro-
radiometer (Malvern Panalytical, Boulder CO) (Fig. 2). This instrument measures reflected radiation in the
350–2500 nm range. It has a spectral resolution of 3 nm and a sampling interval of 1.4 nm in the visible and
near infrared regions (Vis–NIR) and a spectral resolution of 10 nm with a sampling interval of 2 nm in the
shortwave infrared (SWIR). The instrument is composed of three separate detectors, a 512-element silicon
photo-diode array for the Vis–NIR and two graded index, TE-cooled, extended range, InGaAs, photo-diode
detectors for the SWIR 1 (1000–1830 nm) and SWIR 2 (1830–2500 nm). The samples in Brazil were measured
with an ASD Handheld spectroradiometer (Malvern Panalytical, Boulder CO). It measures reflected radiation
in the 325–1075 nm wavelength range. The instrument has a spectral resolution of 3 nm and a sampling interval
of 1.6 nm. The single detector is a 512-element silicon photo-diode array. The field of view of the fiber optic
cables of both instruments is 25°.
A contact probe with a low intensity halogen light source was used for all samples (Fig. 2). The probe ensures
a constant illumination and viewing geometry with a 1 cm diameter spot size (sampling diameter). Fishes were
removed from the holding aquarium with a nylon mesh aquarium net, and then placed gently on a worktable,
while still in the net. All measurements were taken on the left side of the fish with the probe placed on the fish’s
flank directly posterior to the operculum (Fig. 2). The pectoral fin was moved out of the way so that the probe
was only illuminating scales. The probe was placed flat against the body of the fish and its lens was wiped clean
between fish, to reduce water droplets or fish slime. Each recorded sequence took 8–12 s to complete, resulting
in less than 30 s that each specimen was out of water, after which each specimen was returned to its aquarium.
Measurement of a standard location posterior to the operculum was chosen, because serrasalmids (and many
other fishes) are generally flat in this region and setting the front edge of the probe against the operculum makes
for a tactile cue to consistently measure the same location on multiple individuals. Due to the illumination and
viewing geometry of the probe, facing the fibers with the viewing angle towards the caudal fin mitigated detector
saturation from the directional specular reflectance properties of the scales61,62.
All measurements were made in relation to 99% reflective Spectralon panels which had been characterized
to a NIST traceable standard. The reflectance ratio acquired with both instruments were processed to estimated
absolute reflectance using the methodology described in detail by Elmer et al.63. The estimated absolute reflec-
tance is independent of illumination intensity or conditions and is recommended for comparisons of spectra even
if collected by different sensors, or with different reference panels63. The values of reflectance in the 400–900 nm
range common to both instruments were retained for analysis.
For the samples where multiple individuals were measured, a representative spectrum was chosen as the
individual spectrum with the smallest spectral angle (α) to the mean (Eq. 1)64,
�XY
α = cos−1 (1)
�(X)2 �(Y )2
where X is the mean spectrum across the 400–900 nm range and Y is an individual spectrum across the same
range. The spectra angle, α, is expressed in radians in n dimensions between the two signals (in this case n = 501).
Selecting a representative spectrum preserved spectral features inherent in the spectral variability that may have
been lost because of averaging65. This measure of similarity between two spectra is insensitive to differences in
the magnitude of b rightness64, which can be affected by the sliminess or moistness of the fish’s skin and scales.
Smaller spectral angles (α) indicate spectra that are more similar. The mean spectrum per sample was also
retained as a generalized spectral signature for samples with multiple individuals.
Spectral dissimilarity analyses. Due to high dimensionality of hyperspectral data, its greatest strength
is in applications where the spectral information (i.e., reflectance and absorbance) is more informative or reli-
able than the morphology of the object under s tudy66. However, due to the relatively small sample size (i.e., few
individuals) for many of the samples, conventional classification algorithms for grouping similar spectra (e.g.,
classifying species) are not applicable to this dataset. The number (n) of spectra per species/sample is too small
to estimate the statistical properties of the target class (i.e., species of serrasalmid) from the full set of spectra
acquired. Therefore, in examining the separability of the spectra between samples, we conducted our analyses
following the hyperspectral target detection literature for which our sample size is adequate.
First, the spectra of all 79 samples were analyzed according to an all-pairwise comparison of α between sam-
ples based on the representative spectrum. To visualize potential clusters of sample pairs with low α, indicating
spectral similarity, a hierarchical cluster analysis was performed using the centroid as the method for the distance
calculation. With the centroid, the distance between two clusters is the squared Euclidean distance between their
means, meaning this method is more robust to outliers than other hierarchical methods.
Next, for a subset of 21 samples from four river basins which had a minimum of three individual specimens
per sample, a spectral matching analysis was carried out using the Adaptive Coherence Estimator (ACE) (Eq. 2),
a standard benchmark hyperspectral detection a lgorithm67:
2
(ST �b−1 x)
ACE = (2)
(ST �b−1 S)(x T �b−1 x)
where S is the target (i.e., the known spectrum of a sample, in this case the mean), x is the spectrum of each
individual specimen under comparison and b is the covariance matrix of the background. T denotes a matrix
transposition. The background ( b ) was a subset of the entire spectral database of all individual specimens. For
each of the 21 samples under consideration a separate b was calculated omitting any spectra of that sample to
Scientific Reports | (2021) 11:16157 | https://doi.org/10.1038/s41598-021-95713-0 11
Vol.:(0123456789)www.nature.com/scientificreports/
prevent corrupting b67; for example, when examining the detectability of Metynnis luna (O), b was calculated
with all M. luna (O) spectra omitted from the database. ACE also considers spectral shape rather than amplitude
(i.e., brightness) and can be described as the cosine square of the angle between the test spectrum (x) and the
known target subspace (S)66. The ACE detector calculates the likelihood that a particular spectrum matches a
known sample (S) with higher values indicating a closer match.
Finally, to look for general patterns of spectral separability within serrasalmids, we determined an optimal
subset of bands to distinguish between piranha and pacu clades. We also examined the spectral separability of
samples that belong to different clades (subfamilies) based on Kolmann et al.60. The subfamily classes considered
were: (1) Colossomatinae which have a diet predominantly of plant material, seeds and fruits (frugivores); (2)
Myleinae which are a mix of granivores (plant material and seeds), and folivorous phytophages (leaves, flow-
ers, stems); (3) the Serrasalminae clade, including the genus Metynnis, which are either planktivores or feed on
both plankton and plant material; and 4) the piranha branch of Serrasalminae, which feed primarily on fish and
fish parts (scales, fins, mucus), including piscivores and several omnivores (plants and fish, e.g. Pristobrycon
striolatus). The optimal bands were determined through a forward feature selection (FFS) decreasing the total
501 dimensions (bands) to a smaller subset which maximizes separability between the classes of interest68.
Dimension reduction is important with hyperspectral data because there is redundancy in information across
all bands. It is also necessary to reduce the number of training samples for classification (i.e., Hughes phenom-
enon) to increase classification performance and decrease computational c omplexity68. The result of an FFS is
different from transformations such as Principal Component Analysis (PCA) because FFS selects components
(i.e., bands) from the full spectra and the original units and meaning of the data (i.e., reflectance) are retained.
By grouping the samples into broader categories (e.g., piranha vs pacu) and reducing the number of bands
through FFS we increased our samples size with respect to the dimensionality of the data and therefore could
apply standard classification algorithms to examine how well the broad categories could be differentiated from
the spectra. We trained a linear discriminant classifier, a quadratic classifier, a k-nearest neighbor classifier and
a feed-forward neural network classifier. For each of the two scenarios (piranha vs. pacu and subfamily class)
the classifiers were trained on a subset of 60% of the spectra with a reduced number of bands based on the FFS
and tested on the remaining 40%.
Morphological and phylogenetic correlates of spectral signatures: profilometry imaging and
comparative methods. What aspects of morphology and evolutionary history relate to the spectra meas-
ured from serrasalmid fishes? We used gel-based profilometry imaging (GelSight Inc., Waltham, MA, USA) to
describe serrasalmid scale shape from a variety of museum specimens. Generally, we assumed that if scale sur-
face texture varies broadly across taxa, this would be reflected in some consistent variability in spectral measures.
In brief, gel-based profilometry is a surface imaging technology that combines advantages of optical and contact
profilometry to visualize and measure surface t opography69. It has been previously used in biology to image and
measure the surface topography of organisms including other fi shes56, and it has shown utility in easily resolving
features less than 10 µm in height70,71 while imaging much larger fields-of-view on the order of 10–300 mm2.
During gel-based profilometry, the gel is pressed onto the specimen, and the painted side of the gel deforms to
match the surface topography of the subject. While the gel is pressed onto the surface of interest, six photographs
are taken using six different lighting angles, and these are used to produce a 3D topographical representation
of the s urface69. Additional processing of surface files (cropping, removing body curvature, calculating rough-
ness) is then done in MountainMaps v7.4.8425 (Digital Surf, Besançon, France). We imaged 27 individuals from
six species (n = 3–9 per species), all from specimens housed at the Harvard Museum of Comparative Zoology
(MCZ) (Table S2).
We were also interested in how much of the spectral variability could be explained by relatedness among ser-
rasalmid lineages. Phylogenetic signal is a measure of the statistical non-independence of related species, i.e., tests
of phylogenetic signal determine how much of the observed trait variation can be explained by relatedness among
species or groups of species. For the phylogenetic input used for testing phylogenetic signal, we trimmed a recent,
comprehensive phylogeny60 down to only those species for which spectral data was available and matched these
species’ spectra to appropriate tips in the tree. Briefly, this phylogeny is a molecular, time-calibrated chronogram,
meaning that many different gene loci were compared, using maximum likelihood methods, to determine the
relatedness of each species. The resulting cladogram has branch lengths, which are proportional to the number of
changes in nucleotide base pairs, scaled with respect to geological time. We used the reflectance from measured
fishes across the Vis–NIR light spectrum (400–900 nm) as our data subset for estimating phylogenetic signal.
We used a principal component analysis (PCA) to reduce the dimensionality of our dataset and retained only
the first two axes, indicated as the only significant axes by the broken-stick method, for subsequent analyses.
Finally, we used two different methods to estimate phylogenetic signal, Blomberg’s K and Pagel’s λ, and applied
these estimates to PC axes through the phylosig function (v. 2.0.6.4 geiger70).
Data availability
Phylogeny materials available here: https://www.biorxiv.org/content/10.1101/2020.03.02.973503v1. HSI data
will be archived and made available on Zenodo.
Received: 9 February 2021; Accepted: 13 July 2021
Scientific Reports | (2021) 11:16157 | https://doi.org/10.1038/s41598-021-95713-0 12
Vol:.(1234567890)www.nature.com/scientificreports/
References
1. McGill, B. J., Dornelas, M., Gotelli, N. J. & Magurran, A. E. Fifteen forms of biodiversity trend in the Anthropocene. Trends Ecol.
Evol. 30, 104–113. https://doi.org/10.1016/j.tree.2014.11.006 (2015).
2. Pounds, J. A. et al. Widespread amphibian extinctions from epidemic disease driven by global warming. Nature 439, 161–167.
https://doi.org/10.1038/nature04246 (2006).
3. Thomas, C. D., Franco, A. M. A. & Hill, J. K. Range retractions and extinction in the face of climate warming. Trends Ecol. Evol.
21, 415–416. https://doi.org/10.1016/j.tree.2006.05.012 (2006).
4. Young, H. S., McCauley, D. J., Galetti, M. & Dirzo, R. In Annual Review of Ecology, Evolution, and Systematics, Vol. 47 (ed Futuyma,
D. J.) 333–358 (Annual Reviews, 2016).
5. Drew, L. W. Are we losing the science of taxonomy?: As need grows, numbers and training are failing to keep up. Bioscience 61,
942–946. https://doi.org/10.1525/bio.2011.61.12.4 (2011).
6. Kim, K. C. & Byrne, L. B. Biodiversity loss and the taxonomic bottleneck: Emerging biodiversity science. Ecol. Res. 21, 794–810.
https://doi.org/10.1007/s11284-006-0035-7 (2006).
7. Packer, L., Grixti, J. C., Roughley, R. E. & Hanner, R. The status of taxonomy in Canada and the impact of DNA barcoding. Can.
J. Zool. 87, 1097–1110. https://doi.org/10.1139/z09-100 (2009).
8. Qin, H. W., Li, X., Liang, J., Peng, Y. G. & Zhang, C. S. DeepFish: Accurate underwater live fish recognition with a deep architecture.
Neurocomputing 187, 49–58. https://doi.org/10.1016/j.neucom.2015.10.122 (2016).
9. Tharwat, A., Hemedan, A. A., Hassanien, A. E. & Gabel, T. A biometric-based model for fish species classification. Fish. Res. 204,
324–336. https://doi.org/10.1016/j.fishres.2018.03.008 (2018).
10. Gates, D. M., Keegan, H. J., Schleter, J. C. & Weidner, V. R. Spectral properties of plants. Appl. Opt. 4, 11–000. https://doi.org/10.
1364/ao.4.000011 (1965).
11. Hutchison, V. H. & Larimer, J. L. Reflectivity of the integuments of some lizards from different habitats. Ecology 41, 199–209.
https://doi.org/10.2307/1931954 (1960).
12. Asner, G. P. & Martin, R. E. Spectranomics: Emerging science and conservation opportunities at the interface of biodiversity and
remote sensing. Glob. Ecol. Conserv. 8, 212–219. https://doi.org/10.1016/j.gecco.2016.09.010 (2016).
13. Baldeck, C. A. et al. Operational tree species mapping in a diverse tropical forest with airborne imaging spectroscopy. PLoS ONE
10, e0118403. https://doi.org/10.1371/journal.pone.0118403 (2015).
14. Jetz, W. et al. Monitoring plant functional diversity from space. Nat. Plants 2, 1–5. https://doi.org/1 0.1 038/n
plants.2016.24 (2016).
15. Leblanc, G., Francis, C. M., Soffer, R., Kalacska, M. & de Gea, J. Spectral reflectance of polar bear and other large arctic mammal
pelts; potential applications to remote sensing surveys. Remote Sens. 8, 273. https://doi.org/10.3390/rs8040273 (2016).
16. Dodd, C. K. Infrared reflectance in chameleons (Chamaeleonidae) from Kenya. Biotropica 13, 161–164. https://doi.org/10.2307/
2388120 (1981).
17. Pinto, F. et al. Non-invasive measurement of frog skin reflectivity in high spatial resolution using a dual hyperspectral approach.
PLoS ONE 8, e73234. https://doi.org/10.1371/journal.pone.0073234 (2013).
18. Schwalm, P., Starrett, P. & McDiarmid, R. Infrared reflectance in leaf-sitting neotropical frogs. Science 196, 1225–1226. https://
doi.org/10.1126/science.860137 (1977).
19. Mielewczik, M., Liebisch, F., Walter, A. & Greven, H. Near-infrared (NIR)-reflectance in insects–phenetic studies of 181 species.
Entomologie heute 24, 183–215 (2012).
20. Bajjouk, T. et al. Detection of changes in shallow coral reefs status: Towards a spatial approach using hyperspectral and multispectral
data. Ecol. Ind. 96, 174–191. https://doi.org/10.1016/j.ecolind.2018.08.052 (2019).
21. Chennu, A., Faber, P., De’ath, G., de Beer, D. & Fabricius, K. E. A diver-operated hyperspectral imaging and topographic surveying
system for automated mapping of benthic habitats. Sci. Rep. 7, 1–12. https://doi.org/10.1038/s41598-017-07337-y (2017).
22. Parsons, M., Bratanov, D., Gaston, K. J. & Gonzalez, F. UAVs, hyperspectral remote sensing, and machine learning revolutionizing
reef monitoring. Sensors 18, 2026. https://doi.org/10.3390/s18072026 (2018).
23. Dumke, I. et al. Underwater hyperspectral imaging as an in situ taxonomic tool for deep-sea megafauna. Sci. Rep. 8, 1–11. https://
doi.org/10.1038/s41598-018-31261-4 (2018).
24. Akkaynak, D., Siemann, L. A., Barbosa, A. & Mathger, L. M. Changeable camouflage: How well can flounder resemble the colour
and spatial scale of substrates in their natural habitats?. R. Soc. Open Sci. 4, 160824. https://doi.org/10.1098/rsos.160824 (2017).
25. Chiao, C. C., Wickiser, J. K., Allen, J. J., Genter, B. & Hanlon, R. T. Hyperspectral imaging of cuttlefish camouflage indicates good
color match in the eyes of fish predators. Proc. Natl. Acad. Sci. USA. 108, 9148–9153. https://doi.org/10.1073/pnas.1019090108
(2011).
26. Hebert, P. D. & Gregory, T. R. The promise of DNA barcoding for taxonomy. Syst. Biol. 54, 852–859 (2005).
27. Fricke, R., Eschmeyer, W. N. & Van de Laan, R. Eschmeyer’s Catalog of Fishes: Genera, Species, References. http://researcharchive.
calacademy.org/research/ichthyology/catalog/fishcatmain.asp (2019).
28. Orti, G., Sivasundar, A., Dietz, K. & Jégu, M. Phylogeny of the Serrasalmidae (Characiformes) based on mitochondrial DNA
sequences. Genet. Mol. Biol. 31, 343–351 (2008).
29. Thompson, A. W., Bentancur-R, R., López-Fernández, H. & Orti, G. A time-calibrated, multi-locus phylogeny of piranhas and
pacus (Characiformes: Serrasalmidae) and a comparison of species tree methods. Mol. Phylogenet. Evol. 81, 242–257 (2014).
30. Machado, V. N. et al. One thousand DNA barcodes of piranhas and pacus reveal geographic structure and unrecognised diversity
in the Amazon. Sci. Rep. 8, 1–12. https://doi.org/10.1038/s41598-018-26550-x (2018).
31. Winemiller, K. O. et al. Balancing hydropower and biodiversity in the Amazon, Congo, and Mekong. Science 351, 128–129. https://
doi.org/10.1126/science.aac7082 (2016).
32. Huie, J. M., Summers, A. P. & Kolmann, M. A. Body shape separates guilds of rheophilic herbivores (Myleinae: Serrasalmidae)
better than feeding morphology. Proc. Acad. Natl. Sci. Phila. 166, 1–15. https://doi.org/10.1635/053.166.0116 (2017).
33. Schweikert, L. E., Fitak, R. R., Caves, E. M., Sutton, T. T. & Johnsen, S. Spectral sensitivity in ray-finned fishes: Diversity, ecology
and shared descent. J. Exp. Biol. 221, jeb189761. https://doi.org/10.1242/jeb.189761 (2018).
34. Stockman, A. & Sharpe, L. T. Spectral sensitivities of the middle- and long-wavelength sensitive cones derived from measurements
in observers of known genotype. Vis. Res. 40, 1711–1737 (2000).
35. Peichl, L., Behrmann, G. & Kröger, R. H. H. For whales and seals the ocean is not blue: A visual pigment loss in marine mammals.
Eur. J. Neurosci. 13, 1520–1528 (2001).
36. Kelber, A. Bird colour vision—From cones to perception. Curr. Opin. Behav. Sci. 30, 34–40. https://doi.org/10.1016/j.cobeha.2019.
05.003 (2019).
37. Chikashige, T. & Iwasaka, M. Magnetically-assembled micro/mesopixels exhibiting light intensity enhancement in the (012) planes
of fish guanine crystals. AIP Adv. 8, 056704. https://doi.org/10.1063/1.5006135 (2018).
38. Churnside, J. H. & McGillivary, P. A. Optical-properties of several pacific fishes. Appl. Opt. 30, 2925–2927. https://d oi.o
rg/1 0.1 364/
ao.30.002925 (1991).
39. Funt, N., Palmer, B. A., Weiner, S. & Addadi, L. Koi fish-scale iridophore cells orient guanine crystals to maximize light reflection.
ChemPlusChem 82, 914–923. https://doi.org/10.1002/cplu.201700151 (2017).
40. Gur, D., Leshem, B., Oron, D., Weiner, S. & Addadi, L. The structural basis for enhanced silver reflectance in Koi fish scale and
skin. J. Am. Chem. Soc. 136, 17236–17242. https://doi.org/10.1021/ja509340c (2014).
Scientific Reports | (2021) 11:16157 | https://doi.org/10.1038/s41598-021-95713-0 13
Vol.:(0123456789)You can also read


