A spatial decision support system for enhancing resilience to floods: bridging resilience modelling and geovisualization techniques
←
→
Page content transcription
If your browser does not render page correctly, please read the page content below
Nat. Hazards Earth Syst. Sci., 20, 1049–1068, 2020
https://doi.org/10.5194/nhess-20-1049-2020
© Author(s) 2020. This work is distributed under
the Creative Commons Attribution 4.0 License.

A spatial decision support system for enhancing resilience to floods:
bridging resilience modelling and geovisualization techniques
Charlotte Heinzlef1 , Vincent Becue2 , and Damien Serre1
1 UMR    241 EIO, University of French Polynesia, B.P. 6570, 98702 Faa’a, Tahiti, French Polynesia
2 Faculty of Architecture and Urban Planning, University of Mons, Rue d’Havré 88, 7000, Mons, Belgium

Correspondence: Damien Serre (damien.serre@upf.pf)

Received: 13 September 2019 – Discussion started: 7 October 2019
Accepted: 15 March 2020 – Published: 21 April 2020

Abstract. In the context of climate change and increasing         2018). At present, the European Environment Agency ranks
urbanization, floods are considerably affecting urban areas.      France third among European countries affected by natural
The concept of urban resilience may be an interesting means       hazards over the period 1980–2017 (European Environment
of responding to urban flood issues. The objective of this        Agency, 2019), as 33 % of its municipalities were affected
research is to propose a spatial decision support tool based      with “an estimated annual cost of around 250 million euros”
on geovisualization techniques and a resilience assessment        (Lhomme, 2012). The Mediterranean region is among the
method. The goal is to localize the level of resilience mod-      most vulnerable in France, with an average of 10 deaths per
elled in different territories. The methodology proposed con-     year caused by floods; 42 % of the population of the Vaucluse
sists of integrating three resilience indicators applied to a     department lives in areas at risk from floods, and it ranks first
case study in Avignon (Provence-Alpes-Côte d’Azur region,         among departments exposed to flood risk in comparison to
France) and the use of geovisualization techniques: using         the national average of 11 % of the population living in flood
GIS for data processing and analysis, visualization, mapping,     risk areas in 2009. With 147/151 municipalities in the de-
and model processing. The methodology integrates decision-        partment affected by floods, Vaucluse is extremely vulnera-
making by identifying characteristics capable of improving        ble to this growing risk.
urban resilience and facilitating its understanding using a          To address this growing risk, the concept of resilience has
visual tool. The results demonstrate the usefulness of mod-       been included step by step into risk management strategies
elling resilience using geovisualization techniques to identify   worldwide, as it offers a systemic approach to and analysis
the potential for local resilience; integrate local stakehold-    of risks, their issues, territories, populations and management
ers into a process of clarifying the concept through the con-     services (Bakkensen et al., 2017). The concept of resilience
tribution of visualization; and consider easier access to this    can be defined as “the ability of a system, community or so-
concept based on data analysis, processing and visualization      ciety exposed to hazards to resist, absorb, accommodate to
through the design of maps.                                       and recover from the effects of a hazard” (UNISDR, 2009).
                                                                  Despite a significant increase in the use of the concept and
                                                                  its positive opportunities for risk strategies, concrete progress
                                                                  towards operationalization is still needed (Klein et al., 2003).
1     Introduction                                                The objective of this research is therefore to propose an ap-
                                                                  proach to address this lack of operationality. While some
1.1    Issues and background                                      studies have been carried out in Europe to operationalize the
                                                                  concept of vulnerability through indicators (Opach and Rød,
The context of climate change has led to an increase in dis-      2013), few of them mention resilience. When such is the case
asters, among which urban floods are considered the most          (Lhomme et al., 2013; Suárez et al., 2016), it is essentially
damaging, accounting for 43.4 % of climate-related disas-         from a technical and organizational angle, but without con-
ters over the period 1998–2017 (Wallemacq and House,

Published by Copernicus Publications on behalf of the European Geosciences Union.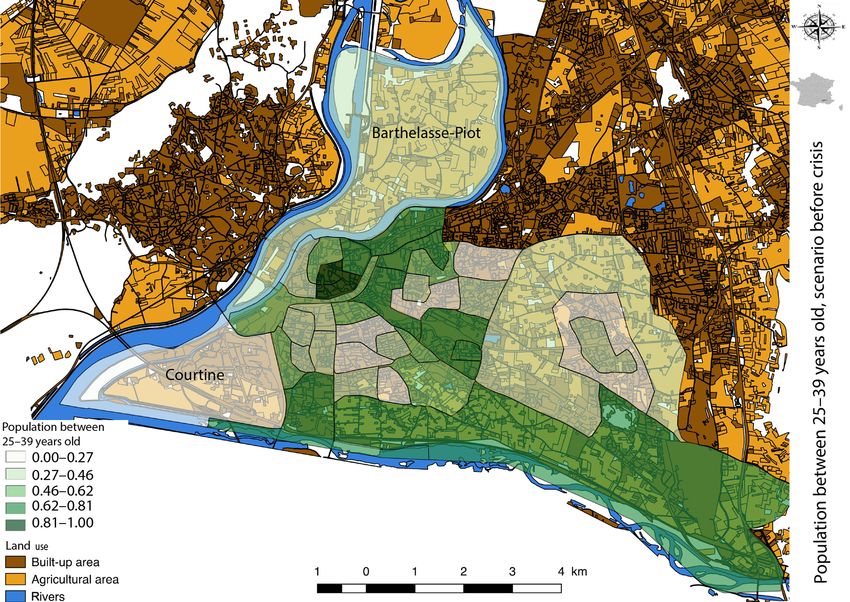
1050                                                                        C. Heinzlef et al.: A spatial decision support system

sidering the social and therefore systemic dimensions of the         promote stakeholder involvement and understanding of the
territory concerned.                                                 related issues and thus lead to adapted decision-making. The
   This research therefore aims at using the concept of re-          motivation of the article is to demonstrate that combining
silience in a practical and understandable manner at the city        certain geovisualization techniques with resilience modelling
level, with the design of a spatial decision support system.         will contribute to better understanding of the concept and
The originality of the methodology is justified by the collab-       lead to its operationalization and translation into tangible
orative approach taken, characterized by a socio-economic            strategies at the local level.
partnership with the city of Avignon and its urban services.            We defend the hypothesis that defining resilience crite-
By combining the experiences of managers and politicians             ria and translating them visually for implementation in an
with scientific advances, the approach aims at addressing the        easy-to-use tool will promote and better integrate resilience
challenges and limitations of the concept of urban resilience        techniques in view of managing urban floods. By carrying
in the face of flood risk. The result of joint design, the spatial   out a municipality-scale study and combining a collaborative
decision support system is being tested in the Avignon area          methodology and GIS resilience modelling to develop a geo-
in response to more risky situations. Spatial decision makes         visualization tool, we hope to clarify the concept and ensure
it possible to establish a link between scientific advances and      its understanding and adoption by urban planners in their ap-
local knowledge and practices. This spatial decision support         proaches to urban dynamics. In the first section we present
system involves redefining the criteria for resilience and mea-      a state of the art of resilience modelling and geovisualiza-
suring the potential for resilience (Frazier et al., 2013). It       tion techniques in the field of climate risk management and
aims at overcoming the following:                                    then the methodologies chosen for this research. Finally, we
                                                                     present the first application of this research and its results in
  – theoretical obstacles by designing indicators to assess          Avignon (France). Then, we discuss these initial results.
    resilience,

  – methodological issues by representing the potential for
    resilience through mapping tools used to provide stake-          2     Resilience modelling and geovisualization techniques
    holders with a medium capable of making them aware                     for risk management: a state of the art
    of the concept, integrate it into their risk management
                                                                     2.1    The resilience concept and modelling approaches
    strategies, and transform it into concrete and applicable
    actions.
                                                                     As the concept of resilience is multidisciplinary, its definition
Meeting the challenges of operationalizing resilience there-         and application as a risk management strategy are extremely
fore involves rethinking modelling and mapping practices as          complex. In order to move towards its operationalization, it
well as focusing on understanding the concept, adopting it           is necessary to build an analysis model to address the con-
and integrating stakeholders into the resilience process.            cept. Several studies have attempted to build analysis models
                                                                     to define indicators or a specific baseline (Bakkensen et al.,
1.2    Research focus                                                2017; Fox-Lent et al., 2015).
                                                                        The 100 Resilient Cities (100RC) consortium was
We adopt the viewpoint that promoting techniques to make             launched by the Rockefeller Foundation in 2013. The pur-
resilience operational can be achieved by collaboration and          pose of the 100 Resilient Cities consortium is to help cities
visualization methods. Getting people from different back-           around the world become more resilient to the physical, so-
grounds to interact (Callon et al., 2001) enriches discussions,      cial and economic challenges of the 21st century. 100RC sup-
encourages the expression of opposing viewpoints on the              ports the adoption and integration of a vision of resilience
same subject, and makes it possible to be both more mea-             that includes not only disasters – earthquakes, fires, floods,
sured and more incisive in a specific field. Resilience is there-    etc. – but also the tensions that weaken the urban area on a
fore a subject that requires the confrontation of views and          daily or cyclical basis. Resilience is defined as the ability of
scientific and local knowledge (Radhakrishnan et al., 2017).         individuals, communities, institutions, businesses and urban
We therefore propose developing strategies to operationalize         systems to survive, adapt and evolve, regardless of the types
resilience so that they are constructed jointly with the city’s      of chronic stresses or shocks they may encounter. A holistic
actors, allowing their direct investment. Rather than taking         approach is advocated. 100RC has built a framework defin-
a top-down approach, our goal is to create a common dis-             ing the characteristics of urban resilience (Fig. 1).
cussion around resilience issues to initiate constructive dia-          The definition of resilience via these indicators allows
logues to overcome the biases of each group of stakeholders          identifying criteria for resilience in a territory or within a
(Jacobs et al., 2005; Moser, 2005; Næss et al., 2006; Patt and       population. It allows launching discussion around an initially
Dessai, 2005). In addition, we consider that techniques trans-       fuzzy concept. However, it does not allow visualizing criteria
lating a fuzzy concept into a practical spatial decision support     or resilience potentials at the local level (100 Resilient Cities,
system – such as geovisualization and modelling – would              2015). Mapping is non-existent, and the absence of tangible

Nat. Hazards Earth Syst. Sci., 20, 1049–1068, 2020                            www.nat-hazards-earth-syst-sci.net/20/1049/2020/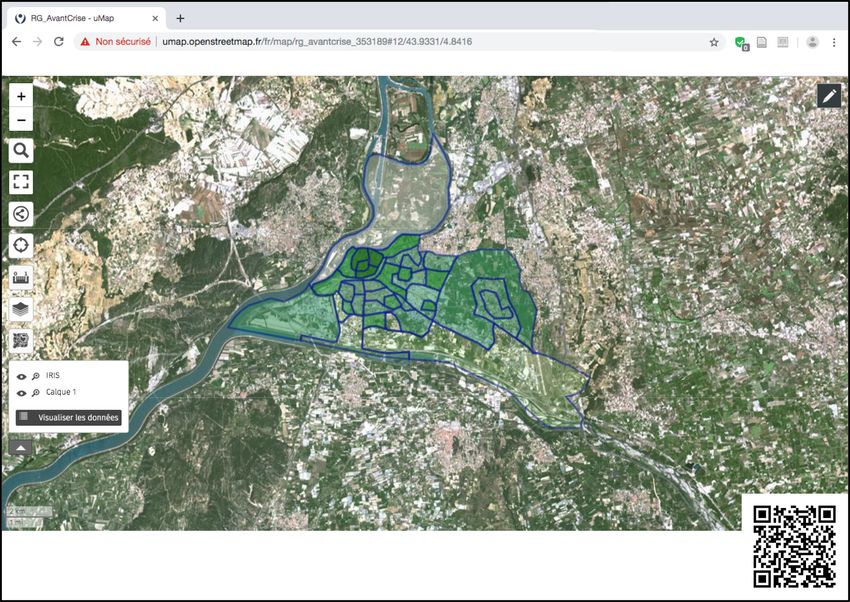
C. Heinzlef et al.: A spatial decision support system                                                                              1051

                                                                     Figure 3. Disaster resilience value in USA (Cutter et al., 2014).

                                                                        Absorption capacity represents the alternatives available to
                                                                     the network following a failure. The idea is to highlight solu-
                                                                     tions to maintain service continuity despite floods, operating
Figure 1. 100 Resilient Cities framework (taken from 100 Resilient   in degraded mode.
Cities, 2015).                                                          Finally, the recovery capacity represents the time required
                                                                     to retrofit the networks until reaching a full level of service.
                                                                        The DS3 model can be used to identify factors that would
                                                                     lead to increased urban resilience, highlighting the impor-
                                                                     tance of urban networks and critical infrastructures. This
                                                                     technical approach focuses mainly on urban networks. How-
                                                                     ever, cities comprise many factors, such as social dynamics,
                                                                     urban interactions and technical components, leading to ad-
                                                                     ditional indicators that must be monitored (Serre and Hein-
                                                                     zlef, 2018).
                                                                        A third study conducted by Cutter (Cutter et al., 2010)
                                                                     identified six indicators to measure resilience – social, eco-
                                                                     nomic, community, institutional, infrastructural and environ-
                                                                     mental. Each indicator is divided into sub-variables such as
                                                                     education, age, language proficiency, employment rate, im-
                                                                     migration rate, access to food, disaster training, social stabil-
Figure 2. DS3 Model (taken from Serre, 2016).                        ity, access to health, access to energy and so on. Each variable
                                                                     has a positive or negative effect on community resilience.
                                                                     Calculated using quantitative data, this method makes it pos-
data makes it difficult for local populations and actors to ap-      sible to quantify and map resilience at the national level and
propriate the concept, understand it and reproduce it.               more specifically at the county level in the United States.
   Another study focused on identifying resilience capacities        While this method greatly facilitates comparison across a
applied to urban networks. It led to the creation of the DS3         large number of variables, the disadvantage is that the fi-
(spatial decision support system) model (Serre, 2018). Three         nal score is not an absolute measure of community resilience
resilience capacities were defined to study resilience (Serre,       for a single location but rather a relative value against which
2018), namely resistance, absorption and recovery (Fig. 2).          multiple locations can be compared. For this reason, the pro-
   The resistance capacity is necessary to determine the ma-         posed work is done at the US scale (Fig. 3) and not at a finer
terial damage of the networks. It is a given that the more           scale or for a single year, not being a comparative work over
damaged a network is, the slower and more difficult it will          several years.
be to return it to effective service. The results of the damage         These three approaches attempt to address the biases of
analysis make it possible to measure this damage and deter-          conceptualization and modelling resilience. But, in the first
mine the interdependencies between the various components            approach of the concept and data visualization, there is noth-
of the networks.                                                     ing evident about how the results should be processed and ex-

www.nat-hazards-earth-syst-sci.net/20/1049/2020/                            Nat. Hazards Earth Syst. Sci., 20, 1049–1068, 2020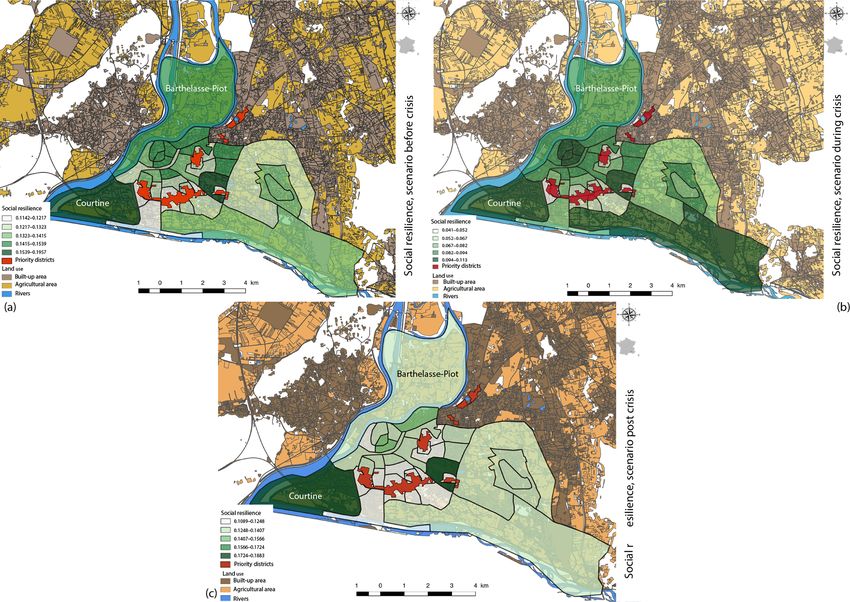
1052                                                                      C. Heinzlef et al.: A spatial decision support system

plored. In the second approach, the exploration of the results      is knowledge of the data, which varies from the domain of
is visible through the application of the methodology, notably      the known to the domain of the unknown (MacEachren and
in a case study on Hamburg (Serre et al., 2016). Nonetheless,       Kraak, 1997). The four uses of geovisualization can there-
the exploration and analysis of the data are not accessible         fore be placed inside a cube. Each axis of this cube (x, y, z)
to the public concerned, limiting their understanding and ap-       represents one of the three criteria previously mentioned (au-
propriation of the method. Moreover, this approach analyses         dience, interactivity, data relations).
the territory only through urban networks and not with the             This data representation (Donolo, 2014) – also called “vir-
other components that shape it. The third approach proposes         tual science” – allows constructing, reconstructing, repre-
a measurement and mapping of resilience, but the scale of           senting and interpreting scientific issues (Yasobant et al.,
analysis selected does not allow for decision-making by lo-         2015). The ability to represent spatiotemporal data in dif-
cal stakeholders.                                                   ferent forms provides better understanding of the different
   The objective of this work is therefore to model and op-         phenomena involved, resulting in either better dissemination
erationalize resilience as comprehensively and exhaustively         of the information or better decision-making. This method-
as possible. The aim is to analyse it at the local level in or-     ology allows exploring hypotheses, sharing arguments, de-
der to advise stakeholders and lead to decision-making that         veloping solutions and, most importantly, building common
integrates resilience strategies into risk management.              knowledge around the same issue (MacEachren, 1997).
                                                                       Consequently, these characteristics and advantages make
2.2    Geovisualization techniques: added values in risk            geovisualization an interesting methodology for studying
       management processes                                         risk management. Crisis management is, indeed, a concrete
                                                                    example of where it is useful to use visual, map-based tools
For many years, risk mapping was one of the main methods            to integrate, assess and apply multisource geospatial infor-
used to analyse, represent and examine the multiple charac-         mation and data (MacEachren et al., 2004). Indeed, in a con-
teristics of risks and risk management strategies (Barroca and      text of climate change and related uncertainties, modelling
Serre, 2018). However, new methods have been introduced,            or simulating disasters such as floods is becoming increas-
such as geographic information systems (GISs) and scien-            ingly complex. Current techniques are limited in the face of
tific information visualization (Kraak, 2003). A GIS gives          the complexity of floods, particularly because of the multiple
access to voluminous and heterogeneous tools like databases         reasons, sources and causes of disasters (Leskens et al., 2014;
and graphic applications to establish interactions between          Löwe et al., 2018), as they are essentially used to model
data and maps. These interactions can be visualized through         urban planning projects or response strategies to cope with
an interface used to explore the characteristics of data. The       the increase in the occurrence of such events. Many studies
adaptation of scientific visualization to mapping was ini-          have used geovisualization to analyse the complexity of flood
tially called “geographic visualization” and then “geovisu-         risks, whether to analyse flooding from the perspective of
alization” (Maceachren and Kraak, 1997). Geovisualization           risk, for instance expected damage (Meyer et al., 2009; Ward
is defined as “the set of visualization tools that allow interac-   et al., 2011); hazard, such as duration, velocity, water depth,
tive exploration of geolocated data in order to build knowl-        etc. (Schumann et al., 2009); and management strategy (de
edge without assumptions a priori” (Maceachren and Kraak,           Moel et al., 2015) at the national (Burby, 2001), regional
1997). Geovisualization includes fields such as scientific vi-      (Elmer et al., 2012; Gaslikova et al., 2011; Vorogushyn et al.,
sualization, mapping, image processing, knowledge extrac-           2012) and local (Aerts et al., 2013; Apel et al., 2009; Gerl
tion and GISs.                                                      et al., 2014) levels and even on the built scale (Fig. 4), with,
    Therefore, geovisualization is a synthesis approach ap-         for example, FReTs (flood resilience technologies; Schinke
plied to GIS techniques that integrates practices such              et al., 2016; Golz et al., 2015). Geovisualization techniques
as mapping, visualization, data and image analysis by               make it possible to aggregate different types of raw data (e.g.
analysing geospatial data (MacEachren and Kraak, 2001).             underground dynamics, urban structure, building vulnerabil-
This methodology offers the possibility of representing mul-        ity); transform them by joining these data (Fig. 4), calculat-
tidimensional, voluminous and heterogeneous data. More              ing the damage rate based on these raw data; and then pro-
specifically, geovisualization is mainly adapted to the rep-        duce a final result, translated into a dynamic, understandable
resentation and analysis of georeferenced data. The mapping         and accessible map.
exercise is divided into several objectives: explore, analyse,         To summarize, geovisualization helps in exploring data,
synthesize and present. Geovisual tools must be adapted to          using visual geospatial representations to imagine hypothe-
these different uses. The different tools currently available       ses, solve problems and co-construct scientific knowledge
can be differentiated by three criteria. The first is the audi-     (Kraak, 2003). Therefore, geovisualization methodology im-
ence, which can range from the “general public” with little         proves territorial knowledge and leads to tools such as de-
knowledge of geovisualization issues to experts with good           cision support systems by making possible dialogues be-
knowledge of the subject. The second is the degree of interac-      tween users and stakeholders and promoting collaborative
tivity offered by the geovisualization tool. The last criterion     approaches. In the field of risk management, it is essential

Nat. Hazards Earth Syst. Sci., 20, 1049–1068, 2020                          www.nat-hazards-earth-syst-sci.net/20/1049/2020/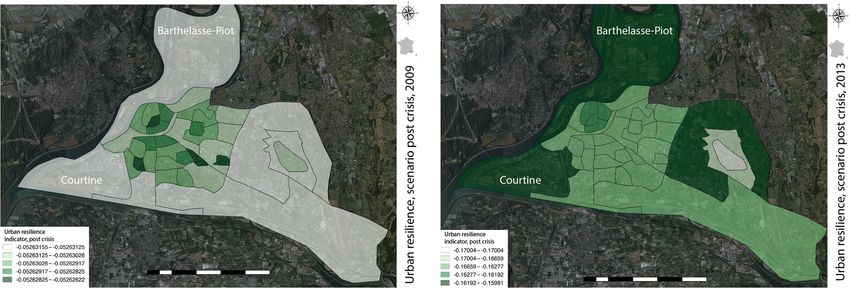
C. Heinzlef et al.: A spatial decision support system                                                                             1053

Figure 4. Links between resilience modelling and geovisualization techniques – at the building scale (Schinke et al., 2012).

to defuse subjects of tension in order to present a risky situa-         by defining social vulnerability as the sensitivity of a pop-
tion objectively.                                                        ulation to natural hazards and its ability to respond to and
                                                                         recover from them. Using several maps and in view of im-
2.3   Making urban resilience operational through                        proving emergency management, SoVI identifies which ar-
      geovisualization techniques                                        eas of the American territory are more or less vulnerable and
                                                                         why. Geovisualization techniques improve understanding of
Although several methods can be used to model risk charac-               the concept of vulnerability and help urban managers to lo-
teristics, such as hydraulic modelling (Ernst et al., 2010) and          calize vulnerable areas and variables.
geomorphological parameters (Bathrellos et al., 2012), it is                Based on SoVI, a Norwegian study examined the vulnera-
quite difficult to model such fuzzy concepts like resilience             bility of territories to climate change (Opach and Rød, 2013).
and vulnerability, despite the common use of the latter in               To avoid an increase in local and national vulnerability, the
risk management. While the implementation of resilience                  researchers built a ViewExposed tool (Fig. 5), whose objec-
policies and the design of resilient cities are desirable, as-           tive was to inform local authorities about the most vulnerable
sessing resilience and implementing it are complex. Several              areas of Norwegian territory and the causes of this vulnera-
researchers have examined the difficulty of defining, imple-             bility.
menting and evaluating urban resilience, usually through a                  The ViewExposed tool focuses on Norwegian municipal-
geovisualization approach.                                               ities’ exposure to natural hazards and the capacity of local
   Cutter and Finch (2008) presented SoVI (Social Vulner-                populations to resist them. This interface tool was designed
ability Index), a tool providing a county-level (USA scale)              for professionals, local elected officials and local residents.
comparative metric of social vulnerability to natural hazards            It is the result of collaboration between scientists and local
based on socioeconomic and demographic profiles. The aim                 experts via workshops. Although focused on the concept of
of SoVI is to illustrate the geographic patterns of the USA

www.nat-hazards-earth-syst-sci.net/20/1049/2020/                                Nat. Hazards Earth Syst. Sci., 20, 1049–1068, 2020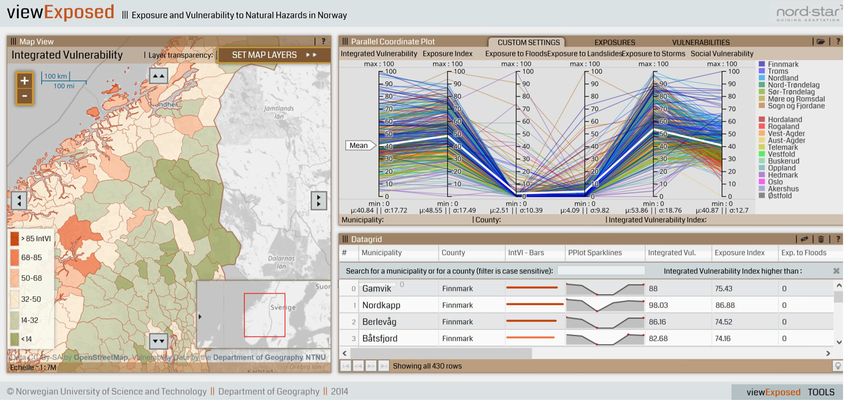
1054                                                                      C. Heinzlef et al.: A spatial decision support system

Figure 5. The ViewExposed interface (Opach and Rød, 2013).

vulnerability, this tool also integrates the response of local     nature of data and tools, and the non-integration of local ac-
managers and actors to natural disasters, corresponding to         tors and thus the assurance of their understanding of the tools
the first step in resilience integration.                          and concepts used. In addition, this research focuses on the
   Another team of researchers and insurers developed a tool       “vulnerability” prism of risk management. While we defend
to help people in the Nordic countries to protect themselves       the fact that these two concepts are linked and inseparable
and prepare for climate risks. The main target users are pri-      (Provitolo, 2012) in the apprehension of climate disruption
vate landowners, but this tool can also be used by land-use        (Heinzlef, 2019), the difficult definition of resilience and its
planners and property managers. The tool, VisAdapt (Johans-        operationalization is noteworthy. When vulnerability is de-
son et al., 2016), is intended as a guide on how to prepare for    fined as the propensity of a territory and a population to suf-
climate events liable to affect individual homes. It is very       fer damage, resilience focuses on the strategies and means to
simple to use, so every citizen can employ it. The obvious         prepare territories and populations for the increase in risks
interest of this tool is that it allows addressing local inhabi-   and their damage in order to limit the negative impacts. Re-
tants directly by proposing solutions to adapt to natural risks    silience is therefore more complex to quantify, operationalize
linked to climate change.                                          and visualize. Here, we intend to overcome these limitations
   These tools have the merit of proposing operational instru-     by proposing the approach we developed.
ments to obtain a clearer idea of the vulnerability concept in-
volved. The main scale is above all the national scale, which,
despite major advances in the visualization and knowledge of       3    Methods: linking resilience modelling and
vulnerable zones, does not always lead to decision-making               geovisualization techniques
by local actors and managers, since the scale is sometimes
too broad for action. Beyond the spatial scale, the choice of      The objective of this research consists of the following:
data and tools for processing, analysis and visualization has
not been designed for non-expert audiences. Data are not al-           – making the concept of resilience more understandable
ways freely accessible, nor are the processing and represen-             through the construction of three indicators to define
tation tools. Some tools are intended only for professionals,            and measure resilience,
while others point to the need to open the results to a wider
                                                                       – producing mapping results to quantify and visualize the
audience. In addition, the data are not accessible and down-
                                                                         results obtained,
loadable, which makes the methodology difficult to adopt
and reapply in other territories outside the scope of exper-           – designing a comprehensive method including choice of
tise of the research team. The limits are therefore divided              data, processing and analyses for local actors by mobi-
between the choice of spatial scale, the free and accessible             lizing geovisualization techniques,

Nat. Hazards Earth Syst. Sci., 20, 1049–1068, 2020                          www.nat-hazards-earth-syst-sci.net/20/1049/2020/
C. Heinzlef et al.: A spatial decision support system                                                                            1055

  – mapping the results to support decisions in favour of
    resilience to floods.

3.1   A framework for defining resilience data?

To analyse urban territories including their complexity
through the prism of resilience, it was necessary to define
their issues and challenges; their dynamics, material and
immaterial interactions; and their structures that impact the
functioning of urban space. It is essential to understand the
city as a system (Gardner, 2016). These urban systems, like
any living organism, are complex and hierarchical. Some
studies have explored the impact of rapid urbanization, lead-
ing to complex territorial responses and the lack of suitable
reactions. In parallel, challenges can increase when the coun-
try’s gross domestic product (GDP) decreases. Nevertheless,
in some case studies, urbanization has been shown to have
other results and is one of main elements to be taken into
account when building response capacity to risks (Garscha-
gen and Romero-Lankao, 2015). This response capacity can
be determined by flood preparedness (Chinh et al., 2016),
government implication and risk governance (Garschagen,            Figure 6. Resilience characteristics (Serre and Heinlef, 2018).
2015). Studying the city in the face of risks and its resilience
capacity requires considering different spatial scales of in-
teractions and challenges. Therefore, several questions must       3.2     Resilience processing
be asked to support the understanding of the concept of re-
silience and decision-making, including the following. Who         The advantages of using geovisualization techniques to re-
is vulnerable and/or resilient? What? When? What elements          move barriers to resilience are as follows:
could limit the impacts of a crisis like a flood event? Are they     – analysing heterogeneous and geolocated data,
efficient before, during and after a flood?
   These questions allowed us to establish three resilience in-      – supplying a visualization based on the most recent sci-
dicators to study technical, urban and social resilience (Hein-        entific advances,
zlef et al., 2019). The methodological choice of using indica-
tors was based on several arguments. The first one is that by        – extracting, producing and sharing data with innovative
defining and characterizing an abstract concept, indicators al-        layouts.
low sensitizing both the scientific community and the public
to complex subjects (Prior and Hagmann, 2014). In addition,           To address these three pillars, we propose clarifying some
resilience indicators can make an important contribution to        of the resilience criteria defined above (Fig. 6) around three
assessing a community’s needs and goals while helping it           resilience indicators: social, technical and urban.
to develop resilience strategies (Cutter, 2016). These indica-        We argue that analysis of resilience at the local level is fa-
tors, useful when creating a strategy, are also important for      cilitated by using open-access data. On the other hand, data
monitoring the decision-making process. Finally, an essen-         processing and analysis become more understandable for lo-
tial benefit of using such indicators is that they can act as      cal actors when tools are chosen that highlight the visualiza-
driving factors for risk management by including the con-          tion.
cept of resilience clearly and more holistically (Linkov et al.,
                                                                   3.2.1    Data used for resilience assessment
2014). The objective is to analyse the different social, urban
and technical components (Serre and Heinzlef, 2018) of the         We chose to use mainly open data which we acquired via the
area concerned (Table 1). The indicators were designed after       INSEE service of the French Ministry of the Economy and
adapting the Baseline Resilience Indicators for Communities        Finance (National Institute of Statistics and Economic Stud-
(BRIC) methodology (Cutter et al., 2008; Patil et al., 2008;       ies), whose function is to collect, analyse and disseminate
Singh-Peterson et al., 2014).                                      data. Since we wanted to analyse urban resilience at the com-
                                                                   munity scale as finely as possible, we chose to analyse the
                                                                   IRIS (Islets Grouped for Statistical Information) scale which
                                                                   constitutes the basic building block for the dissemination of
                                                                   infra-communal data.

www.nat-hazards-earth-syst-sci.net/20/1049/2020/                            Nat. Hazards Earth Syst. Sci., 20, 1049–1068, 2020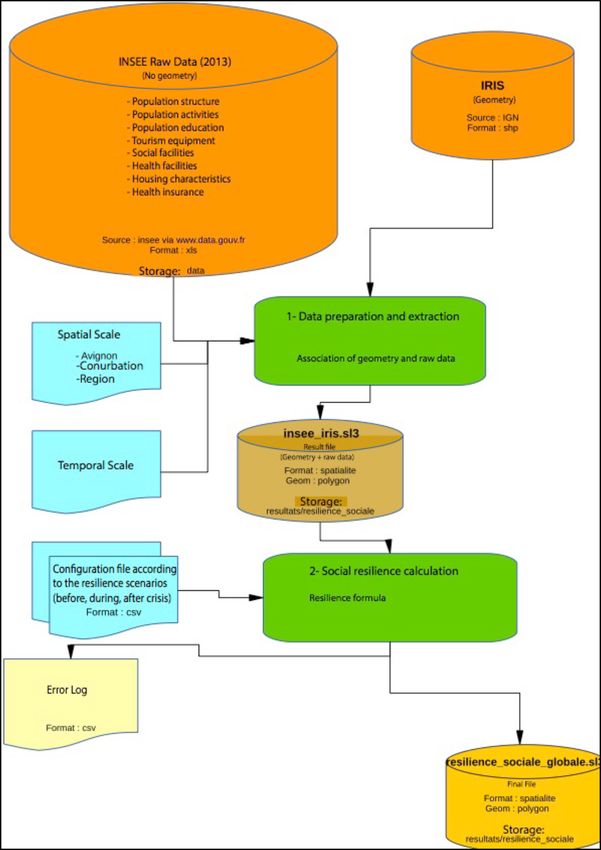
1056                                                                                       C. Heinzlef et al.: A spatial decision support system

Table 1. Example of data selection, sources and references.

    Resilience indicators         Variables                                     Sources      Impact on resilience   References
    Social resilience indicator
                                                                                   Population structure
                                  00–02 years old                               INSEE        Negative               (Morrow, 2008; Cutter et al., 2010;
                                                                                                                    Opach and Rod, 2016)
                                  25–39 years old                               INSEE        Positive               (Morrow, 2008; Cutter, 2010; Opach
                                                                                                                    and Rod, 2016)
                                  More than 80 years old                        INSEE        Negative               (Morrow, 2008; Cutter, 2010; Opach et
                                                                                                                    Rod, 2016)
                                                                                   Professional situation
                                  Active, 15–64 years old                       INSEE        Positive               (Tierney et al., 2001)
                                  Unemployed, 15–64 years old                   INSEE        Negative               (Tierney et al., 2001; Tierney, 2014)
                                                                                           Habits
                                  Active people 15 years or older, not using    INSEE        Positive
                                  transport
                                  Active people 15 years or older, using pub-   INSEE        Positive
                                  lic transport
                                                                                          Insurances
                                  Health insurance beneficiaries                INSEE        Positive               (H. John Heinz III Center for Sci-
                                                                                                                    ence Economics, and the Environment,
                                                                                                                    2002)
                                  Beneficiaries of CAF (family allowance        INSEE        Positive               (Heinz Center 2002)
                                  fund) allocations
                                                                                          Education
                                  Exit before the third grade                   INSEE        Negative               (Norris et al., 2008; Morrow, 2008)
                                  Baccalaureate +2 and better                   INSEE        Positive               (Norris et al. 2008; Morrow 2008)
    Urban resilience indicator
                                                                                          Buildings
                                  Number of main residences built before        INSEE        Positive               (Mileti, 1999; Cutter, 2010; Opach and
                                  1919                                                                              Rod, 2016)
                                  Number of main residences built from 1919     INSEE        Negative               (Mileti, 1999; Cutter, 2010; Opach and
                                  to 1945                                                                           Rod, 2016)
                                  Number of main residences built from 1946     INSEE        Negative               (Mileti, 1999; Cutter, 2010; Opach and
                                  to 1970                                                                           Rod, 2016)
                                  Number of main residences built from 1971     INSEE        Negative               (Mileti, 1999; Cutter, 2010; Opach and
                                  to 1990                                                                           Rod, 2016)
                                  Number of main residences built from 1991     INSEE        Negative               (Mileti, 1999; Cutter, 2010; Opach and
                                  to 2005                                                                           Rod, 2016)
                                  Number of main residences built from 2006     INSEE        Positive               (Mileti, 1999; Cutter, 2010; Opach and
                                  to 2010                                                                           Rod, 2016)
                                                                                  Critical infrastructures
                                  Defence                                       SIRENE       Positive               (Sylves, 2007; Cutter, 2010)
                                  Fire and rescue services                      SIRENE       Positive               (Sylves, 2007; Cutter, 2010)
                                  Hospital activities                           SIRENE       Positive               (Opach and Rod, 2016)
                                                                                   Economic dynamics
                                  Tourist and other short-term accommoda-       SIRENE       Positive               (Tierney, 2009)
                                  tion
                                  Creation of new companies                     SIRENE       Positive
                                  Removal of companies                          SIRENE       Negative

Nat. Hazards Earth Syst. Sci., 20, 1049–1068, 2020                                           www.nat-hazards-earth-syst-sci.net/20/1049/2020/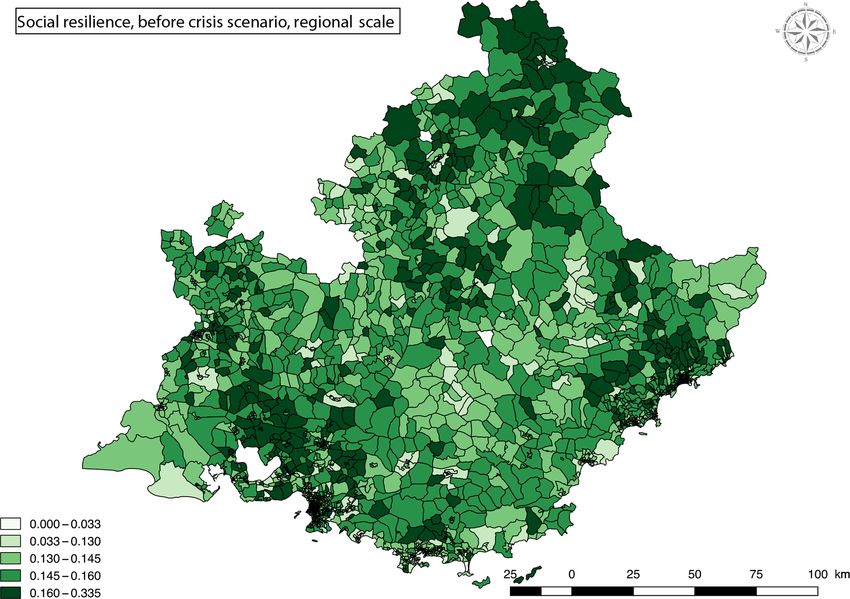
C. Heinzlef et al.: A spatial decision support system                                                                                          1057

Table 1. Continued.

 Resilience indicators            Variables                             Sources             Impact on resilience   References
 Technical resilience indicator
                                  Diversity of networks                 Municipality data   Positive               (Bambara, 2014; Balsells et al.,
                                                                                                                   2015)
                                                                             Network accessibility
                                  Accessibility of networks by public   Municipality data   Positive               (Cutter, 2010; Opach and Rod,
                                  road within a 100 m radius                                                       2016; Lhomme et al., 2013)

   The concept of “open” and accessible science has been                   and there is no practical experience (Fekete, 2009) on which
developed to strengthen dialogue and commitment among                      to determine weights that are mostly subjective. Besides,
scientists and the local population around common issues                   applying such weights does not necessarily reflect decision
and problems by creating a language and vocabulary under-                  makers’ and urban planners’ priorities and realities (Cutter
standable to everyone. While there are obvious limitations                 et al., 2010). Nonetheless, since this approach puts forward
to open data – security, privacy and property protection –                 a participatory and collaborative methodology, readjusting
it is nonetheless accepted that using ideas and knowledge                  the weight of these variables with regard to managers’ per-
freely is a universal right. This is why we chose to use a                 ceptions is entirely justified and in line with the current ap-
data source whose access, use and downloading are free: not                proach.
only to ensure the reproducibility (Jovanovic et al., 2018) of                Following this process, it was necessary to determine the
the methodology but also to participate in the education and               normalization. Normalization allows adjusting a series of
communication of the concept of resilience.                                values (typically representing a set of measurements) accord-
   In addition to the INSEE INSPIRE database, we used the                  ing to a transformation function to make them comparable
data from the SIRENE database (INSEE) in open source. The                  with certain specific reference points. We proceeded with
SIRENE database is an INSEE service used to identify all                   a min–max standardization (Casadio Tarabusi and Guarini,
the characteristics of companies and establishments. The in-               2013) to obtain a positive resilience impact variable (Eq. 4)
formation provided gives a precise idea of the company’s ac-               and a negative resilience impact variable (Eq. 5), where each
tivity, its date of creation, etc. These data were used for the            variable is decomposed into an identical range between zero
urban and technical resilience indicators to demonstrate eco-              (worst rank) and 1 (best rank), to create indicators with sim-
nomic, urban and technical dynamism.                                       ilar measurement scales, and to compare them:
   Data from the city cadastre (MAJIC) were also used to
                                                                             x − min(x)
complete the open-data database. These data are considered                                  ,                                                     (4)
sensitive and owned exclusively by municipalities. It is there-            max (x) − min(x)
fore essential to create a partnership with a city and its GIS                   x − min (x)
                                                                           1−                   .                                                 (5)
services.                                                                     max (x) − min (x)

3.2.2   Method and tools for resilience assessment                         The choice of processing tools was influenced by the
                                                                           availability of open-source tools in order to uphold trans-
After selecting the raw data, data were transformed and nor-               parency and collaborative approaches as well as the avail-
malized with a theoretical orientation. In order to understand             ability of such tools to all stakeholders. To create the
the frequency of each variable, each item of raw data has                  computer script, we used a tool, the Feature Manipula-
been transformed into percentages:                                         tion Engine (FME), to extract, transform and load raw data
                          Variable                                         (extraction–transformation–loading). Its interface allows vi-
Social Resilience =                    ,                   (1)             sualizing each step of the processing, from loading raw data
                      IRIS Population                                      (INSEE files) to choosing variables, while integrating the re-
                       Variable                                            silience formula to finally obtain the results. Although this
Urban resilience =                ,                        (2)
                     IRIS AREA                                             tool has a cost, it is nevertheless used by GIS practitioners at
                           Variable                                        a large scale, nationally and internationally.
Technical resilience =               .                     (3)
                         IRIS AREA                                            Several steps (Fig. 7) were necessary to set up the com-
Nevertheless the weighting is 1 for all the variables (Holand              puter script, integrate the input data, create a geometry, gen-
et al., 2011). This single weighting is explained by the will-             erate the processing and forecast an overall resilience value.
ingness to avoid disparities between the variables (Fekete,                The output data are in SpatiaLite format (sl3 format), which
2009), since some of them are sensitive and subjective. In-                is a spatial extension of SQLite and provides vector geo-
deed, we have no theoretical references (Esty et al., 2005),               database capacity. This format can be understood by many

www.nat-hazards-earth-syst-sci.net/20/1049/2020/                                   Nat. Hazards Earth Syst. Sci., 20, 1049–1068, 2020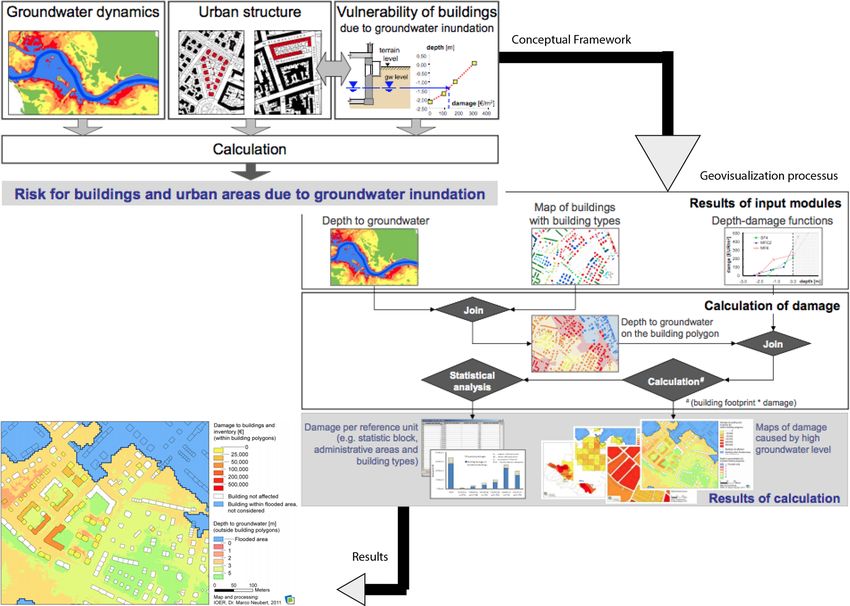
1058                                                                   C. Heinzlef et al.: A spatial decision support system

Figure 7. Details of the social resilience assessment process.

processing, visualization and mapping software applications,         The map is therefore a decision-making tool in the sense
including QGIS.                                                   that it represents and filters a mass of data and makes them
   Once the computer processing was completed, the visu-          accessible and comprehensible. But the production of a map
alization and analysis work was done via a GIS, namely the        cannot in itself be considered a spatial decision support sys-
QGIS software (Fig. 8). It allows the automatic spatialization    tem: its value first depends on the consistency and reliability
of data according to data variables or variables resulting from   of the information collected upstream, then on its structuring
relationships between objects and finally the use of graphical    and effective readability.
tools to visualize and differentiate data (sizes, colours, dis-
tances).

Nat. Hazards Earth Syst. Sci., 20, 1049–1068, 2020                       www.nat-hazards-earth-syst-sci.net/20/1049/2020/
C. Heinzlef et al.: A spatial decision support system 1059
Figure 8. QGIS interaction architecture for resilience assessment.
4 Testing the resilience model and geovisualization 4.2 Resilience to flood assessment in Avignon: a few
process in Avignon results
4.1 Avignon flood issues The city was divided into a local scale – IRIS scale – to visu-
alize which areas are resilient or not. The indicators – social
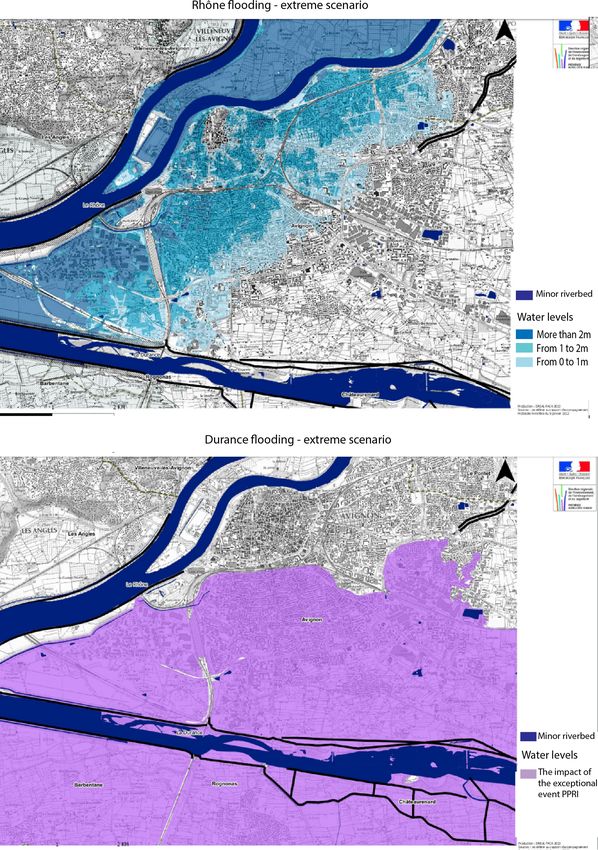
Avignon, the chief administrative centre of Vaucluse, is faced (Fig. 10), urban and technical – and each variable (Fig. 11)
with flood risk due to its proximity to the confluence of the included in the model can be visualized. Therefore, it is eas-
Rhône and Durance rivers (Fig. 9). The island of Barthelasse, ier to perceive which variables improve resilient capacities
the largest river island in Europe, is the area of Avignon most and which areas have developed these variables or not. As
affected by the Rhône’s floods. It serves as a buffer between each indicator is independent of each other, it is easier for
the city and the Rhône and serves to absorb floods. The few politicians and managers to work on variables with low lev-
existing dikes protect the island from low floods, but it is still els of resilience and identify areas to be redeveloped and/or
floodable, as shown by the 2 m floods in 1993, 1994, 2002 reintegrated into urban dynamics.
and 2003. The difference between the three maps in Fig. 10 is ex-
Therefore, a spatial decision support system that integrates plained by the different scenarios considered before, during
resilience into practice would be helpful for a flood-prone and after a crisis. Not every variable is included in every
community. It was developed in partnership with the Avi- scenario. For example, age variables are important before
gnon city council GIS department. This collaboration took (preparation, knowledge of risk, etc.), during (understanding
place at several levels, namely in the involvement of lo- of the situation, ability to move, etc.) and after the recon-
cal actors in the study, in the data exchange process and in struction process. On the contrary, whether or not individuals
the choice of processing tools, to ensure and improve the have a job does not play a role during the crisis but is decisive
reusability of the methodology once the study had been com- afterwards in order to rebuild and relaunch an activity.
pleted. The final choice of resilience variables, data process- Figure 11 shows the location of individuals aged 25 to 39
ing and their final visualization was made in constant collab- years, with a segment of the population potentially more re-
oration with the city’s technical services to ensure that data silient, before, during and after. Indeed, they can have a risk
and their analyses were shared and understood. culture beforehand, act and survive during, and restart an ac-
tivity after the disruptive event. They are more prevalent in
the city centre and in the south and south-east. This is mainly
due to the location of the two universities, in the city centre
www.nat-hazards-earth-syst-sci.net/20/1049/2020/ Nat. Hazards Earth Syst. Sci., 20, 1049–1068, 20201060 C. Heinzlef et al.: A spatial decision support system Figure 9. Extreme flood scenario in Avignon (Heinzlef et al., 2019), inspired by © DREAL PACA. and outside the city walls, which favours student accommo- attempt to reintegrate neighbourhoods at the margins of ter- dation and low-cost housing. ritorial functioning in order to work on the integration of ur- Table 2 presents the value of each variable according to the ban resilience in the face of daily territorial stresses and when pre-crisis scenario for the IRIS of Barthelasse and Courtine confronted by a more exceptional event such as a flood. (Table 2) after min–max standardization. These values illus- Regarding the urban resilience indicator, INSEE data are trate the representativeness of each variable in the territory available from 2009 to 2013, thus making it possible to per- and make it possible to understand the social and spatial dy- form a multi-date analysis over several years (Fig. 12) and namics at the IRIS scale for Barthelasse and Courtine. This gain understanding of urban evolutions and resilience trends. detailed analysis, carried out on a variable-by-variable ba- For instance, certain elements have evolved, such as the pro- sis, allows engaging in a discussion with local actors in an portion of tourist accommodation and surgical and hospital Nat. Hazards Earth Syst. Sci., 20, 1049–1068, 2020 www.nat-hazards-earth-syst-sci.net/20/1049/2020/
C. Heinzlef et al.: A spatial decision support system                                                                                         1061

Table 2. Variable values – scenario before crisis.

           Resilience indicators (IRIS)   Variables                                           Impact on resilience   Barthelasse   Courtine
           Social resilience indicator
                                                                                  Population structure
                                          00–02 years old                                     Negative                     0.08        0.28
                                          25–39 years old                                     Positive                     0.35        0.23
                                          More than 80 years old                              Negative                     0.67          1
                                                                                 Professional situation
                                          Active, 15–64 years old                             Positive                     0.69          1
                                          Unemployed, 15–64 years old                         Negative                     0.40        0.38
                                                                                         Habits
                                          Active people 15 years or older, not using trans-   Positive                     0.59          1
                                          port
                                          Active people 15 years or older, using public       Positive                     0.24       0.08
                                          transport
                                                                                       Insurances
                                          Health insurance beneficiaries                      Positive                     0.50        0.92
                                          Beneficiaries of CAF allocations                    Positive                     0.19        0.93
                                                                                       Education
                                          Exit before the third grade                         Negative                     0.89        0.02
                                          Baccalaureate +2 and better                         Positive                     0.55       Null
           Urban resilience indicator
                                                                                       Buildings
                                          Number of main residences built before 1919         Positive                     0.05          0
                                          Number of main residences built from 1919 to        Negative                     0.89       0.99
                                          1945
                                          Number of main residences built from 1946 to        Negative                     0.95          1
                                          1970
                                          Number of main residences built from 1971 to        Negative                     0.92       0.97
                                          1990
                                          Number of main residences built from 1991 to        Negative                     0.02       0.02
                                          2005
                                          Number of main residences built from 2006 to        Positive                     0.01       0.26
                                          2010
                                                                                Critical infrastructures
                                          Defence                                             Positive                     Null       Null
                                          Fire and rescue services                            Positive                     0.12        0.34
                                          Hospital activities                                 Positive                        0        0.75
                                                                                  Economic dynamics
                                          Tourist and other short-term accommodation          Positive                     0.43        0.51
                                          Creation of new companies                           Positive                     0.05        0.29
                                          Removal of companies                                Negative                     0.93        0.64

www.nat-hazards-earth-syst-sci.net/20/1049/2020/                                        Nat. Hazards Earth Syst. Sci., 20, 1049–1068, 2020
1062 C. Heinzlef et al.: A spatial decision support system
Figure 10. Social resilience indicator – multi-scenario, Avignon scale (IRIS-scale analysis). Panel (a) identifies the most resilient areas
(greener) according to the social resilience characteristics before a crisis, panel (b) identifies the most resilient areas according to the social
characteristics during a crisis and panel (c) identifies the most resilient areas according to the social characteristics after a crisis – © Open
Database License, “ODbL” 1.0.
Table 2. Continued.
Resilience indicators (IRIS) Variables Impact on resilience Barthelasse Courtine
Technical resilience indicator
Diversity of networks Positive 0 0.85
Network accessibility Positive
Accessibility of networks by public 0 0.17
road within a 100 m radius
activities, thereby increasing resilience capacities. Moreover, fr/fr/map/rg_avantcrise_353189#12/43.9311/4.8914, last ac-
the advantage of using open data allows temporal as well as cess: 9 April 2020) and a QR code (Fig. 13).
spatial scales to evolve, and the indicators can therefore be Concerning the contribution of geovisualization used to
tested on other municipalities on the national territory. promoter dialogue on the issue of territorial resilience, work-
After reflection on the visibility of the results, informa- shops were organized to develop interaction around the maps
tion sharing, and a neutral and collaborative approach, we produced and the database provided and accessible to stake-
are considering making our work accessible to inhabitants holders. These workshops provided an opportunity for sci-
by developing a website to continue the risk communica- entific experts and critical infrastructure managers as well as
tion process on flood risks and strengthen the geovisual- decision makers in risk management strategies to exchange
ization process. This website, which is currently subject to views in order to support the reflection process and foster
reflection, was developed with the creation of interactive long-term collaboration. These maps and this new database
maps accessible via a weblink (http://umap.openstreetmap. allowed the actors to extract new knowledge from the deci-
Nat. Hazards Earth Syst. Sci., 20, 1049–1068, 2020 www.nat-hazards-earth-syst-sci.net/20/1049/2020/C. Heinzlef et al.: A spatial decision support system 1063
Following theoretical modelling and visual, cartographic
and geovisualized production work, further development in-
cluded the organization of workshops to question users on
their understanding and use of the tool and the results (Hein-
zlef, 2019). These workshops took place with critical infras-
tructure managers and made it possible to (re)launch the de-
bate around the issue of resilience and thus to build knowl-
edge without a hypothesis a priori (Maceachren and Kraak,
1997) around a tool for visualizing a concept that is diffi-
cult to put into practice. This methodology made it possi-
ble to launch a longer-term reflection with local actors to re-
flect on a resilience strategy and integrate the concept into
risk management. In particular, the results made it possible
to consider a strategy for managing the risk of flooding in the
Rhône.
Figure 11. Population between 25- and 39-year-old-scenario before This modelling and cartographic production work based
crisis, at the Avignon scale (IRIS-scale analysis). The map identifies on geovisualization has made it possible to rethink the is-
the value of the population variable 25–39 years old according to the sue of urban resilience. The mapping results led to work-
total IRIS population before a crisis – © Open Database License, shops to review and compare the methodology with the re-
“ODbL” 1.0. ality of the territory and risk management practices. This
work is part of a broader dynamic and reflection on the ques-
tion of operationalizing resilience. Based on the results of
sion support tool, especially theoretical knowledge provided
this decision-making tool designed to operationalize urban
by the maps and consistent with the database. This knowl-
resilience, a more global project is now under construction.
edge is both current and part of a long-term construction,
It is thus planned to use these results to build an urban re-
since the data evolve as a function of INSEE production.
silience observatory that will be tested on the island territo-
ries of French Polynesia. This will provide an opportunity to
5 Discussion merge representations of risks, territories and techniques for
data processing, production and analysis, visualization, and
This research is at the crossroads of resilience modelling collaboration with local actors.
and geovisualization practices based on visualization, data
processing, mapping and also the decision support process.
Rather than focusing on technological developments, this 6 Conclusion
work attempted to reflect on the accessibility of the method-
ology and its appropriation by local stakeholders. The results This article proposed a methodology intended to clarify the
are expressed through maps illustrating the potential for so- concept of resilience in the context of increasing urban flood-
cial, urban and technical resilience at the community level. It ing. This methodology is divided into two stages. First, we
therefore takes into account a large number of dimensions in modelled and analysed the concept of resilience through the
making the concept of resilience operational. formulation of three definitions and measurement indicators
Several improvements are already being considered to in order to approach resilience in an exhaustive way on the
overcome the limitations of this work. Concerning the ques- basis of social, technical and urban criteria. Secondly, we
tion of tools, willingness to switch entirely to free tools led to used geovisualization techniques (mapping practices, visu-
reflection on abandoning the FME tool. The project to build alization, data processing and analysis, map processing) to
a QGIS plug-in is under study in view of increasing acces- build a spatial decision support system accessible and under-
sibility. The advantage of the plug-in would be to make the standable to local stakeholders in the Avignon community.
computer script behind the methodology completely free, ac- This spatial decision support system sought to provide a sim-
cessible and downloadable. ple and accessible methodology to quickly verify and anal-
Another improvement to consider would be testing the ap- yse information for decision-making. The aim is to use the
proach in other territories, either by developing a partnership principles of visualization of geovisualization to widely dis-
of the same scope or by switching the entire process to open seminate map results in order to improve resilience culture.
data. At present, this analysis can be performed at the scale of The contributions and innovations of this work are therefore
the Provence-Alpes-Côte d’Azur region (Fig. 14) and at the of several kinds:
scale of France, but only for the social resilience indicator.
– the design of a spatial decision support system with and
for local actors,
www.nat-hazards-earth-syst-sci.net/20/1049/2020/ Nat. Hazards Earth Syst. Sci., 20, 1049–1068, 20201064 C. Heinzlef et al.: A spatial decision support system
Figure 12. Comparative analysis between 2009 and 2013 for the urban indicator, post-crisis scenario, at the Avignon scale (IRIS-scale
analysis). The map on the left identifies the most resilient areas according to the urban characteristics after a crisis in 2009; the map on the
right identifies the most resilient areas according to the urban characteristics after a crisis in 2013 – © Open Database License, “ODbL” 1.0.
Figure 13. Weblink global resilience – pre-crisis scenario map – QR code – © UMAP-Open Database License, “ODbL” 1.0.
– the design of a resilience model, – the implementation of dialogue between local experts
and actors through visual and understandable carto-
– the use of open-access data to enhance INSEE data and graphic production.
match the knowledge of local actors,
The advances achieved have made it possible to map re-
– the use of tools to highlight the visualization of data pro- silience at the local level and to ensure that local actors are
cessing, namely FME and QGIS, understood and that the methodology is accessible to non-
experts and reproducible. The method therefore focuses on
– the use of free and easy-to-use tools to perform ad- the accessibility promoted by geovisualization techniques
vanced mapping processing, rather than on technicality.
Nat. Hazards Earth Syst. Sci., 20, 1049–1068, 2020 www.nat-hazards-earth-syst-sci.net/20/1049/2020/C. Heinzlef et al.: A spatial decision support system 1065
Special issue statement. This article is part of the special issue “Re-
silience to risks in built environments”. It is a result of the EGU
General Assembly 2019, Vienna, Austria, 7–12 April 2019.
Financial support. This research has been supported by the region
Provence-Alpes-Côte d’Azur (grant no. 2016_11877). This project
has received financial support from the CNRS through the MITI
interdisciplinary programs and from the IRD.
Review statement. This paper was edited by Bruno Barroca and re-
viewed by two anonymous referees.
References
Figure 14. Social resilience, pre-crisis scenario, Provence-Alpes-
Côte d’Azur regional scale – © Open Database License, “ODbL” 100 Resilient Cities: The City Resilience Framework, avail-
1.0. able at: https://www.100resilientcities.org/resources/ (last ac-
cess: 1 February 2020), 2015.
Aerts, J. C. J. H., Lin, N., Botzen, W., Emanuel, K., and de Moel,
While some limitations have been observed – in particular H.: Low-Probability Flood Risk Modeling for New York City:
regarding the non-exhaustiveness of open-access tools, the Low-Probability Flood Risk Modeling for New York City, Risk
need to include local actors from the outset and changes of Anal., 33, 772–788, https://doi.org/10.1111/risa.12008, 2013.
scale – many perspectives are already being considered for Apel, H., Aronica, G. T., Kreibich, H., and Thieken, A. H.: Flood
risk analyses – how detailed do we need to be?, Nat. Hazards, 49,
the future. The first step has been taken to switch all the tools
79–98, https://doi.org/10.1007/s11069-008-9277-8, 2009.
to open access via the development of a QGIS plug-in. In Bakkensen, L. A., Fox-Lent, C., Read, L. K., and Linkov, I.: Validat-
addition to the response to the tools, this plug-in will also in- ing Resilienceand Vulnerability Indices in the Context of Natural
tegrate the reflections of different actors in order to develop Disasters: Validating Resilience and Vulnerability Indices, Risk
the tool using the feedback expressed. Regarding the issue of Anal., 37, 982–1004, https://doi.org/10.1111/risa.12677, 2017.
scale, the need to go beyond the national framework was ex- Barroca, B. and Serre, D.: Risks revealed by cartography – cartog-
pressed through reflection on the use of OpenStreetMap data. raphy renewed by the geovisualization of risks, Int. J. Cartogr.,
Finally, regarding the form of this spatial decision-making 4, 1–3, https://doi.org/10.1080/23729333.2018.1444376, 2018.
tool itself, work is in progress to develop it by setting up Bathrellos, G. D., Gaki-Papanastassiou, K., Skilodimou, H. D.,
a resilience observatory for the island territories of French Papanastassiou, D., and Chousianitis, K. G.: Potential suitabil-
Polynesia. Studies and analyses are being carried out to this ity for urban planning and industry development using natural
hazard maps and geological–geomorphological parameters, En-
end.
viron. Earth Sci., 66, 537–548, https://doi.org/10.1007/s12665-
011-1263-x, 2012.
Balsells, M., Barroca, B., Becue, V., and Serre, D.:
Data availability. The data can be accessed directly on the INSEE Making urban flood resilience more operational: cur-
site (https://www.insee.fr/fr/statistiques; INSEE, 2019) for the so- rent practice, P. I. Civil. Eng.-Wat. M., 168, 57–65,
cial resilience indicator and the INSEE SIRENE site (http://sirene. https://doi.org/10.1680/wama.14.00051, 2015.
fr/sirene/public/accueil; ssirene.fr, 2019) for the urban resilience in- Bambara, G., Peyras, L., Felix, H., and Serre, D.: Developing a
dicator. Concerning the technical resilience indicator, these are sen- functional model for cities impacted by a natural hazard: applica-
sitive data, held only by the GIS department of the local authorities. tion to a city affected by flooding, Nat. Hazards Earth Syst. Sci.,
15, 603–615, https://doi.org/10.5194/nhess-15-603-2015, 2015.
Burby, R.: Flood insurance and floodplain management:
Author contributions. CH was responsible for conceptualization, the US experience, Global Environ. Chang., 3, 111–122,
methodology, investigation, writing the original draft, reviewing https://doi.org/10.1016/S1464-2867(02)00003-7, 2001.
and editing the writing, and visualization. VB was responsible for Callon, M., Lascoumes, P., and Barthe, Y.: Agir dans un monde
project administration and supervision. DS was responsible for su- incertain: essai sur la démocratie technique, La couleur des idées,
pervision, project administration, funding acquisition, and review- Editions du Seuil, Paris, 2001.
ing and editing the writing. Casadio Tarabusi, E. and Guarini, G.: An Unbalance Adjustment
Method for Development Indicators, Soc. Indic. Res., 112, 19–
45, https://doi.org/10.1007/s11205-012-0070-4, 2013.
Competing interests. The authors declare that they have no conflict Chinh, D. T., Bubeck, P., Dung, N. V., and Kreibich, H.: The 2011
of interest. flood event in the Mekong Delta: preparedness, response, dam-
www.nat-hazards-earth-syst-sci.net/20/1049/2020/ Nat. Hazards Earth Syst. Sci., 20, 1049–1068, 2020You can also read