Quaternary morphotectonic mapping of the Wadi Araba and implications for the tectonic activity of the southern Dead Sea fault
←
→
Page content transcription
If your browser does not render page correctly, please read the page content below
TECTONICS, VOL. 31, TC5003, doi:10.1029/2012TC003112, 2012

Quaternary morphotectonic mapping of the Wadi Araba
and implications for the tectonic activity of the southern
Dead Sea fault
Maryline Le Béon,1,2,3 Yann Klinger,1 Anne-Sophie Mériaux,4 Mahmoud Al-Qaryouti,5
Robert C. Finkel,6,7 Omar Mayyas,5 and Paul Tapponnier1,8
Received 25 February 2012; revised 28 June 2012; accepted 15 August 2012; published 5 October 2012.
[1] The Dead Sea strike-slip fault accommodates the northward motion of Arabia
relative to Sinai at a rate of 5 mm/yr. The southern segment of the fault, the Wadi
Araba fault, runs along a valley blanketed in Quaternary sediments. We first focused on
understanding the relative and absolute timing of emplacement of the alluvial surfaces.
We then determined the probable source of the sediments before assessing their lateral
offset to constrain the late Pleistocene fault slip rate. Seven successive morphostratigraphic
levels were identified. At two sites, we recognized an alluvial sequence of five to seven
successive levels with ages getting younger northward, a pattern consistent with the
western block moving southward relative to two fixed feeding channels located to the east.
Surface samples were collected for 10Be cosmogenic radionuclide dating. Fans F3
and F5 were found to be synchronous from site to site, at 102  26 ka and 324  22 ka,
respectively, while F4 could be dated at 163  19 ka at one site only. These are minimum
ages, assuming no erosion of the alluvial surfaces. At least two of these periods are
correlated with wet periods that are regionally well documented. Further analyses of
tectonic offsets are affected in most cases by large uncertainties due to the configuration of
the sites. They indicate maximum offsets of 5.5 km for the oldest, possibly 1 Ma old,
surfaces. They lead to bracketing of the fault slip rate between 5 and 12 mm/yr, with
preferred values of 5–7 mm/yr, for the last 300 ka.
Citation: Le Béon, M., Y. Klinger, A.-S. Mériaux, M. Al-Qaryouti, R. C. Finkel, O. Mayyas, and P. Tapponnier (2012),
Quaternary morphotectonic mapping of the Wadi Araba and implications for the tectonic activity of the southern Dead Sea fault,
Tectonics, 31, TC5003, doi:10.1029/2012TC003112.

1. Introduction                                                            fault based on geological observations over the last 20 Ma
                                                                           [Dubertret, 1932; Quennell, 1958, 1959; Freund et al.,
  [2] The Dead Sea fault is the 1000 km long left-lateral
                                                                           1968, 1970; Hatcher et al., 1981; Courtillot et al., 1987;
strike-slip fault that accommodates the northward motion of
                                                                           Garfunkel and Horowitz, 1966; Garfunkel, 1981; Garfunkel
the Arabia plate relative to the Sinai subplate (Figure 1a).
                                                                           and Ben-Avraham, 2001], offset markers of Quaternary age
Numerous studies aimed to determine the slip rate of this
                                                                           [Klinger et al., 2000a; Niemi et al., 2001; Daëron et al.,
                                                                           2004; Marco et al., 2005; Ferry et al., 2007, 2011;
   1
    Institut de Physique du Globe de Paris, Sorbonne Paris Cité,           Makovsky et al., 2008; Le Béon et al., 2010], and GPS
Université Paris Diderot, UMR 7154, CNRS, Paris, France.                   measurements [Wdowinski et al., 2004; Reilinger et al.,
   2
    Department of Geosciences, National Taiwan University, Taipei,         2006; Le Béon et al., 2008, Alchalbi et al., 2010]. These
Taiwan.
   3
    Now at Institute of Earth Sciences, Academia Sinica, Taipei, Taiwan.   different studies converge to a mean value of 4–6 mm/yr
   4
    School of Geography, Politics and Sociology, Newcastle University,     between present and 20 Ma ago. Some, however, suggest
Newcastle upon Tyne, UK.
   5
                                                                           that the slip rate could have been as high as 10 mm/yr
    Seismology Division, Natural Resources Authority, Amman, Jordan.       during the late Pleistocene [Klinger et al., 2000a; Le Béon
   6
    Earth and Planetary Science Department, University of California,
Berkeley, California, USA.
                                                                           et al., 2010].
   7
    Center for Accelerator Mass Spectrometry, Lawrence Livermore             [3] South of the Dead Sea basin, the Dead Sea fault runs
National Laboratory, Livermore, California, USA.                           near the axis of a broad valley, the Wadi Araba valley (the
                                                                           term “wadi” meaning “river”). This valley, which is 160 km
   8
    Earth Observatory of Singapore, Nanyang Technological University,
Singapore.                                                                 long, is bordered by the steep rims of the Jordanian Plateau
    Corresponding author: M. Le Béon, Institut de Physique du Globe de     to the east and of the Negev Plateau to the west (Figure 1b).
Paris, Sorbonne Paris Cité, Université Paris Diderot, UMR 7154, CNRS,      The depression exhibits highly preserved landscape thanks
1 rue Jussieu, F-75005 Paris, France. (lebeon@ipgp.fr)                     to local arid climatic conditions. The valley floor is blan-
Published in 2012 by the American Geophysical Union.                       keted in Quaternary sediments of various types (Figure 2),

                                                                    TC5003                                                       1 of 25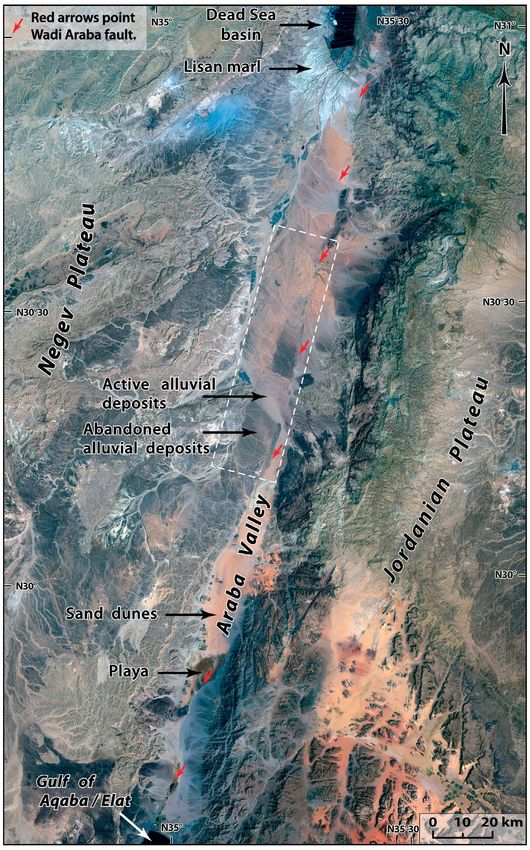
TC5003                     LE BÉON ET AL.: QUATERNARY KINEMATICS OF DEAD SEA FAULT                                          TC5003

         Figure 1. (a) Regional tectonic setting of this study. Tectonic map modified from Daëron et al. [2004]
         and Elias et al. [2007]. EAFS, East Anatolian fault system. Box indicates location of Figure 1b.
         (b) SRTM3 topography and active faults of the Wadi Araba. White rectangle indicates the large alluvial
         fans our study focuses on. Red lines show location of inset topographic profiles.

distinguishable on satellite images: aeolian sand dunes, playa     cosmogenic radionuclide (CRN) dating of alluvial surfaces
deposits, lacustrine marls, and alluvial deposits [e.g., Bender    and analysis of the Wadi Araba tributary catchment areas
et al., 1968; Garfunkel et al., 1981; Sneh et al., 1998a, 1998b;   (the main ephemeral river that occupies the northern half of
Klinger et al., 2003]. In the central part of the valley           the valley). In a first step, the units are described at the scale
(Figures 1b and 2), 10 km scale abandoned alluvial surfaces        of the valley. Then, we focus on three sites that we have
are easily noticeable, due to their darker color and their sharp   investigated in detail: Risha and al-Dhawi, Mazla, and
eastern edge, controlled by the active trace of the Wadi Araba     Fuhud/Masqara (Figure 3). For these sites we describe the
strike-slip fault (WAF) [Garfunkel et al., 1981]. Published        tectonic geomorphology and the 10Be CRN model ages.
geological maps do not converge toward a consistent chro-          Finally, we discuss the synchronism of alluvial deposition in
nology, either relative or absolute, for the emplacement of        the valley in respect to paleoclimates and examine evidence
these alluviums. Periods of deposition vary from Miocene to        for left-lateral displacements that we attempt to quantify
Pleistocene ages [Bartov, 1994; Sneh et al., 1998a, 1998b,         before estimating the long-term slip rate along the WAF.
2000], or from early Pleistocene to Holocene ages [e.g.,
Bender et al., 1968; Bender, 1974; Ibrahim, 1990; Rabb’a,          2. Morphotectonic Map of the Wadi Araba
1991, 1994; Tarawneh, 1991; Barjous, 1995, 2003].
                                                                   2.1. Data and Morphologic Criteria
  [4] In order to determine the origin and ages of these
alluvial deposits, we conducted a detailed morphotectonic            [5] Relative ages of alluvial surfaces can be distinguished
analysis of the Wadi Araba that was complemented by 10Be           as a function of surface height above active streams, degree

                                                              2 of 25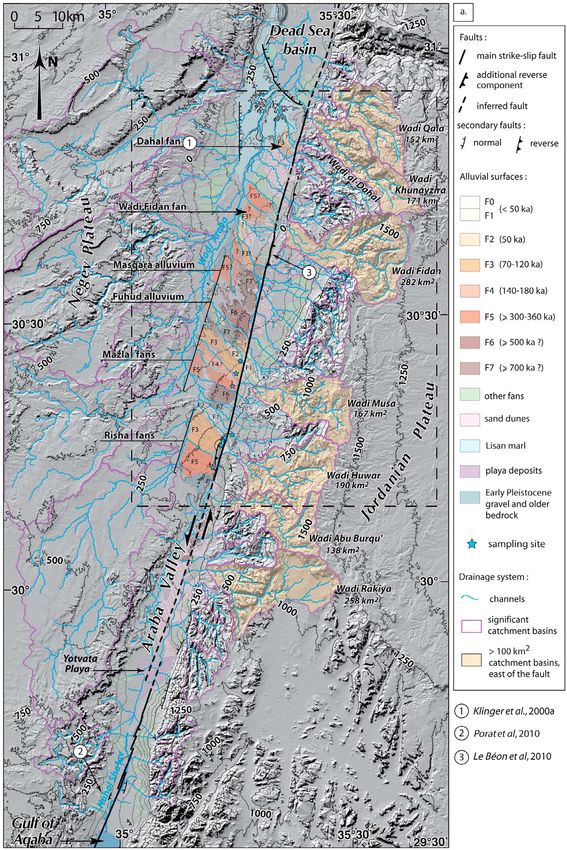
TC5003                     LE BÉON ET AL.: QUATERNARY KINEMATICS OF DEAD SEA FAULT                                       TC5003

         Figure 2. Landsat7 satellite view of the Wadi Araba, illustrating the different types of Quaternary sediments
         that cover the valley floor. White box indicates the large alluvial surfaces which we focus on in this study.

of incision by surficial rills and regressive gullies, surface     pavement, typical in arid areas, indicate older surfaces [Bull,
darkness and geometric relationship between the deposits           1991; Quade, 2001]. Observations have been derived from
[e.g., Klinger et al., 2003; Le Béon et al., 2010]. For example,   satellite imagery (Landsat7, SPOT5 (pixel 2.5 m), high-
darker surfaces, related to desert varnish and desert              resolution Google Earth database), aerial photographs,

                                                              3 of 25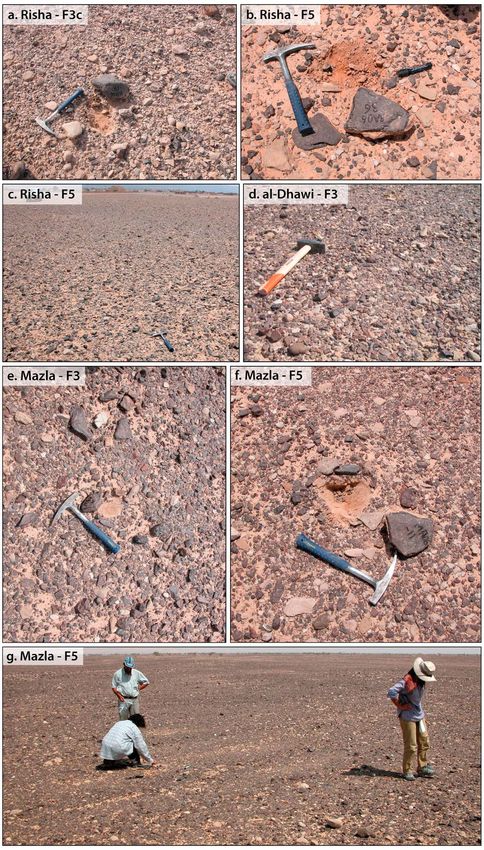
TC5003 LE BÉON ET AL.: QUATERNARY KINEMATICS OF DEAD SEA FAULT TC5003
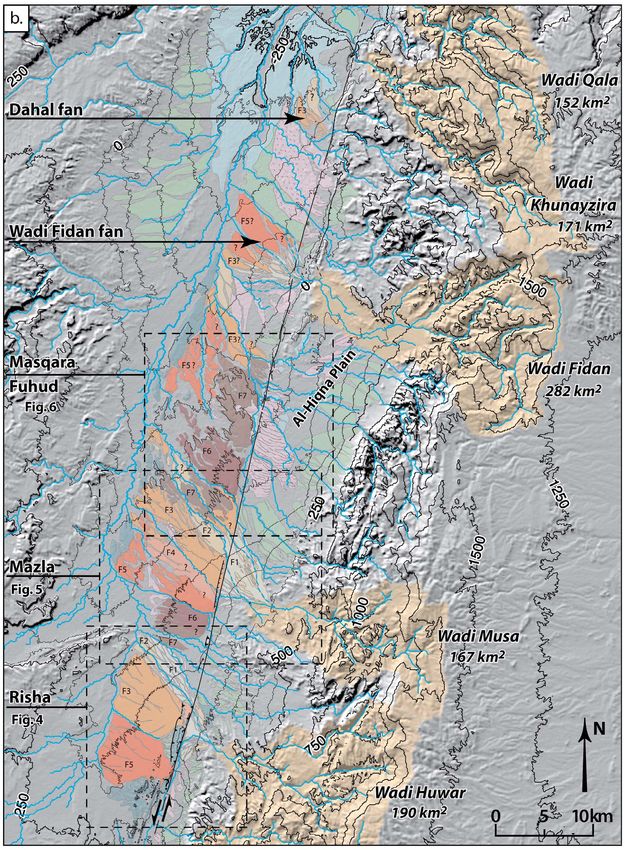
Figure 3. (a) Morphotectonic map and drainage network of the Wadi Araba. Box shows location of
Figure 3b. (b) Morphotectonic map of the northern Wadi Araba. See legend on Figure 3a. Boxes show loca-
tion of detailed morphotectonic maps of the large abandoned alluvial fans. Question marks indicate uncertain
correlations of alluvial surfaces far from any absolute age constraints. A georeferenced version of the morpho-
tectonic map, with the level of details presented in Figures 4 to 6, is available in auxiliary material Data Set S1.
4 of 25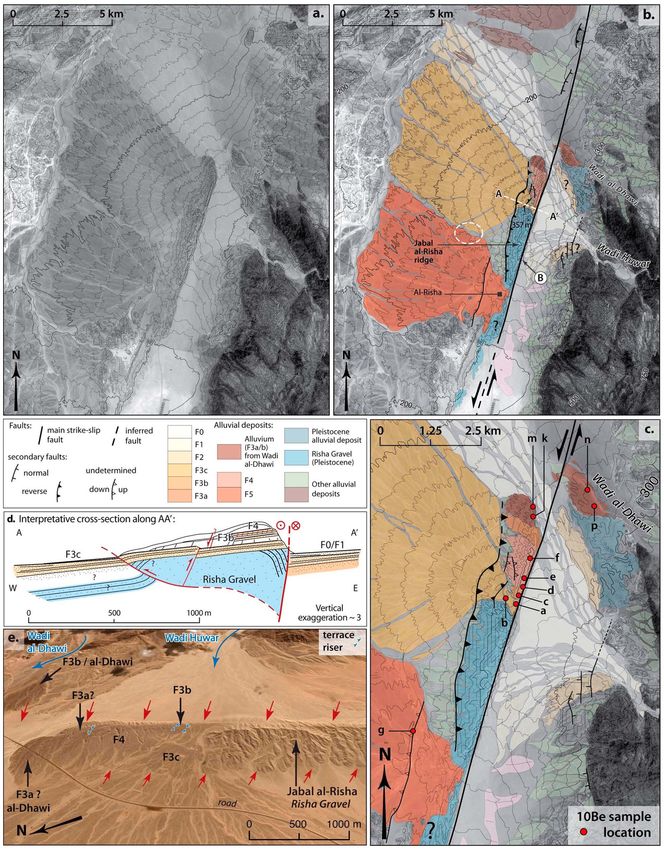
TC5003   LE BÉON ET AL.: QUATERNARY KINEMATICS OF DEAD SEA FAULT   TC5003

                           Figure 3. (continued)

                                  5 of 25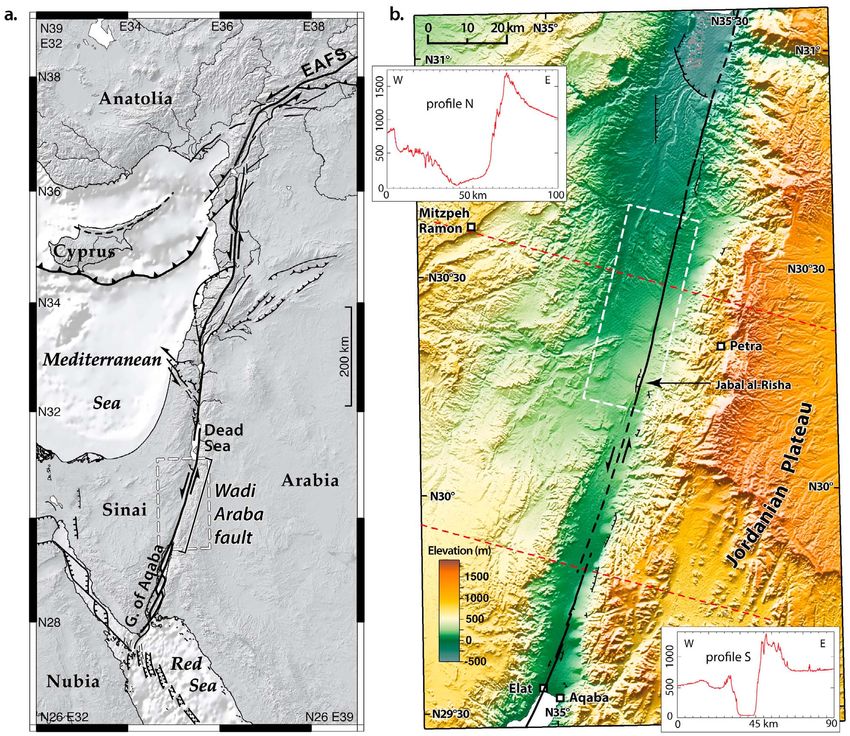
TC5003                     LE BÉON ET AL.: QUATERNARY KINEMATICS OF DEAD SEA FAULT                                          TC5003

1/50,000 topographic maps, SRTM3 and ASTER (pixel                   by active and abandoned large alluvial surfaces, sprinkled
30 m) topography and field observations at key locations.          with sand dunes in some places. Differences in height,
Information on the geological setting was derived from 1/           darkness, and degree of incision of the alluvial surfaces
250,000 and 1/50,000 geological maps referenced hereafter.          suggest deposits of varying ages. From the Jabal al-Risha to
                                                                    the Wadi Fidan fan, large alluvial surfaces, locally crosscut
2.2. The Active Trace of the Wadi Araba Fault                       by the fault, gently dip to the west and fill the valley over its
  [6] The active fault cuts the Quaternary deposits along a         entire width, pushing westward the Wadi Araba thalweg.
single strand striking N15 E (Figures 1b and 3). Numerous         The alluvial fans located along this section of the Wadi
coseismic [Klinger et al., 2000b] and cumulative offsets            Araba are generally much larger than further south, due to
[e.g., Garfunkel et al., 1981; Amit et al., 1996; Klinger et al.,   larger catchment areas. The asymmetry of the alluvial fill
2000a; Niemi et al., 2001; Le Béon et al., 2010] of geo-            probably reflects the asymmetry of the valley rims
morphic features, such as channels and alluvial surfaces, can       (Figure 1b). To the east, the catchments are large and steep,
be observed. Push-up structures and pull-apart basins occu-         with rivers constrained to narrow canyons. To the west,
pied by dry playas or filled with alluvial sediments are found      instead, the drainages coming down the Negev Plateau have
as well. Between Risha and the Yotvata Playa (Figure 3a),           wider riverbeds with gentler slopes and flow toward the NE,
sand dunes hamper an accurate determination of the fault            following the general direction of the folded structures
location. However, assuming that the fault azimuth is con-          forming the topography (Figures 2 and 3).
stant along this section (dashed line in Figures 1b and 3a),          [10] West of the fault, at the sites of Risha, Mazla, and
we suggest that the Yotvata Playa actually corresponds to a         Fuhud/Masqara, 10 km scale alluvial surfaces stand out due
left-stepping extensional jog of the fault. Further south, the      to their dark surficial color related to desert varnish, high
fault is clearly visible until the town of Elat where it enters     elevation above the active streams and/or a developed net-
the Gulf of Aqaba [Makovsky et al., 2008]. Minor normal             work of surficial rills and regressive gullies. In addition to
faults affecting the Quaternary alluvium abutting onto the          the sharpness of their eastern edge, bounded by the active
edge of the valley are also observed in a few places, mostly        trace of the WAF, some of the alluvial surfaces, especially at
on the eastern valley edge.                                         Risha, are characterized by radial topographic contour lines,
                                                                    concave to the east. This morphology attests that they orig-
2.3. The Quaternary Sedimentary Cover
                                                                    inate from major catchments coming down the edge of the
  [7] The morphotectonic map is presented on Figure 3. The          Jordanian Plateau to the east. Because the large alluvial
color code from brown (older) to light yellow (younger)             surfaces of Risha, Mazla, and Fuhud/Masqara lie west of the
defines a relative chronology for the emplacement of the            WAF and originate from the east, they were progressively
middle to late Pleistocene alluvial deposits at the scale of the    disconnected from their source. Being shuttled along the
Wadi Araba. These deposits have been subdivided into                fault, they can be used to constrain the fault activity, as
seven morphostratigraphic levels, F7 to F1 (F1 being the            outlined in section 4.
youngest); F0 refers to active washes. Detailed mapping               [11] North of the Wadi Fidan fan, coalescent alluvial
based on the combination of geomorphic analyses at the sites        deposits (i.e., bajada) occupy both sides of the valley. The
of Risha and al-Dhawi, Mazla, and Fuhud/Masqara, which              northernmost deposits dip toward the Dead Sea basin and are
are discussed in details in section 4, is used as reference to      interfingered with the white Lisan marls that formed when
further expand the map to the entire Wadi Araba surfaces.           the Lake Lisan, the precursor of the Dead Sea, reached ele-
The surface correlation from site to site was established from      vations up to 180 to 150 m bsl (below sea level) in the late
10
   Be CRN model ages (section 5) for surfaces F5 and F3.            Pleistocene [e.g., Kaufman et al., 1992; Bartov et al., 2002;
We also accounted for previously published geomorphic               Klinger et al., 2003; Waldmann et al., 2007]. The soft marls
mapping and 10Be age data for the Wadi al-Dahal alluvial            are deeply incised due to considerable lake level drop since
fan, located in the northern Wadi Araba (Figures 1b and 3)          the early Holocene [e.g., Frumkin, 1997] and to down drop
[Klinger et al., 2000a, 2003]. For the other surfaces, the          of the basin north of the Khunayzir (Amatzia) normal fault.
proposed relative chronology is based on geomorphic crite-
ria and on the assumption that climatic events are synchro-         3. The Possible Sources for the Large
nous at the scale of the studied area (section 6.1) [e.g., Bull,
                                                                    Alluvial Fans
1991]. Uncertain correlations of alluvial fans far from any
published data or from the sites of this study are indicated by       [12] In order to use the large abandoned alluvial surfaces
question marks on the map.                                          to quantify geomorphic offsets related to motion of the
  [8] The sedimentary cover evolves from south to north, in         WAF, one needs first to identify the feeding catchment
relation with the topography of the valley rims (Figures 2          associated with each fan. The Wadi Araba drainage network
and 3). In the south, alluvial fans of similar size (1 to 3 km      was investigated based on satellite topographic data SRTM3
in diameter) were emplaced on both sides of the valley and          (pixel 90 m) (http://www2.jpl.nasa.gov/srtm/) processed
coalesce in the center. This pattern probably reflects the          with the RiverTools software. The catchments and drainage
pseudosymmetry of the valley rims (see topographic profile          network are shown on Figure 3. Detailed descriptions are
on Figure 1b), roamed by steep and short catchments on              given by Greenbaum et al. [2006] and Le Béon [2008]. Due
either side. A few playas occupy the valley bottom. A vast          to arid climate, most drainages are actually occupied by
sand dunes field lies from the Yotvata playa to the Jabal           ephemeral rivers or streams.
al-Risha.                                                             [13] We need to determine which of the catchments on the
  [9] North of the Jabal al-Risha, along the central section of     eastern valley rim of the Wadi Araba were able to produce
the Wadi Araba valley, the sedimentary cover is dominated           alluvial deposits of such size. It has been shown that the

                                                               6 of 25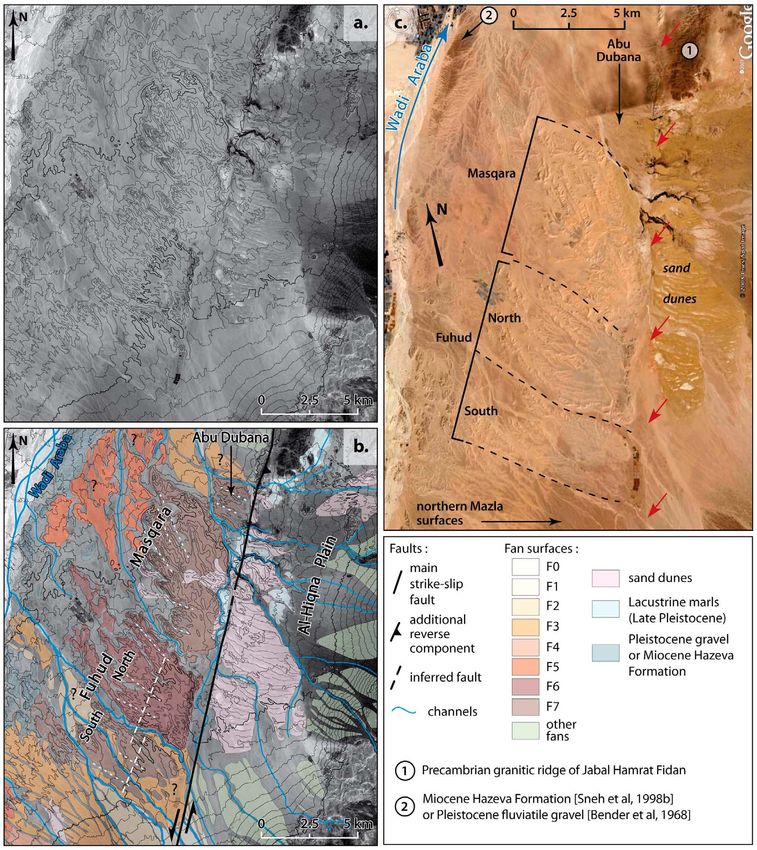
TC5003                     LE BÉON ET AL.: QUATERNARY KINEMATICS OF DEAD SEA FAULT                                           TC5003

extent of an alluvial fan is proportional to the area of its       ridge is covered by more recent alluvium that unconform-
feeding catchment [e.g., Bull, 1962; Harvey, 1997; Rohais,         ably overlies the Risha Gravel (Figure 4d).
2007]. This relation is modulated by a constant that                 [17] Two large alluvial fans, which shapes are well
accounts for parameters such as climate, tectonics, and the        defined by radial topographic contour lines, rest to the west
erodability of the exposed rocks. Since these parameters do        of the ridge. Both fan apices are uplifted relative to the
not vary significantly along the eastern rim of the northern       valley floor, thus both alluvial surfaces are inactive today.
and central sections of the Wadi Araba, the main criterion         These two fans of similar size lie side by side. Deeper sur-
we need to take into account is the catchment area.                ficial incision into the southern fan suggests that it is the
  [14] To calibrate the size of such catchment, we rely on the     oldest. This is also supported by evidence for slight lateral
Wadi al-Dahal alluvial fan located in the northern Wadi            erosion of the southern fan when the northern fan was
Araba (Figure 3). Klinger et al. [2000a] have identified the       emplaced (see white circle on Figure 4b). Based on 10Be
catchment of the Wadi al-Dahal as the source of this fan. The      CRN ages, the southern fan surface corresponds to level F5
area of this basin is 97 km2 and the fan itself is much smaller    and the northern one to F3c.
than the alluvial surfaces that can be found in the central          [18] The apex of F5 is fairly wide and partly occupied
section of the valley. Consequently, we have to consider           by Al-Risha village, hampering any precise location. The
basins larger than 100 km2. The seven basins of such size         proximal part of the fan is down dropped relative to the
are marked on Figure 3. Obviously, the Wadi Abu Burqu’             distal part along a secondary fault, which scarp faces to
and the Wadi Rakiya cannot be the sources of the large             the east. While the radial topographic contour lines at the
alluvial surfaces, as they are located south of them: it would     distal part of the fan converge to the center of the apex,
contradict the left-lateral sense of motion of the Dead Sea        contour lines on the down dropped part rather converge to
fault. Five possible sources remain, from north to south: the      the northern rim of the apex. This observation would be
Wadi Qala, the Wadi Khunayzira, the Wadi Fidan, the Wadi           consistent with tilting of the apex, related to a southward
Huwar, and the Wadi Musa. In section 6.2, we propose a             decreasing uplift.
possible pairing of each alluvial surface with a catchment           [19] By contrast, the apex of the northern fan F3c is clearly
source, based on a detailed geomorphic analysis and a series       incised within the ridge. It is narrow, 250 m wide, with an
of 10Be CRN model ages.                                            oblique direction relative to the fault. F3c is inset into the flat
                                                                   northern part of the ridge that is thus older and mapped as
4. Detailed Morphotectonic Analysis                                F4, the timing of deposition relative to F5 being determined
of the Large Alluvial Fans                                         from 10Be CRN ages (section 5.2.1). South of F4, a small
                                                                   surface 1 m lower than F4 and that appears less incised on
4.1. The Risha and al-Dhawi Alluvial Fans                          satellite views was mapped as F3b. It stands 4 m higher
  [15] The site of Risha is located at the center of the Wadi      than F3c. The extent of the surface F4 to the north remains
Araba, and is marked by the ridge of the Jabal al-Risha (the       uncertain. North of the sampling site (f), the elevation of the
term “jabal” meaning hill here) (Figures 3 and 4). This ridge      surface gently decreases to reach another flat area that is
is elongated along the WAF and asymmetric, with steep              10 m lower than F4. This surface is probably younger than
slopes to the east and gentler slopes to the west. The central     F4, possibly corresponding to a late F4 stage or to an early
part of the ridge stands 100–150 m above the valley floor,         F3 stage. We later refer to this surface as F3a. The distal part
with the elevation decreasing southward. This local uplift is      of the fan F3c is limited to the north by a riser that separates
explained by the slight change in the fault azimuth, from a        F3c from two lower and light colored (thus younger) incised
N14 E left-lateral strike-slip segment to the north, to N17 E    alluvial surfaces, which are mapped as F2 and F1.
along the ridge. A secondary reverse fault, located to the           [20] Across from the Jabal al-Risha, east of the fault, is the
west of the ridge, also attests to the transpressive component     outlet of the Wadi Huwar, one of the largest catchments
[Garfunkel et al., 1981]. The ridge is formed of a poorly          draining the Jordanian Plateau toward the Wadi Araba
indurated conglomerate, the Risha Gravel, Pleistocene in age       (Figure 3; section 3). Its riverbed is narrow and deeply
[Barjous, 2003], which appears to be folded, as observed in        incised in the bedrock, with a large alluvial fan, light in
the field and reported on our interpretative cross section         color, emplaced at its mouth. Most of the surface F0 is
(Figure 4d).                                                       active, with only few abandoned lobes mapped as F1.
  [16] The northern and central parts of the ridge have a          Abandoned surfaces, F2 or older, are visible on both sides of
different appearance. The northern part is fairly flat and         the active fan. The present-day stream and the morphology
relatively preserved from gullies incision. It is darker in        of these abandoned surfaces attest to water flowing both
color (Figure 4e). Contrary to the geological maps, where it       northward and southward, although the main flux seems to
has been mapped as the Risha Gravel [e.g., Barjous, 1995;          be directed to the north in the most recent time. The direction
Sneh et al., 2000], our observations show that this part of the    of flow, however, has probably evolved coincidentally with

Figure 4. (a) SPOT5 satellite image of the Risha site. (b and c) Morphotectonic map of the Risha site over SPOT5 satellite
image in Figure 4a. Topographic contour lines are from 1:50,000 topographic maps and SRTM3 data. White circle points out
evidence for lateral erosion of F5 when F3c was emplaced (see text). AA′ white dashed line shows location of the interpre-
tative cross section in Figure 4d. B points to the outcrop location of N35 E dipping beds of Risha Gravel. (d) Interpretive
cross section. (e) Oblique high-resolution Google Earth view of the northern part of the site. Red arrows delineate the fault.
Note the difference in color, relief and incision of the ridge, north and south of the apex of F3c. Letters refer to sampling sites
(see Table 1).

                                                              7 of 25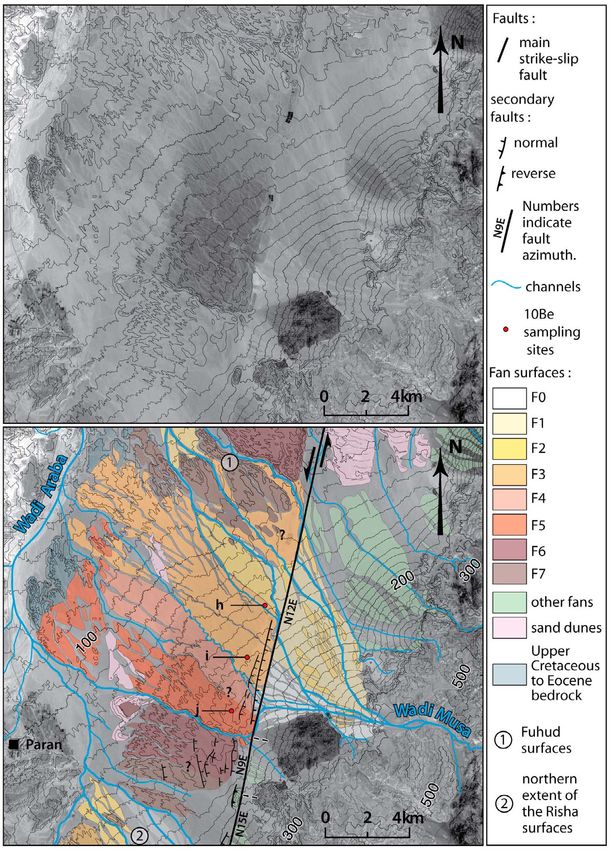
TC5003   LE BÉON ET AL.: QUATERNARY KINEMATICS OF DEAD SEA FAULT   TC5003

                                 Figure 4

                                  8 of 25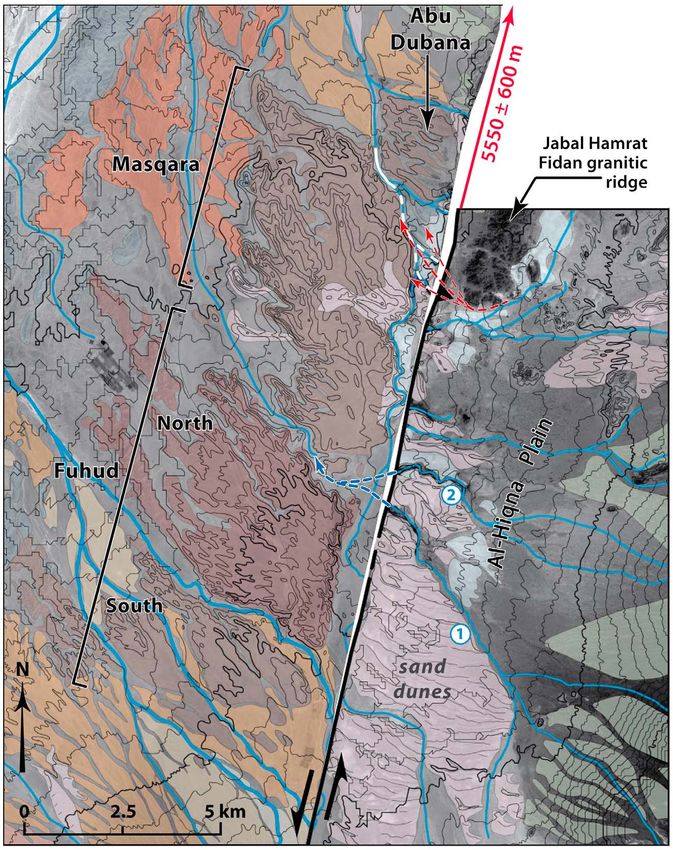
TC5003                    LE BÉON ET AL.: QUATERNARY KINEMATICS OF DEAD SEA FAULT                                      TC5003

         Figure 5. Morphotectonic map of the site of Mazla over SPOT5 satellite image. Topographic contour
         lines have been digitized from 1:50,000 topographic maps. Letters refer to sampling sites (see Table 1).

the uplift and the left-lateral displacement of the Jabal al-    beige sandy matrix dominate (Figure 7). This distinct red-
Risha, which prevents the stream to flow directly westward.      dish surface is more deeply incised than F4. The transition
  [21] The alluvial units found at the northern tip of the       between the reddish surface and the surface F3a to the south
Jabal al-Risha are clearly distinct from the alluviums located   is gradual with a 30 m wide interfingering zone, visible in
further south along the ridge. The northernmost unit lies 10–    the numerous gullies incising the area. The northeastern riser
15 m lower than F4, at about the same elevation as the lower     of the ridge, constantly rejuvenated by the wash, shows
surface F3a. This unit exhibits a characteristic darker paved    evidences for occasional mixing of lighter material with the
surface (Figure 7) and it is mostly composed of dark color       reddish dark conglomerate in this area. This advocates for
angular pebbles embedded into a peculiar reddish sandy           contemporaneous emplacement of the surface F3a and the
matrix. Hence, this dark alluvium originated from a drainage     northern reddish surface, and thus it has been eventually
that differs from the source of the other deposits found in      mapped as F3a. The deeper incision into the northern surface
Risha, where light color pebbles and cobbles embedded in a       is interpreted as an effect of the abrupt drop between this

                                                            9 of 25
TC5003                     LE BÉON ET AL.: QUATERNARY KINEMATICS OF DEAD SEA FAULT                                            TC5003

         Figure 6. (a) SPOT5 satellite image. (b) Morphotectonic map of the Fuhud and Masqara surfaces over
         SPOT5 satellite image in Figure 6a. Topographic contour lines have been digitalized from 1:50,000 topo-
         graphic maps. White dashed line on the Fuhud surfaces show that topographic contour lines, taken at the
         preserved top part of the alluvial surface, can be fitted by a straight line, attesting to a distal source for the
         deposits. Dotted lines indicate the incision pattern. (c) High-resolution Google Earth view of the surfaces.

surface and the lower level F1, while the transition from F4       4.2. The Mazla Alluvial Fans
to F1 is more gradual, through F3c.                                  [23] At Mazla, we observe a series of abandoned alluvial
  [22] North of the Jabal al-Risha and east of the fault, an       deposits sharply limited to the east by the active trace of the
abandoned alluvial surface shows the same characteristic           WAF (Figure 5). The fault trace is mostly straight and it is
darkness, clast composition, and unmistakable reddish sandy        expressed as a single strand striking N12 E. Local changes in
matrix as the surface located west of the fault at the northern    the fault azimuth, however, are responsible for secondary
tip of Jabal al-Risha. Hence, it strongly suggests that both       normal faulting affecting the alluvial surfaces located west of
alluviums were part of the same deposit. Since this surface is     the WAF and for the growth of a 1 km long push-up structure
deposited at the Wadi al-Dhawi outlet, we later refer to it as     in the southern part of the site. West of the fault, the alluvial
the al-Dhawi fan.

                                                             10 of 25
TC5003 LE BÉON ET AL.: QUATERNARY KINEMATICS OF DEAD SEA FAULT TC5003
surfaces gently sloping 1 W extend until the thalweg of the capture an abandoned drainage and find a way out further
Wadi Araba, along the western valley edge. Higher elevation toward northwest.
and deep incisions by several westward flowing drainages
attest to the uplift of the western side relative to the eastern 4.3. The Site of Fuhud and Masqara
one, possibly related to the small transtensive component on [27] The configuration of this site is quite similar to the
a slightly east dipping fault plane. one of Mazla (Figure 6). Large abandoned alluvial surfaces,
[24] West of the fault, we have identified seven successive deeply incised, are dipping westward. They are bounded
levels of alluvial surfaces (F7 to F1) above the present-day sharply to the east by the linear active trace of the WAF.
channel, which appearances evolve from south to north Slight uplift of the western block probably also takes place
(Figure 5). Moving northward, the elevation (taken at the here. Unlike at the site of Mazla, all the surfaces exposed
easternmost part of the surfaces) decreases and the topo- west of the fault seem to be fairly old: they are 20 m high
graphic contour lines attest to a lower degree of incision of above the present-day streams, densely incised, and light in
the surfaces. The successive surfaces also become lighter in color due to surface degradation from regressive incision
color to the north, suggesting a northward decrease of the and deflation.
age of the surfaces. Surfaces F6 and F7 depart from this [28] The northern and southern surfaces of Fuhud have a
general pattern, as they appear to be the lightest in color. We very similar appearance to, respectively, the surfaces F6 and
attribute this light color to a poorer preservation of the top F7 of Mazla. The northern surface is slightly darker and a
part of F6 and F7, due to surface incision by regressive rills larger area of its top part surface remains (Figure 6c), so that
and associated surface deflation. The distal parts of the sur- it may be a little younger than the southern surface. Yet, both
faces, to the west, are all lighter on the SPOT5 image surfaces have similar elevation. The topographic contour
because they are sprinkled with sand. From south to north lines of both surfaces could fit straight lines, suggesting a
the orientation of the topographic contour lines also varies. remote source for these deposits. The southern surface is
To the south, on surfaces F7 and F6, the steepest slope is composed of several patches surrounded by a lower and
oriented N80 W westward. It rotates gradually to reach a darker surface inferred as F3.
northwest orientation (N40 W) for F3 and F2. North of F2, [29] The surface of Masqara, located just north of Fuhud,
the slope of the high and deeply incised surfaces of the has a different appearance. Although the lighter color seems
Fuhud site (Figure 6), which morphology appears to be related to sand cover (Figure 6c), the surface is clearly more
similar to the one of surfaces F6 and F7, is oriented west- incised. In addition, the elevation of the eastern part of the
ward again. surface significantly decreases northward, from 80 m to
[25] East of the fault the main feature is the large alluvial 10 m. The highly curvy topographic contour lines on this
fan emplaced at the mouth of the Wadi Musa, one of the surface make it difficult to assess a comprehensive pattern of
largest eastern tributaries of Wadi Araba (see section 3). A emplacement, or incision. However, incised rills tend to be
massive outcrop of Precambrian volcanic rocks [Barjous, oriented from N70 W in the south to N20 W in the north.
1995] (black in color) bounds the riverbank of Wadi Musa The relative chronology of deposition between this surface
to the south. Satellite images and topographic contour lines and the northern Fuhud surface could not be established
show that the influx of dark volcanic clasts is actually very due to the bad preservation of surfaces and the presence of
small compared to the light-in-color clasts contribution from sand dunes hiding the contact between the two surfaces.
the surrounding catchments, and it could not be held [30] The Masqara alluvium is bounded to the north by a
responsible for the dark color of the western surfaces, which small alluvial surface, the Abu Dubana alluvium, probably
is related to the development of the desert varnish and of similar age since it exhibits a similar degree of incision.
pavement. This surface is significantly lower in elevation, at 15 m bsl,
[26] Two parts can be distinguished on the Wadi Musa than the Masqara surface. Unlike for the Masqara surface,
fan, east of the fault. The bright southern part is the most the topographic contour lines corresponding to the Abu
active part today. It is characterized by radial topographic Dubana alluvium are parallel to the fault trace.
contour lines defining a smaller alluvial fan inset in the [31] The area east of the WAF, the al-Hiqna Plain, consists
large-scale fan. This deposit originated from water flowing of coalescent west dipping alluvial fans and of a large sand
N75 W, straight out of the mouth of the wadi, before dunes field. The alluvial deposits seem to be much younger
diverging 3 km downstream from the outlet. The northern than to the west, since the fans are still active and the oldest
part of the fan seems slightly older, from its darker color and abandoned alluvial deposits exhibit well-preserved dark sur-
the surficial incision by a few drainages. Topographic con- faces with shallow incision. Also reported on the 1:50,000
tour lines attest to a water flow oriented toward the north- geological map [Rabb’a, 1991, 1994], late Pleistocene
west. Two levels of alluvial surfaces can be observed above lacustrine marls that appear as bright spots on the satellite
the present-day streams. The surface F1 may be followed on images are overlaid by the alluvial deposits, supporting late
the western side of the fault, blanketing the inset channels. Pleistocene or younger ages.
The surface F2, more patchy, is more incised and a little
darker than F1. Because the toe of the eastern alluvial fan 5. Surface Exposure Dating of the Abandoned
abuts on the higher deposits located west of the fault (F2 to Alluvial Surfaces
F7), the fan geometry has probably evolved considerably
through time, depending on the path found by the water flow 5.1. Analytical Approach
to cross or get around the obstacle. The dog-legged geome- [32] Abandoned alluvial surfaces can be dated using CRN
try of most drainages attests to it. They have either been left- surface exposure dating techniques [Lal, 1991; Gosse and
laterally offset by the fault, or they flow along the fault to Phillips, 2001]. In this study, we use 10Be cosmogenic
11 of 2510 10
Table 1. Be CRN Dating Data: Sample Information, Be Concentrations, and Model Agesa
10
Elevation Be Concentration Error Minimum Maximum
TC5003
b c
Surface No. Sample Lithology Location ( N/ E) (m) (104 atoms/g SiO2) (104 atoms/g SiO2) Aged,e Int f Ext f Aged,e Ext f Percentg
Risha site
F3c 1 RA06-3 gr 30.261421/35.237881 (a) 300 22.81 0.64 48.6 1.4 4.5 53.1 5.4 9
2 RA06-6C a. rd qtz 30.261421/35.237881 (a) 299 30.67 0.76 64.0 1.6 5.9 72.1 7.6 13
3 RA06-1 gr 30.261450/35.237521 (a) 297 31.70 0.71 66.9 1.5 6.1 76.0 8.0 14
6 RA06-5 qtzite 30.261473/35.237762 (a) 300 35.01 0.89 75.6 2.0 7.0 87.6 9.5 16
7 RA06-2 gr 30.261370/35.237699 (a) 299 37.21 0.80 79.2 1.7 7.2 92.6 10.0 17
8 RA06-4 qtzite 30.261457/35.237916 (a) 298 53.64 1.19 116.3 2.6 10.7 148.8 18.3 28
4 RA06-34C a. rd qtz 30.262670/35.234913 (b) 281 32.26 0.82 68.3 1.8 6.3 77.6 8.2 14
5 RA06-33 qtzite 30.262670/35.234913 (b) 281 33.75 0.86 73.6 1.9 6.8 84.9 9.2 15
9 RA06-31 qtzite 30.262617/35.234946 (b) 281 58.87 1.72 128.6 3.9 12.2 170.3 22.5 32
F3b 10 RA06-14C a. rd qtz 30.263109/35.238564 (c ) 306 47.97 1.71 100.5 3.7 9.7 122.9 14.9 22
11 RA06-8 qtzite 30.263039/35.283990 (c ) 306 75.88 1.99 162.7 4.4 15.4 240.1 36.8 48
12 RA06-11 qtzite 30.263109/35.238564 (c ) 305 115.39 2.22 255.3 5.3 24.2 641.6 272.6 151
F4 13 RA06-29C a. rd qtz 30.264344/35.239143 (d) 304 72.62 1.70 154.1 3.8 14.4 218.5 31.2 42
14 RA06-26C a. rd qtz 30.264909/35.239293 (e) 307 67.60 1.59 143.0 3.5 13.3 195.5 26.5 37
- RA06-23C a. rd qtz 30.266977/35.239961 311 -h - - - - - -
15 RA06-16 qtzite 30.271202/35.241534 (f) 312 69.08 1.63 150.6 3.7 14.1 213.3 30.5 42
16 RA06-19C a. rd qtz 30.271202/35.241534 (f) 313 85.44 2.36 181.7 5.3 17.3 284.7 48.2 57
17 RA06-17 qtzite 30.271192/35.241529 (f) 312 83.31 2.03 183.2 4.7 17.3 292.1 50.4 60
F5 18 RA06-36i,j qtzite 30.233337/35.210312 (g) 251 126.30 2.97 301.9 7.7 29.3
19 RA06-38Ci,j a. rd qtz 30.233337/35.210312 (g) 251 131.99 3.10 302.8 7.7 29.4
20 RA06-35i,j qtzite 30.233299/35.210309 (g) 251 144.85 3.40 344.2 8.8 33.8
Wadi al-Dhawi site
12 of 25
F3a west of fault D2 DW09-2 a. rd qtz 30.28160/35.243281 (k) 267 59.33 1.73 128.9 3.9 12.2 169.7 22.2 32
D2a DW09-2a qtz 30.28160/35.243281 (k) 267 48.31 1.41 106.0 3.2 10.0 131.4 15.8 24
D2b DW09-2b a. ang qtz 30.28160/35.243281 (k) 267 73.90 2.10 163.2 4.8 15.5 238.7 36.4 46
D4 DW09-4 a. rd qtz 30.28325/35.242781 (m) 262 63.52 1.89 139.4 4.3 13.3 189.2 25.9 36
D5 DW09-5 qtz 30.28325/35.242781 (m) 262 56.88 1.65 125.9 3.8 11.9 164.4 21.2 31
D5a DW09-5a a. rd qtz 30.28325/35.242781 (m) 262 60.35 2.04 132.2 4.6 12.7 175.7 23.7 33
F3b east of fault D8 DW09-8 a. ang qtz 30.28581/35.256510 (n) 273 51.86 1.50 112.11 3.3 10.6 141.1 17.3 26
D9 DW09-9 a. rd qtz 30.28581/35.256510 (n) 273 48.57 1.57 104.4 3.5 9.9 128.9 15.6 23
D12 DW09-12 a. ang qtz 30.28315/35.258389 (p) 278 50.52 1.65 109.2 3.7 10.4 136.4 16.8 25
D13 DW09-13 a. rd qtz 30.28315/35.258389 (p) 278 49.31 1.44 105.6 3.2 9.9 130.8 15.7 24
Mazla site
F3 21 MA06-3 rhyo 30.420323/35.278760 (h) 156 18.94 0.64 44.4 1.5 4.2 47.8 4.9 8
22 MA06-1 gr 30.420408/35.278828 (h) 155 21.79 0.52 51.1 1.2 4.7 56.1 5.7 10
LE BÉON ET AL.: QUATERNARY KINEMATICS OF DEAD SEA FAULT
23 MA06-4C a. rd qtz 30.420323/35.278760 (h) 156 34.94 0.82 81.5 2.0 7.5 95.1 10.4 17
24 MA06-2 rhyo 30.420303/35.278703 (h) 157 34.58 1.01 81.8 2.4 7.7 94.6 10.4 16
25 MA06-7 qtzite 30.399413/35.269219 (i) 175 39.42 0.76 93.4 1.8 8.5 112.6 12.7 21
26 MA06-6 qtzite 30.399389/35.269344 (i) 175 51.34 1.21 104.5 3.0 9.8 129.3 15.5 24
27 MA06-8C a. rd qtz 30.399389/35.269344 (i) 175 44.63 1.26 119.1 2.9 11.1 152.2 18.8 28
28 MA06-5 qtzite 30.399349/35.269351 (i) 175 105.86 2.47 258.4 6.4 24.8 648.5 279.6 157
F5 29 MA06-12Cd,j a. rd qtz 30.376626/35.261067 (j) 196 130.21 4.13 311.7 10.7 31.2
30 MA06-11i,j qtzite 30.376593/35.261130 (j) 196 130.58 3.90 318.5 10.3 31.7
31 MA06-9i qtzite 30.376700/35.261278 (j) 196 131.17 3.81 328.4 10.4 32.7
32 MA06-10i rhyo 30.376626/35.261067 (j) 197 145.34 3.47 362.3 9.5 35.8
TC5003TC5003 LE BÉON ET AL.: QUATERNARY KINEMATICS OF DEAD SEA FAULT TC5003
radionuclide. The concentration of 10Be isotopes of a rock alluvial deposits may protect them from erosion and defla-
sample mostly depends on the exposure time of the rock to tion [Wells et al., 1995; Quade, 2001; Regard et al., 2006;
cosmic rays, on the erosion rate of the surface, and on an Van der Woerd et al., 2006]. Successful exposure dating up
inheritance component due to possible exposure of the cobble to 2 Ma of clasts from the pavement of abandoned alluvial
prior to its final deposition [Lal, 1991]. In this study, CRN surfaces in the eastern Negev [Matmon et al., 2009;
samples were prepared using the procedure of Kohl and Guralnik et al., 2010], just west of the Wadi Araba, attest for
Nishizumii [1992] and model ages were calculated using the high surface preservation. A low maximum erosion rate of
CRONUS-Earth calculator v2.2 [Balco et al., 2008], using 0.3 m/Ma was derived from the oldest of these surfaces
the constant production rate scaling scheme from Lal [1991] [Matmon et al., 2009]. Preservation of the desert varnish and
and Stone [2000]. More details regarding samples processing desert pavement at our sites suggest that the effect of erosion
and age calculation are provided in Le Béon et al. [2010], is small for the surfaces targeted for dating (F3 to F5).
Table 1, and auxiliary material Data Set S1.1 However, the light color of the oldest surfaces F6 and F7
[33] We targeted sampling sites located on well-preserved (section 4, Figures 5 and 6) attests to a significant effect of
alluvial surfaces at the sites of Risha, al-Dhawi, and Mazla erosion at longer timescale, probably once regressive erosion
(Figures 3b, 4, 5, and 7). At each site we collected 3 to 9 has reduced the flat top part of the surface to a given
rock samples, well embedded in the surface to ensure their threshold. To test our field-based hypothesis, we used our
10
long-term stability [e.g., Ryerson et al., 2006]. At Risha and Be data to calculate a maximum erosion rate. We assumed
Mazla we sampled cobbles because they are the most rep- that enough terrace material has been removed by erosion to
resentative clast size on the surfaces. Various quartz-rich justify the steady state erosion model [Lal, 1991] (i.e., pro-
lithologies (Table 1) have been collected: granite, quartzite, duction is balanced by radioactive decay) for the samples
and rhyolite. Amalgamated samples of 15 to 20 rounded with the highest 10Be concentrations, the samples from the
quartz pebbles of similar size (2–3 cm) were collected in fans F5 at Risha and Mazla (Table 1). Using a value of
parallel. Such samples are expected to represent an average 160 g/cm2 for the attenuation length and the rock samples
of the clast population and may help gain a better under- density (Table 1), we obtained a maximum erosion rate of
standing of the exposure history of the clasts by comparison 2.1 0.1 m/Ma. Because the study area experiences uni-
of their age to those of individual cobbles [Hetzel et al., form climatic conditions and because the configuration of
2002; Matmon et al., 2009]. At each sampling site, the cor- our sites is similar, we can reasonably apply the same ero-
rection for shielding of cosmic rays related to the sur- sion rate at all sites presented here. This clearly is a con-
rounding topography was found to be negligible. servative approach, since the maximum erosion rate derived
[34] When computing CRN ages, we assumed that pre- by Matmon et al. [2009] is 10 times lower. For each sample,
exposure on the cliffs and during transport and possible the minimum and the maximum ages (calculated assuming
storage in the drainage basin [Anderson et al., 1996; Repka no erosion and maximum erosion, respectively) are given in
et al., 1997] is negligible. The sources of the deposits we Table 1. For ages in the order of 70 ka, maximum erosion
are interested in are large catchments (>150 km2) with would lead to a 15% increase of the age, which is barely
characteristic lengths of 15–20 km. The drainages are fairly larger than the uncertainty, confirming the zero-erosion
steep and narrow, incised in the bedrock, therefore with hypothesis for surfaces F3 and younger [e.g., Ryerson et al.,
limited clasts storage. Since we sampled various lithologies 2006]. The maximum erosion rate would imply very poor
coming from different locations in the catchment, inheri- age control for surfaces older than F4. An erosion rate of
tance, if any, is expected to be scattered rather than constant 0.3 m/Ma would have negligible effect on any CRN age,
and dependent on lithology. This aspect will be discussed in even from surface F5, for which the increase in age would
the light of the age distributions in section 5.2. remain within 10%. In the following, we consider the min-
[35] Arid environments usually show highly preserved imum ages to discuss our results.
landscapes. Desert pavement developed at the surface of [36] CRN dating of alluvial surfaces may not only be
biased by preexposure and erosion, but also by the com-
1
Auxiliary material data sets are available at ftp://ftp.agu.org/apend/tec/ plexity of alluvial processes (e.g., duration of surface activ-
2012TC003112. Other auxiliary material files are in the HTML. ity, postdepositional contamination related to exceptional
doi:10.1029/2012TC003112. flood events) and by postdepositional processes on the
Notes to Table 1:
a
The complete set of analytical parameters required for age calculation is available as auxiliary material (Data Set S1). No. corresponds to number used in
maps and graphs.
b
Densities of 2.7, 2.65, and 2.5 g/cm3 were used for granite, quartzite/quartz and rhyolite samples, respectively. Lithologies: gr = granite, qtzite =
quartzite, rhyo = rhyolite, amalgamated samples: a. rd qtz = rounded quartz pebbles, a. ang qtz = angulous quartz pebbles.
c
Letters in parentheses indicate sampling sites shown in Figures 4 and 5.
d
Model ages were calculated with the CRONUS-Earth online calculator, version 2.2 [Balco et al, 2008] (http://hess.ess.washington.edu/math). Calculator
uses the revised value of (1.36 0.07)E6 years for the 10Be half-life [Nishiizumi et al., 2007].
e
Minimum model age, calculated with no erosion ; Maximum model age, calculated with maximum erosion rate of 2.1 m/Ma.
f
Int/Ext , internal/external uncertainty. The internal (or analytical) uncertainty includes error from the blank and the AMS counting statistics. The
external (or propagated) uncertainty takes into account uncertainty in the production rate and scaling factors.
g
Percent, ratio of model age calculated assuming a given erosion rate over minimum model age.
h
Too high boron at AMS.
i
Sample used to compute an average maximum erosion rate of 2.1 0.1 m/Ma.
j
Saturation reached. Undetermined age > several Ma.
13 of 25TC5003 LE BÉON ET AL.: QUATERNARY KINEMATICS OF DEAD SEA FAULT TC5003
Figure 7. Sampling at the sites of Risha, al-Dhawi, and Mazla. Site locations are shown on Figures 4
and 5. (a) Sample RA06-33 collected at Risha on surface F3c (site b). (b) Sample RA06-36 on surface
F5. (c) View of the surface F5 at Risha where sample RA06-36 was collected (Site g). (d) View of the
al-Dhawi surface F3, west of the fault (site k). (e) View of the paved surface F3 at Mazla, at the location
of sample MA06–6 (site i). (f) Sample MA06–11. (g) View of the surface F5 at Mazla (site j) where sam-
ple MA06–11 was collected.
geomorphic surface [e.g., Bull, 1991]. All such processes 2010]. In this study, we reject visually obvious outliers and
may result in scattered age distribution. The definition of age define clusters from the other ages, even if they do not
clusters and the rejection of outliers are often arguable, compare within internal uncertainty. For each surface we
especially in small data sets [e.g., Van der Woerd et al., 1998; calculated from the minimum CRN model ages, the weighted
Mériaux et al., 2004, 2009; Ritz et al., 2006; Le Béon et al.,
14 of 25TC5003 LE BÉON ET AL.: QUATERNARY KINEMATICS OF DEAD SEA FAULT TC5003
Figure 8. Distribution of the 10Be CRN model ages at the sites of (a) Risha, (b) al-Dhawi, and (c) Mazla
and (d) synchronous emplacement phases of alluvium.
mean age, applying weights that depend on the normalized sites as well as in previous studies [e.g., Le Béon et al., 2010;
internal uncertainty, and the standard deviation s. Schmidt et al., 2011], supports the reliability of the amal-
gamated samples to provide an appropriate estimate of the
5.2. Results exposure age of the surfaces. Hence, regarding surface F3b,
5.2.1. The Risha Site we give more confidence to the age of the amalgamated
[37] At Risha, we sampled the northern fan F3c, the sample 10 than to the ages of individual cobbles that could
northern part of the ridge covered by F3b and F4, and the be explained by inheritance during transport or as reworked
southern fan F5 (Figure 4). The surfaces at the sampling sites material from older deposits (possibly F4 for sample 11). We
are characterized by their flatness, their dark color and the then considered an age estimate of 101 10 ka (sample 10)
desert pavement, which all indicate that the surfaces have for F3b and an average age of 162 19 ka from the five
not been modified recently either by natural erosion, animals samples on F4.
or human activity (Figure 7). Ages are shown in Table 1 and [40] To the south, on the fan F5, we collected two cobbles
on Figure 8. and an amalgamated sample of rounded quartz pebbles. Due
[38] On the fan F3c, we collected nine samples in total to the vicinity of the village of Al-Risha, we targeted a site as
from two locations near the apex. Six exposure ages close to the fan apex as possible, yet away from gravel
(including ages derived from the amalgamated samples) are quarries and car tracks. We obtained two ages at 302 29 ka
clustered between 64 6 ka and 79 7 ka, one is signifi- (amalgamated sample) and 303 29 ka, and one at
cantly younger (49 5 ka, sample 1) and two are signifi- 344 34 ka. We computed an average age of 316 24 ka
cantly older, 116 11 ka (sample 8) and 129 12 ka for F5. This estimate should be considered with care, given
(sample 9), which are probably related to a more complicated the small number of samples collected at only one loca-
exposure history than a single phase of deposition and aban- tion and the possibly significant effect of erosion processes
donment. The presence of older samples can be explained by (if >0.3 m/Ma; see section 5.1) for this surface.
inheritance, related to remobilization of older deposits located [41] On F3c and F4, the age distributions are relatively
upstream, and/or to preexposure in the catchment. Discarding clustered, especially for F3c. Outliers are considerably older
these samples, we obtained an average exposure age of than the cluster of ages and their number is limited. Inter-
71 6 ka based on six samples. estingly, they are all quartzite cobbles that come from further
[39] North of the apex of F3c, we collected two cobbles up in the catchment than granites. Yet, other quartzite cob-
and an amalgamated sample on F3b and five amalgamated bles (samples 5 and 6 on F3c and samples 15 and 16 on F4)
samples in total from three locations on F4. On F3b we agree with the age cluster. The consistency between the ages
obtained scattered exposure ages: 101 10 ka (sample 10) derived from cobbles of different lithologies and amalgam-
for the amalgamated sample and 162 15 ka (sample 11) ated pebbles suggest that average inheritance is likely to be
and 254 24 ka (sample 12) for the two cobbles. On F4, the small. Occasional large inheritance of quartzite cobbles
five samples yielded consistent ages between 143 13 ka might be due to preexposure in the catchment cliffs,
and 183 17 ka. The agreement between ages from amal- although remobilization of late Quaternary deposits located
gamated samples and from most individual cobbles at our upstream remains possible.
15 of 25TC5003 LE BÉON ET AL.: QUATERNARY KINEMATICS OF DEAD SEA FAULT TC5003
5.2.2. The Al-Dhawi Site sample (312 31 ka, sample 29) is consistent with the
[42] At al-Dhawi, cobbles of quartz-rich lithologies were individual samples. The four ages lead to an average of
scarce (Figure 7). We mostly collected amalgamated samples 330 22 ka for F5. Similarly to the surface F5 at the site of
of quartz pebbles from flat paved surfaces away from gully Risha, these ages are very dependent on how we consider
incisions at two locations on both sides of the fault (Figure 4 erosion and they should be considered with care.
and Table 1). West of the fault, we also collected two small
quartz cobbles. The pebbles were sorted between rounded 6. Discussion: Alluvial Fans as a Climatic Record
ones and angular ones, to test for the effect of duration of and Their Implications for Late Pleistocene Activity
transport and possible postabandonment processes at the of the Wadi Araba Fault
surface of the deposit, such as fracturing of cobbles.
[43] The age distributions that we obtained on either side of [48] The combination of detailed morphotectonic analyses
the fault differ from each other. East of the fault, the four ages and dating of surfaces lead to the morphotectonic map of the
are consistent within the narrow range of 104 10 ka (D9) to Wadi Araba presented on Figure 3. This map shows a com-
112 11 ka (D8) and average to 108 4 ka. West of the prehensive relative chronology for the emplacement of the
fault, the ages are generally slightly older and more scattered. late Pleistocene alluvial deposits at the scale of the valley. In
Four samples cluster from 126 12 ka to 139 13 ka; one is sections 6.1 and 6.2, we first discuss the synchronism of
slightly younger (106 10 ka, D2a) and one slightly older alluvial fans emplacement and possible correlation with rec-
(163 16 ka, D2b). They yield an older average age of ognized paleoclimatic events. Next, building on such chro-
130 19 ka. Except for sample D2b, no significant age nology and the fact that many of these surfaces are offset
difference is observed between samples composed of relative to their feeding catchment due to the motion of the
rounded or angular pebbles. This suggests that the effect of WAF, we provide some insights in the late Pleistocene
duration of transport, clast abrasion during transport, and activity of the WAF.
postabandonment processes are negligible or balanced.
6.1. Synchronism of Alluvial Fan Deposition
[44] While the eastern and western surfaces were proposed
Within the Wadi Araba
to be of same age, the average ages only slightly overlap.
The western surface being older could be explained by an [49] Previous studies conducted in glaciofluvial and fluvial
earlier abandonment of this surface as it is uplifted and environments [e.g., Bull, 1991; Van der Woerd et al., 2002;
moved away from the feeding catchment due to displace- Sharp et al., 2003; Daëron et al., 2004; Mériaux et al., 2005;
ment across the fault. Regard et al., 2006] have shown a close relationship between
5.2.3. The Mazla Site paleoclimates and the emplacement of alluvial deposits. The
[45] At the site of Mazla, we targeted the well-preserved relationship between bed load transport, precipitation, and
surface F3 and F5 (Figure 5) for dating. These surfaces are temperature is however not straightforward, especially under
flat, dark, paved by pebbles and cobbles (Figure 7). At each arid climatic conditions. In a simplistic picture, higher rainfall
site, three well-rooted cobbles of various lithologies (Table 1) would enhance denudation and bed load transport and thus
and an amalgamated sample of rounded quartz pebbles were favor deposition of clasts downstream. Yet, other factors such
collected. The ages are given in Table 1 and Figure 10. as the vegetation cover and the rainfall regime also influence
[46] On surface F3, we obtained at the southern site three the efficiency of denudation in the catchment [Bull, 1991].
consistent ages of 93 9 ka (sample 25), 104 10 ka (sample Here, we test the possible climatic control on the deposition
26) and 119 11 ka (sample 27), the oldest age corresponding of alluvial fans in the Wadi Araba and if any correlation can
to the amalgamated sample. Sample 28, a quartzite cobble, be established between the phases of alluvium aggradation
yielded a significantly older age of 257 25 ka. To the north, and any regional or local documented climatic events.
we obtained two pairs of similar ages. The pair 81 8 ka [50] Figure 8 compares the alluvial sequences observed at
(amalgamated sample 23) and 82 8 ka (sample 24) are in the sites of Risha, al-Dhawi, and Mazla. At Risha and Mazla,
10
good agreement with the ages obtained further south. The Be CRN dating yielded comparable average exposure age
other two ages are significantly younger: 44 4 ka (sample for F5, respectively of 316 24 ka and 330 22 ka. Even if
21) and 51 5 ka (sample 22). The location of the sampling some erosion should be accounted for, the two sites would
site, close to a major active channel that separates surface F3 likely be affected the same way, considering their proximity.
from the younger surface F2 (Figure 5), suggests that the Combining the ages from both sites yields a mean age of
youngest samples may reflect occasional postabandonment 324 22 ka for this event of alluvium deposition. All sites
contamination of F3, possibly during the deposition of F2. exhibit a cluster of ages from 70 ka to 130 ka from the
Although data are scarce, this hypothesis is supported by the deposits F3. At Risha and al-Dhawi, the deposit F3 appears
agreement between the age derived from the amalgamated to be divided into 3 sublevels, F3a to F3c, probably due to
sample 23 and the age of individual cobbles from the two uplift of the Jabal al-Risha, that favors an earlier abandon-
sampling sites on F3. Based on samples 23 to 27 we calculated ment of the alluvial surfaces. F3a was observed at the
an average age of 96 16 ka for F3. The difference in age northern tip of the Jabal al-Risha and dated at 130 19 ka
between the amalgamated samples 27, collected in the south- from the al-Dhawi deposit. Surfaces F3b were emplaced at
ern part, and 23, collected in the northern part, may suggest the mouth of Wadi al-Dhawi (108 4 ka), east of the fault,
northward migration of the water flow with time. and near the apex of F3c (101 10 ka). The apex of F3c was
[47] On the surface F5, three cobbles provided exposure dated at 71 6 ka. Given the overlap of the 10Be CRN ages,
ages of 319 32 ka (sample 30), 328 33 ka (sample 31) we consider all the F3 deposits as part of a single alluvial
and 362 36 ka (sample 32). The age of the amalgamated event dated at 102 26 ka. It is worth noticing that both at
16 of 25TC5003 LE BÉON ET AL.: QUATERNARY KINEMATICS OF DEAD SEA FAULT TC5003
Risha and Mazla younger samples of consistent age, at 6.2. Associating a Feeding Catchment to the Large
50 ka (samples 1, 21 and 22), can be found on F3. Although Abandoned Alluvial Surfaces
these cobbles could be part of a more complicated history of [53] To further understand the processes controlling the
burial, remobilization and exposure, they might alternatively emplacement of the large abandoned alluvial surfaces
reflect a more recent phase of emplacement of alluvial described in sections 2–5, we need to associate to each of
deposits, which would have occurred around 48 5 ka. The them a feeding source among the potential large catchments
alluvial level F4 was only dated at Risha, at 163 19 ka. identified in section 3 (Figure 3). Given the 10Be CRN model
[51] Eventually, we have identified three and possibly four ages that are as young as late Pleistocene and the wide range
episodes of emplacement of alluvial surfaces: 324 22 ka, of fault slip rates published in the literature (3 mm/yr to
163 19 ka, 102 26 ka and more hypothetically 48 5 ka 11 mm/yr) (see Le Béon et al. [2010] for a complete review),
(Figure 8). The synchronous clusters at 324 22 ka and the maximum expected offsets are in the order of 1 km to
102 26 ka strongly suggest a uniform response of the bed 3.2 km for respectively 100 ka old and 320 ka old
load transport and stream power of the drainages to some surfaces, suggesting a fairly close source for those deposits.
external climatic forcing, at least at the scale of the central Hence, the Wadi Musa and the Wadi Huwar are the only
Wadi Araba. Previous studies investigated late Quaternary possible sources for the Mazla fans and the Risha fans,
deposits in the Wadi Araba (Figure 3), using 10Be CRN ages respectively. The outlets of the other catchments are too far
[Klinger et al., 2000a, 2003; Le Béon et al., 2010] and OSL north from the deposits to be reasonably considered.
dating [Porat et al., 2010]. In spite of some significant dis- [54] Attributing a source to the undated alluvial surfaces of
persion of the 10Be CRN ages, similarly to our results, these Fuhud and Masqara is not straightforward. The closest large
three studies show prominent alluvial surfaces that correlate catchment that may produce such large alluvial deposits is
with the 102 26 ka phase of deposition. Such observations the Wadi Fidan (Figure 3). Any catchment north of Wadi
and the new ages presented here, all tend to confirm the Fidan can hardly be considered as a potential source for
similarity of response of the local drainages to climatic var- those deposits, as they would have been eroded away when
iations at the scale of the Wadi Araba. It is worth highlighting moved in front of the wadi. Several morphologic criteria,
the lack of fans between 324 22 ka and 163 19 ka, however, lead us to discard the Wadi Fidan as a possible
although we cannot rule out a bias due to our sampling feeder. First, if the Wadi Fidan was the source of these
strategy that focus on levels that are offset by the fault. deposits, the surfaces should appear to be younger north-
[52] Correlating the three main phases of alluviation that ward. Also, more recent alluvial surfaces are lacking
we observed with local and regional documented paleocli- between Masqara and the present-day alluvial fan emplaced
matic records is not straightforward, particularly because the by the Wadi Fidan. Second, because the outlet of the Wadi
uncertainty on ages is often larger than, or in the order of the Fidan is located only 1 km east of the active trace of the
frequency of the climatic variations. However, the deposi- WAF, the alluvial fan deposited at its mouth on the western
tion phase observed around 102 26 ka throughout the block should exhibit a characteristic fan shape with radial
Wadi Araba clearly coincides with the interglacial Marine topographic contour lines (Figure 3), unlike the Fuhud and
Isotope Stage 5 (MIS-5) [Emiliani, 1955; Shackleton, 1969], Masqara surfaces, which morphology suggests a rather distal
identified as a wetter period both locally and regionally. source (section 4.3). Finally, the elevation of the eastern
Several local studies on the Jordanian Plateau, in the Wadi edge of these surfaces is 150 m higher than the present-day
Araba, and in the Negev, mention the occurrence of lake apex of the Wadi Fidan alluvial fan.
deposits and travertine during MIS-5 [Schwarcz et al., 1979; [55] Instead, we suggest that the surfaces of Fuhud and
Livnat and Kronfeld, 1985; Abed et al., 2000]. This wet Masqara originate from the smaller catchments (up to
period is also reported regionally from the speleothems of 70 km2) located between the Wadi Fidan and the Wadi
Israeli caves [Bar-Matthews et al., 2003], the pollens and the Musa. Between these two wadis, in the al-Hiqna Plain, east
sapropel layers (organic-rich layers resulting from heavy of the fault, a large bajada forms at the toe of the valley
discharge from the Nile River) observed in marine cores escarpment (Figures 3 and 6). The fairly straight N15 E
from the Eastern Mediterranean [Cheddadi and Rossignol- oriented topographic contour lines of this large bajada, as
Strick, 1995; Rossignol-Strick and Paterne, 1999]. The well as its width, match quite well the morphology of the
depositional event at 163 19 ka occurred during the glacial abandoned deposits of Fuhud and Masqara, suggesting that
period MIS-6. It may correlate with a minimum of d18O and it is the most probable source for these surfaces.
a high water stand recorded at 150–155 ka in the Israeli
caves and with the sapropel 6. Similarly to the 102 26 ka 6.3. Quantifying Cumulative Left-Lateral Offsets
event, it would as well coincide with a noticeably wet and Fault Slip Rates Along the WAF
period. The oldest phase of alluviation, at 324 22 ka, [56] The morphology of all the abandoned alluvial sur-
would correspond to the major interglacial MIS-9. Few local faces described in this study (section 4) shows evidence for
records exist to document whether MIS-9 was a wet or dry late Pleistocene activity on the WAF: the sharp linear eastern
period. In addition, this latest correlation should be inter- edge of the alluvial surfaces and a disturbed drainage net-
preted carefully as these ages are very sensitive to possible work. In addition, both at the sites of Risha and Mazla, we
erosion of the surfaces. The lack of fans between 324 ka observe a series of deposits that become younger northward,
and 163 ka might be explained by the prominence of the in agreement with a western block moving southward rela-
163 19 ka and 102 26 ka wetter periods compared to tive to feeding channels located to the east. However, the
local climate during the former time period. lack of counterpart across the fault for most surfaces and the
smallness of expected offsets (≤1 km to ≤ 3.2 km) relative to
17 of 25You can also read