Characterisation of the BATMAN beam properties by Hα-Doppler shift spectroscopy and mini-STRIKE calorimeter
←
→
Page content transcription
If your browser does not render page correctly, please read the page content below
UNIVERSITÀ DEGLI STUDI DI PADOVA
       DIPARTIMENTO DI FISICA E ASTRONOMIA GALILEO GALILEI

                    CORSO DI LAUREA MAGISTRALE IN
                                FISICA

    Characterisation of the BATMAN beam
  properties by Hα-Doppler shift spectroscopy
        and mini-STRIKE calorimeter

Relatore:
Dr. Gianluigi Serianni
Correlatore:
Prof. Dr.-Ing. Ursel Fantz
Controrelatore:
Dr. Marco Cavenago
                                                       Laureando:
                                                     Sofia Cristofaro

                             16 Settembre 2014
                         Anno Accademico 2013-2014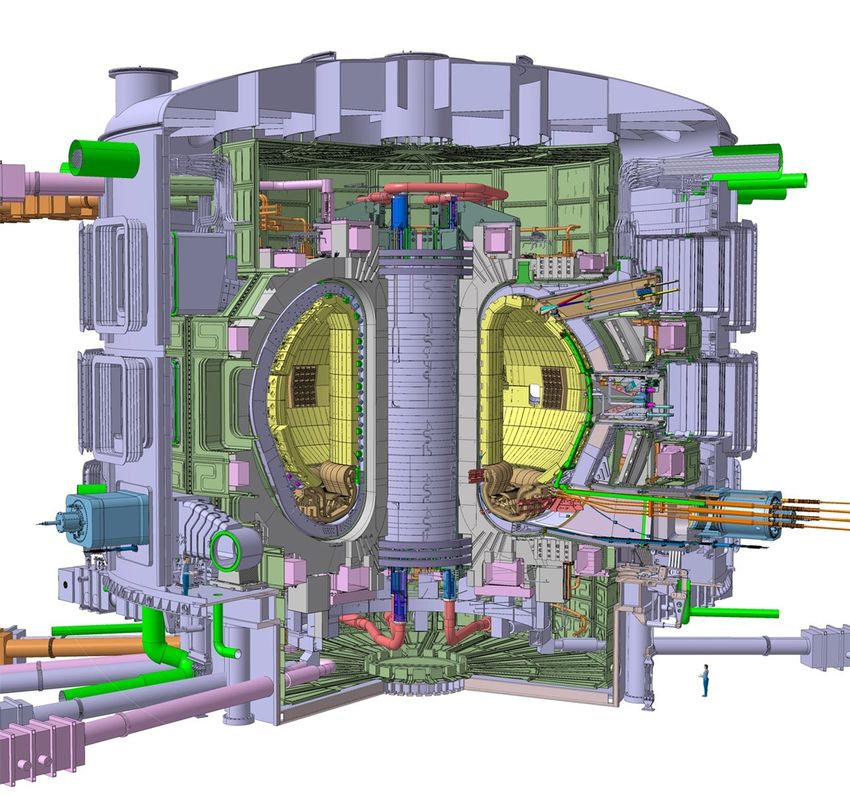
Abstract
The ITER tokamak is an international project, with the aim of proving the possi-
bility to produce energy by nuclear fusion of deuterium and tritium nuclei in a reactor
scale. In order to reach the necessary temperature for fusion, additional heating sys-
tems are required, like the injection of a neutral beam. One of the components of the
Neutral Beam Injector (NBI) is based on a RF driver source for the production of
negative hydrogen or deuterium ions, taking as reference the ion sources developed
at Max-Planck Institut für Plasmaphysik (IPP, Garching bei München, Germany).
The activity reported in this thesis has been performed at the IPP BATMAN
test facility, which has the target of optimising the source performance, using a small
extraction area (63 cm2 ) and short pulses (4 s). The activity was focused on the
BATMAN beam characterisation by means of two different diagnostic tools: Beam
Emission Spectroscopy (BES) system and mini-STRIKE calorimeter, both recently
installed with a new configuration. The BES system is based on the Hα -Doppler
shift spectroscopy, in order to investigate the beamlet divergence and the stripping
fraction. In the BATMAN test bed, five telescopes are arranged in a vertical array in
order to study the beam vertical inhomogeneity. The second diagnostic system is the
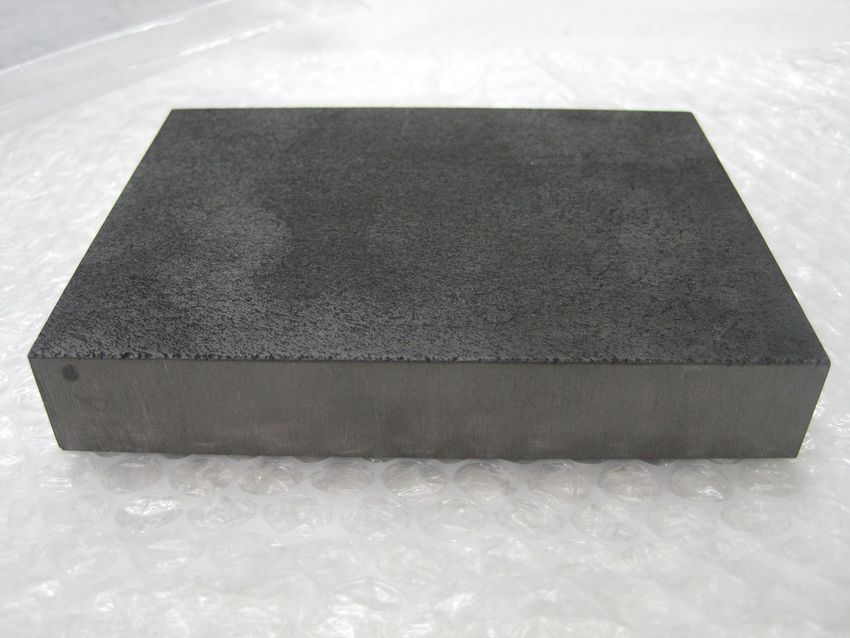
mini-STRIKE calorimeter, which consists of two identical one-directional (1D) Car-
bon Fibre Composite (CFC) tiles, arranged in vertical direction and observed at the
rear side by a thermal camera: the measured thermal pattern provides information
about the energy flux of the impinging beam. As part of this thesis work, a software
for mini-STRIKE data analysis has been developed and various experimental cam-
paigns have been carried exploiting the new layout of the mini-STRIKE calorimeter.
The beam properties have been investigated with both diagnostic systems.
In Chapter 1, an introduction to nuclear fusion and ITER experiment is given.
Furthermore, the need of external heating systems is explained, focusing on NBI
source requirements.
The structure of the IPP prototype negative ion source is described in Chapter 2,
together with the already known negative beam properties.
Chapter 3 presents the technical details of the BATMAN test facility and the
diagostic tools present in the BATMAN tank, aiming to characterise the beam: the
BES system and the mini-STRIKE calorimeter.
Chapter 4 focuses on the development of the software for mini-STRIKE data
analysis.
In Chapter 5 the various experimental campaigns are discussed. The influence of
the source parameters on the beam properties has been investigated by means of the
BES system and the mini-STRIKE calorimeter.
A comparison of the two diagnostic systems is then carried out, focusing on the
investigation of the beam homogeneity, in Chapter 6.
The main results and the future developments are finally presented in Chapter 7.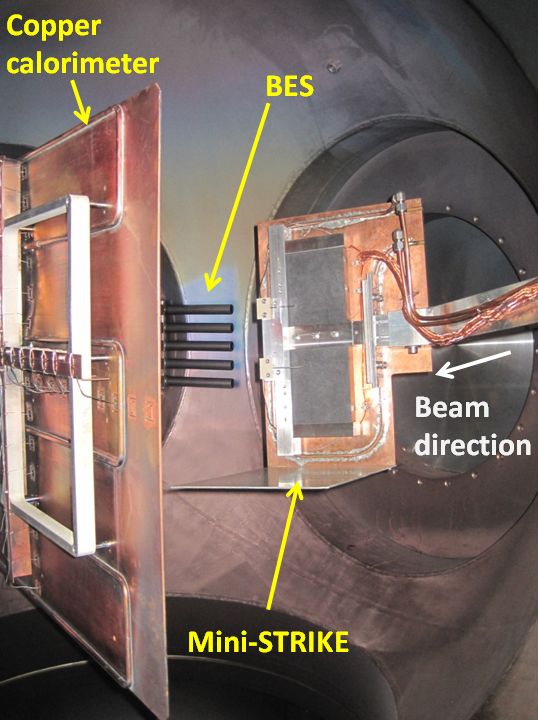

Sommario
     Il tokamak ITER è un progetto internazionale, con lo scopo di dimostrare la pos-
sibilità di produrre energia tramite la fusione nucleare di nuclei di deuterio e trizio in
una struttura con dimensioni paragonabili a un reattore. Per raggiungere le tempera-
ture necessarie per la fusione, sono necessari dei sistemi di riscaldamento addizionali,
quale ad esempio l’iniezione di un fascio di neutri. Un componente dell’iniettore del
fascio di neutri (NBI) si basa su una sorgente a radiofrequenza che crea ioni negativi
di idrogeno o deuterio, considerando come riferimento le sorgenti di ioni sviluppate
al Max-Planck Institut für Plasmaphysik (IPP, Garching bei München, Germania).
     Il lavoro riportato nella presente tesi è stato svolto presso la test facility BATMAN,
la quale ha l’obiettivo di ottimizzare le performance della sorgente. La sorgente in
BATMAN ha una piccola area di estrazione (63 cm2 ) e gli impulsi hanno una durata
di 4 s. Il lavoro di tesi si è concentrato sulla caratterizzazione del fascio di BATMAN,
attraverso l’utilizzo di due diverse diagnostiche: il sistema di spettroscopia di emis-
sione del fascio (Beam Emission Spectroscopy, BES) e il calorimetro mini-STRIKE,
entrambi recentemente installati con una nuova configurazione. La prima diagnostica
si basa sull’analisi spettroscopica della riga Hα traslata per effetto Doppler, in modo
da ricavare la divergenza dei fascetti che compongono il fascio globale e la frazione
di particelle prodotte per stripping. Per esaminare la disomogeneità del fascio in
direzione verticale, a BATMAN sono impiegati cinque telescopi, disposti l’uno sopra
l’altro. Il calorimetro mini-STRIKE invece consiste di due tegole in fibra di carbonio
unidirezionale, tra loro identiche, disposte in direzione verticale e osservate sul retro
da una camera a infrarossi: il profilo termico misurato fornisce informazioni riguardo
il flusso di energia del fascio incidente. Come parte del lavoro di tesi, è stato sviluppa-
to un programma di analisi dati e sono state condotte diverse campagne sperimentali
con il nuovo setup di mini-STRIKE. Le proprietà del fascio di BATMAN sono state
studiate mediante ambo le diagnostiche.
     Nel Capitolo 1 è presente un’introduzione alla fusione nucleare e all’esperimento
ITER. Si spiega inoltre la necessità di utilizzare sistemi di riscaldamanto esterni,
concentrandosi poi sui requisiti della sorgente dell’iniettore del fascio di neutri.
     La struttura del prototipo di sorgente di ioni negativi sviluppato a IPP è descritta
nel Capitolo 2, presentando inoltre le già note proprietà del fascio di ioni negativi.
     I dettagli tecnici della test facility BATMAN sono esposti nel Capitolo 3. Qui
vi è anche una descrizione delle diagnostiche presenti in BATMAN, che hanno lo
scopo di caratterizzare il fascio. Queste diagnostiche sono la BES e il calorimetro
mini-STRIKE.
     Il Capitolo 4 si concentra sullo sviluppo del programma di analisi dati creato per
mini-STRIKE.
     Nel Capitolo 5 sono discusse le diverse campagne sperimentali: si studia in tal
modo l’influenza che possiedono i diversi parametri della sorgente sulle proprietà del
fascio attraverso i due sistemi diagnostici, BES e mini-STRIKE.
     Un confronto tra le due diagnostiche è presentata nel Capitolo 6, con particolare
riguardo allo studio della omogeneità del fascio.
     Infine, i principali risultati e gli sviluppi futuri sono raccolti nel Capitolo 7.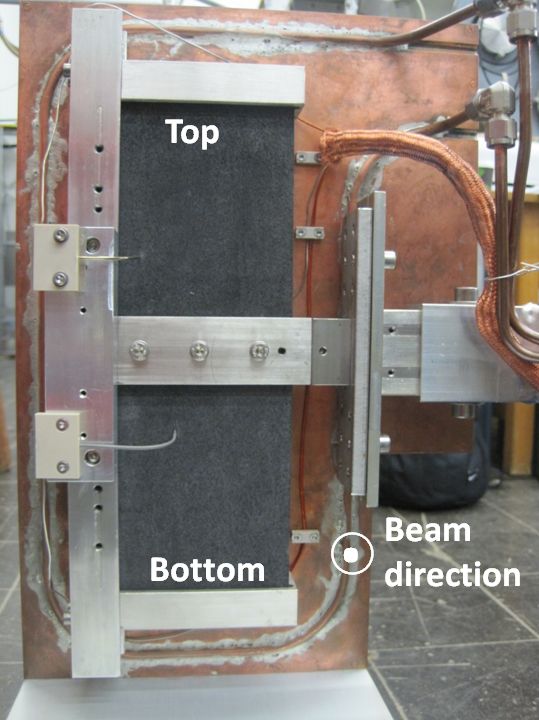
Contents
1 Introduction                                                                                                                1
  1.1 A solution for energy problem: nuclear fusion and the                  way to          ITER            .   .   .   .    1
       1.1.1 Nuclear fusion . . . . . . . . . . . . . . . . . .              . . . .         . . . .         .   .   .   .    1
       1.1.2 Definition of plasma . . . . . . . . . . . . . .                . . . .         . . . .         .   .   .   .    2
       1.1.3 Tokamak and ITER . . . . . . . . . . . . . . .                  . . . .         . . . .         .   .   .   .    2
  1.2 Neutral beam heating . . . . . . . . . . . . . . . . . .               . . . .         . . . .         .   .   .   .    5
  1.3 ITER-relevant ion source parameters . . . . . . . . .                  . . . .         . . . .         .   .   .   .    7

2 Processes in a negative hydrogen ion source            and         beam            physics                                 11
  2.1 The RF source . . . . . . . . . . . . . . . .      . . .       . . . .         . . . . .           .   .   .   .   .   11
      2.1.1 Creation of negative hydrogen ions .         . . .       . . . .         . . . . .           .   .   .   .   .   12
      2.1.2 Extraction region . . . . . . . . . . .      . . .       . . . .         . . . . .           .   .   .   .   .   14
  2.2 Beam physics . . . . . . . . . . . . . . . . .     . . .       . . . .         . . . . .           .   .   .   .   .   16

3 IPP test facility: BATMAN                                                                                                  21
  3.1 Description of the ion source . . . . . . . . .    .   .   .   .   .   .   .   .   .   .   .   .   .   .   .   .   .   21
  3.2 Beam diagnostics in BATMAN . . . . . . .           .   .   .   .   .   .   .   .   .   .   .   .   .   .   .   .   .   24
      3.2.1 Beam Emission Spectroscopy (BES) .           .   .   .   .   .   .   .   .   .   .   .   .   .   .   .   .   .   25
      3.2.2 Calorimeter with thermocouples . . .         .   .   .   .   .   .   .   .   .   .   .   .   .   .   .   .   .   30
      3.2.3 Mini-STRIKE calorimeter . . . . . .          .   .   .   .   .   .   .   .   .   .   .   .   .   .   .   .   .   31

4 Software for mini-STRIKE data analysis                                                                                     37
  4.1 Background subtraction . . . . . . . . . . . . .           .   .   .   .   .   .   .   .   .   .   .   .   .   .   .   37
  4.2 Perspective correction and data selection . . . .          .   .   .   .   .   .   .   .   .   .   .   .   .   .   .   38
  4.3 First fit: 2D single-peak fit . . . . . . . . . . . .      .   .   .   .   .   .   .   .   .   .   .   .   .   .   .   40
  4.4 Second fit: 2D multiple-peak fit . . . . . . . . .         .   .   .   .   .   .   .   .   .   .   .   .   .   .   .   40
  4.5 Further analysis: 2D fit to the peak amplitudes            .   .   .   .   .   .   .   .   .   .   .   .   .   .   .   42
  4.6 Relevant fit results . . . . . . . . . . . . . . . .       .   .   .   .   .   .   .   .   .   .   .   .   .   .   .   45

5 BATMAN beam properties characterisation                by      BES and                 mini-STRIKE                         47
  5.1 Influence of the RF power . . . . . . . . . .      . .     . . . . . .             . . . . . . . . .                   48
  5.2 Influence of the bias current . . . . . . . . .    . .     . . . . . .             . . . . . . . . .                   53
  5.3 Influence of the source pressure . . . . . . .     . .     . . . . . .             . . . . . . . . .                   58
  5.4 Influence of the acceleration voltage . . . . .    . .     . . . . . .             . . . . . . . . .                   65
  5.5 Influence of the perveance . . . . . . . . . .     . .     . . . . . .             . . . . . . . . .                   69
  5.6 Summary . . . . . . . . . . . . . . . . . . .      . .     . . . . . .             . . . . . . . . .                   72

6 Comparison of BES and mini-STRIKE                                                                                          75
  6.1 Divergence vertical profile . . . . . . . . . . . . . . . . . . . . . . . . . . .                                      75
  6.2 Divergence estimation by mini-STRIKE . . . . . . . . . . . . . . . . . . .                                             76
  6.3 Asymmetry on the vertical profile . . . . . . . . . . . . . . . . . . . . . . .                                        77

7 Conclusions                                                                                                                81
  7.1 Main results . . . . . . . . . . . . . . . . . . . . . . . . . . . . . . . . . . .                                     81
  7.2 Future developments . . . . . . . . . . . . . . . . . . . . . . . . . . . . . .                                        83

                                              I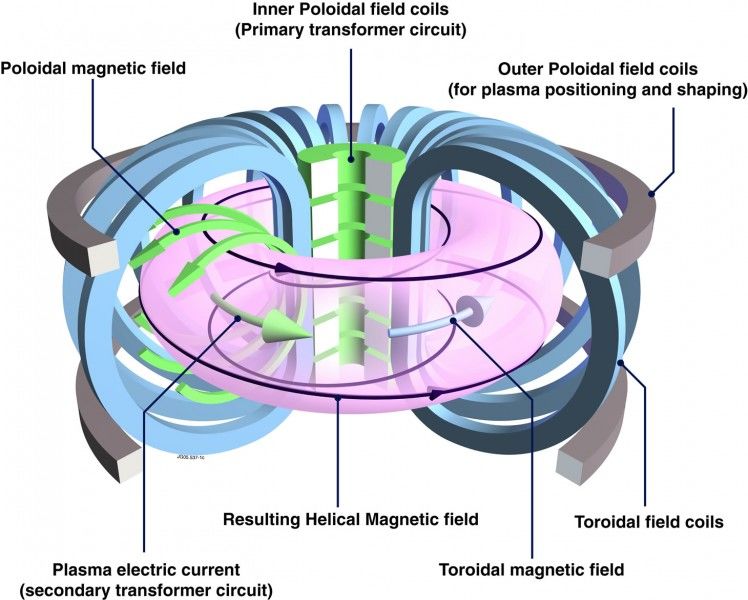
1       Introduction
   In this chapter, an introduction to nuclear fusion and ITER experiment is given, fo-
cusing on the neutral beam heating system.

1.1     A solution for energy problem: nuclear fusion and the way to
        ITER
    The energy problem is one of the most discussed topic in the last years: the increasing
energy demand due to overpopulation cannot be covered only by burning fossil fuels, hence
an alternative energy source has to be found, taking into account the increasing energy
demand and the problem of environment pollution. One of the candidates is the nuclear
fusion.

1.1.1    Nuclear fusion
    The research on nuclear fusion is focused on fusion of deuterium and tritium nuclei,
which show the highest cross section compared to other promising fusion reactions, as
shown in Fig. 1. Since additionally this reaction has an activation energy lower than the
other reactions, a temperature of 15 keV (≈ 108 K) is enough for fusion to happen with a
sufficiently high cross section [1].

Figure 1: Cross sections of various fusion reactions as a function of the kinetic energy of an
          incident deuterium atom or proton on a stationary target [1].

    The fusion reaction between deuterium and tritium nuclei is the following
                        2
                            D + 3 T → 4 He (3.5 MeV) + n (14.1 MeV)                       (1)
    While deuterium is available in the water, tritium is not present in a large quantity in
nature: it is not a stable isotope and has an half-life time of 12.3 years. It is so necessary
to create these nuclei inside the reactor, by means of the following reaction:
                       n + 6 Li → 4 He (2.05 MeV) + 3 T (2.75 MeV)                        (2)
    Lithium is widely available in the Earth’s crust and also in the oceans.

                                              1
1.1.2   Definition of plasma
    In a fusion reactor, matter is in the state of plasma: a high-temperature, partly or
fully ionised, quasi-neutral gas of charged particles (positive nuclei and negative electrons),
showing a collective behaviour. The quasi-neutrality implies the absence of macroscopic
concentration of charge, hence the density of positively and negatively charged particles
in a plasma is the same. Moreover, if a charge is inserted into the plasma, this charge
will be shielded from the rest of the plasma: for example if the charge is positive, in its
neighbourhood electrons will be attracted and ions repelled.
    The natural scale length λD , beyond which the shield effect takes place, is called Debye
length:
                                                     1
                                              0 kB Te 2
                                       λD =                                                 (3)
                                                ne2
where 0 is the permittivity of free space, kB is the Boltzmann constant, Te and e are the
electron temperature and charge respectively; n is the plasma density, corresponding to
the negative (and positive) charged particle density.

   Inside the Debye sphere of radius λD , charge neutrality is violated, but outside quasi-
neutrality prevailes if the number of charged particles ND within the Debye sphere satisfies
the following equation:
                                             4π
                                     ND = n λ3D  1                                     (4)
                                              3

    Another important parameter is the plasma frequency ωp,e , which corresponds to the
typical electrostatic oscillation frequency of electrons, in response to a small charge sepa-
ration:                                               1
                                                ne e2 2

                                       ωp,e =                                             (5)
                                                0 me
where ne and me are the electron density and mass, respectively.

1.1.3   Tokamak and ITER
    There are two different methods for producing controlled thermonuclear fusion power.
    One is based on inertial fusion energy, that is energy released by nuclear fuel when
compressed by many high intensity laser beams, irradiating uniformly a spherical shell
(for details, see [1]).
    The other candidate is represented by magnetic confinement devices. These devices
use a magnetic field to confine a plasma in the shape of a torus, in order to reduce the
losses of charged particles and trap them away from the inner walls. Charged particles in
the plasma in fact feel the magnetic field and gyrate around the magnetic field lines with
a radius rg , called Larmor radius, defined by
                                                m v⊥
                                         rg =                                              (6)
                                                |q| B

where v⊥ is the charged particle velocity perpendicular to the magnetic field B, and m
and q are the particle mass and charge, respectively.

                                                2
Two different general experimental designs are used for devices based on magnetic
confinement: tokamak and stellarator. In both of them the magnetic field lines wind
around the torus in a helical shape, due to the presence of two magnetic fields:
• a toroidal field, produced by coils that sorround the torus;
• a poloidal field, in the plane orthogonal to the toroidal field. For a tokamak (a
schematic view is shown in Fig. 2 on the left-hand side), this field is created by a
toroidal electric current that flows inside the plasma. This current is induced by
varying the current in the central solenoid on the axis of symmetry of the torus. For
this reason, the tokamak is a pulse device. For a stellarator (a sketch is displayed
in Fig. 3 on the right-hand side), the poloidal field is created by external helical
coils, which create also the toroidal magnetic field. As there is no induced current,
continuous operation is possible.
The poloidal field is necessary, because a purely toroidal magnetic field results in strong
particle drifts perpendicular to the magnetic field lines, affecting the plasma confinement.
Figure 2: Diagram illustrating the tokamak Figure 3: Sketch of the electromagnetic
principle: arrangement of magnetic coil setup of the Wendelstein 7-X
field coils and the resulting magnetic stellarator, under construction in
field that confines the plasma [2]. Greifswald (Germany) [3].
The first reactor-scale nuclear fusion experiment is the ITER tokamak (a sketch is
shown in Fig. 4), an international project under construction in Cadarache (France). ITER
will be based on deuterium-tritium reaction, in order to produce a plasma with the fusion
energy gain factor (Q value) larger than 10 [4]. The Q value is the ratio of the fusion power
produced by the reactor to the input auxiliary power required to sustain the reaction itself.
However, before the D-T experiment, experiments with hydrogen and deuterium separately
will be carried out.
The plasma will be confined by the magnetic field inside a vacuum vessel, consisting
of a double walled steel container. Outside the vacuum vessel, the toroidal and poloidal
field coils lie in the cryostat, where they are cooled and shielded from the neutrons of the
fusion reaction. In order to achieve superconductivity, all coils are cooled with supercritical
helium around 4 K [4].
3Figure 4: Design of ITER fusion reactor [4]. The man in the bottom-right part of the image gives
the idea of the machine size.
The current induced, as already mentioned, by increasing the current in the central
solenoid heats the plasma by ohmic heating. However the resistence connected to this cur-
rent decreases with the increasing temperature [5]. As a consequence, the ohmic heating
is limited and external heating methods are necessary to reach the temperature at which
fusion can occur.
Furthermore, in order to produce more power by nuclear fusion than the power neces-
sary to heat the plasma, some requirements have to be fullfilled. The Lawson criterion
(Eq. 7) establishes a threshold over which this condition occurs:
12 kB T
nτE ≥ (7)
Eα hσvi
where n, τE , T, Eα and hσvi are respectively the plasma density, the energy confinement
time, the plasma temperature, the energy of the alpha particle released by the fusion
reaction (for the D-T reaction in Eq. (1) this energy corresponds to 3.5 MeV) and the
reaction rate coefficient.
For the D-T reaction of Eq. (1), at the required temperature (T ≈ 15 keV), the
Lawson criterion becomes
nτE T ≥ 5 · 1021 m−3 keV s (8)
While sufficient plasma density (1020 m−3 ) and plasma temperature (15 keV) can be
reached, the energy confinement time in present day fusion experiments is too small (up to
around 1 s in JET experiment, in Culham, United Kingdom [2]). The energy confinement
time is connected to the size of the tokamak [6] and the ITER machine will be the first
to achieve an energy confinement time in the range of 4-6 s, thanks to its large dimensions.
The ITER main parameters are summarised in Tab. 1.
4ITER specifications Value
Fusion power 500 MW
Fusion power gain (Q) ≥ 10
Pulse duration 3600 s
Type of plasma D-T
Plasma major radius 6.2 m
Plasma minor radius 2.0 m
Plasma current 15 MA
Toroidal field at 6.2 m radius 5.3 T
Installed auxiliary heating:
- by neutral beam injection 33 MW
- by radio-frequency waves 40 MW
Plasma volume 830 m3
Plasma surface area 680 m2
Machine height 26 m
Machine diameter 29 m
Table 1: ITER parameters and operational capabilities [4].
1.2 Neutral beam heating
As already mentioned in the previous section, external heating systems are required
in order to reach the fusion temperature. These systems introduce also a non-inductive
current drive in the torus and this current makes continuous operation possible, sustaining
the poloidal field and enhancing the plasma confinement.
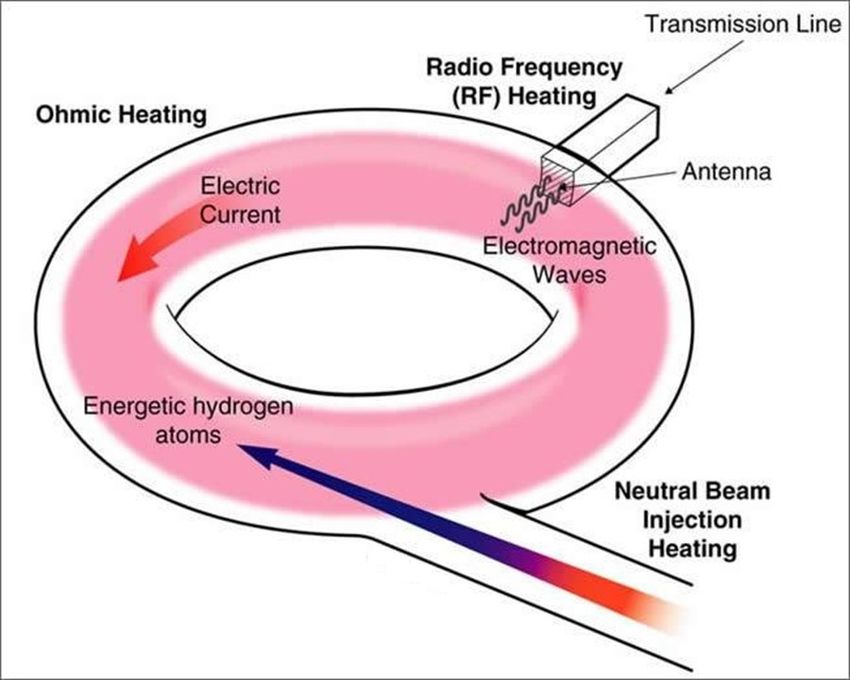
The plasma heating can be done in different ways, as shown in Fig. 5: by high-frequency
electromagnetic waves or by neutral beam injection.
The electromagnetic waves are generated outside the torus, then coupled into the
plasma. Propagating inside the plasma, the RF waves release their energy to the charged
Figure 5: Sketch of the ohmic heating, the Radio Frequency (RF) heating and the neutral beam
injection heating in a tokamak [4].
5plasma particles. The two resonance frequencies ω which will be used for the ITER heating
system are [4]:
• the ion cyclotron resonance, ω = eB
mi
, where e is the electron charge, B the magnetic
field and mi the ion mass. This frequency is in the range of 40-55 MHz;
• the electron cyclotron resonance, ω = m
eB
e
, where me is the electron mass. The elec-
tron cyclotron frequency in ITER is 170 GHz.
The second heating method consists in injecting high-energy atoms (hydrogen or deu-
terium) into the magnetically confined plasma.
To penetrate the magnetic field, these particles have to be neutral, in order to reach
the plasma and there be ionised. Considering a hydrogen beam, the possible interactions
with the plasma ions are charge exchange reaction, ionisation by ions and ionisation by
electrons, respectively [1]:
Hbeam + H+ +
plasma → Hbeam + Hplasma (9)
Hbeam + H+ + +
plasma → Hbeam + Hplasma + e
−
(10)
Hbeam + e− → H+
beam + 2 e
−
(11)
(12)
The decay of the neutral beam intensity Ibeam (x) inside the plasma is described by the
absorption law:
dIbeam
= −n σs Ibeam (13)
dx
hσe ve i
σs = σcx + σi + (14)
vbeam
where n, σcx , σi , hσe ve i and vbeam are the ion density, the charge exchange cross section,
the ionisation cross section by ions, the electron ionisation rate coefficient and
the beam
speed, respectively. The solution of Eq. (13) is given as Ibeam = I0 · exp − λx , where I0 is
the initial intensity of the beam and λ = nσ1 s the e-folding lenght of the beam attenuation.
In order to have a sufficient penetration depth of the beam in the plasma, the beam
energy has to be at least in the order of hundreds of keV [1]. The beam energy for ITER is
required to be about 1 MeV [7], in order to ensure an high efficiency non-inductive current
drive of high-energy particles (the current drive efficiency increases with particle energy)
and to supply 33 MW of heating power from two heating beamlines.
The main components of a Neutral Beam Injector (NBI) are displayed in Fig. 6. On the
right there is the beam source, where hydrogen or deuterium ions are created in a plasma
and then accelerated to the desired energy by an extractor/accelerator system. The ion
beam then goes to the drift region (that is the region just downstream the accelerator
system), where a fraction of the accelerated ions is neutralised by means of collisions with
the dedicated gas cell. A magnetic or electrostatic field (the latter is the case for ITER)
is placed after the neutraliser cell, in order to deflect the non-neutralised ions, which are
6Figure 6: Sketch of the Neutral Beam Injector for the JT-60U tokamak (Japan) [8]. The main
components are the negative ion source (on the right), where ions are created and
accelerated by an extractor/accelerator system; the drift region downstream the source,
where particles are neutralised, and the Residual Ion Dump (RID), which collects the
residual ions deflected by a magnetic field (or electrostatic field in the case of ITER),
before the beam reaches the plasma in the tokamak.
dumped by means of the Residual Ion Dump (RID) before reaching the plasma in the
tokamak.
The efficiency of the neutralisation process in an ion beam is a critical topic since it
determines the efficiency of the whole beam line. The efficiency is different for positive and
negative beams, as shown in Fig. 7: at energies higher than 100 keV, the neutralisation
efficiency for positive ions decreases rapidly to almost zero. Negative ion beams instead
have a neutralisation efficiency of 60 % even at higher energies, because of the low binding
energy of the electron (0.75 eV). For this reason, the negative ion source is the reference
source for the ITER NBI system.
Figure 7: Neutralisation efficiency of positive and negative ions as a function of their kinetic
energy [1].
1.3 ITER-relevant ion source parameters
The ITER heating system will consist of two heating neutral beams, injecting 16.5 MW
each. These will be based on the acceleration of negative hydrogen or deuterium ions, due
to their high neutralisation efficiency discussed in the previous section.
The required accelerated ion currents are 48 A at the energy of 0.87 MeV for H− ions
and 40 A at the energy of 1 MeV for D− ions, with pulse lengths up to one hour [9].
7In order to achieve these currents, the source has to deliver extracted negative ion
currents of 68 A for H− and 58 A for D− . These current values consider the stripping losses
in the accelerator: due to interactions between the negative ion beam and the background
gas in the accelerator, some ions are neutralised before reaching the full energy. This
process is called stripping. For ITER, the stripping losses are calculated to be nearly
30 % for a source filling pressure of 0.3 Pa [10]. The stripping probability in fact depends
strongly on the gas pressure, hence a low filling pressure in the source is required. For
ITER, this pressure has to be at most 0.3 Pa, representing a good compromise to have a
still high extracted current and a low stripping rate.
The ITER source will have a height of 1.9 m and a width of 0.9 m, and the beam will
be created by an acceleration system consisting of seven grids arranged one behind the
other. These grids have 1280 apertures each, with an aperture diameter of 14 mm. The
corresponding extraction area is 0.2 m2 . This implies a required extracted current density
of 340 A/m2 for H− and 290 A/m2 for D− .
Since not only negative ions are extracted, but also electrons, deflection magnets in
the grid system are used to prevent the full acceleration of the electrons. The deflected
co-extracted electrons hit one of the grids (the extraction grid, see Sect. 2.1.2) and the
deposition of power onto this grid becomes the real limit of operation and ions extraction.
For the ITER extraction system, the ratio between the co-extracted electron current and
the negative ion current is required to be one at maximum.
In ITER, the beam must have a divergence (which is an index of the beam opening) of
less than 7 mrad and an inhomogeneity of the extracted current density across the large
grid of less than 10 % in order to minimise transmission losses in the accelerator and in
the beam line.
The ITER requirements for NBI are summarised in Tab. 2.
Parameter ITER requirements
Source dimensions 1.9 × 0.9 m2
Source pressure 0.3 Pa
Extraction area 0.2 m2
Extracted current 58 A for D− beam
68 A for H− beam
Accelerated current 40 A for D− beam
49 A for H− beam
Electron content (je /jion ) ≤1
Pulse length 3600 s
Uniformity ±10 %
Divergence ≤ 7mrad
Table 2: ITER neutral beam system source requirements and parameters.
The development of negative ion sources is being carried out at Max-Planck Institut
für Plasmaphysik (IPP, Garching bei München, Germany). The ITER relevant current
densities at the required pressure and electron-to-ion ratio have been achieved in the
BATMAN (BAvarian Test MAchine for Negative ions) test facility, equipped with a
small extraction area (63 cm2 ) and operating with limited pulse length (4 s). A new
test facility has been recently constructed: ELISE (Extraction from a Large Ion Source
8Experiment) is an half-size ITER-like test bed and represents an intermediate step between
the small IPP source and the full size ITER source. ELISE has one of the largest existing
negative ion sources and can be operated for one hour.
The next step towards the full size ITER source and injector will be respectively the
test beds SPIDER (Source for the Production of Ions of Deuterium Extracted from an
RF plasma) [11] and MITICA (Megavolt ITER Injector and Concept Advancement) [12],
both under construction at Consorzio RFX (Padova, Italy). Their aim will be respectively
to test the full scale ITER-like NBI source, with a beam energy of 100 keV, and the whole
system at the required beam energy of 1 MeV.
92 Processes in a negative hydrogen ion source and beam
physics
In the following, the structure of the IPP prototype negative ion sources is described
and an introduction on the beam physics is given.
2.1 The RF source
The development of the negative hydrogen ion sources for ITER NBI was initially
concentrated on filamented arc sources, as described in the ITER reference design in
2002 [13, 14]: electrons are emitted from hot cathodes (usually tungsten filaments) and
then accelerated into the source body, where they create a plasma by ionisation of the
background gas. Because of sputtering, the tungsten filament lifetime is finite, so these
sources require regular manteinance (it is estimated to be about twice a year in the case
of ITER).
Taking into account this problem, the RF driven negative ion sources, developed and
optimased at IPP in the past years, were suggested as an alternative, and since 2007 the
IPP RF source is the reference design for the ITER NBI source [9]. In these sources an
oscillating electric field is induced by a RF coil, accelerating free electrons in the source
body and creating a plasma by ionisation. Compared to arc sources, RF sources require
less maintenance, since no filament is present. Additionally, since the cesium is needed to
enhance the source performance (see Sect. 2.1.1), in RF sources the cesium consumption
might be less than in the case of arc sources, because no filament material can bury the
cesium layer on the walls.
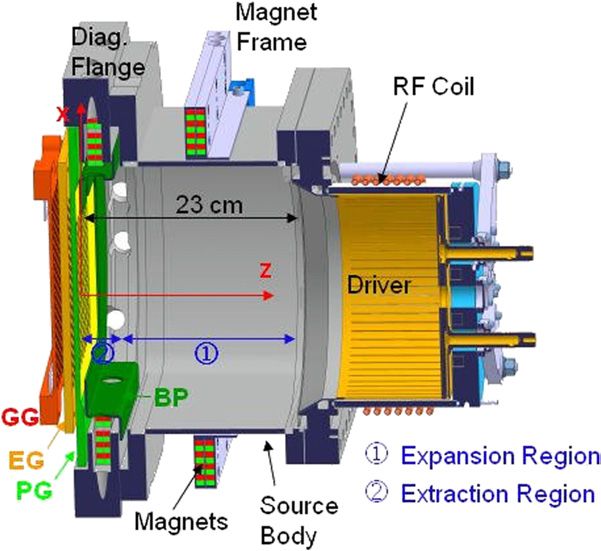
The IPP prototype source for negative ions consists mainly of three parts (shown in
Fig. 8):
• the driver, where the RF power is coupled to the plasma;
• the expansion region;
• the extraction region.
Figure 8: Schematic view of the IPP prototype RF source [15]. It consists of three regions: the
driver (on the left), the expansion region and the extraction region (on the right).
11The driver is mounted on the back of the source, and consists of a water-cooled RF
coil, connected to a 1 MHz oscillator and wound around an aluminum oxide cylinder. An
internal water-cooled copper Faraday screen protects the aluminum oxide cylinder from
the plasma. The plasma side of the Faraday screen is covered by a thin tungsten layer,
in order to reduce the rate of sputtering by the plasma. To ignite the plasma, a starter
filament is used, which is switched off around 100 ms after the plasma ignition. Typical
electron temperature and density values for hydrogen discharges are Te ≈ 10 eV and
ne ≈ 5 · 1018 m−3 in the driver [16].
In the expansion region, the plasma expands into the source body, cooling down the
electrons created in the driver to a temperature Te ≈ 1 eV near the extraction region,
in order to reduce the probability of destruction of negative ions by electron impact (see
Sect. 2.1.1) and to limit the amount of electrons (ne ≈ 5 · 1017 m−3 near the extraction
region) [16]. The cooling-down from the expansion region is further assisted by a magnetic
filter field, which separates the expansion and the extraction region.
The source is kept at high potential (for the BATMAN test facility, this potential is
around −20 kV).
The negative ions, H− and D− , are created in the source by volume and surface pro-
cesses (described in the next section), and then extracted and accelerated. As already
mentioned, the region downstream the ion source is called drift region. Here the ion beam
is partially neutralised and several diagnostic systems are mounted in the tank downstream
the negative ion source in order to study the beam properties.
Deuterium operation is possible for a limited integrated length pulse because fast deu-
terium particles can react with deuterium embedded in beam line components and thus
produce neutron radiation (for safety reason, a maximum threshold of produced neutrons
cannot be overcome).
2.1.1 Creation of negative hydrogen ions
Creation of negative hydrogen ions can occur via volume or surface processes.
The volume processes are due to dissociative attachment of electrons to highly vibra-
tionally excited hydrogen molecules in their electronic ground state:
H2 + e− → H2 (v)+e− (15)
H2 (v)+e− → H− −
2 → H +H
0
(16)
where v is the vibrational excitation level and H2 (v) is the vibrationally excited hydrogen
molecule, produced by the reaction in Eq. (15).
In the surface processes, instead, atoms or positive hydrogen ions interact with the
surface of the first grid of the extraction system and are converted into negative ions:
H, H+ + e−
surface → H
−
(17)
The reaction rate of this convertion process is strongly increased for a low surface work
function. In the negative hydrogen ion source for ITER NBI, the work function of the
surface is kept low by coating the surface with cesium.
Volume processes permit to avoid the use of cesium, whose distribution is governed
by plasma and is difficult to predict. However, at the required pressure of 0.3 Pa in the
12source, the negative ion current due to only volume processes is much below the ITER
requirements [15] and the ratio of co-extracted electrons to extracted negative hydrogen
ions is consequently high. Thus, the surface process has to be exploited.
Two volume reactions dominate the destruction of negative hydrogen ions, which have
a binding energy of the electron of 0.75 eV: mutual neutralisation (Eq. 18) and electron
detachment (Eq. 19). The reaction rate for the latter process depends on the temperature
of the electrons [17].
H− + H+ → H + H (18)
e− + H − → 2 e − + H (19)
The latter reaction is dominant above Te ≈ 2 eV. As already mentioned, a magnetic
filter field is used to separate the expansion region from the extraction zone near to the
plasma grid, as shown in Fig. 8, in order to cool down the electron temperature and to
limit the number of co-extracted electrons. Electrons feel the magnetic field and gyrate
around the field lines with the Larmor radius given by Eq. (6) (see Sect. 1.1.3); they can
pass the magnetic filter field in axial direction by Coulomb collisions with a cross section
σCoul depending on their velocity. In fact, the collision frequency νc , correlated to the
velocity by νc ∝ v −3 [18], is given by the following equation:
νc = n σCoul v (20)
where n and v are respectively the electron density and velocity. As a consequence,
σCoul ∝ v −4 and cold electrons are favoured in accessing the extraction region.
The magnetic filter field is of the order of 5-10 mT near the plasma grid, and causes
drifts in the plasma. The most relevant one is the E ~ ×B ~ drift (where E~ is the electrical
field present in the plasma due to local variation of the plasma potential along the axial
axis), and the plasma can become inhomogeneus [19].
Downstream the magnetic filter field, mutual neutralisation becomes the main destruc-
tion process of negative ions. The survival length of the negative ions in the source plasma
is in the order of a few centimeters, so only ions created in the vicinity of the plasma
grid can be extracted. As the electrons in this region have a lower temperature, the mean
free path of negative hydrogen ions increases to few tens of centimeters [20]. As already
mentioned, to maximise the amount of negative hydrogen atoms, a thin and homogeneous
cesium layer covers the first grid of the extraction system, in order to reduce the work
function to approximately 2 eV [21].
Cesium is released by an oven mounted in the back side of the source body (as shown in
Fig. 8). The oven nozzle penetrates a few centimeters into the source body and cesium is
dispensed continuously during and between discharges. The evaporation rate is controlled
by the oven temperature (130-150 °C). Cesium appears to accumulate in the source body
in those areas where there is less contact between the plasma and the source wall, hence
the cesium redistribution is governed by the plasma itself.
For stable operation, the temperature of the source wall is kept typically around 35 °C,
above the cesium melting point (28 °C). The temperature of the plasma grid, instead, is
above 120 °C, because for such temperatures experimentally higher source performances
have been observed [15].
132.1.2 Extraction region
The extraction and acceleration of the negative ions is done at the IPP test facilities
using three grids [22]:
• the plasma grid (PG);
• the extraction grid (EG);
• the grounded grid (GG).
Every grid has many apertures, whose diameter is typically in the range of 3-14 mm.
The extracted negative ions passing through one plasma grid aperture create a beamlet
and the beam consists of all the beamlets exiting from the grid system.
The boundary region between the plasma and where the charged particles feel the
extraction voltage is called meniscus. It is defined as the surface with a potential of zero
with respect to the source. The shape of the meniscus is a convex lens, which determines
the initial beamlet quality.
The grid system currently in use at the BATMAN test facility is the Large Aperture
Grid (LAG): the distance between the plasma grid and the extraction grid is about 3 mm
and the aperture diameter is 8 mm. These two features are really relevant for the beam
optics, as it will be described in Sect. 2.2.
The EG and GG are made of copper, because copper
can receive a huge amount of heat when suitably cooled,
thanks to its high heat conductivity. The PG instead is
made of molybdenum (or is only covered by molybdenum),
in order to avoid copper release by sputtering that could
contaminate the cesium layer, increasing this way the work
function introduced in the previous section.
The plasma grid has more or less the same high poten-
tial as the ion source (∼ −20 kV) [23]. The PG apertures
are chamfered in order to enhance the extraction rate of
negative ions, increasing the area available for surface pro-
cesses to take place and giving the ions a higher chance to
be emitted in the direction of the accelerator downstream
the source [24].
As already mentioned, not only negative ions, but also
electrons are extracted. In order to decrease the amount of
co-extracted electrons, the plasma grid is biased positively
against the source body (10-20 V). The beneficial effect is
more pronounced by introducing an additional plate (bias
Figure 9: Picture of the plasma
plate, BP) in front of the plasma grid in the plasma side,
grid in the BATMAN
test facility, with the which is electrically connected to the source walls: it de-
chamfered apertures creases the biased area by extending the source potential
and the bias plate in near the apertures [25]. However, also the amount of ex-
front of the PG. tracted negative hydrogen ions is slightly decreased by the
bias voltage.
The plasma grid and the bias plate of the BATMAN
test facility are displayed in Fig. 9.
14Figure 10: Schematic of the magnetic field structure in the extraction region [24]. The magnetic
filter field is perpendicular to the deflection field, created by the embedded magnets
in the extraction grid.
The extraction grid is equipped with embedded CoSm magnet rods with alternating
magnetisation, in order to deflect the co-extracted electrons out of the accelerated beam.
Due to the presence of these magnets, the extraction grid is quite thick (∼ 10 mm). The
deflection field lines so created are perpendicular to the magnetic filter field ones.
A schematic view of the plasma and the extraction grids and of the magnetic confi-
guration in that region is displayed in Fig. 10. A simulation of negative ion and electron
trajectories is then shown in Fig. 11: the electrons hit the extraction grid due to the deflec-
tion field, while the negative hydrogen ions are accelerated to the drift region downstream
the grounded grid.
The potential difference applied between the plasma grid and the extraction grid (ex-
traction voltage, Uex ) is typically of 5-10 kV, in order to keep the power deposited by
the co-extracted electrons on the extraction grid on an acceptable level (below 25 kW at
BATMAN). This is the main technical limitation of negative ion sources, because it limits
also the amount of the extracted ion current.
Figure 11: Calculated trajectories of electrons and negative hydrogen ions, at 9.6 kV extraction
voltage and 16.8 kV acceleration voltage. The geometry system corresponds to the
one used in the BATMAN test facility [22].
15The grounded grid is at zero potential and the second voltage gap (acceleration voltage,
Uacc ) between extraction and grounded grid is usually in the BATMAN test facility about
8-15 kV, hence the total voltage is in the range of 15-25 kV.
2.2 Beam physics
The optic properties of the beamlets and thus also of the complete beam depend on
the space charge distribution and on the electric and magnetic fields in the extraction
system [26].
An important parameter to describe the beam optics is the perveance Π, defined by
the following formula [27]:
Iex
Π = 3/2 (21)
Uex
where Iex is the extracted current and Uex is the extraction voltage.
It is also possible to define a maximum perveance Π0 (Eq. 23), since the maximum
possible extracted current Iex
max
is limited by the Child-Langmuir law, because of the space
charge of the beamlet [28, 29]:
r
4 2 e r 2 3/2
max
Iex = π0 Uex (22)
9 m d
r
max
Iex 4 2 e r 2
Π0 = 3/2
= π0 (23)
Uex 9 m d
where 0 , e, m, r and d are respectively the permittivity of free space, the electron charge,
the particle mass, the radius of the aperture and the distance between the plasma grid
and the extraction grid. As a consequence, Π0 depends only on the grid characteristics
and on the effective mass of the ion species.
To describe the beam optics, as reference parameter the normalised perveance Π/Π0
is applied, due to its correlation with the beamlet divergence, which is an index of the
beamlet opening caused by the space charge expansion. Assuming that the distribution of
the angles between the beam axis and the velocity vector of the beam particles after the
extraction system is a Gaussian distribution1 with standard deviation σ, the divergence
angle is defined as: √
= 2σ (24)
Generally, the beamlet divergence depends on the perveance (hence on the extracted
current and the extraction voltage) and on the ratio of the extraction to the acceleration
voltage (Eq. 25) in a three-grids extraction system.
Uex
= Π/Π0 , (25)
Uacc
The optimum normalised perveance condition is reached when the divergence is at
its minimum value: with increasing Π/Π0 , the divergence decreases (this region is called
(x−m)2
1
Gaussian distribution: √1 e− 2σ 2
σ 2π
16under-perveant region) reaching its minimum (at normalised perveance between 0.1 and
0.2 in the BATMAN test facility), then it increases again (over-perveant region). In the
example in Fig. 12, the typical trend of the divergence as a function of the normalised
perveance is displayed. Experiments with nomalised perveance beyond the optimum value
are difficult because of technical limitations which do not allow to obtain a very large
extracted ion current, otherwise also the co-extracted electron current would increase too
much, overcoming the safety limits on the load of the extraction grid by the co-extracted
electrons.
Figure 12: Typical trend of the beamlet divergence as a function of the normalised perveance.
The measurements have been carried out in the BATMAN test facility. The divergence
has been estimated by the beam emission spectroscopy diagnostics (see Sect. 3.2.1).
As the extraction system can be considered as a system of electrostatic lenses, the nor-
malised perveance is connected to the focus point of the single beamlet. This explains also
the dependence of the divergence on the normalised preveance: a bad optics is correlated
to a large divergence, as shown in Fig. 13 [30].
The beamlet divergence depends also on the onset of the space charge compensation.
The repulsive force caused by the negative space charge of the beamlet leads to a continuous
Figure 13: Sketch of the beamlet shape for three different cases: when the focus point is too close
to the plasma grid (a) and when it is downstream the extraction grid (c), the beamlet
has a bad optics and shows a big broadening. In (b) the focus point is nearby the
extraction grid, and this is correlated to a good optics [30].
17increase of the beamlet divergence. This increase is stopped by space charge compensation
downstream the extraction system, when the creation of slow positive ions in the drift
region occurs mainly due to the interaction between neutrals H0 or negative ions H− and
the background gas:
H0 ionisation : H0 + H2 → H+ + e− + H2 (26)
H2 ionisation : H0 + H2 → H0 + e− + H+
2 (27)
H− double stripping : H− + H2 → H+ + 2 e− + H2 (28)
An attractive force is therefore created and the beamlet broadening is reduced [31].
The space charge compensation fully sets in at a certain distance downstream the grounded
grid. This distance depends on the tank pressure and simulations show that it is in the
range of 10-15 cm [23]. However, this phenomenon is still under investigation.
Since negative hydrogen ions have an electron binding energy of only 0.75 eV, they
are easily neutralised by collisions with the residual gas not only in the drift region, but
also in the extraction region before reaching their full energy [32]. The stripping depends
strongly on the gas pressure. Hence in order to minimise the stripping losses, it is neces-
sary to minimise the pressure, and this is the reason why one requirement for the ITER
NBI system is a source filling pressure below 0.3 Pa. At this pressure, the stripping losses
for the ITER NBI system are forseen to be about 30 % [10].
Fig. 14 represents an illustration of the extraction system, with the trajectories of
negative ions, stripped particles and neutrals.
Figure 14: Sketch of the extraction system with trajectories of negative ions, stripped electrons
and neutrals [33].
For a negative hydrogen ion beam, the stripping reactions are:
H− stripping : H− + H2 → H0 + e− + H2 (29)
H− double stripping : H− + H2 → H+ + 2 e− + H2 (30)
The fraction of stripped particles can be calculated by a simple 1D model, taking into
account the neutral density profile n(x) obtained from the local pressure and temperature
of the gas along the beamlet axis [33]:
Z x=xGG
fs (xGG ) = 1 − exp − n(x) · σstrip E(x) dx (31)
x=0
18Figure 15: Cross section for the stripping reaction in Eq. (29) as a function of the H− energy [34].
where xGG is the position of the grounded grid (the origin of the beamlet axis corresponds
to the plasma grid position) and σstrip is the cross section of the reaction in Eq. (29) and
depends on the local particle energy E(x), as shown in Fig. 15.
Thus, the amount of stripping losses depends on:
• the particle energy, hence on the extraction and the acceleration voltage;
• the tank and the source pressure, because the stripping losses are correlated to the
neutral density profile.
193 IPP test facility: BATMAN
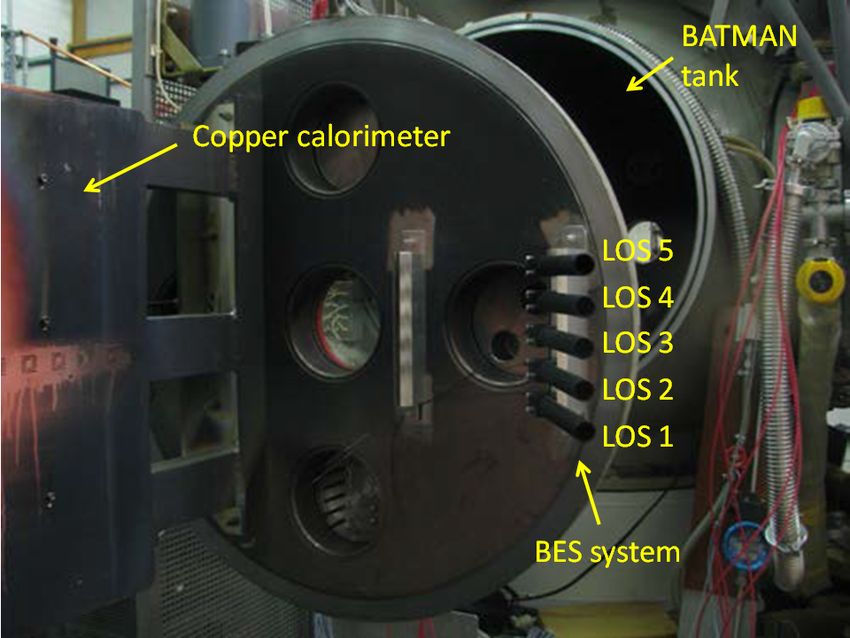
In the following section, the IPP prototype source installed in the BATMAN (BAvarian
Test MAchine for Negative ions) test facility and the diagnostic tools mounted in the
tank of BATMAN for the beam investigation are described.
3.1 Description of the ion source
BATMAN is a small test bed at IPP, mainly devoted to optimise the IPP prototype RF
source with respect to the extracted current density, at pressure and co-extracted electron
current density at ITER relevant parameters. The BATMAN test bed is also used for the
development of new diagnostic tools and in order to get a better understanding of plasma
and beam behaviour.
BATMAN is equipped with an IPP prototype negative ions source, consisting of, as
already mentioned, a 150 mm long aluminum oxide cylinder, with an inner diameter of
235 mm and a water-cooled RF coil connected to a 1 MHz oscillator. Typical power of
the RF coupled to the plasma is in the range of 20-100 kW. BATMAN is operating with
short pulses (∼ 4 s), because of limitations of the high voltage power supply and the low
pumping speed of the titanium-getter pumps in the main vacuum tank [15, 35].
A cesium oven is mounted on the back side of the source and is stored in three capsules.
Cesium is introduced into the source continuously at a rate of typically 10 mg/h and
the evaporation rate is controlled by the oven temperature (usually this temperature is
160 °C) [15].
The source body has an area of 0.32 × 0.59 m2 and is 0.23 m deep, and the typical
range of the filling pressure is 0.2-1 Pa. Since by coupling of the RF into the pressure
measurement device, the result of the pressure measurement may be disturbed during the
pulse, the pressure is calibrated before the operation by means of the gas flow (which is
the parameter set for operation) through the pump valve.
As already mentioned, the source is at high potential (∼ −20 kV), as well as the plasma
grid. The two voltage gaps among the grids are typically in the range of 5-10 kV for the
extraction voltage and 8-15 kV for the acceleration voltage. The plasma grid is positively
biased of 10-20 V and the bias power supply is current controlled.
The magnetic filter field in BATMAN is created by permanent magnets, which origi-
nally were embedded internally in the diagnostic flange near the plasma grid. This way,
the axial distance of the center of the magnets (i.e. the maximum of the filter field) from
the plasma grid was z = 3 cm (where z is the distance from the PG), but this configura-
tion had no flexibility [20]. Hence a new magnet frame, consisting of two magnets boxes,
was mounted outside the source body, allowing fast changes of the magnetic filter field
configuration.
This frame can be moved continuously along the source body, from the diagnostic
flange (corresponding to the closest position to the plasma grid: z = 9 cm) up to the
driver exit (z = 19 cm). The two magnets boxes are attached to the sides of the source
body and are filled each with 2 × 4 CoSm magnets (with dimensions 9 × 13 × 50 mm3
and a maximum magnetic strength of 1 T). With this configuration, the magnetic filter
field is horizontal and its maximum strength (at the centre of the plasma grid) is about
7 mT. Additionally, the magnet boxes can be exchanged, in order to change the horizontal
magnetic field direction by 180°. As a consequence, also the drift of the plasma changes
21Figure 16: Horizontal section cut of the IPP prototype source attached to the BATMAN test
facility [20]. The magnet positions are indicated. The z-axis starts from the centre of
the plasma grid.
its direction (plasma drift can be up or down, accordingly to the rigth-hand rule) and a
different top/bottom asymmetry can be seen in the plasma.
An illustration showing the horizontal section cut of the IPP prototype source in the
BATMAN test bed is presented in Fig. 16. The diagnostic flange and the magnet frame
for the permanent magnets are indicated too.
Currently, the extraction system used at BATMAN is based on the LAG (Large Area
Grid) system, with a distance between plasma and extraction grids of 3.5 mm. The
PG is shown in Fig. 9 (in Sect. 2.1.2) and consists of two identical grid halves with 63
chamfered apertures each and inclined by 0.88° for beam focusing reasons. The apertures
are displaced in six rows with alternating 11 or 10 apertures, with an aperture diameter of
8 mm; hence the total extraction area is 63.33 cm2 . The distance between the centres of
two apertures in the horizontal direction is 11.6 mm and the vertical distance is 11.9 mm.
The PG is heated by heating wires connected to an external power supply, and the
plasma grid temperature is chosen by the user.
In the drift region, the extracted and accelerated ions hit a calorimeter 1.5 m down-
stream the GG (details in Sect. 3.2.2).
The electrical currents flowing onto the extraction and the grounded grid (IEG and IGG ,
respectively) and the total current flowing back to the High Voltage (HV) power supply
(Idrain ) are measured. It can be reasonably well assumed that for good beam optics negative
ions do not hit the extraction grid, thus the current measured on the extraction grid IEG
is almost completely due to the electron contribution [15]. Analogously, the currents
from the grounded grid IGG and from the calorimeter should be carried by the extracted
negative ions, with a negligible contribution by electrons. Since the two latter currents are
measured separately, the distribution of the negative ions hitting the grounded grid and the
calorimeter can be determined: 10-20 % of Iion is stopped on the grounded grid, depending
on the beam optics (hence on the perveance), and 70-80 % hits the calorimeter. The current
densities then are calculated by dividing the respective currents by the extraction area.
22Figure 17: Sketch of the high voltage (HV) circuit of the BATMAN test facility [15]. IEG and
Iion are the electron and ion currents, respectively.
In order to preserve the safety of the extraction grid, the power deposited by the
electrons onto the EG in the BATMAN test bed is limited to 25 kW. As a consequence,
also the obtainable ion current density and the source performance are limited. Thus
an important operational parameter is the electron-to-ion ratio, given by the ratio of the
electron current IEG and the ion current Iion .
A schematic overview of the electrical circuit of BATMAN is shown in Fig. 17. The
currents are also indicated.
The normal duty cycle of the source at BATMAN is one shot every four minutes and,
during the shot, the beam is extracted for 4 s. Additionally, there is a delay between
RF switching on and the beam extraction of 1500 ms, in order to allow the plasma in
the source to stabilise. In order to facilitate spectroscopic measurement there are further
100 ms after the high voltage is removed and before the RF is terminated. The time trace
is shown in Fig. 18.
BATMAN achievements are summarised in Tab. 3, together with the ITER require-
ments: it can be seen that the current densities and the electron-to-ion ratio satisfy the
ITER requirements. However, BATMAN can operate only with short pulses, and the
Figure 18: Sketch of the time trace for a typical pulse at BATMAN. Plasma line (in blue) corre-
sponds to the switching on of the RF power. Beam line (in red) corresponds to the
switching on of the high voltage.
23extraction area is only of 63 cm2 .
Parameter ITER requirements BATMAN achievements
Extraction area 0.2 m2 0.0063 m2
Calorimetric current density 200 A/m2 D− 230 A/m2 D−
280 A/m2 H− 330 A/m2 H−
Extraction voltage 9 kV 9 kV
Source pressure 0.3 Pa 0.3 Pa
Electron content (je /jH− ) ≤13.2.1 Beam Emission Spectroscopy (BES)
For studying the beam properties in BATMAN, the hydrogen Balmer emission line Hα
(corresponding to the transition from n = 3 to n = 2, where n is the principal quantum
number) is considered, because of its larger emissivity compared to the other hydrogen
emission lines [36].
Excited hydrogen atoms are created by collisions of the ion beam with the residual
gas. The main reactions are:
H− excitation : H− 0 −
f + H2 → Hf (n = 3) + e + H2 (32)
H0 excitation : H0f + H2 → H0f (n = 3) + H2 (33)
Dissociative excitation : H0f + H2 → H0f + 2 H0s (n = 3) (34)
where the indices f and s denote respectively fast and slow particles.
The subsequent de-excitation of the excited hydrogen by spontaneous emission to n = 2
results in the Hα Balmer emission line radiation.
The wavelength λ0 of an emission line, from the excited level a to the lower level b,
depends on the emitted photon energy, hence on the energy gap between the two levels:
hc
λ0 = (35)
Ea − Eb
where h is the Planck constant and c is the speed of light in vacuum. This parameter for
Hα is 656.28 nm.
Because of the presence of fast particles, the wavelength of the emitted photons for the
reactions in Eqs. (32) and (33) can be shifted with respect to the wavelength λ0 , calculated
from Eq. (35). On the contrary, the reaction in Eq. (34) creates slow particles, hence the
radiation emitted from these particles is not affected by Doppler effect.
The Doppler wavelength shift ∆λ depends on the velocity v0 of the particles, hence
on the energy they gather during the acceleration in the extraction region, and on the
observation angle θ, shown in Fig. 20:
v0
∆λ = λ0 cosθ (36)
c
r
2Ue
v0 = (37)
mion
Figure 20: Illustration of a BES line-of-sight. θ is the observation angle between beam axis and
LOS. Courtesy of B. Ruf (IPP).
25where U is the voltage accelerating the particle, e is the electron charge and mion is the
particle mass [37].
However, not all the particles are fully accelerated. As described in Sect. 2.2, about
30 % of the extracted particles are foreseen to be affected by stripping in the NBI system
for ITER. In the BATMAN test facility, the stripping fraction is expected to be 8 %. This
value is different from the ITER one because in the ITER NBI the acceleration length is
larger (there will be seven grids instead of three).
Thus, in a BES spectrum taken at a negative hydrogen ion source (an example is
shown in Fig. 21), three peaks are seen [33]: the first one (1) is the Hα unshifted peak at
λ0 = 656.28 nm, due to reaction in Eq. (34). Peak (2) is the Doppler-shifted peak and is
due to the fast neutrals having the full accelerated energy E0 , corresponding to the total
beam energy (15-25 keV for BATMAN). Peak (3) is called stripping peak and represents
photons emitted by neutrals that have less than the full energy, so it is always in between
the two peaks previously described (typically the position of the maximum corresponds
to the particle energy Eex associated to the extraction voltage, which is in the range of
5-10 kV for BATMAN).
Figure 21: Typical Hα Doppler-shift spectrum for a negative hydrogen ion beam [33].
The standard evaluation of a BES spectrum allows to estimate the beam divergence
and the stripping fraction. The observation angle changes along the line-of-sight, because
of the divergence of the beamlets (see Fig. 20); as a consequence, the Doppler-shifted peak
has a bell-shaped profile, and its width is correlated to the divergence of the beamlets
by the formula [33]:
λ1/2 e
= (38)
∆λ tanθ
where ∆λ is the Doppler shift calculated via Eq. (36), θ is the observation angle and λ1/2 e
is the measured half 1/e width of the Doppler peak fitted by a Gaussian (considering only
the part of the peak above 30 % of the maximum peak value in the case of the standard
evaluation technique). This width is corrected from other effects leading to additional
broadening, like the apparatus profile of the spectrometer and the aperture angle of the
line-of-sight. This divergence estimation represents to an averaged beamlet divergence
along the line-of-sight.
26You can also read