Activation of regulatory T cells triggers specific changes in glycosylation associated with Siglec-1-dependent inflammatory responses version 1; ...
←
→
Page content transcription
If your browser does not render page correctly, please read the page content below
Wellcome Open Research 2021, 6:134 Last updated: 11 JUN 2021

RESEARCH ARTICLE

Activation of regulatory T cells triggers specific changes in
glycosylation associated with Siglec-1-dependent
inflammatory responses [version 1; peer review: awaiting
peer review]
Gang Wu 1, Gavuthami Murugesan1, Manjula Nagala1, Alex McCraw1,
Stuart M. Haslam2, Anne Dell2, Paul R. Crocker 1
1Division of Cell Signalling and Immunology, School of Life Sciences, University of Dundee, Dundee, Scotland, DD1 5EH, UK
2Department of Life Sciences, Imperial College London, London, SW7 2AZ, UK

v1   First published: 01 Jun 2021, 6:134                                         Open Peer Review
     https://doi.org/10.12688/wellcomeopenres.16834.1
     Latest published: 01 Jun 2021, 6:134
     https://doi.org/10.12688/wellcomeopenres.16834.1                            Reviewer Status AWAITING PEER REVIEW

                                                                                 Any reports and responses or comments on the

Abstract                                                                         article can be found at the end of the article.
Background: Siglec-1 is a macrophage lectin-like receptor that
mediates sialic acid-dependent cellular interactions. Its upregulation
on macrophages in autoimmune disease was shown previously to
promote inflammation through suppressing the expansion of
regulatory T cells (Tregs). Here we investigate the molecular basis for
Siglec-1 binding to Tregs using in vitro-induced cells as a model
system.
Methods: Glycosylation changes that affect Siglec‑1 binding were
studied by comparing activated and resting Tregs using RNA-Seq,
glycomics, proteomics and binding of selected antibodies and lectins.
A proximity labelling and proteomics strategy was used to identify
Siglec-1 counter-receptors expressed on activated Tregs.
Results: Siglec-1 binding was strongly upregulated on activated Tregs,
but lost under resting conditions. Glycomics revealed changes in N-
glycans and glycolipids following Treg activation and we observed
changes in expression of multiple ‘glycogenes’ that could lead to the
observed increase in Siglec-1 binding. Proximity labelling of intact,
living cells identified 49 glycoproteins expressed by activated Tregs
that may function as Siglec-1 counter-receptors. These represent ~5%
of the total membrane protein pool and were mainly related to T cell
activation and proliferation. We demonstrate that several of these
counter-receptors were upregulated following activation of Tregs and
provide initial evidence that their altered glycosylation may also be
important for Siglec-1 binding.
Conclusions: We provide the first comprehensive analysis of glycan
changes that occur in activated Tregs, leading to recognition by the
macrophage lectin, Siglec-1 and suppression of Treg expansion. We

                                                                                                                           Page 1 of 24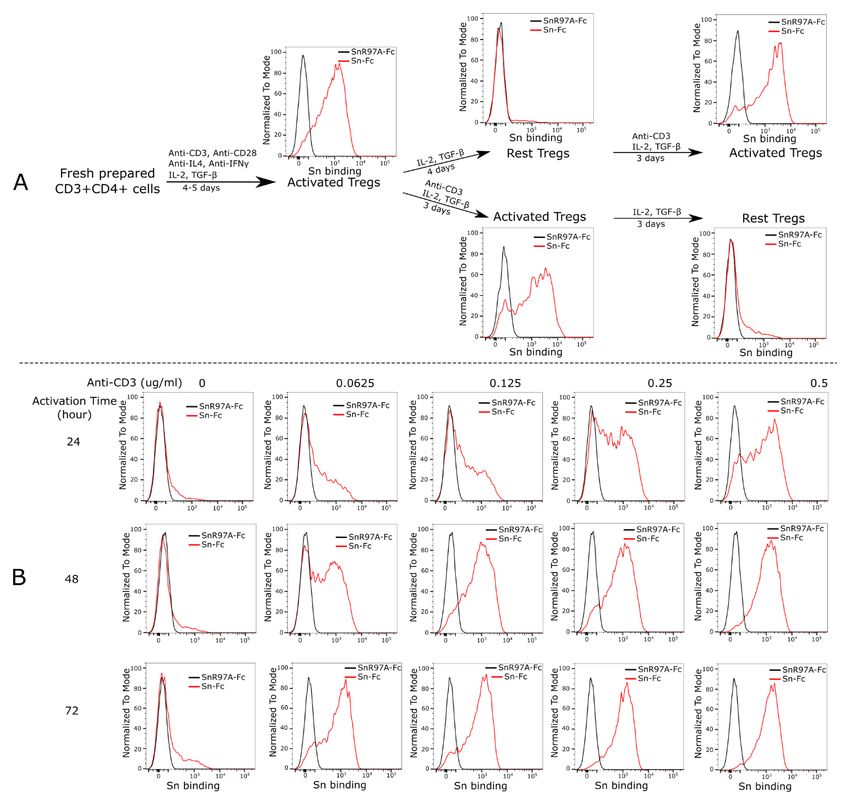
Wellcome Open Research 2021, 6:134 Last updated: 11 JUN 2021

furthermore provide insights into glycoprotein counter-receptors for
Siglec-1 expressed by activated Tregs that are likely to be important
for suppressing Treg expansion.

Keywords
Regulatory T cell, macrophage, inflammation, sialic acid, glycomics,
proteomics

 Corresponding author: Paul R. Crocker (p.r.crocker@dundee.ac.uk)
 Author roles: Wu G: Conceptualization, Data Curation, Formal Analysis, Investigation, Methodology, Software, Visualization, Writing –
 Original Draft Preparation, Writing – Review & Editing; Murugesan G: Investigation, Writing – Review & Editing; Nagala M: Investigation,
 Writing – Review & Editing; McCraw A: Investigation, Writing – Review & Editing; Haslam SM: Funding Acquisition, Writing – Review &
 Editing; Dell A: Funding Acquisition, Writing – Review & Editing; Crocker PR: Conceptualization, Funding Acquisition, Project
 Administration, Supervision, Writing – Original Draft Preparation, Writing – Review & Editing
 Competing interests: No competing interests were disclosed.
 Grant information: This work was supported by Wellcome Trust Investigator Award (103744) to P.R.C. Glycomics analysis was
 supported by the Biotechnology and Biological Sciences Research Council, grant number BB/K016164/1.
 The funders had no role in study design, data collection and analysis, decision to publish, or preparation of the manuscript.
 Copyright: © 2021 Wu G et al. This is an open access article distributed under the terms of the Creative Commons Attribution License,
 which permits unrestricted use, distribution, and reproduction in any medium, provided the original work is properly cited.
 How to cite this article: Wu G, Murugesan G, Nagala M et al. Activation of regulatory T cells triggers specific changes in
 glycosylation associated with Siglec-1-dependent inflammatory responses [version 1; peer review: awaiting peer review]
 Wellcome Open Research 2021, 6:134 https://doi.org/10.12688/wellcomeopenres.16834.1
 First published: 01 Jun 2021, 6:134 https://doi.org/10.12688/wellcomeopenres.16834.1

                                                                                                                                 Page 2 of 24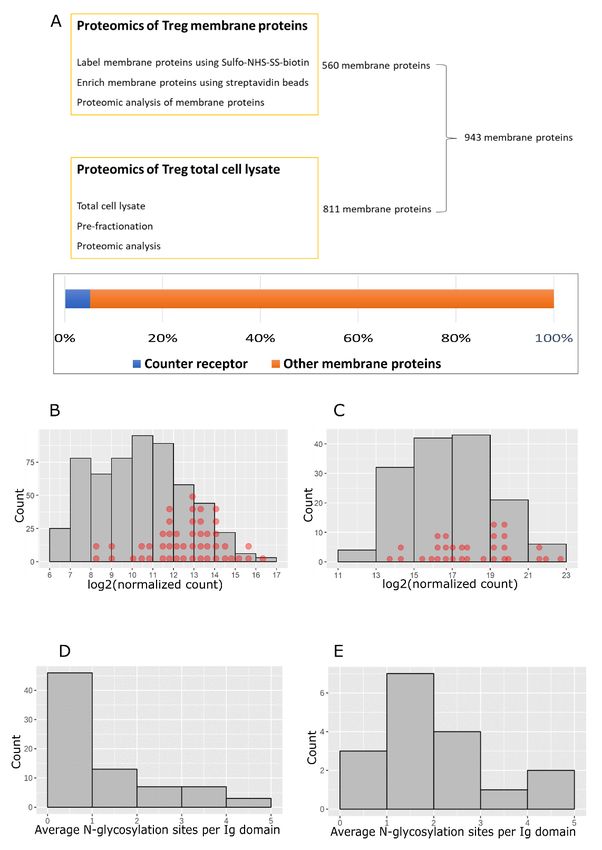
Wellcome Open Research 2021, 6:134 Last updated: 11 JUN 2021

Introduction                                                           manner. Similar results have been observed in a mouse model
All mammalian cells are coated with a dense layer of gly-              of neuronal ceroid lipofuscinoses, which showed that
cans termed the glycocalyx1. Despite the diverse structures            Siglec-1 negatively controls CD8+CD122+ regulatory T cells,
and inherent complexity of these glycans, they are frequently          and promotes neuroinflammation-related disease progression11.
capped with sialic acid moieties. Sialic acids can mediate a
wide variety of functions2, but an important feature is that           A major gap in our understanding of how Siglecs modulate cel-
they serve as ligands for a family of endogenous sialic acid           lular functions in the immune system is the identification of
binding lectins of the Ig superfamily known as Siglecs3. The           endogenous ligands and counter-receptors on relevant cell
interaction between Siglecs and their ligands can regulate the         populations. Here, the ligand is defined as the oligosaccha-
functional activities of most cells of the immune system3,4.           ride structure recognised by Siglec-1 and the counter-receptor
Siglec-1 (also known as sialoadhesin, Sn or CD169) is a macro-         is the composite of the ligand(s) attached to an appropriate
phage-restricted Siglec that is well conserved across mammals5.        protein or lipid carrier15. Using defined glycans, Siglec-1 has
Under normal physiological conditions, it is highly expressed          been found to prefer α2,3-linked Neu5Ac over α2,6- and
on macrophage subsets in secondary lymphoid tissues and its            α2,8-linked Neu5Ac16,17. Certain other types of sialic acid,
expression on other macrophages can be induced at sites of             including Neu5Gc and Neu5,9(Ac)2, were not recognised by
inflammation5,6. Siglec-1 appears to have evolved primarily            Siglec-118. Like many membrane lectins, Siglec-1 exhibits low
as a cellular interaction molecule. It has an unusually large          binding affinities for its glycan ligands, with Kd values in the
number of 17 Ig domains that are thought to project the sialic         millimolar range17. Cell adhesion mediated by Siglec-1 there-
acid binding site away from the plasma membrane to promote             fore depends on the clustering of both Siglec-1 and its ligands
interactions with sialic acid ligands presented on other cells5.       on cell surfaces to obtain high avidity interactions. As a result,
This is in striking contrast to other Siglecs, which have between      the molecular basis for Siglec-1 binding to Tregs is complex
two and seven Ig domains and are typically masked at the cell          and determined by multiple factors. On the one hand it can be
surface by interactions with sialic acids in cis3.                     affected by global factors involved in the synthesis of glycan
                                                                       ligands, such as the production and transport of sugar donors
In addition to being displayed on cells of the host, the sialic        and the expression of sialyltransferases and other glycosyl
acids recognised by Siglec-1 can be present on certain patho-          transferases. On the other hand, it can also be affected by spe-
gens such as sialylated bacteria, protozoa and enveloped viruses       cific factors, such as the expression and localisation of par-
and their recognition can lead to increased pathogen uptake by         ticular glycoprotein and glycolipid counter-receptors that carry
macrophages and enhanced host susceptibility (reviewed in 4).          the glycan ligands.
However, the predominant biological functions of Siglec-1
involve interactions with sialic acids of the host. For example,       The aim of this study was to investigate the global and specific
Siglec 1 can mediate sialic acid-dependent crosstalk between           factors that lead to Siglec-1 binding to activated Tregs using
macrophages and various immune cells including neutrophils7,           RNA-Seq, glycomics and proteomics. A proximity labeling
dendritic cells8, innate-like lymphocytes9 and regulatory T cells10.   strategy, combined with proteomics, was used to identify glyco-
                                                                       protein counter-receptors for Siglec-1 expressed by activated
An important biological function of Siglec-1, discovered in stud-      Tregs.
ies of Siglec-1-deficient mice, is its role in promoting inflam-
matory responses during various autoimmune diseases of the             Keywords
nervous system10–14. Mechanistically, this is likely to be due to      Regulatory T cell, macrophage, inflammation, sialic acid,
Siglec-1-dependent suppression of Treg expansion. This was             glycomics, proteomics
initially implied in studies of experimental autoimmune uvei-
tis, which showed that Siglec-1 was a prominent marker on              Methods
inflammatory macrophages at the peak phase of tissue damage13.         Animals
Siglec-1-deficient mice exhibited reduced disease sever-               Forty C57BL/6J wildtype mice were used for the study. All
ity and decreased proliferation and IFN-γ secretion by effec-          efforts were made to ameliorate any suffering of animals. The
tor T cells. Direct evidence for an important cross-talk between       mice were bred and maintained in the Biological Resource
Siglec-1 and Tregs was seen in a study of experimen-                   Unit at the University of Dundee under specific-pathogen-free
tal autoimmune encephalomyelitis (EAE), which is a mouse               conditions and procedures approved by the University of
model of multiple sclerosis10. The EAE model revealed that             Dundee Ethical Committee and under the authorization of
Siglec-1-expressing macrophages are closely associated with            the UK Home Office Animals (Scientific Procedures) Act
activated CD4+Foxp3+ Tregs at sites of inflammation within the         1986. The project licence number was PB232D3BA. Mice were
central nervous system. Siglec-1-deficient mice had increased          housed in same sex groups in individually ventilated cages.
numbers of Tregs and reduced levels of Th17 cells produc-              Housing conditions were: 12-h light, 12-h dark cycle, 21°C
ing inflammatory cytokines, leading to attenuated disease              temperature and relative humidity of 45–60%. Mice were given
severity10. The Tregs isolated from diseased mice showed strong        standard diet RM3 (SDS Special Diet Services), had free access
sialic acid-dependent binding to Siglec-1 and co-culture with          to autoclaved drinking water and autoclaved food ad libitum.
macrophages suppressed their expansion in a Siglec-1-dependent         Mice at the age of 16–24 weeks were humanely killed using

                                                                                                                              Page 3 of 24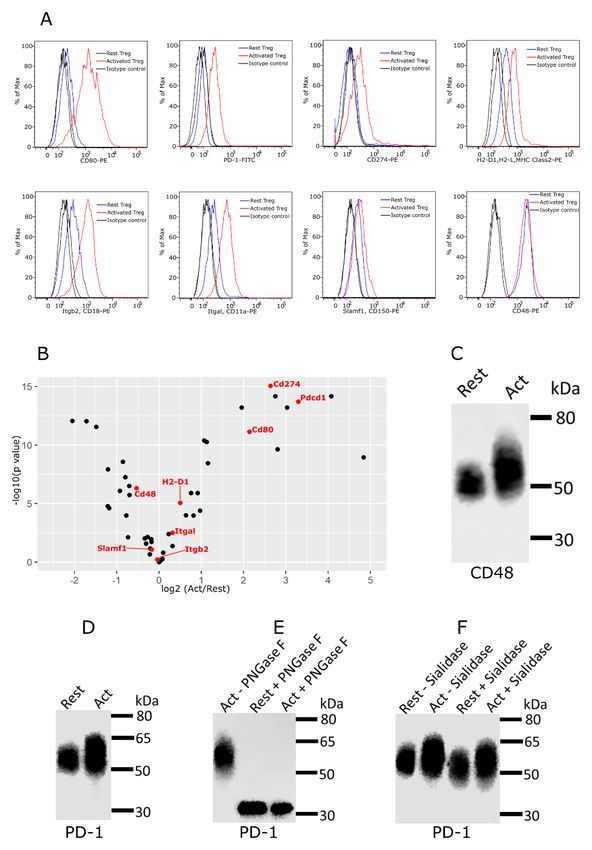
Wellcome Open Research 2021, 6:134 Last updated: 11 JUN 2021

a Schedule 1 method of gradual exposure to carbon dioxide          Factor Staining Buffer Set, HyClone™ FetalClone™ II
and death was confirmed by cervical dislocation. The mouse         serum were from ThermoFisher, Loughborough, UK. Anti-
gender was selected randomly for experiments.                      mouse CD80-PE (clone: 16-10A1, Cat# 104707, RRID:
                                                                   AB_313128, 1:100), anti-mouse CD274-PE (clone: MIH7,
Generation and culture of Tregs                                    Cat# 155403, RRID: AB_2728222, 1:50), anti-mouse CD18-PE
RPMI 1640 medium with L-glutamine (Gibco™), FBS                    (clone: M18/2, Cat# 101407, RRID: AB_312816, 1:50),
(Gibco™), Penicillin-Streptomycin (Gibco™), 2-mercaptoethanol      anti-mouse CD11a-PE (clone: I21/7, Cat# 153103, RRID:
(Gibco™), functional grade anti-mouse CD28 (clone: 37.51,          AB_2716033, 1:100), anti-mouse CD48-PE (clone: HM48-1,
Cat# 16-0281-82, RRID: AB_468921, 1:500), functional grade         Cat# 103405, RRID: AB_313020, 1:100), streptavidin-FITC,
anti- mouse IL-4 (clone: 11B11, Cat# 16-7041-81, RRID:             anti-Neu5Gc antibody (polyclonal, Cat# 146903, RRID:
AB_469208, 1:100), functional grade anti-mouse IFN-γ               AB_2562884, 1:300), anti-chicken IgY (polyclonal, Cat#
(clone: XMG1.2, Cat# 16-7311-81, RRID: AB_469242, 1:100)           410802, RRID:AB_2566570, 1:200) and NeuGc staining
were from ThermoFisher, Loughborough, UK. Anti-mouse               buffer set were from Biolegend, London, UK. FITC conjugated
CD3 (clone: 145-2C11, Cat# 100302, RRID: AB_312667,                goat anti-human IgG Fc (polyclonal, Cat# AP113F, RRID:
1:100 – 1:16 000) was from Biolegend, London, UK. Mouse            AB_11213109, 1:1 000) was from Merck, Dorset, UK.
CD4+ T Cell Isolation Kit (Cat# 130-104-454) was from              Biotinylated plant lectin MAL II and SNA were from Vector®
Miltenyi Biotec Ltd., Surrey, UK. Mouse IL-2 and human             Laboratories, Peterborough, UK. Mouse Siglec-1-human IgG
TGF-β were from PeproTech, London, UK. TPP® 12-well                Fc chimera, Siglec-E human IgG chimera and CD22-human IgG
plate was from Merck, Dorset, UK.                                  Fc chimera were expressed in the lab.

Mouse T cells were isolated from spleen and lymph nodes using      Before staining antigens and glycans, cells were stained by
CD4+ T Cell Isolation Kits following the supplier’s protocol.      Fixable Viability Dye eFluor™ 450 following the supplier’s
Mouse iTregs were generated and grown in 12-well plates. The       instructions, and live cells were gated for flow cytometry analy-
wells were coated with 1 ml PBS per well containing 10 μg/ml       sis. All antigen and glycan ligands staining steps were carried
anti-CD3 for 2 hours at 37°C. The non-bound antibody was           out on ice. For staining Foxp3 and NeuGc, Foxp3 / Transcription
removed by washing the plate twice using PBS. The iso-             Factor Staining Buffer Set and the buffer from anti-Neu5Gc
lated cells were suspended at a concentration of 1-2 X 10⁶/ml      antibody Kit were used as staining buffer and washing buffer,
in culture medium, which is RPMI 1640 with L-glutamine,            respectively. For the other staining experiments, 1% HyClone™
10% FBS, 100 U/ml Penicillin-Streptomycin, and 50 μM               FetalClone™ II serum in PBS was used as staining buffer,
2-mercaptoethanol. The cells were induced for 4–5 days at          antibody diluting buffer, washing buffer and cell storage
1 ml of cell suspension per well with 2 μg/ml functional grade     buffer. Foxp3 staining and NeuGc staining were done accord-
anti-CD28, 10 μg/ml functional grade anti-IL-4, 10 μg/ml func-     ing to the kit supplier’s instructions. For staining antigens,
tional grade anti-IFN-γ, 20 ng/ml IL-2 and 5 ng/ml TGF-β.          the cells were washed with staining buffer, stained on ice for
Fresh culture medium, anti-CD28, anti-IL-4, anti-IFN-γ, IL-2,      30 min, and washed for flow cytometry analysis. For stain-
and TGF-β were supplemented when the cell culture medium           ing Siglec-1 and CD22 glycan ligands, Siglec-1-human
became yellow. After induction, the cells were washed twice        IgG Fc chimera and CD22-human IgG Fc chimera were mixed
with culture medium. The cells were re-suspended at a con-         with FITC conjugated goat anti-human IgG Fc at a final con-
centration of 106/ml in the culture medium and expanded for        centration of 1 μg/ml and 3 μg/ml, respectively, in stain-
four days with 20 ng/ml IL-2 and 5 ng/ml TGF-β. Fresh culture      ing buffer, and incubated on ice for 30 min to prepare the
medium, IL-2 and TGF- β were supplemented when the culture         pre-complex. The pre-complex was used as an antibody and
medium became yellow. To obtain activated Tregs, the expanded      followed antibody staining procedure to stain glycan lig-
Tregs were suspended at a concentration of 106/ml in cul-          ands for flow cytometry analysis. Biotinylated MAL II and
ture medium with 20 ng/ml IL-2 and 5 ng/ml TGF-β, and were         SNA were used as antibody and followed antibody staining
cultured at 1 ml cell suspension per well in 12-well plate pre-    procedure. The biotin was stained using streptavidin-FITC for
coated with different concentrations of anti-CD3 in PBS. The       flow cytometry detection. The flow cytometry data were ana-
anti-CD3 concentration for activated Tregs for proximity label-    lysed using FlowJo Version 10.0 (alternative data analysis and
ling, proteomics and RNA-Seq was 0.125 μg/ml. Tregs were           visualization tool: CytoExploreR). A Siglec-1-Fc non-sialic
activated for three days for proximity labelling and protemics     acid-binding mutant (SnR97A-Fc) was used as a negative con-
experiments, and for 36 hours for RNA-Seq experiments.             trol for Siglec binding experiments. The chicken IgY isotype
                                                                   in the anti-Neu5Gc antibody Kit was used as a negative con-
Flow cytometry                                                     trol for NeuGc staining experiments. Streptavidin-FITC was
Anti-mouse CD4-PE-Cy7 (clone: GK1.5, Cat# 25-0041-82,              used as a negative control for MAL II and SNA binding experi-
RRID: AB_469576, 1:100), anti-mouse Foxp3-APC (clone:              ments. Raw data for flow cytometry analysis are available,
FJK-16s, Cat# 17-5773-82, RRID: AB_469457, 1:100), anti-mouse      see Underlying data19.
PD-1-FITC (clone: J43, Cat# 11-9985-82, RRID: AB_465472,
1:50), anti-mouse MHC Class II-PE (clone: AF6-120.1, Cat#          Proximity labelling
12-5320-82, RRID: AB_2572619, 1:100), anti-mouse CD150-PE          Protein A beads and µ columns were from Miltenyi
(clone: mShad150, Cat# 12-1502-82, RRID: AB_1548765,               Biotec Ltd., Surrey, UK. Tyramide-SS-biotin was from Iris
1:200), Fixable Viability Dye eFluor™ 450, Foxp3 / Transcription   Biotech GmbH, Marktredwitz, Germany. HRP-conjugated goat

                                                                                                                          Page 4 of 24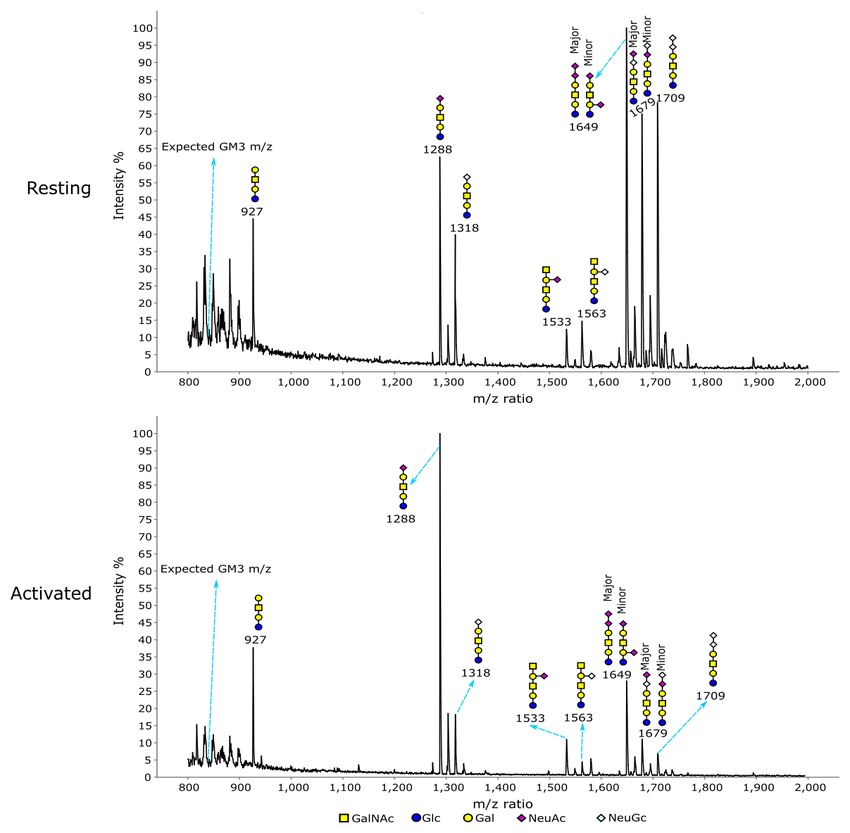
Wellcome Open Research 2021, 6:134 Last updated: 11 JUN 2021

anti-human IgG Fc (Cat# ab97225, RRID: AB_10680850,                Proteomic sample preparation was done using paramag-
1:333) was from Abcam, Cambridge, UK. Catalase was from            netic bead (SP3 bead) technology following the protocol pub-
Merck, Dorset, UK. H2O2 was from VWR, Leicestershire, UK.          lished previously22. For histone ruler proteomics, the cells
                                                                   were lysed and sonicated in cell lysis buffer (4% SDS, 10 mM
Proximity labelling was done using activated Tregs induced         TCEP, 50 mM TEAB in H2O). The proteins were then alkylated
from independent experiments, and the gap between these            using iodoacetamide, cleaned on SP3 beads, and digested to
experiments was set no less than two weeks. All proximity label-   peptides using trypsin and LysC. The peptides were TMT
ling steps were carried out on ice. In-solution Siglec-1-HRP       labelled according to the supplier’s instructions, cleaned
multimers were prepared by incubating Siglec-1-human IgG           on SP3 beads, eluted and fractionated by high pH reversed
Fc chimera with HRP-conjugated goat anti-human IgG Fc at a         phase chromatography for mass spectrometry analysis. For
final concentration of 1 μg/ml and 3 μg/ml in labelling buffer     Siglec-1 counter-receptor identification and membrane pro-
(1% HyClone™ FetalClone™ II serum in PBS) for 30 min.              teomics, the biotinylated proteins were enriched and cleaned
5X10⁶ Tregs were washed twice with labelling buffer, mixed         on streptavidin beads. The glycans were removed using Pro-
with 300 μl Siglec-1-HRP multimer and incubated for 30 min.        tein Deglycosylation Mix II under Non-Denaturing Reaction
                                                                   Conditions following the protocol from the supplier. The sam-
For proximity labelling using on-bead Siglec-1-HRP multimer,       ples were cleaned on streptavidin beads, eluted using cell lysis
270 μl 10 μg/ml Siglec-1-human IgG Fc chimera was                  buffer and processed using paramagnetic bead (SP3 bead) tech-
incubated with 30 μl Protein A nanobeads for 60 min. The           nology for label free proteomic analysis. Proteomics data are
non-bound material was removed by washing the beads on a           available via ProteomeXchange with identifiers PXD022259,
µ column. The beads were eluted from the µ column using            PXD021737, PXD021693 and PXD021691.
300 μl labelling buffer, mixed with 5X10⁶ Tregs and incubated
for 30 min. HRP-conjugated goat anti-human IgG Fc was added        The proteomic raw data were imported to MaxQuant Version
to the cells to a final concentration of 3 μg/ml and incubated     1.6.2.323 to search protein FASTA files of mouse, human IgG
for another 30 min.                                                Fc and HRP in Uniprot database. The LFQ intensities of pro-
                                                                   teins were used for downstream analysis24 by Perseus Version
HRP substrate, Tyramide-SS-biotin and H2O2, were added             1.6.0.725 and R Version 3.6.3. The R scripts were uploaded to
to a final concentration of 95 μM and 0.01%, respectively.         GitHub (see Code availability)26. Gene Ontology Cellular
The sample was left on ice for 2 min and the reaction was          Component analysis and glycosylation analysis were based
quenched by washing three times with 3 ml 100 U/ml catalase in     on the reviewed mouse protein entries in Uniprot database.
labelling buffer.                                                  Siglec-1 counter-receptors were identified through four con-
                                                                   secutive steps of data filtration. The log2-fold change of the
Glycomics and proteomics                                           proteins in each sample was first visualized by histogram, and
PNGase F (cloned from Flavobacterium meningosepticum               the samples without a proximity labelling tail were excluded.
and expressed by E.coli), CHAPS and DTT were from Roche,           After that, the rest of the data were visualized in a vol-
Welwyn Garden City, UK. Sep Pak C18 Cartridges were                cano plot and the data points with significant changes were
from Waters, London, UK. Slide A Lyzer ® dialysis cassettes        selected. Then, proteins without predicted glycosylation sites
(3.5 kDa molecular weight cut off), TMT10plex™ Isobaric            or that were unlikely to be located on the plasma membrane
Label Reagent Set, TCEP, TEAB were from ThermoFisher,              were removed. Finally, the filtered proteins were mapped
Loughborough, UK. Protein DeglycosylationMix II Kit was            back to each of the histograms of log2 fold change and
from New England Biolabs, Hitchin, UK. LysC was from Alpha         proteins found outside the ‘proximity labelling tail’ in any histo-
Laboratories Ltd, Eastleigh, UK. Trypsin was from Promega,         gram were removed. For the identification of ‘total membrane
Southampton. UK. Paramagnetic bead (SP3 bead) and other            proteins’, both total cell lysate and membrane enriched pro-
general chemical reagents were from Merck, Dorset, UK.             teins from three biological replicates of activated Tregs were
                                                                   used for mass spectrometry analysis. Proteins identified in
Glycomic analysis of glycoproteins was done following the          at least two of three biological replicates were selected for
protocol published previously20. Briefly, Tregs were homog-        Gene Ontology Cellular Component analysis to identify cell
enized by sonication in 25 mM Tris, 150 mM NaCl, 5 mM              membrane proteins.
EDTA, and 1% CHAPS, pH 7.4, dialysed in dialysis cas-
settes, reduced by DTT, carboxymethylated by IAA, and              RNA-Seq
digested by trypsin. N-glycans were removed from glycopep-         Total RNA from rested and activated regulatory T cells (four
tides by PNGase F, which were then isolated by Sep Pak C18         biological replicates) were extracted using Qiagen RNeasy
Cartridges and permethylated for mass spectrometry analy-          Mini kit (#74106) according to the manufacturer’s instruc-
sis. Glycomic analysis of glycolipids was done following a         tions and quantified using the Qubit 2.0 Fluorometer (Thermo
previous protocol21. Raw data for glycomics are available,         Fisher Scientific Inc, #Q32866) and the Qubit RNA BR assay
see Underlying data19. Glycomic data were analysed using           kit (#Q10210). RNA sequencing libraries were prepared
Data ExplorerTM version 4.6 from AB Sciex (alternative data        from 500 ng of each total-RNA sample using the NEBNEXT
analysis tool: MALDIquant).                                        Ultra II Directional RNA Library Prep kit with Poly-A

                                                                                                                           Page 5 of 24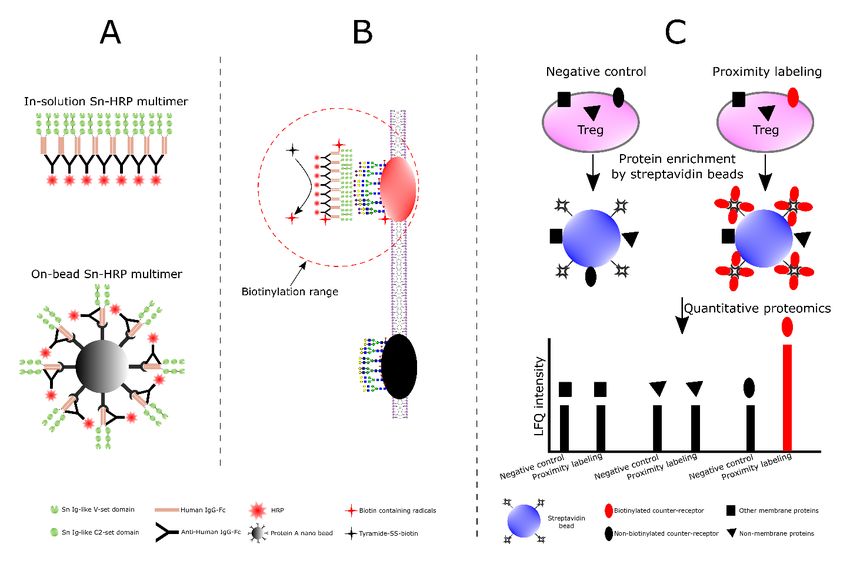
Wellcome Open Research 2021, 6:134 Last updated: 11 JUN 2021

mRNA magnetic isolation (NEB #E7490) according to the              Glycoprotein isolation, glycosidase digestion, western
manufacturer’s instructions.                                       blotting
                                                                   Cyanogen bromide-activated Agarose, neuraminidase (Vibrio
Poly-A containing mRNA molecules were purified using poly-         cholerae), and HRP-conjugated rabbit anti-goat antibody
T oligo attached magnetic beads. Following purification the        (polyclonal, Cat# AP107P, RRID: AB_92420, 1:7 000) were
mRNA was fragmented using divalent cations under elevated          from Merck, Dorset, UK. Anti-mouse PD-1 (clone: J43, Cat#
temperature and primed with random hexamers. Primed RNA            14-9985-82, RRID: AB_468664, used without dilution) and
fragments were reverse transcribed into first strand cDNA          NuPAGE SDS-PAGE system were from ThermoFisher, Lough-
using reverse transcriptase and random primers. RNA templates      borough, UK. Goat anti-mouse PD-1 (polyclonal, Cat# AF1021,
were removed and a replacement strand synthesised incorpo-         RRID: AB_354541, 1:5 000) and goat anti-mouse CD48 (pol-
rating dUTP in place of dTTP to generate ds cDNA. The incor-       yclonal, Cat# AF3327, RRID: AB_664084, 1:15 000) were
poration of dUTP in second strand synthesis quenches the           from R&D systems, Abingdon, UK. PNGase F (Cat# P0704S)
second strand during amplification as the polymerase used          was from New England Biolabs, Herts UK.
in the assay is not incorporated past this nucleotide. AMPure
XP beads (Beckman Coulter, #A63881) were then used to              For PD-1 analysis, anti-mouse PD-1 (RRID: AB_468664) was
separate the ds cDNA from the second strand reaction mix,          conjugated to cyanogen bromide-activated Agarose accord-
providing blunt-ended cDNA. A single ‘A’ nucleotide was            ing to the supplier’s instructions. PD-1 from resting and acti-
added to the 3’ ends of the blunt fragments to prevent them        vated Tregs was affinity purified using the anti-PD1 beads for
from ligating to another during the subsequent adapter liga-       glycosidase digestion and western blot analysis. PNGase F
tion reaction, and a corresponding single ‘T’ nucleotide on        digestion was done according to the supplier’s instructions.
the 3’ end of the adapter provided a complementary overhang        Sialidase digestion was done in 50 mM sodium acetate, 4
for ligating the adapter to the fragment. Multiple indexing        mM calcium chloride, pH 5.5, at 37°C for 2 h. SDS-PAGE of
adapters were then ligated to the ends of the ds cDNA to pre-      PD-1 was carried out using the NuPAGE system, and the
pare them for hybridisation onto a flow cell, before 11 cycles     protein was transferred to PVDF membrane, blotted with goat
of PCR were used to selectively enrich those DNA frag-             anti-mouse PD-1 (RRID: AB_354541) and HRP-conjugated
ments that had adapter molecules on both ends and amplify          rabbit anti-goat antibody (RRID: AB_92420). CD48 was blot-
the amount of DNA in the library suitable for sequencing. After    ted with goat anti-mouse CD48 (RRID: AB_664084) and
amplification libraries were purified using AMPure XP beads.       HRP-conjugated rabbit anti-goat antibody (RRID: AB_92420).

Libraries were quantified using the Qubit dsDNA HS assay           Results
and assessed for quality and fragment size using the Agent Bio-    Siglec-1 binding to Tregs depends completely on Treg
analyser with the DNA HS kit (#5067-4626). RNA-Sequencing          activation
was carried out by The Genetics Core of Edinburgh Clinical         FoxP3-positive CD4 Tregs are a small subset of the total
Research Facility, University of Edinburgh using the NextSeq       pool of CD4 T cells but can be induced from FoxP3-negative
500/550 High-Output v2 (150 cycle) Kit (# FC-404-2002) with        CD4 T cells under defined culture conditions. In order to obtain
a High Out v2.5 Flow Cell on the NextSeq 550 platform (Illu-       a sufficient number of Tregs for RNA-Seq, glycomics and
mina Inc, #SY-415-1002). Eight libraries were combined in          proteomics, CD4 T cells were isolated from mouse spleens
an equimolar pool based on the library quantification results      and lymph nodes and induced to become Tregs as illustrated
and run across one High-Output Flow Cell. Sequencing resulted      in Figure 1. After induction for 4 – 5 days, the proportion of
in paired-end reads 2 x 75 bp with a median of 50 million          Tregs increased from about 4% to about 90%, and the cell
reads per sample. RNA-Seq data produced in this study are          count increased 1- to 3-fold. After expansion for a further four
available via ArrayExpress with identifier E-MTAB-9657.            days, the cell count increased another 2- to 3-fold, without
                                                                   affecting the proportion of Tregs (Figure 1). Siglec-1 binding
The data were analysed by the Data Analysis Group, Divi-           to these Tregs was analysed by flow cytometry. The freshly-
sion of Computational Biology, University of Dundee, using         induced and activated Tregs exhibited strong Siglec-1 binding
code which is available on GitHub (see Code availability)27. The   (Figure 2A). When these cells were cultured under rest-
sequencing data were processed using a snakemake script in a       ing conditions in the absence of anti-CD3 antibody, Siglec-
conda environment. Reads were quality controlled using FastQC      1 binding disappeared completely, but was fully restored
and MultiQC, mapped to GRCm38 assembly (Ensembl) of the            when the cells were re-stimulated with anti-CD3 antibody
mouse genome using STAR 2.6.1a (Dobin et al., 2013) and            (Figure 2A). Alternatively, when the freshly-induced Tregs
number of reads per gene was quantified in the same STAR           were kept activated with anti-CD3, they continued to exhibit
run. Differentially expressed genes were quantified with edgeR     strong Siglec-1 binding until anti-CD3 was removed from the
v3.28.0 (Robinson, McCarthy, & Smyth, 2010). A Benjamini-          cell culture medium (Figure 2A). The extent of induction of
Hochberg multiple test correction was applied to test P-values.    Siglec-1 ligands on Tregs by anti-CD3 antibody and its kinet-
The data reproducibility was tested using the distance matrix      ics were dose-dependent over a range of anti-CD3 concen-
and clustering based on the read count per gene.                   trations (Figure 2B). These observations reveal that Siglec-1

                                                                                                                          Page 6 of 24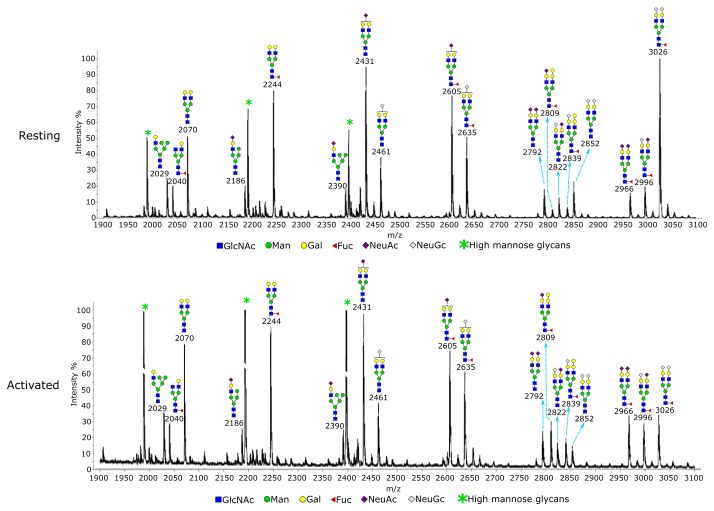
Wellcome Open Research 2021, 6:134 Last updated: 11 JUN 2021

Figure 1. Flow cytometry showing induction of FoxP3+ CD4+Tregs and their expansion in vitro. Mouse CD4 T cells were isolated
from spleen and lymph nodes, stimulated with anti-CD3 and anti-CD28 mAbs for 4-5 days in the presence of anti-IL-4, anti-IFNγ, IL-2 and
TGF-β. The cells were then expanded in the presence of IL-2 and TGF-β for another four days. The data shown are representative of more
than 10 experiments carried out.

binding to Tregs in vitro depends completely on Treg activa-         GM1b structures at m/z 1288 (NeuAc) and m/z 1318 (NeuGc)
tion. This is consistent with previous in vivo studies showing       (Figure 5). These observations suggest that GM1b (NeuAc)
that Siglec-1 bound only to activated, but not resting Tregs10,28.   is upregulated on activated Tregs where it could potentially
                                                                     serve as a ligand for Siglec-1.
Siglec-1 binding to activated Tregs is not due to a global
change of sialylation                                                RNA-Seq analysis does not indicate a global change of
The striking induction of Siglec-1 ligands on activated Tregs        sialylation in activated Tregs
suggests that activation could be accompanied by global              RNA-Seq was used to profile the gene expression patterns, com-
changes in glycan sialylation, as observed previously with           paring resting and activated Tregs prepared from four inde-
CD4+ effector T cells29,30. These include increased expression       pendent biological replicates. The peak expression of Siglec-1
of α2,3-linked sialic acids and a switch from the NeuGc to           ligands was observed between 24 and 48 hours follow-
NeuAc form of sialic acid, both changes leading to increased         ing Treg activation (Figure 2). Therefore, we selected a 36
binding of Siglec-1. To investigate this, we used plant lectins      hour time point to isolate mRNA in order to maximise the
MAL II and SNA to probe the overall α2,3-linked and                  chances of seeing clear changes in gene expression relevant to
α2,6-linked sialylated glycans, respectively, and anti-NeuGc         Siglec-1 ligand expression. The Pearson’s correlation coeffi-
antibody to measure NeuGc levels on Tregs. However, unlike           cient for each pair of replicates is shown in the distance matrix
effector T cells, there were no obvious changes in either lectin     in Figure 6A, which shows good quality data with reproduc-
or antibody binding upon Treg activation (Figure 3).                 ible replicates and major changes between resting and acti-
                                                                     vated Tregs. This is further illustrated by clustering and
Glycomics was used to directly examine the structures and            principle component analyses (Figure 6B,C). To focus on
relative quantities of Treg N-glycans and glycolipids. N-glycans     genes involved in glycosylation, we assembled a dataset of
showed an overall similar glycosylation and sialylation profile      263 genes including glycosyltransferases, glycosidases, enzymes
when resting and activated Tregs were compared (Figure 4). A         involved in amino sugar and nucleotide sugar metabolism, and
specific change was found at m/z 3026, which is a bi-antennary       sugar transporters (Extended data Table 1)31. Whilst, overall,
glycan with core fucose and two NeuGc sialic acids. Rela-            these genes did not show a dramatic global log2 fold change
tive to the other glycans, this glycan had a decreased intensity     there were many specific changes upon Treg activation
when Tregs became activated. Gal-α-Gal terminal structures           (Figure 6D, Extended data Table 1)31. Mapping of the data to
were specifically found on mono-sialylated core fucosylated          KEGG pathways points to overall increased N-glycosylation
glycans at m/z 2809 and m/z 2839. Relative to the other bian-        in activated Tregs (Extended data Figure 9)31 and increased
tennary glycans, the two glycans had a minor increase upon           O-glycosylation for proteins that depend on expression of Galnt3,
Treg activation. For glycolipids, MS (Figure 5) and MS/MS            a GalNAc transferase that initiates O-glycosylation on serine
(Extended data Figures 1–8)31 analyses showed different              and threonine residues (Extended data Figure 10)31.
glycan profiles in resting and activated Tregs, with a trend of
NeuGc switching to NeuAc upon activation. This can be seen           The expression patterns of genes involved in Treg sialyla-
by the higher proportions of NeuAc-containing glycans at m/z         tion are shown in Figure 7. The sialyltransferases (STs) are
1288, 1533 and 1649 versus their NeuGc-containing coun-              a family of ~20 enzymes that transfer sialic acids to accep-
terparts at m/z 1318, 1563 and 1709 in activated Tregs               tor sugars in α2,3-, α2,6- and α2,8-glycosidic linkages32. For
(Figure 5). This was especially striking for the α2,3-sialylated     α2,3-sialylation, the preferred linkage for Siglec-1, Treg

                                                                                                                             Page 7 of 24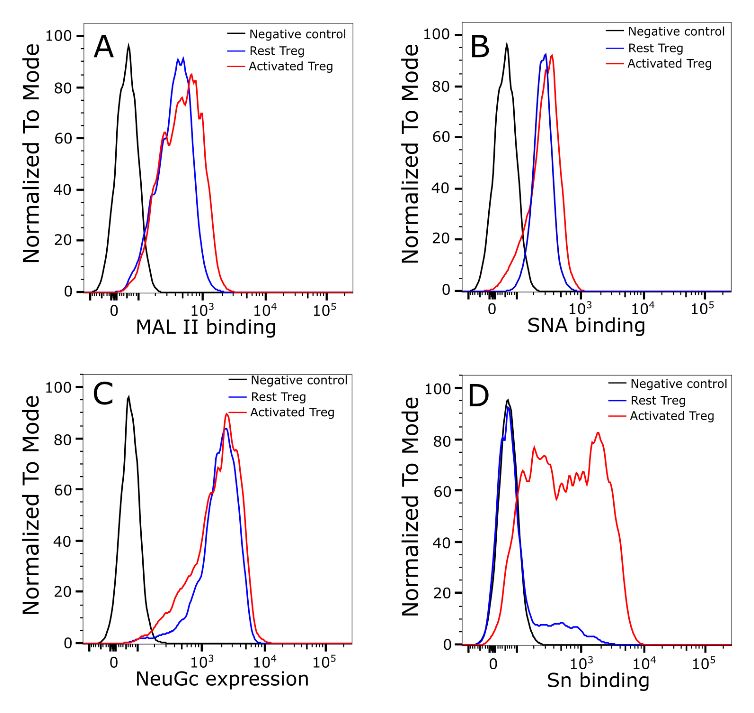
Wellcome Open Research 2021, 6:134 Last updated: 11 JUN 2021

Figure 2. Siglec-1 binding to Tregs depends on Treg activation status. (A) Freshly isolated CD4 T cells were induced to become Tregs
and analysed for expression of Siglec-1 ligands using pre-complexed Siglec-1-Fc (Sn-Fc). Compared to the negative control non-binding
mutant, Siglec-1-R97A-Fc (SnR97A-Fc), the induced and activated Tregs showed strong Siglec-1 binding. The binding was lost when the
cells were rested in IL-2 and TGF-β for four days, but was fully recovered when the cells were reactivated with anti-CD3 mAb for three days
(upper panels). The freshly induced Tregs continued to show strong Siglec-1 binding when kept under activating conditions in the presence
of anti-CD3 mAb, but binding was lost when anti-CD3 mAb was withdrawn for three days (lower panels). The whole set of experiments
was performed twice with similar results. Analysis of Siglec-1 binding to resting and activated Tregs was repeated more than 20 times and
in each case binding was much higher to the activated cells. (B) Siglec-1 binding to Tregs depends on the T cell receptor signal strength.
Freshly induced Tregs were rested for four days and then stimulated using different concentrations of anti-CD3 mAb and analysed for
Siglec-1 binding at 24, 48 and 72 hours. Binding was both dose- and time-dependent. Similar results were observed in two independent
experiments.

                                                                                                                                Page 8 of 24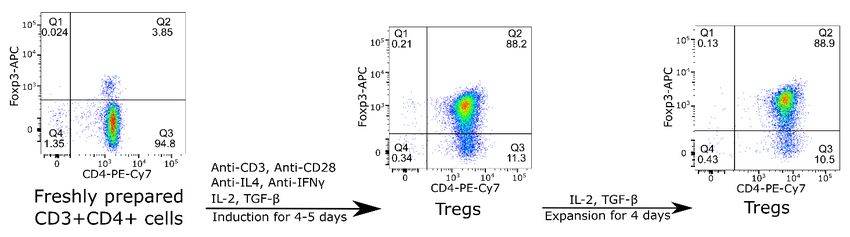
Wellcome Open Research 2021, 6:134 Last updated: 11 JUN 2021

Figure 3. Treg activation does not lead to a global change of cell surface sialylation. α2,3-linked (A) and α2,6-linked sialic (B) acids
on Tregs were probed using biotinylated plant lectins MAL II (A) or SNA (B), which were then stained using FITC conjugated streptavidin for
flow cytometry analysis. Tregs stained only with FITC conjugated streptavidin were used as a negative control. (C) NeuGc expression was
analysed by flow cytometry using chicken IgY anti-NeuGc antibody. A chicken IgY isotype control antibody was used as a negative control.
(D) Expression of Siglec-1 ligands was measured using complexes of Siglec-1-huIgG-Fc chimera mixed with FITC-conjugated goat
anti-huIgG-Fc. Siglec-1-R97A-huIgG-Fc was used as a negative control. The same batch of Tregs was used for measurement of NeuGc
and Siglec-1 ligand expression. The MAL II, SNA and anti-NeuGc experiments were performed twice and similar results were observed.
Experiments to measure Siglec-1 binding to resting and activated Tregs were repeated more than 20 times and similar results were
observed consistently.

activation was associated with decreased expression of St3gal1,        CMP-NeuGc35, did not change significantly upon Treg acti-
St3gal2 and St3gal6, increased expression of St3gal5 and no            vation. This is consistent with the anti-NeuGc Ab binding
change for St3gal3 and St3gal4 (Figure 7A). Similarly, for             results shown above (Figure 3C), which showed no differ-
α2,6-sialylation, differential expression was observed, with           ences between resting and activated Tregs. Finally, we analysed
a 5-fold decrease of St6gal1 and a 3-fold increase in expres-          expression of endogenous sialidases with the potential to remove
sion of both St6galnac4 and St6galnac6 following activation            sialic acids from the cell surface. Of the four sialidase genes36,
(Figure 7B). The net effect of these alterations on overall            only Neu1 and Neu3 were expressed in Tregs. Expression
α2,3 and α2,6 sialylation appears to be minimal as MALII               of Neu1 increased slightly in activated Tregs while Neu3 did
and SNA staining for these respective linkages showed no               not change significantly (Figure 7D). In conclusion, the results
changes on Treg activation, as described above (Figure 3A,B).          of RNA-Seq revealed changes in expression of many genes
For α2,8-sialylation, St8sia1 and St8sia4 were both decreased          that affect glycosylation of multiple proteins and lipids, but did
upon Treg activation, but expression of St8sia6 was slightly           not reveal specific changes predicted to have major effects on
increased (Figure 7C). We also analysed genes involved in              Siglec-1 recognition following Treg activation.
modifications of sialic acids including conversion of NeuAc to
9-O-acetyl NeuAc and Neu5Gc, neither of which is recog-                Identification of glycoprotein counter-receptors for
nised by Siglec-118. 9-O-acetylation is controlled by Casd1 and        Siglec-1
Siae, which catalyse the addition or removal of acetyl groups          A recently-described proximity labelling strategy37,38, coupled
to NeuAc, respectively33,34. Expression of both genes was              with quantitative proteomics, was used to identify Treg glyco-
reduced following Treg activation, suggesting no net change in         proteins that could interact with Siglec-1. The experimental
levels of 9-O-acetyl NeuAc. (Figure 7D). Expression of                 design is illustrated in Figure 8. It essentially involves prepara-
Cmah, which is responsible for converting CMP-NeuAc to                 tion of Siglec-1-horse radish peroxidase (Sn-HRP) multimers
                                                                                                                               Page 9 of 24
Wellcome Open Research 2021, 6:134 Last updated: 11 JUN 2021
Figure 4. Glycomic analysis of resting and activated Tregs. N-glycans from the Tregs were permethylated and analysed by MALDI-TOF
mass spectrometry. The data were acquired in the form of [M+Na]+ ions. Peaks representing hybrid and complex glycans were annotated
according to the molecular weight and N-glycan biosynthetic pathways. Treg activation did not result in an overall change of glycosylation,
except the glycan at m/z 3026, which had a decreased intensity relative to other glycans following activation of Tregs. A minor increase in
Gal-α-Gal structure was observed upon Treg activation at m/z 2809 and m/z 2839, relative to the other biantennary glycans.
(Figure 8A) that can bind to Tregs and, in the presence of tyra- Three biological replicates of activated Tregs were prepared
mide-SS-biotin and H2O2, generate short-range biotin radicals for independent proximity labelling experiments using both
that label neighbouring proteins (Figure 8B). Labelled proteins in-solution and on-bead multimers, resulting in six data sets.
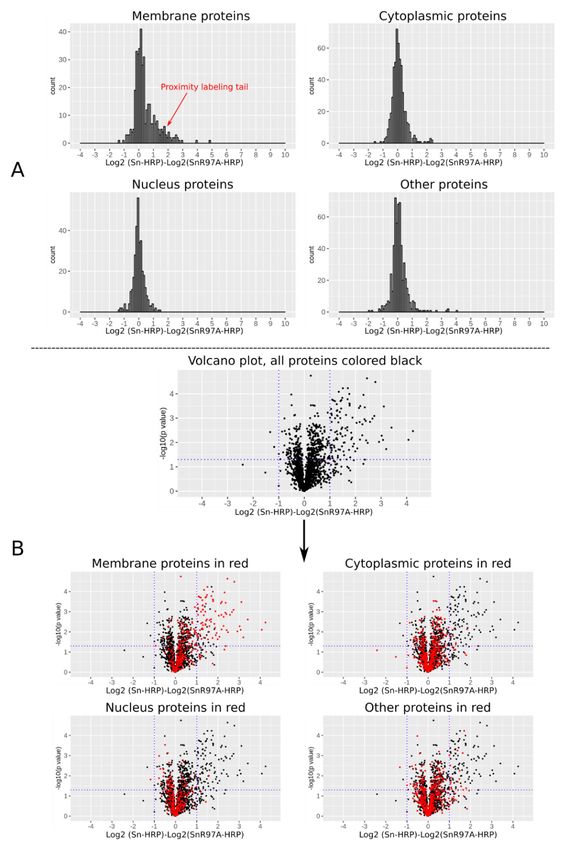
are then enriched with streptavidin and identified by quantita- For each data set, the log2 fold change of each protein rela-
tive proteomics (Figure 8C). To increase the chances of iden- tive to its negative control was calculated and visualized accord-
tifying diverse counter-receptors, two types of Siglec-1-HRP ing to its cellular compartmentalisation (Figure 9A). A sub-
multimer were prepared, either in-solution, or attached to set of membrane proteins with higher log2 fold changes were
50 nm microbeads (Figure 8A). Because of the potential for observed in the histogram, resulting in a small but clear tail,
non-specific labelling and streptavidin binding, it was impor- which we describe as a ‘proximity labeling tail’. This tail was
tant to include similarly-prepared multimers of a non-binding only found for membrane proteins but not for cytoplasmic,
negative control Siglec-1, (SnR97A) alongside the active nuclear or other proteins and suggests that only certain mem-
Siglec-1. Proteins that were selectively enriched using the brane proteins were biotinylated and selectively enriched.
Sn-HRP complexes over the SnR97A-HRP complexes represent Five out of the six data sets showed the proximity labelling tail
potential Siglec-1 counter-receptors (Figure 8C). (Extended data Figure 11)31 and these were selected for
Page 10 of 24Wellcome Open Research 2021, 6:134 Last updated: 11 JUN 2021
Figure 5. Glycomic analysis of glycolipid glycans on resting and activated Tregs. The data were annotated according to the molecular
weight, biosynthetic pathways and MS/MS analysis. The NeuAc capped GM1b (m/z 1288) showed a much higher signal relative to other
glycans in activated Tregs compared to resting Tregs.
statistical analysis using volcano plots (Figure 9B). A small proteins (Extended data Figure 12)31, and those which were
subset of proteins was found to have significant log2 fold changes. outside the proximity labelling tail were filtered out. The final
As expected, these were mainly membrane proteins. Siglec-1 counter-receptor list of 49 membrane proteins is shown
in Table 1. We successfully identified proteins that make up
The glycosylated proteins from the significant hits on the vol- the Siglec-1-HRP multimer complex, namely HRP, human
cano plot were selected for further data filtering; they were IgG Fc and Siglec-1, with gene names PRXC1A, IGHG1
mapped back to the individual histogram of total membrane and Siglec1, respectively. We also identified CD43, which
Page 11 of 24Wellcome Open Research 2021, 6:134 Last updated: 11 JUN 2021
Figure 6. Overview of RNA-Seq data. Four biological replicates of resting and activated Tregs were prepared for RNA-Seq analysis.
(A–C) Quality check of the RNA-Seq data shows high data quality with reproducible replicates and major changes between resting and
activated Tregs. (D) Volcano plot of the RNA-Seq results. The black dots show glycosylation-related genes, while the grey dots show all other
genes.
was proposed previously to function as a counter-receptor for were undertaken on activated Tregs. To maximise the number
Siglec-139. These identifications serve as a proof-of-principle of membrane proteins identified, two approaches were used,
for the proximity labelling approach. Interestingly, Siglec-1 either by performing proteomics of whole cell lysates or fol-
counter-receptors included a wide range of glycoproteins lowing cell surface biotinylation and enrichment of labelled
involved in a variety of functions, including the regulation of T proteins with streptavidin beads. This combined approach
cell activation and proliferation, such as CD80, CD200, CD69, led to identification of 943 membrane proteins, suggesting
CD150, PD-1 and PD-L1, adhesion molecules like CD166 and that the 49 Siglec-1 counter-receptors comprise approximately
integrins, the IL-2 receptor (CD25) and transporters like the 5% of the total membrane proteins on activated Tregs
L-type amino acid transporter, 4F2 (Extended data Table 2)31. (Figure 10A).
Characterization of Siglec-1 counter-receptors We next asked whether the Siglec-1 counter-receptors were dis-
To determine the proportion of membrane proteins consti- tributed amongst the more abundant membrane glycoproteins
tuted by the 49 Siglec-1 counter-receptors, proteomics analyses using both the RNA-Seq and proteomics datasets (Figure 10B,C).
Page 12 of 24Wellcome Open Research 2021, 6:134 Last updated: 11 JUN 2021
Figure 7. Normalized mRNA counts for genes involved in sialylation. Resting and activated Tregs from 4 biological replicates were
analzyed by RNA-Seq. Genes involved in synthesis of (A) α2,3-linked sialic acid, (B) α2,6-linked sialic acid, (C) α2,8-linked sialic acid and (D)
modification or removal of sialic acid are listed.
Page 13 of 24Wellcome Open Research 2021, 6:134 Last updated: 11 JUN 2021
Figure 8. Design of the proximity labelling experiments. (A) Preparation of two types of Siglec-1-HRP (Sn-HRP) multimers. The
in-solution multimers were prepared by mixing Siglec-1-huIgG Fc chimera (Sn-Fc) with HRP-conjugated polyclonal anti-huIgG Fc, while
the on-bead multimers were prepared by immobilizing Siglec-1-huIgG Fc chimera (Sn-Fc) and HRP conjugated polyclonal anti-huIgG Fc
on 50 nm protein A beads. (B) Mechanism of proximity labelling. After Siglec-1-HRP multimers bind to Siglec-1 counter-receptors on Treg
membrane, tyramide-SS-biotin and H2O2 were added. In the presence of HRP, generation of short-range biotin radicals results in biotinylation
of proteins in the immediate vicinity of the multimer. Siglec-1R97A-huIgG Fc (SnR97A-Fc) was used a negative control. (C) Identification of
Siglec-1 counter-receptors. Only biotinylated proteins (coloured in red) can be selectively enriched by streptavidin beads and show significant
quantitative changes in LFQ intensities in label free quantitative proteomic analysis.
This revealed that Siglec-1 counter-receptors were distrib- (Figure 11B). Several proteins, including CD80, PD-1 and
uted across the range of proteins from low to high abundancy, CD274 (PD-L1), showed increased protein expression in acti-
but were more enriched amongst the high abundancy pro- vated Tregs, which correlated with increased mRNA levels,
teins. To investigate whether Siglec-1 counter-receptors might but for about half of the counter-receptors, mRNA levels were
be more heavily glycosylated than other membrane proteins, either not changed or were decreased (Figure 11B).
we compared 16 counter-receptors belonging to the Ig super-
family with 56 non-counter-receptors of the Ig superfamily As a first step to investigate glycosylation changes in Siglec-1
identified by proteomics. The results showed that most of the counter-receptors, we performed western blotting on CD48,
counter-receptors had more than one predicted N-glycosylation as an example of a protein that did not change expression, and
site per Ig-like domain, while most of the non-counter-receptors PD-1, as an example of a protein that is upregulated on acti-
had less than one site per domain (Figure 10D,E). This vated Tregs. Compared to resting Tregs, both CD48 and
suggests that glycosylation density is an important determi- PD-1 from activated Tregs displayed a more heterogeneous
nant of functioning as a Siglec-1 counter-receptors, presumably smear and increased molecular weight by SDS-PAGE, indicat-
by allowing them to mediate higher avidity binding to ing increased glycosylation (Figure 11C,D). For PD-1, this was
clustered Siglec-1. Next, we asked if the counter-receptors were confirmed following treatment of affinity-purified PD-1 with
upregulated on activated Tregs compared to resting cells. This PNGase F to remove N-glycans, which resulted in PD-1 from
was investigated at both the protein level using flow cytom- resting and activated Tregs migrating similarly by SDS-PAGE
etry (Figure 11A) and at the mRNA level using RNA-Seq data (Figure 11E). Finally, affinity-purified PD-1 from resting and
Page 14 of 24Wellcome Open Research 2021, 6:134 Last updated: 11 JUN 2021
Figure 9. Quantitative proteomic analysis of proteins from proximity labelling experiments. After proximity labelling, the cells
were lysed and streptavidin beads were used to enrich biotinylated proteins for proteomic analysis. (A) Histogram of log2 fold changes of
proteins between a proximity labelling experiment and its negative control. Only membrane proteins contained a subset with higher log2
fold changes, resulting in a small proximity labelling tail. (B) Volcano plots of the proteomic data shown as log2 fold change and -log10
p values from paired t-test. A small subset of proteins was found to have significant log2 fold changes, which were mainly membrane
proteins.
Page 15 of 24Wellcome Open Research 2021, 6:134 Last updated: 11 JUN 2021
Table 1. List of Siglec-1 counter-receptors identified by proximity labelling.
Gene names log2 fold change p value Gene log2 fold change p value
names
Plxnb2 3.408307894 0.00244823 Atp1b1 1.76026351 0.000101095
Tnfsf11 3.200035166 0.018665401 Trac;Tcra 1.701583438 5.86E-05
Emb 3.075917964 0.007876617 Cd44 1.691378866 0.000167253
Nt5e 3.024345063 0.005280796 St14 1.681174874 0.00233923
Cd200 2.775011745 3.28E-05 Slc4a7 1.678065082 0.003163946
Slc7a5 2.73475518 0.000811395 Itgb7 1.630313414 0.000741549
Tmem2 2.476666371 0.010418948 Amica1 1.609105761 0.002620728
Entpd1 2.451121422 2.31E-05 Tlr2 1.602045805 0.005176914
Icam1 2.39946905 0.001301713 Itgal 1.506602363 5.91E-05
Cd36 2.36357507 0.000360733 Adgre5;Cd97 1.484718926 0.000147198
Alcam 2.349663889 0.001106104 Itgb6 1.45152913 0.000181207
Slc3a2 2.312643859 0.000110602 Itgb2 1.438960296 0.000402497
Cd80 2.26982976 0.001791933 Prnp 1.419583945 0.004513303
Cd69 2.265710589 0.005099445 Ptprc 1.414131506 0.000199609
Ly6e 2.187298039 0.000319921 Spn 1.408694655 0.004129782
Itgb3 2.174073587 0.007612442 Itgb5 1.406146072 0.000999951
Cd48 2.138949606 0.000380995 Il18r1 1.386062293 0.000560288
Bsg 2.042021555 0.001567574 Itgae 1.346952587 8.27E-05
Pecam1 1.938435284 0.011336039 Pdcd1 1.335366065 0.019382887
Slamf1 1.89767313 0.014593304 Cr1l 1.294204529 0.004629208
Thy1 1.882500884 0.000949947 Itgb1 1.266107792 0.00026695
Icos 1.864047709 0.006299044 Cd274 1.205180756 0.003790173
Ncstn 1.832939578 0.003987165 H2-D1;H2-L 1.202468601 0.001008074
Cd5 1.775109343 0.000259476 Il2ra 1.195019215 0.000200364
Atp1b3 1.764153318 0.000248229
Table shows gene names, log2 fold change compared to signal seen in control group following proximity-labelling with
Siglec-1-R97A-Fc complexes and significance levels for 49 counter-receptors identified by proximity labelling.
HRP, human IgG Fc and Siglec-1 were among the top 10 significant biggest log2 fold changes, which are not included in
this table.
activated Tregs was treated with sialidase, leading to increased studies10,28, we found Siglec-1 binding to Tregs depended
migration by SDS-PAGE showing that it carries sialylated completely on Treg activation. Based on this finding, a key
glycans with potential to be recognised by Siglec-1 (Figure 11F). part of our strategy was to analyse glycosylation changes by
performing side-by-side comparisons of resting and activated
Discussion Tregs using a range of unbiased and targeted approaches. These
The major aim of this study was to obtain insights into the included RNA-Seq, glycomics, proteomics and staining with
molecular basis of Siglec-1-dependent interactions of mac- lectins and anti-glycan antibodies. Furthermore, we used a
rophages with Tregs and thus improve our understanding recently-described proximity labelling strategy37,38 to identify
of how this lectin promotes inflammatory responses in cer- membrane proteins on activated Tregs that could function as
tain autoimmune diseases. Consistent with in vivo and in vitro Siglec-1 counter-receptors. This comprehensive combined
Page 16 of 24Wellcome Open Research 2021, 6:134 Last updated: 11 JUN 2021
Figure 10. Characterization of Siglec-1 counter-receptors. (A) Total membrane proteins on activated Tregs were identified by
combining the data from proteomics of total cell-surface proteins and proteomics of total cell lysates. Membrane proteins identified
in at least two of three biological replicates were selected. Siglec-1 counter-receptors make up 5.2% of the total membrane proteins.
(B) Counter-receptor mRNAs were mapped to the mRNAs of membrane glycoproteins on activated Tregs. The mRNAs with normalized
counts above 100 were used for the histogram plot. Each red dot represents a counter-receptor. (C) Siglec-1 counter-receptors were mapped
to the histogram of copy number per cell of membrane glycoproteins on activated Tregs. Each red dot represents a counter-receptor.
(D) Predicted N-glycosylation sites per Ig like domain for membrane glycoproteins that are not Siglec-1 counter-receptors. (E) Predicted
N-glycosylation sites per Ig like domain for Siglec-1 counter-receptors.
Page 17 of 24Wellcome Open Research 2021, 6:134 Last updated: 11 JUN 2021
Figure 11. Expression and glycosylation of Siglec-1 counter-receptors on resting and activated Tregs. (A) Eight Siglec-1 counter
receptors were randomly selected for cytometry analysis. All experiments were performed three times and similar results were observed.
(B) Normalized mRNA counts of Siglec-1 counter receptors were obtained from Treg RNA-Seq data. The result is visualized in a volcano
plot. Only a small subset of counter-receptors showed strongly increased gene expression following Treg activation. The counter-receptors
selected for flow cytometry analysis are highlighted in red. (C) Western blot showing that CD48 had a higher molecular weight in activated
Tregs. (D) Western blot of PD-1 affinity-purified from resting and activated Tregs. PD 1 showed a dramatic decrease of molecular weight after
PNGase F digestion (D), PD-1 from activated Tregs had higher molecular weight (E) and following sialidase treatment, PD-1 from resting and
activated Tregs migrated at a slightly reduced molecular weight indicating the presence of sialic acids (F).
Page 18 of 24Wellcome Open Research 2021, 6:134 Last updated: 11 JUN 2021
approach has provided a wealth of new information regard- specific changes of NeuGc capped glycans were due to altered
ing glycomics changes and Siglec-1 recognition following sialyltransferase gene expression upon Treg activation.
Treg activation. Clear changes in glycosylation were observed
for both N-glycans and glycolipids and many glycogenes While there was no overall change in levels of α2,3-sialylation
were altered in expression following Treg activation. Although measured with MALII lectin in activated Tregs, RNA-Seq
the precise mechanisms by which these changes lead to showed reduced expression of sialyltransferases St3gal1, 2
increased Siglec-1 binding remain to be determined, they and 6 and increased expression of St3gal5. These observa-
are likely to involve complex protein- and lipid-dependent tions suggest that individual glycoconjugates that function as
modification of sialylation at an individual carrier level. The acceptors for these enzymes may differ significantly in
identification of 49 Siglec-1 glycoprotein counter-receptors α2,3 sialylation between resting and activated Tregs. For
provides important clues as to how Siglec-1 can mediate adhesion example, expression of St3gal6 has been associated with
and signalling to activated Tregs. These counter-receptors were generation of the selectin ligand sialylLex43 and its reduced
dominated by adhesion and signalling glycoproteins mainly expression in activated Tregs could be important for modulat-
related to T cell activation and proliferation (Table 1, Extended ing homing of these cells to inflamed sites. ST3Gal5 is also
data Table 2)31. Importantly, several counter-receptors showed known as GM3 synthase, which converts lactosyl ceramide
increased expression at the protein level and preliminary analy- to GM3. GM3 can be further converted to α2,8-disialylated
ses showed increased glycosylation following Treg activa- GD3 by ST8Sia1 (GD3 synthase). The increased expres-
tion. The combined effect of all changes noted above could sion of St3gal5 and decreased expression of St8sia1 suggests
lead to increased Siglec-1 binding and signalling to activated that GM3 is upregulated on activated Tregs where it could func-
Tregs. tion as a ligand for Siglec-1. GM3 is known to be a dominant
ligand for Siglec-1 interactions with retroviruses such as HIV
Although the focus of this study was on the lectin Siglec-1, and is able to mediate recognition and internalisation of viral
there are many other endogenous lectins such as galectins particles by Siglec-1-expressing macrophages44,45. While future
and C-type lectins whose binding could be greatly affected studies are required to investigate expression of GM3 follow-
by the glycosylation changes observed leading to altered Treg ing Treg activation and its potential role in Siglec-1 recogni-
functions40. The glycan remodelling of Tregs could also be tion, we were unable to detect GM3 in the glycolipid analysis.
important in intrinsic functions of these cells since it is well This may be due to the low level of St3Gal5 expression relative
known that glycosylation has complex pleiotropic effects on cell to other St3Gals, resulting in synthesis of GM3 at levels below
function and behaviour41. our detection threshold.
Previous studies with effector CD4 T cells have also demon- An important aim of this study was to identify glycoproteins
strated activation-dependent increases in Siglec-1 binding, on activated Tregs that could function as counter-receptors for
and these were ascribed to a switch from NeuGc to NeuAc and Siglec-1 and mediate the biological effects, namely suppres-
increased α2,3-linked sialic acids following activation29,30. In sion of Treg expansion during autoimmune inflammatory
the present study, we were unable to see obvious global changes responses. Although pull-down approaches are widely used to
in either of these parameters using anti-NeuGc antibody stain- identify high affinity protein binding partners, these may not
ing and MALII plant lectin that binds α2,3 linked sialic be reliable for identifying counter-receptors for lectins such as
acids. The unaltered expression of NeuGc at the cell surface Siglec-1, which rely on high avidity interactions with clus-
was consistent with RNA-Seq analysis of Cmah, which tered glycan ligands. Clustering could result from organi-
encodes the enzyme responsible for converting CMP-NeuAc to sation of membrane glycoproteins and glycolipids within
CMP-NeuGc, did not show a significant change of expres- microdomains of the membrane, as well as through a high den-
sion in resting and activated Tregs. It appears, therefore, that sity of glycan ligands on individual glycoproteins. Pull-down
regulation of Siglec-1 ligand expression by Tregs is funda- approaches depend on detergents to lyse cells and solubi-
mentally different from effector CD4 T cells. However, gly- lise membrane proteins. As such, they disrupt the organization
comics analysis did identify minor changes in NeuGc capped and clustering of glycoproteins in the cell membrane that may
glycans upon Treg activation. We also detected clear reduc- be critical for Siglec-1 binding.
tions in NeuGc expression in glycolipid analysis following
activation, but as these gangliosides are likely to be relatively Proximity labelling is a recently developed method, which
minor carriers of sialic acids compared to glycopro- has been used widely to study protein-protein interactions in
teins, their altered levels are probably not detectable with living, intact cells46–51. In general, this approach uses enzyme
anti-NeuGc antibody and their impact on Siglec-1-dependent conjugates as baits that bind cellular target proteins. Addition
binding is unclear. Interestingly, a previous study has found that of suitable substrates leads to the generation of highly reac-
ST6Gal I showed 4-7 times higher affinity for CMP-NeuGc tive radicals that tag neighbouring proteins, which can then be
than CMP-NeuAc, while ST3Gal I showed no significant enriched and identified by mass spectrometry. This method can
difference between them42. This implies that sialyltrans- also be used to identify Siglec counter-receptors by building
ferases can have different activities towards CMP-NeuGc and Siglec-HRP multimers. We previously prepared in-solution
CMP-NeuAc, which could lead to different incorporation of Siglec-1-HRP multimers by mixing Siglec-1-huIgG-Fc fusion
NeuGc and NeuAc to target glycans. It is possible that the protein with HRP-conjugated polyclonal anti-huIgG-Fc and
Page 19 of 24You can also read