Synergistic Effects of Melittin and Plasma Treatment: A Promising Approach for Cancer Therapy - MDPI
←
→
Page content transcription
If your browser does not render page correctly, please read the page content below
cancers
Article
Synergistic Effects of Melittin and Plasma Treatment:
A Promising Approach for Cancer Therapy
Priyanka Shaw 1 , Naresh Kumar 1, *, Dietmar Hammerschmid 2 ,
Angela Privat-Maldonado 1 , Sylvia Dewilde 2 and Annemie Bogaerts 1, *
 1    Research Group PLASMANT, Department of Chemistry, University of Antwerp,
      BE-2610 Wilrijk-Antwerp, Belgium
 2    Laboratory of Protein Science, Proteomics & Epigenetic Signaling, Department of Biomedical Sciences,
      University of Antwerp, BE-2610 Wilrijk-Antwerp, Belgium
 *    Correspondence: naresh.kumar@uantwerpen.be (N.K.); annemie.bogaerts@uantwerpen.be (A.B.)

 Received: 18 June 2019; Accepted: 1 August 2019; Published: 3 August 2019

 Abstract: Melittin (MEL), a small peptide component of bee venom, has been reported to exhibit
 anti-cancer effects in vitro and in vivo. However, its clinical applicability is disputed because of its
 non-specific cytotoxicity and haemolytic activity in high treatment doses. Plasma-treated phosphate
 buffered saline solution (PT-PBS), a solution rich in reactive oxygen and nitrogen species (RONS) can
 disrupt the cell membrane integrity and induce cancer cell death through oxidative stress-mediated
 pathways. Thus, PT-PBS could be used in combination with MEL to facilitate its access into cancer
 cells and to reduce the required therapeutic dose. The aim of our study is to determine the reduction
 of the effective dose of MEL required to eliminate cancer cells by its combination with PT-PBS. For
 this purpose, we have optimised the MEL threshold concentration and tested the combined treatment
 of MEL and PT-PBS on A375 melanoma and MCF7 breast cancer cells, using in vitro, in ovo and in
 silico approaches. We investigated the cytotoxic effect of MEL and PT-PBS alone and in combination
 to reveal their synergistic cytological effects. To support the in vitro and in ovo experiments, we
 showed by computer simulations that plasma-induced oxidation of the phospholipid bilayer leads to
 a decrease of the free energy barrier for translocation of MEL in comparison with the non-oxidized
 bilayer, which also suggests a synergistic effect of MEL with plasma induced oxidation. Overall, our
 findings suggest that MEL in combination with PT-PBS can be a promising combinational therapy to
 circumvent the non-specific toxicity of MEL, which may help for clinical applicability in the future.

 Keywords: melittin; reactive oxygen and nitrogen species; oxidation; molecular dynamics; permeation
 free energy; cold atmospheric plasma

1. Introduction
     Melittin (MEL) is a water-soluble cationic amphipathic 26 amino acid α-helical peptide obtained
from the honeybee (Apis mellifera) venom [1]. It is a very nonspecific cytolytic peptide that rapidly
associates with phospholipid cell membranes. It moves in a lateral direction in the membrane, yielding
oligomerization, thereby leading to structural defects (e.g., pores) in the cell membrane [2]. In addition,
when reaching the intracellular environment, it can act in a similar way on the membrane of internal
organelles, inducing biochemical changes that cause cell death [3,4]. Therefore, several studies have
demonstrated that MEL has inhibitory effects on the proliferation of various cancer cells in vitro via
the induction of apoptosis, necrosis and cell lysis [5]. MEL can target a range of cancer cells, including
those in leukaemia, lung, renal, liver, bladder and prostate cancer, via activation of a caspase-dependent
pathway [6–9]. However, despite the convincing efficacy data against various cancers, its clinical
applicability is precluded due to the non-specific toxicity shown at high doses. Specifically, in vivo

Cancers 2019, 11, 1109; doi:10.3390/cancers11081109                               www.mdpi.com/journal/cancers
Cancers 2019, 11, 1109                                                                              2 of 19

experiments have demonstrated that MEL can induce cytolysis, aggregation of membrane proteins,
haemolytic activity, spontaneous pain, increased blood flow (neurogenic inflammation) and the
appearance of regions of hyperalgesia around the site of injection [10–13]. These toxic aspects of MEL
are indeed considered as a limiting factor for its use in cancer therapy [14]. Nevertheless, to reduce the
nonspecific toxicity, several combinations of MEL with chemotherapeutic drugs and nanotechnology
have been reported [1,15–17]. However, these combinations still remain challenging [18]. Additionally,
Orsolic and Alonezi et al. explored the dose dependent growth-inhibiting impact of MEL in conjunction
with cytotoxic drugs such as cisplatin and bleomycin on melanoma, HeLa and V79 cells in vitro [19,20].
Further, Alizadehnohi et al. reported that MEL enhanced the cytotoxic impact of cisplatin in human
ovarian cancer cells [21]. However, the combined use of MEL and cisplatin to treat cancer cells still
remained a challenge due to the side effects and off-target toxicity [18,22]. It has been suggested that
the combination of MEL with nanoparticles could increase the safe delivery of significant amounts of
MEL intravenously to target and kill tumours, while reducing the haemolytic activity of MEL [1,15].
However, the role of nanotechnology in delivering MEL is still at its early development stage because
of drawbacks during the preparation for nano delivery systems such as aggregation, morphological
changes, peptide stability, etc. Moreover, these systems are expensive to implement for cancer
therapy [23]. Thus, further studies aiming to reduce the therapeutic dose of MEL and its associated
unspecific cytolytic activity are needed. In this context, we propose the combination of MEL with a
solution treated with cold atmospheric plasma (CAP), a novel therapy that could help to overcome the
current limitations of MEL.
     CAP is a partially ionized gas, which contains a mixture of highly reactive chemical species, also
called reactive oxygen and nitrogen species (RONS), such as • OH, O, O2 •− , 1 O2 , O3 , NO• , NO2 • ,
NO2 − , NO3 − and H2 O2 [24,25]. CAP can react with an organic surface without inflicting any thermal
or electrical damage, and recently it has been shown that it can selectively target cancer cells with
minimal effects on normal cells [26]. Thus, CAP is now being investigated and used in various medical
applications, ranging from sterilization, antifungal treatment, tooth bleaching and chronic wound
healing, to cancer therapy [27–29]. Usually it is believed that CAP-produced RONS can enhance the
fluidity of the cell membrane through lipid peroxidation, which eventually affects the intracellular
biochemical signalling pathways [30,31]. In addition, it has been shown that CAP facilitates the uptake
of nanoparticles and enhances their therapeutic action in cells [32]. For instance, it was shown that
gold nanoparticles were endocytosed at an accelerated rate in the U87 cell membrane due to the RONS
generated by CAP [33].
     In the present study, we have used in vitro, in ovo and in silico approaches to study the ability of
CAP-treated phosphate buffered saline solution (PT-PBS) to reduce the nonspecific toxicity of MEL and to
induce cell death in A375 melanoma and MCF7 breast cancer cells. To investigate the cytotoxic effect,
various ratios of PT-PBS and MEL alone and in combination were applied to both cell lines. After dose
optimisation of MEL and PT-PBS alone and in combination, we evaluated cell death and lipid peroxidation.
     Additionally, to obtain a better insight into the level of synergy of MEL and PT-PBS, we calculated
the free energy barrier for the translocation of MEL across native and (plasma-)oxidised phospholipid
bilayers (PLBs) through molecular dynamics (MD) simulations. In the literature, MD simulations
have reported the interaction of MEL with PLB [34], the peptide orientation [35], the deformation of
lipids [36], and the change in secondary structure [37]. MEL has been shown to maintain a stable
helical structure on the PLB surface [38]. However, only a few articles have reported the simulation of
the free energy of MEL in a native PLB [39,40]. Irudayam et al. [39] studied the free energy barrier for
MEL reorientation from a membrane-bound state (i.e., with the MEL helix parallel to the surface of
the PLB) to a transmembrane state (or T-state, i.e., with the MEL helix perpendicular to the bilayer
surface in the lipid region of the PLB). They found that a higher MEL concentration leads to a decrease
of the free energy barrier. Furthermore, Irudayam and Berkowitz [40] calculated the free energy of
MEL adsorption on the PLB surface. The authors indicated that MEL expresses a strong affinity to
the bilayer surface. Note that the above studies only applied to a native PLB, and not to oxidized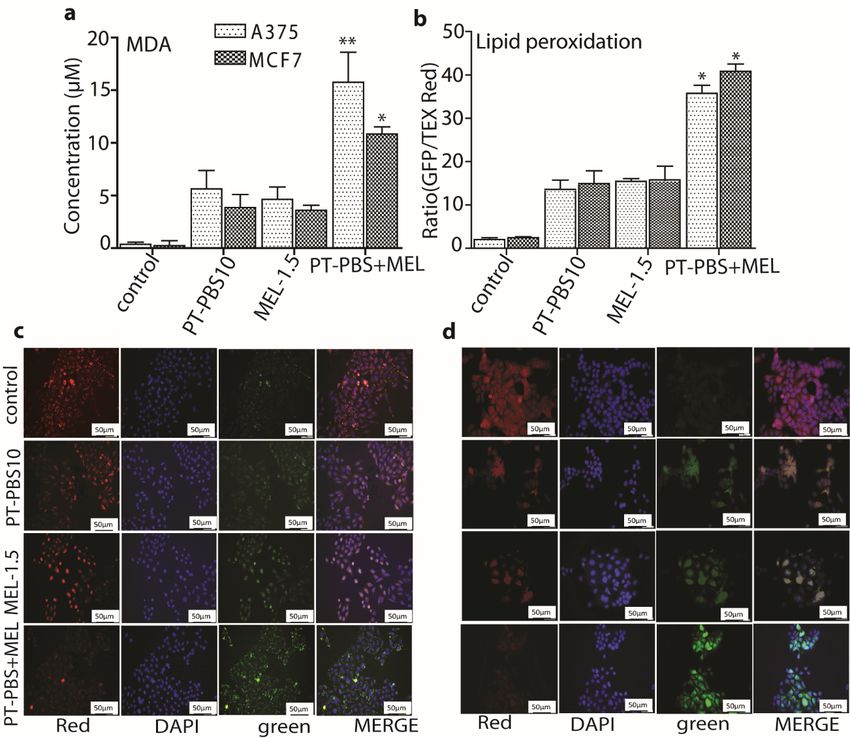
Cancers 2019, 11, x 3 of 19
Cancers 2019, 11, 1109 3 of 19
strong affinity to the bilayer surface. Note that the above studies only applied to a native PLB, and
not to oxidized PLBs, which would be the result of plasma oxidation. Indeed, the translocation of
PLBs,
MEL which would
through the be theand
PLB, result of free
the plasma oxidation.
energy barrierIndeed,
of MEL theintranslocation
an oxidizedofPLB
MELwasthrough the
not yet
PLB, and the free energy barrier of MEL in an oxidized PLB was not yet investigated. Therefore,
investigated. Therefore, in the present study we analysed the free energy barrier for translocation of
inMEL
the present study and
in both native we analysed
(plasma-)the free energy
oxidized barrierOverall,
membrane. for translocation of MELand
our experimental in both native and
computational
(plasma-) oxidized membrane. Overall, our experimental and computational approaches
approaches reveal that this combinational therapy opens unique opportunities for future reveal that
cancer
this combinational
treatment. therapy opens unique opportunities for future cancer treatment.
2.2.Materials
Materialsand
andMethods
Methods
2.1. Reagents and Cell Lines
2.1. Reagents and Cell Lines
The following reagents and kits were used in this study: MTT (3-[4,5-dimethylthiazol-2yl]-2,5-
The following reagents and kits were used in this study: MTT (3-[4,5-dimethylthiazol-2yl]-2,5-
diphenyltetrazolium bromide) (Sigma-Aldrich, Darmstadt, Germany), DMSO (dimethyl sulphoxide)
diphenyltetrazolium bromide) (Sigma-Aldrich, Darmstadt, Germany), DMSO (dimethyl sulphoxide)
(Sigma-Aldrich),
(Sigma-Aldrich),Annexin
Annexin V-FITC
V-FITC apoptosis
apoptosis detection
detection kit
kit (BD
(BD Biosciences, Allschwil, Switzerland),
Biosciences, Allschwil, Switzerland),
Image-iT (Thermo Fisher Scientific, Merelbeke, Belgium), ProLong™ Gold Antifade Mountant
Image-iT (Thermo Fisher Scientific, Merelbeke, Belgium), ProLong™ Gold Antifade Mountant with with
DAPI (Thermo Fisher Scientific), MDA Assay Kit (CELL BIOLABS, INC, San Diego, CA,
DAPI (Thermo Fisher Scientific), MDA Assay Kit (CELL BIOLABS, INC, San Diego, CA, USA). USA). Melittin
85% (HPLC)
Melittin 85%was purchased
(HPLC) was from Sigma-Aldrich.
purchased The humanThe
from Sigma-Aldrich. breast adenocarcinoma
human (MCF7) and
breast adenocarcinoma
human malignant melanoma (A375) were obtained from the American Type Culture Collection
(MCF7) and human malignant melanoma (A375) were obtained from the American Type Culture (ATCC,
Manassas,
CollectionVA, USA).
(ATCC, Manassas, VA, USA).
2.2. Plasma Device and Sample Preparation
2.2. Plasma Device and Sample Preparation
MEL
MEL85%85%(HPLC)
(HPLC)was waspurified
purified from
from bee
bee venom
venom andand reconstituted in sterile
reconstituted in sterile PBS
PBStotoform
formaastock
stock
◦
solution
solutionofof11mg/mL
mg/mLbefore storageatat−20
beforestorage −20 °CC until
until required. The concentration
required. The concentration of ofMEL
MELmentioned
mentionedinin
the following text (0–10 µL/mL) means that 0–10 µL of the original stock solution were
the following text (0–10 µL/mL) means that 0–10 µL of the original stock solution were added to cellsadded to cells
contained
containedinin11mLmLculture
culturemedia.
media. InIn this study, the
this study, abbreviations MEL-10,
the abbreviations MEL-10,MEL-5,
MEL-5,MEL-2.5,
MEL-2.5,MEL-1.2,
MEL-1.2,
and
andMEL-0.6
MEL-0.6areareused
usedfor
forthe
the MEL
MEL concentrations
concentrations of of 10
10 µg/mL,
µg/mL, 55 µg/mL,
µg/mL, 2.52.5 µg/mL, 1.2µg/mL,
µg/mL,1.2 and
µg/mL,and
0.6 µg/mL, respectively. To make a plasma-treated PBS (PT-PBS) solution, the kINPen ® IND plasma jet
0.6 µg/mL, respectively. To make a plasma-treated PBS (PT-PBS) solution, the kINPen IND plasma ®
(INP Greifswald/neoplas
jet (INP Greifswald/neoplastoolstools
GmbH,GmbH,Greifswald, Germany)
Greifswald, Germany)waswas
used, as shown
used, as shownin Figure 1. 1.
in Figure
® IND device. Argon is used as feeding gas with a flow
Figure1.1.Schematic
Figure Schematicdiagram
diagramof
ofthe
thekINPen
kINPen® IND device. Argon is used as feeding gas with a flow
rate
rateofof33lpm
lpm(liter
(literper
perminute).
minute).
Detailed ® IND plasma device was
Detailedinformation
informationabout
about thethe design
design and
and operation
operation of
of the
the kINPen
kINPen® IND plasma device was
reported ®
reportedpreviously
previously[41,42].
[41,42]. Briefly,
Briefly,the
thekINPen
kINPen® IND IND plasma
plasma device
device houses
houses two
two electrodes:
electrodes: aapin
pin
electrode
electrode(1(1mm
mmdiameter)
diameter) inin the
the centre
centre that
that is
is separated
separated byby aa dielectric capillary (1.6
dielectric capillary (1.6 mm
mm inner
inner
diameter) from a grounded ring electrode. The plasma is generated by high frequency
diameter) from a grounded ring electrode. The plasma is generated by high frequency sinusoidal sinusoidal
voltage
voltageofofaround
around2–6
2–6kVpp
kVppto tothe
thecentral
central electrode,
electrode, with
with aa frequency between 1.0
frequency between 1.0 and
and1.1
1.1MHz
MHzand and
a maximum power of 3.5 W. To control the temperature, the device operates in switch off/on mode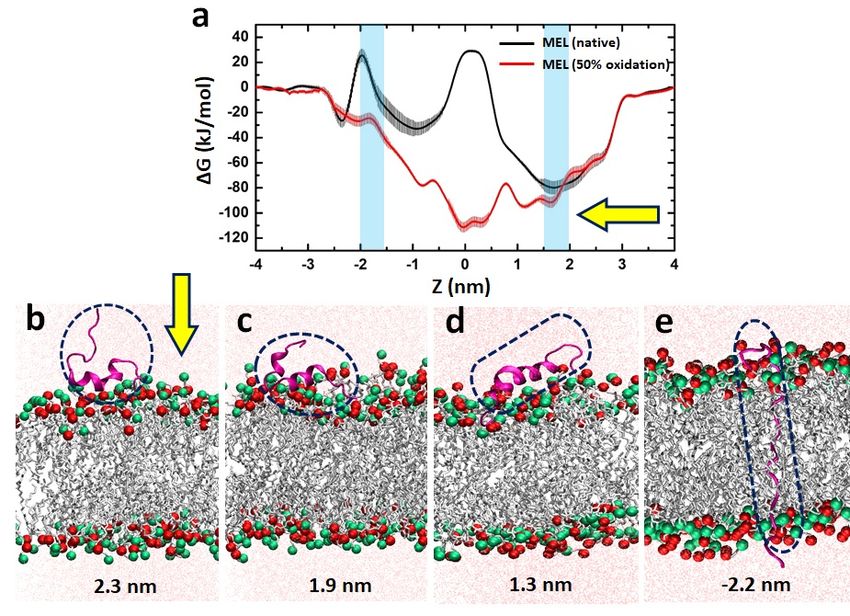
Cancers 2019, 11, 1109                                                                            4 of 19

with a frequency of 2.5 kHz. The plasma is ignited inside the capillary and due to the gas flow it
creates a plasma effluent towards the open side of the device, with a length of 9–12 mm and ca. 1 mm
diameter [41,42]. For the plasma treatments, the plasma source was fed by argon gas for 9 min to treat
2 mL PBS (pH 7.3) in a 12-well plate. During the plasma treatment we kept a 10 mm distance between
the nozzle of the plasma jet device and the liquid surface, as shown in Figure 1 [24,42]. The RONS
present in plasma-treated PBS have been previously described [24], being H2 O2 and NO2 − as two of
the main RONS responsible of the biological effects of PT-PBS.

2.3. Analysis of Cell Cytotoxicity
      The cytotoxicity of PT-PBS and MEL on breast adenocarcinoma (MCF7) and human malignant
melanoma (A375) was evaluated. Both cell lines were cultured in Dulbecco’s Modified Eagle Medium
(DMEM; Life Technologies, Merelbeke, Belgium) supplemented with 10% (v/v) fetal bovine serum (Life
Technologies) and 1% (v/v) penicillin and streptomycin (Life Technologies). The cell cultures were
maintained at a temperature of 37 ◦ C in a humidified incubator containing 5% (v/v) CO2 . The cells were
grown in 75 cm2 tissue culture flasks until they reached confluence and then they were sub-cultured
for the experiments. Seeded into 24-well plates to grow in complete media were 2 × 10⁵ cells/wells.
After 24 h for the single treatment with PT-PBS and MEL, the medium was removed and immediately
replaced with media supplemented with different percentages of PT-PBS, i.e., 20%, 10%, 5%, 2.5%
and 1.2%, and different concentrations of MEL, i.e., MEL-10, MEL-5, MEL-2.5, MEL-1.2, and MEL-0.6
(as described above). Subsequently, to obtain the synergetic effect of both treatments, the optimized
doses of the single treatments (PT-PBS and MEL) were combined. A total volume of 1000 µL per well
was maintained after addition of the respective percentages of PT-PBS and MEL. In this study, the
abbreviations PT-PBS 20, PT-PBS 10, PT-PBS 5, PT-PBS 2.5 and PT-PBS 1.2 were used for the percentages
of 20%, 10%, 5%, 2.5% and 1.2% of PT-PBS (formed after 9 min plasma treatment), respectively. The
cells were placed in an incubator and their viability was monitored for 24 h post PT-PBS and MEL
treatment. To check the viability, the MTT assay was performed after 24 h. In this assay, 50 µL MTT
(3-[4,5-dimethylthiazol-2yl]-2,5-diphenyltetrazolium bromide) solution (5 mg/mL in PBS) was added
to each well. After 3 h incubation, the purple formazan precipitates in each well were released in the
presence of 1000 µL DMSO (dimethyl sulphoxide). The absorbance was measured using a microplate
reader (BIO-RAD iMark Microplate reader, Temse, Brussel, Belgium) at 540 nm and the cell viability
was assessed as the absorbance ratio between the treated and control sample, which was directly
proportional to the number of metabolically active cells. To detect cell death, we used the Annexin
V-FITC apoptosis detection kit. The treated/untreated cells were washed with 1 mL of cold 1× binding
buffer after 3 h incubation and were subsequently trypsinized. Annexin V-FITC (0.5 mg/mL) was
added to each sample. After incubation for 15 min at room temperature, the cells were again washed
with PBS, stained with 0.3 mg/mL of PI (Propidium Iodide) and analysed using flow cytometry (Attune
NxT Flow Cytometer, Brussels, Belgium).

2.4. Estimation of Lipid Peroxidation
     After standardisation of the optimal dosages of PT-PBS, MEL alone and in combination through
the MTT and flow cytometry analysis, we investigated the peroxidation of membrane lipids by
fluorescence microscopy. We seeded 105 cells on cover glass. After 24 h incubation, the cells were
exposed to PT-PBS, MEL alone or to the combination of PT-PBS 10 and MEL-1.5. After treatment for
3h, the cells were incubated with 10 µM Image-iT (lipid peroxidation) molecular probe for 30 min
and fixed in 4% paraformaldehyde (in PBS) for 20 min and then permeabilized in cytoskeleton buffer
(pH 6.8, 50 mM NaCl, 150 Mm sucrose, 3 mM MgCl2 , 50 mM Trizma-base, 0.5% Triton X-100). After
permeabilization, the cells were washed thrice with PBS and subsequently Gold Antifade DAPI was
used to mount the cells. The cells were imaged with Zeiss AxioImager Z1 microscope (Carl Zeiss,
Göttingen, Germany) equipped with an AxioCam MR ver.3.0 using a 40× objective, using filters for
green fluorescent (GFP), red (Texas Red) and blue fluorescent (DAPI) channels. Next, flow cytometry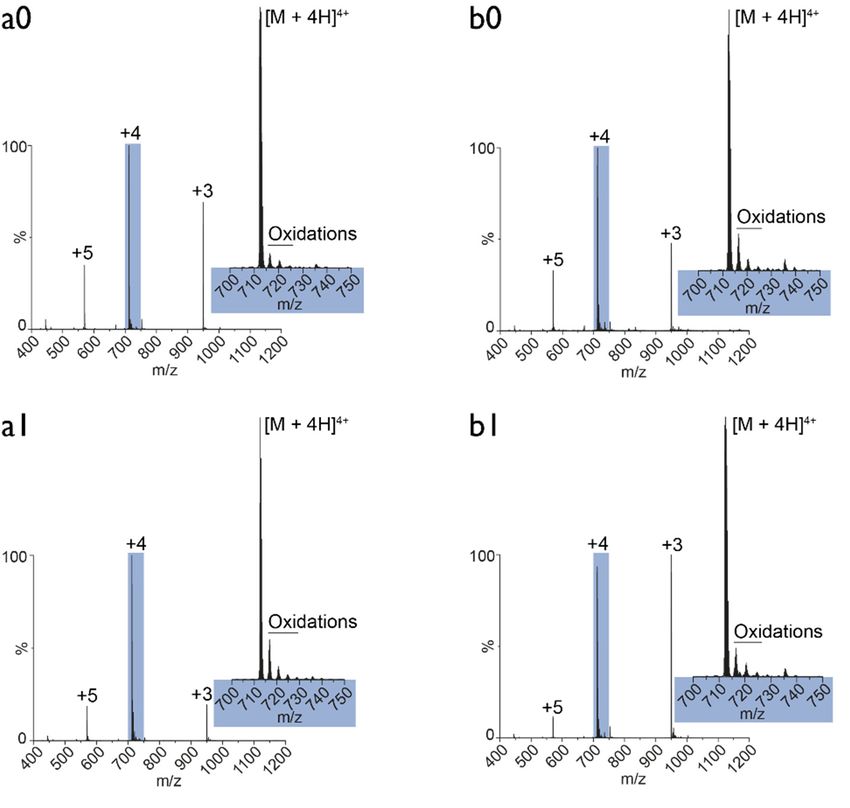
Cancers 2019, 11, 1109                                                                              5 of 19

was used to quantify the fluorescence intensity, after 3 h incubation with PT-PBS, MEL alone and in
combination, at 37 ◦ C in a 5% CO2 atmosphere. The treated/untreated cells were incubated with 10 µM
Image-iT molecular probe for 30 min, and then harvested by trypsinization, washed twice with PBS,
and finally the cells were resuspended in PBS to detect the fluorescence intensity by flow cytometry.
To quantify the fluorescence intensity, we used Texas Red® (590 nm) and FITC (510 nm) emission
filters, and we calculated the ratio of intensity in the Texas Red® channel to the intensity in the FITC
channel. Moreover, for all treatments we also measured the malondialdehyde (MDA) concentration by
the MDA assay kit, following the standard protocol according to the manufacturer’s instructions. This
method is based on the reaction of free MDA (present in the sample) with thiobarbituric acid (TBA) to
generate an MDA-TBA adduct and its quantification is generally used as marker for lipid peroxidation.

2.5. Chicken Chorioallantoic Membrane Assay (CAM Assay)
      Four-day old fertilized chicken eggs were incubated in a horizontal position for 1 day at 37.7 ◦ C
and 65% humidity in an egg incubator with automatic turning function (Ova-Easy 100, Brinsea,
Veenendaal, The Netherlands). On day 5, the upper pole was disinfected and pierced with a 20G sterile
needle (BD) and sealed with medical tape (Leukosilk S, Covamed Farma BVBA, Marke, Belgium).
The eggs were incubated in vertical position (turning function off) to promote the relocation of the air
cell. On day 7, the egg shell was cut to expose the chicken chorioallantoic membrane (CAM). A 1 × 1
mm filter paper soaked in diethyl ether (Fisher Scientific, Merelbeke, Belgium) was briefly applied
on a vascularized region of the CAM and a sterile silicone ring (ID = 5 mm, OD = 6 mm) was placed.
A pellet of A375 cells (2 × 10⁶ cells per egg) was mixed with 15 µL growth reduced factor Matrigel
(8.6 mg/mL, Corning, Amsterdam, The Netherlands) and loaded into the ring. The eggs were sealed
with Tegaderm (3D) and placed back in the incubator for 4 days. On day 11, the Tegaderm was cut
and a sterile plastic ring (ID = 7 mm, OD = 8.5 mm) was placed around the tumour. One hundred
micro litres of untreated PBS, MEL-1.5 µg in 100 µL PBS, 10% of PT-PBS and its combination (MEL
+ PT-PBS) were loaded into the ring. The eggs were sealed with Tegaderm and incubated until the
end of the experiment. The cytotoxic effect of the treatments was assessed on day 14 when tumours
were excised and weighed in a precision balance (Mettler Toledo, Fisher, Merelbeke, Belgium). All
steps outside the incubator were carried out using a heat block (set at 37.7 ◦ C) with a custom-made
egg-shaped aluminium adapter.

2.6. Immunohistochemical Analysis for Ki-67
     After weighing, the tumours were fixed with 4% paraformaldehyde for 14 h at 37 ◦ C prior to
paraffin embedding. Sections of 5 µm were cut, deparaffinized, rehydrated and stained with 1:1
haematoxylin and 0.5% eosin (HE) solution for histological analysis. For Ki-67 staining, antigen retrieval
was performed with citrate buffer (10 mM, pH 6), at 96 ◦ C for 20 min. Sections were permeabilised
in 0.1% Tween-20 and blocked with 3% H2 O2 in PBS (10 min, RT) and 2% BSA (30 min, RT). The
primary antibody incubation was 40 min at RT (1/75 dilution; Mouse Anti-Human Ki-67 Antigen,
Clone MIB-1, Agilent, Santa Clara, CA, USA), followed by incubation with the secondary antibody
(30 min at RT; Envision Flex HRP, Agilent, Diegem, Belgium). Diaminobenzidine was used to visualize
positive staining and haematoxylin to counterstain. Sections were imaged with a Zeiss AxioImager Z1
microscope (Carl Zeiss, Göttingen, Germany) equipped with an AxioCam MR ver.3.0.

2.7. Mass Spectrometry Analysis
     To detect the conformational change in MEL by native mass spectrometry (MS), 1 mg of MEL
was dissolved either in 1 mL untreated PBS (control) or in 1 mL PT-PBS (i.e., 100% of PT-PBS). Each
sample (50 µL) was buffer exchanged to a MS compatible 100 mM ammonium acetate solution using a
Micro Bio-Spin 6 column (Bio-Rad, Hercules, CA, US). MS experiments were conducted on a Synapt
G2 HDMS (Waters, Manchester, UK) instrument. For this purpose, 3 µL of sample was loaded into an
in-house produced gold-coated borosilicate capillary and mounted onto the instrument. The sample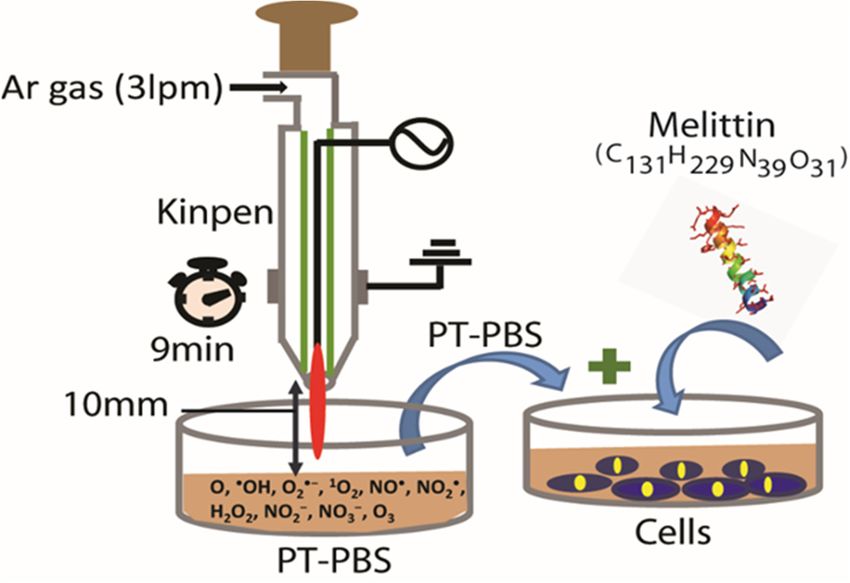
Cancers 2019, 11, 1109 6 of 19
Cancers 2019, 11, x 6 of 19
was ionized by nano-electrospray ionization (nESI) and the generated ions were drawn into the vacuum
the vacuum of the instrument. The crucial parameter settings were 1.2 kV capillary voltage, 10 V
of the instrument. The crucial parameter settings were 1.2 kV capillary voltage, 10 V sampling cone, 1
sampling cone, 1 V extractor cone, 10 V and 2 V collision energy in the trap and transfer cell,
V extractor cone, 10 V and 2 V collision energy in the trap and transfer cell, respectively. Pressures
respectively. Pressures throughout the instrument were set to: 2.75 mbar backing pressure, 4.55 × 10⁻³
throughout the instrument were set to:−22.75 mbar backing pressure, 4.55 × 10⁻³ mbar in the source
mbar in the source region, and 2.5 × 10 mbar in the trap and transfer collision cells.
region, and 2.5 × 10⁻² mbar in the trap and transfer collision cells.
2.8. Statistical Analysis
2.8. Statistical Analysis
Data was analysed using the Students’ t-test comparison analysis. The data was considered
Data was analysed using the Students’ t-test comparison analysis. The data was considered
significantly different when * = p ≤ 0.05, ** = p ≤ 0.01, *** = p ≤ 0.001. All values represent experiments
significantly different when * = p ≤ 0.05, ** = p ≤ 0.01, *** = p ≤ 0.001. All values represent experiments
done in triplicates. Data shown as mean ± standard deviation (SD). Prism (Graphpad Software Inc.,
done in triplicates. Data shown as mean ± standard deviation (SD). Prism (Graphpad Software Inc.,
San Diego, CA, USA) and Excel Software (Microsoft Inc., Redmond, WA, USA) was used to compare
San Diego, CA, USA) and Excel Software (Microsoft Inc., Redmond, WA, USA) was used to compare
the groups.
the groups.
2.9. Computational Analysis
2.9. Computational Analysis
2.9.1.Simulation
2.9.1. SimulationSetup
Setup
ToTosupport
supportthe
theexperiments,
experiments,we
weperformed
performedMD MDsimulations
simulations to
to study
study MEL
MEL translocation
translocation across
across
native and oxidized PLBs. We chose the PLB as the model system for the cellular membrane, as
native and oxidized PLBs. We chose the PLB as the model system for the cellular membrane, as itit
provides the structural framework for the cell membrane. The PLB considered in this study
provides the structural framework for the cell membrane. The PLB considered in this study consists of consists
of palmitoyl-oleoyl-phosphatidylcholine
palmitoyl-oleoyl-phosphatidylcholine (POPC)
(POPC) lipids
lipids (see(see Figure
Figure 2). 2).
Figure2.2.(a)
Figure (a)Intact
Intact(or
(ornative)
native)palmitoyl-oleoyl-phosphatidylcholine
palmitoyl-oleoyl-phosphatidylcholine phospholipid
phospholipid bilayers (POPC
bilayers (POPC
PLB),
PLB),together
togetherwith withmelittin
melittin(MEL)
(MEL)ininthe
thewater
waterregion.
region. For
For the sake of clarity, the N and P atoms
atoms ofof
POPC
POPCare areshown
shownwithwithbigger
biggerbeads
beadsand
andthe
thelipid
lipidtails
tails are
are in
in grey.
grey. The
The yellow
yellow arrow indicates the
indicates the
pulling
pullingdirection
directionofofMEL.MEL.(b)(b)Schematic
Schematicillustration
illustration of
of native
native (POPC)
(POPC) and oxidized (into
(into aldehyde;
aldehyde;
POPC-ALD) phospholipids. The head group consists of choline,
POPC-ALD) phospholipids. The head group consists of choline, phosphate phosphate and glycerol, whereas the
whereas the
lipid
lipidtails
tailsare
aretwotwofatty
fattyacid
acidchains.
chains.
ToTostudy
studythetheeffect
effectofofplasma-induced
plasma-inducedoxidation
oxidation ofof the
the phospholipids
phospholipids on on the
the translocation
translocation of of
MEL
MELthrough
throughthethePLB,
PLB,weweassumed
assumedaldehyde
aldehydeoxidation
oxidation products
products (POPC-ALD,
(POPC-ALD, see Figure 2b),
see Figure 2b), which
which
are found to be one of the key oxidation products [43]. The simulations were carried
are found to be one of the key oxidation products [43]. The simulations were carried out using the out using the
GROMACS package (version 5.1) [44], applying the GROMOS 54A7 force field
GROMACS package (version 5.1) [44], applying the GROMOS 54A7 force field [45]. The force field [45]. The force field
parameters
parametersofofthe
thealdehyde product of
aldehyde product ofthe
theoxidized
oxidizedPOPC
POPC (POPC-ALD)
(POPC-ALD) were
were obtained
obtained from from
[46].[46].
To
Togenerate
generatethe
theinitial
initial configurations of the intact (or native) and oxidized POPC systems, we
the intact (or native) and oxidized POPC systems, we applied applied the
Packmol package
the Packmol [47]. Each
package system
[47]. Each consists
system ofconsists
20,000 water molecules
of 20,000 watertogether
moleculeswithtogether
128 phospholipids
with 128
organized in twoorganized
phospholipids layers (i.e.,in64 lipids
two with
layers corresponding
(i.e., 64 lipids withwater layer at thewater
corresponding top, and
layer64atatthe
thetop,
bottom,
and
64 at the bottom, see Figure 2a). MEL has an α-helical configuration and was placed on the upper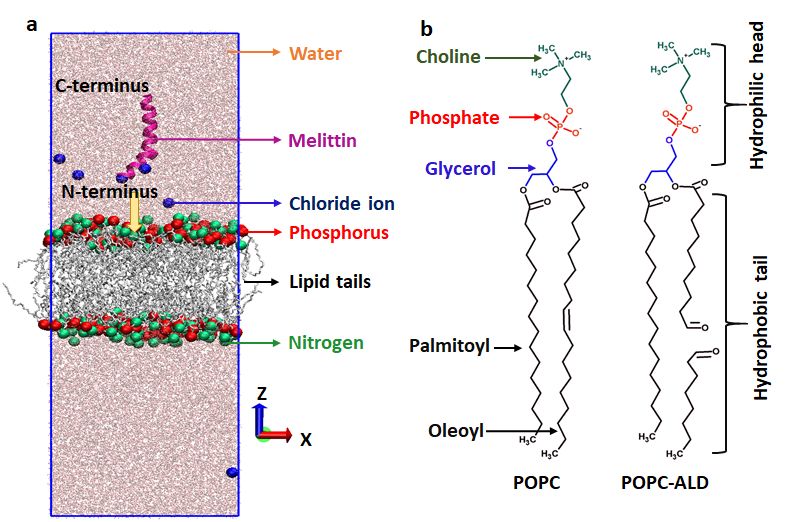
Cancers 2019, 11, 1109                                                                              7 of 19

see Figure 2a). MEL has an α-helical configuration and was placed on the upper side of the PLB, i.e.,
in the water phase at about 1.5 nm above the head group region of the bilayer (see Figure 2a, and
below for more details). To evaluate the effect of plasma-induced oxidation of the native POPC, we
replaced randomly 64 POPC molecules with POPC–ALD (i.e., 32 at the top and 32 at the bottom),
corresponding to 50% oxidation. Thus, we studied two model systems, i.e., native (0% oxidation) and
50% aldehyde-oxidized PLBs. We assumed 50% oxidation, which is enough to clearly investigate the
effect of translocation of MEL across the bilayer, but low enough to avoid pore formation within the
simulation [48]. In order to obtain the average free energy profile (FEP) of MEL translocation across
each system (see section below), we created three model systems for both native and 50% oxidized
PLB. In each system we changed the position of MEL in the xy-plane, keeping the distance between
MEL and the centre-of-mass (COM) of the bilayer constant in the z-direction (reaction coordinate).
Moreover, to neutralize the system, we added 6 Cl− ions, because of the +6 charge of MEL. After
construction of the hydrated membranes with equilibrated MEL at the top, all the systems were
energy-minimized using the steepest descent algorithm. Further, all structures (i.e., three native and
three oxidized PLBs) were equilibrated for 200 ns (for the native case) and 300 ns (for the oxidized
case) in the NPT ensemble (i.e., at constant number of particles, pressure and temperature), at 310 K
and 1 bar, employing the semi-isotropic Parrinello–Rahman barostat [49] with a compressibility and
coupling constant of 4.5 × 10⁻⁵ bar−1 and 1 ps, respectively, as well as Nose-Hoover thermostat [50]
with a coupling constant of 0.2 ps. For the non-bonded interactions, a 1.2 nm cut-off was applied.
Periodic boundary conditions were applied to all systems in all Cartesian directions. The long-range
electrostatic interactions were described by the particle mesh Ewald (PME) method [51], using a 1.2 nm
cut-off for the real-space interactions and 0.15 nm spaced-grid for the reciprocal-space interactions. The
SPC/E (extended simple point charge) model was used to represent the water molecules surrounding
the membrane and MEL. In all simulations, we used a time step of 2 fs.

2.9.2. Umbrella Sampling
       In order to determine the FEPs of MEL translocation through the native and 50% oxidized PLBs,
we applied umbrella sampling (US) simulations. To avoid disturbances in the hydrophobic part of the
bilayer, we kept MEL perpendicular to the surface (as shown in Figure 2a), also called the transmembrane
state (T state), which is the stable state of MEL when it begins to diffuse inside the membrane [52].
Furthermore, to avoid the formation of the U-shaped conformation of MEL, we pulled the COM of the
first three residues of the N-terminus of MEL towards the bilayer (see arrow indicated in Figure 2a).
       For each FEP, we extracted 95 windows along the z-axis, which were separated by 0.1 nm. These
windows were obtained by pulling the COM of the first three residues of the N-terminus of MEL in the
z-direction (as mentioned above), applying a harmonic bias between MEL and the COM of the PLB,
with a force constant of 2000 kJ·mol−1 nm−2 and a very slow pulling rate of 0.001 nm·ps−1 . Each US
simulation lasted for 200 ns, and the last 50 ns were used to collect the US histograms and to calculate
the FEPs. A periodic version of the weighted histogram analysis method (WHAM) [53] implemented
in GROMACS, was applied to construct the FEPs. The final energy profiles were obtained by averaging
over three FEPs for each system, which differ from one another based on their starting structure,
to allow for some statistical variations.

3. Results and Discussion

3.1. Effects of PT-PBS and MEL on Cell Viability and Dose Optimization
     To verify the effect of MEL, PT-PBS alone and its synergy on the growth of melanoma and breast
cancer cells, we analysed the cell viability using the MTT assay. Treatments by MEL and PT-PBS alone
exerted a concentration-dependent cytotoxic effect on both cell lines (Figure 3a,b). Up to 2.5 µg/mL of
MEL shows significant decrease in viability in both cell lines. In addition, PT-PBS 20 and PT-PBS 10
also show a significant inhibitory effect on both cell lines after incubation for 24 h. For the controls,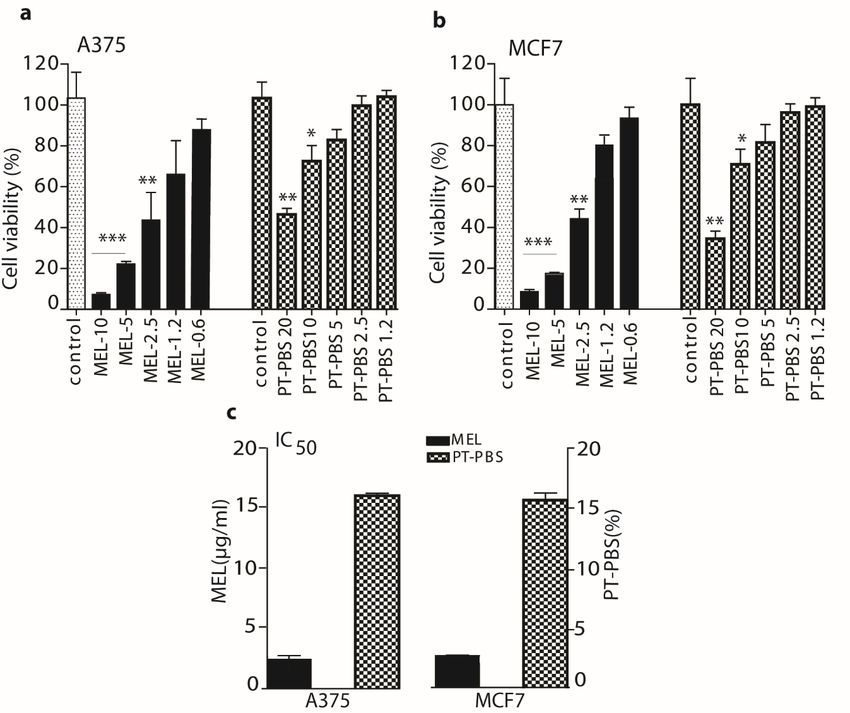
A375 and MCF7 cells, respectively, and 10% non-treated PBS in culture media for the cell death
analysis and lipid peroxidation analysis in both cell lines.
The half maximal inhibitory concentrations (IC50) of MEL and PT-PBS are shown in Figure 3c.
The2019,
Cancers IC5011,
values
1109 of MEL in A375 and MCF7 cells were 2.5 and 2.8 µg/mL, respectively, while they 8were of 19
16.4% and 16.5%, respectively, for PT-PBS. Based on the IC50 values, we performed the combined
treatment of MEL and PT-PBS, to investigate the synergy between both. For this purpose, we fixed
20%theand 10% non-treated
concentration PBS in
of PT-PBS to the culture
a value media
lower thanwere
its ICused for the
50 values MTT
(i.e., assay itfor
we fixed at the A375
10%) andand
we
MCF7
varied the concentrations of MEL in a range lower than its obtained IC50 values (i.e., 2, 1.5, 1 andand
cells, respectively, and 10% non-treated PBS in culture media for the cell death analysis 0.5
lipid peroxidation analysis in both cell lines.
µg/mL).
Figure 3. Estimation
Figure of optimal
3. Estimation doses
of optimal of MEL
doses and PT-PBS
of MEL and PT-PBSalone,alone,
for thefor
cytotoxicity of A375
the cytotoxicity ofand MCF7
A375 and
MCF7
cells. We cells. We measured
measured the cell viability
the cell viability of (a)
of (a) A375 A375
cells, andcells,
(b)and
MCF7(b) cells,
MCF7atcells, at different
different doses doses
of MELof
andMEL and after
PT-PBS, PT-PBS,
24 hafter 24 h incubation.
incubation. (c) Half inhibitory
(c) Half maximal maximal inhibitory concentration
concentration (IC50)
(IC50 ) values values
of MEL of
and
MEL Data
PT-PBS. and PT-PBS.
shown asData shown
mean ± SD; * = p ±≤SD;
as mean * =**p ≤=0.05;
0.05; ** = p ***
p ≤ 0.01; = p***
≤ 0.01; = p ≤ 0.001.
≤ 0.001.
TheAshalf maximal
shown inhibitory
in Figure concentrations
4a,b, PT-PBS (IC50 ) of65%
10 alone yielded MEL and PT-PBS
viability for both areA375
shown
andin Figure
MCF7 3c.
cells,
Thewhile
IC50 MEL-2,
values of MEL inMEL-1
MEL-1.5, A375 and
andMCF7
MEL-0.5cells were
alone 2.5 andin2.8
resulted ca.µg/mL,
50%, 60%,respectively,
77% and 90%while they
cell were
viability
for the
16.4% andA375
16.5%,cells, and ca. 55%,
respectively, for 70%, 80%Based
PT-PBS. and 95% for the
on the IC50MCF7
values,cells,
werespectively.
performed the However,
combined the
combination
treatment of MELof and
bothPT-PBS,
showedtoa investigate
significant the
(p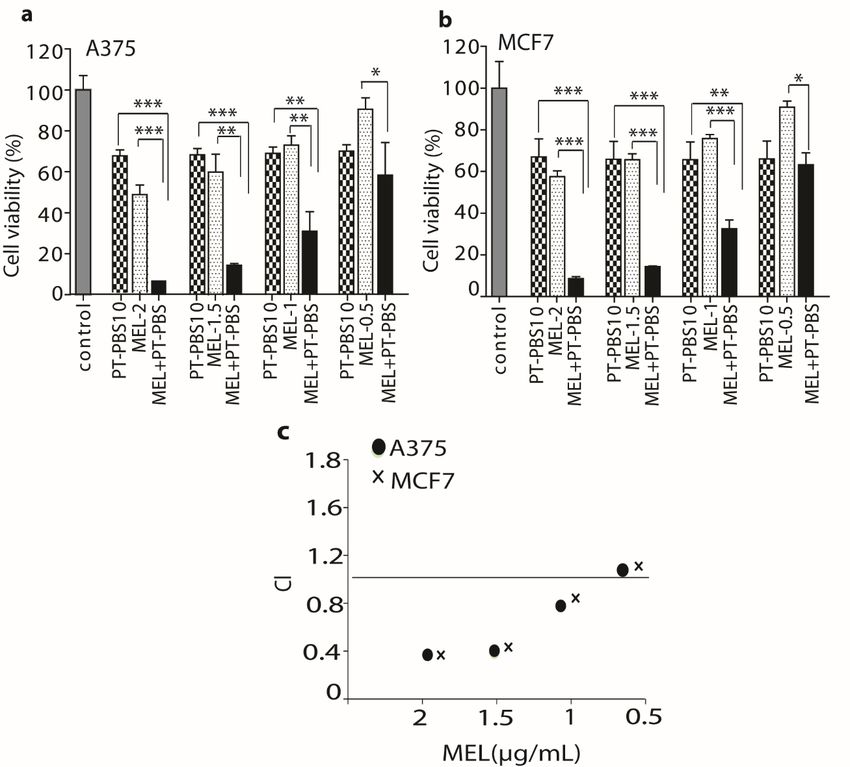
Cancers 2019, 11, 1109                                                                                                     9 of 19

    Cancers 2019, 11, x                                                                                                      9 of 19

slight synergism and CI = 0.9–1.1 nearly additive, while CI = 1.1–1.45 refers to slight to moderate
    antagonism [54,55]. As illustrated in Figure 4c, the CI analysis on A375 cells shows a synergistic
antagonism [54,55]. As illustrated in Figure 4c, the CI analysis on A375 cells shows a synergistic
    cytotoxic activity for the combination of PT-PBS 10 with the following concentrations of MEL-2 (CI =
cytotoxic activity for the combination of PT-PBS 10 with the following concentrations of MEL-2
    0.384), MEL-1.5 (CI = 0.412), MEL-1 (CI = 0.812), and MEL-0.5 (CI = 1.012). For the MCF7 cells, the CI
(CI = 0.384), MEL-1.5 (CI = 0.412), MEL-1 (CI = 0.812), and MEL-0.5 (CI = 1.012). For the MCF7 cells,
    values are very similar, i.e., MEL-2 (CI = 0.372), MEL-1.5 (CI = 0.426), MEL-1 (CI = 0.846), and MEL-
the CI values are very similar, i.e., MEL-2 (CI = 0.372), MEL-1.5 (CI = 0.426), MEL-1 (CI = 0.846), and
    0.5 (CI = 1.02). The combination of PT-PBS 10 with MEL-2 or MEL-1.5 clearly yields synergism,
MEL-0.5 (CI = 1.02). The combination of PT-PBS 10 with MEL-2 or MEL-1.5 clearly yields synergism,
    indicating that this combination can reduce the toxicity dose of MEL, and thus avoid the side effects
indicating that this combination can reduce the toxicity dose of MEL, and thus avoid the side effects
    related to higher doses of MEL. However, literature shows that MEL concentrations of up to 2 µg/mL
related to higher doses of MEL. However, literature shows that MEL concentrations of up to 2 µg/mL
    do not significantly inhibit cell viability in melanoma and lung cancer [22,27,56]. Thus, we performed
do not
    oursignificantly  inhibit cell
        further experiments    withviability in melanoma
                                     a low dose,             and in
                                                   i.e., MEL-1.5, lung cancer [22,27,56].
                                                                    combination           Thus,10,
                                                                                 with PT-PBS    we asperformed
                                                                                                      the optimal
our combination
    further experiments    with
                  for both cells.a low   dose, i.e., MEL-1.5,  in combination  with PT-PBS  10, as  the optimal
combination for both cells.

      Figure 4. Analysis of cell viability of (a) A375 and (b) MCF7 cells treated with a fixed dose of PT-PBS
          Figure
      (10%), and 4.  Analysis
                  varying     of cell
                            doses of viability
                                      MEL (i.e.,of2,
                                                   (a)1.5,
                                                        A375   and0.5
                                                           1 and    (b)µg/mL)
                                                                       MCF7 cells
                                                                               alonetreated
                                                                                       and in with   a fixed dose24ofhPT-PBS
                                                                                                 combination,          after
          (10%), (c)
      treatment. andCombination
                       varying doses  of MEL
                                   index (CI) of(i.e., 2, 1.5,
                                                   PT-PBS      1 and
                                                            (10%)     0.5 MEL
                                                                    with  µg/mL)  alone
                                                                              (at 2, 1.5, 1and
                                                                                            andin0.5combination,   24 hand
                                                                                                      µg/mL), in A375    after
      MCF7 cells (see text). All values are expressed as mean ± SD; * = p ≤ 0.05; ** = p ≤ 0.01; *** = p ≤ 0.001.
          treatment.  (c) Combination  index   (CI)  of PT-PBS    (10%)  with MEL    (at 2, 1.5, 1 and   0.5 µg/mL),  in A375
          and MCF7 cells (see text). All values are expressed as mean ± SD; * = p ≤ 0.05; ** = p ≤ 0.01; *** = p ≤ 0.001.
3.2. Influence of PT-PBS and MEL on Cell Death
    3.2.
     To Influence   of PT-PBS andthe
          further demonstrate        MEL  on Cell Death
                                        synergism,   and for clearer observation of cancer cell death after
treatment  Towith  PT-PBS
               further       and MELthe
                        demonstrate     alone and in combination,
                                           synergism,    and for clearer we observation
                                                                             performed flow    cytometry
                                                                                          of cancer       analysis.
                                                                                                    cell death  after
We also   analysed   the  degree   of apoptosis/necrosis    after  treatment  of both cell types.
    treatment with PT-PBS and MEL alone and in combination, we performed flow cytometry analysis. FITC  Annexin   V
andWePI negative   cells are  considered  as viable; if the  cells  are FITC  Annexin  V  positive and PI
         also analysed the degree of apoptosis/necrosis after treatment of both cell types. FITC Annexin Vnegative
thatand
     cellsPIare considered
             negative         as early
                        cells are      apoptotic;
                                  considered      however,
                                             as viable;  if theifcells
                                                                  cellsare
                                                                        areFITC
                                                                            bothAnnexin
                                                                                 FITC Annexin    V and
                                                                                         V positive andPIPIpositive
                                                                                                            negative
    that cells are considered as early apoptotic; however, if cells are both FITC Annexin V and PI positive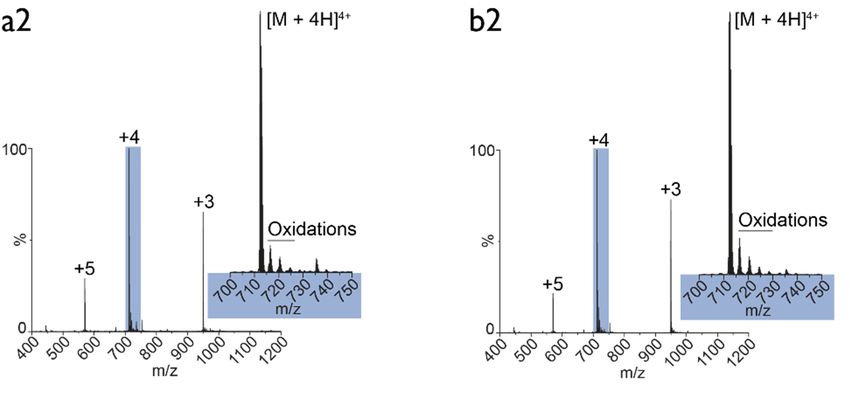
Cancers 2019, 11, 1109 10 of 19
Cancers 2019, 11, x 10 of 19
that
that cells
cells are
are considered
considered as as late
late apoptotic
apoptotic or or already
already dead
dead (by(by necrosis).
necrosis).Hence,
Hence,this
thisassay
assaydoes
doesnot
not
differentiate between apoptotic and necrotic cell death as both populations are positive
differentiate between apoptotic and necrotic cell death as both populations are positive for both FITC for both FITC
Annexin
AnnexinVVand andPI.PI.
Therefore, in the
Therefore, in current experiments,
the current Annexin
experiments, V and V
Annexin PI and
positive staining staining
PI positive represent
late apoptotic combined with necrotic cell death [57].
represent late apoptotic combined with necrotic cell death [57].
As
As shown in in Figure
Figure5a,c
5a,cfor
forA375
A375 cells,
cells, PT-PBS
PT-PBS 10 and
10 and MEL-1.5
MEL-1.5 alone
alone induced
induced 38%35%
38% and andlate
35%
late apoptosis/necrosis
apoptosis/necrosis (Annexin
(Annexin V positive,
V positive, PI PI positive),
positive), respectively,
respectively, whilethe
while thecombined
combinedexposure
exposure
induced late apoptosis/necrosis (p ≤
induced 96% late apoptosis/necrosis (p ≤ 0.01). In a similar way, PT-PBS 10 and MEL-1.5induced
96% 0.01). In a similar way, PT-PBS 10 and MEL-1.5 alone alone
37% and 37%
induced 30% andlate 30%
apoptosis/necrosis in MCF7incells,
late apoptosis/necrosis MCF7 respectively, while their
cells, respectively, combination
while induced
their combination
92% late apoptosis/necrosis
induced (p ≤ 0.01,(p
92% late apoptosis/necrosis Figure
≤ 0.01,5b,d).
Figure These
5b,d).results
Theseindicate that the that
results indicate combined action of
the combined
PT-PBS
action of 10PT-PBS
and MEL-1.5
10 andonMEL-1.5
both cancer cell lines
on both cancer is cell
more thanisthe
lines sum
more of their
than individual
the sum of theireffects, which
individual
iseffects,
in agreement
which iswith the CI values
in agreement shown
with the aboveshown
CI values (Figure 4c). Altogether,
above these findings
(Figure 4c). Altogether, support
these findingsthe
support thecytotoxic
synergistic synergistic cytotoxic
action action
of PT-PBS 10ofand
PT-PBS
MEL-1.510 and MEL-1.5
in cancer in cancer cells.
cells.
Figure 5.5. Flow
Figure Flowcytometry
cytometryanalysis
analysisofofthe
the(a)(a)A375
A375 and
and (b)(b) MCF7
MCF7 untreated
untreated control
control cells,
cells, or treated
or treated with
with PT-PBS
PT-PBS 10, MEL-1.5,
10, MEL-1.5, and combined
and combined treatment
treatment (PT-PBS
(PT-PBS 10 and
10 and MEL-1.5).
MEL-1.5). Percentage
Percentage ofofcell
celldeath
deathin
in A375
(c) (c) A375
andand(d) (d)
MCF7MCF7
uponupon treatment
treatment withwith PT-PBS
PT-PBS 10, 10, MEL-1.5
MEL-1.5 andand in combination.
in combination. AllAll values
values are
are expressed
expressed as mean
as mean ± SD; ** =**p=≤p0.01.
± SD; ≤ 0.01.
3.3.
3.3. Effect
Effect of
of PT-PBS
PT-PBS and and MEL
MEL on on Lipid Peroxidation
Lipid Peroxidation
Lipid
Lipid peroxidation
peroxidation generally refers to
generally refers to the
the oxidative
oxidative degradation
degradationofofcellular
cellularlipids
lipidsby byreactive
reactive
oxygen
oxygen species.
species. Peroxidation
Peroxidation of of unsaturated
unsaturatedlipidslipidsaffects
affectscell
cellmembrane
membraneproperties
properties[58] [58]and
andsignal
signal
transduction pathways [59]. Thus, to evaluate the change in membrane integrity
transduction pathways [59]. Thus, to evaluate the change in membrane integrity upon treatment with upon treatment with
PT-PBS
PT-PBSand andMEL,MEL, we we estimated
estimated the
the lipid
lipid peroxidation
peroxidation with with thethe MDA
MDA assay
assay and
andfluorescent
fluorescentprobe.probe.
As
As shown in Figure 6a, the A375 cells incubated with PT-PBS 10 and MEL-1.5 alone yielded ca.ca.
shown in Figure 6a, the A375 cells incubated with PT-PBS 10 and MEL-1.5 alone yielded
5.2
5.2 µM and
µM and 44 µM peroxidation product
µM peroxidation product (malondialdehyde;
(malondialdehyde;MDA), MDA),respectively,
respectively,while
whileinincombination
combination
they
they exhibited
exhibited aa significant
significantformation
formationofofMDAMDA (ca.
(ca. 15 15
µM, µM,p ≤ p0.01).
≤ 0.01). Likewise,
Likewise, forMCF7
for the the MCF7 cells,
cells, PT-
PT-PBS 10 and MEL-1.5 alone produced ca. 4.5 µM and ca. 4 µM MDA
PBS 10 and MEL-1.5 alone produced ca. 4.5 µM and ca. 4 µM MDA respectively, while their combined respectively, while their
combined exposure shows a significantly higher MDA production (ca. 10.5
exposure shows a significantly higher MDA production (ca. 10.5 µM, p ≤ 0.05). In addition, lipid µM, p ≤ 0.05). In addition,
lipid peroxidation
peroxidation following
following PT-PBS PT-PBS 10, MEL-1.5
10, MEL-1.5 and combined
and combined exposure exposure was quantified
was quantified in both
in both cancer
cancer cells, using the ratio of green and red fluorescence intensities, as shown
cells, using the ratio of green and red fluorescence intensities, as shown in Figure 6b. The ratios in Figure 6b. The ratios
increased
increased significantly
significantly in in both
both cancer cells when we applied applied the the combined
combinedtreatment
treatment(p (p≤≤0.05).
0.05).
Figure
Figure6c,d6c,d show
show the fluorescence images of of the
theA375
A375and andMCF7
MCF7cellscellsstained
stainedwith
withlipid
lipidperoxide
peroxide
detection reagents, after addition of PT-PBS 10, MEL-1.5 alone and in
detection reagents, after addition of PT-PBS 10, MEL-1.5 alone and in combination. Comparedcombination. Compared with
withthe
separate treatments,
the separate the combined
treatments, the combinedexposure shows
exposure mostmost
shows of theofsignal is in the
the signal is ingreen channel,
the green which
channel,
which indicates
indicates lipid peroxidation.
lipid peroxidation. We also We also detected
detected lipid peroxidation
lipid peroxidation productsthearound
products around membrane, the
membrane,a indicating
indicating change in athe change in the
physical physical properties
properties of the cellularof themembranes.
cellular membranes.
This canThis cause can cause
covalent
covalent modification
modification of proteins ofand
proteins andacids,
nucleic nucleic acids,
which which
might might eventually
eventually be criticalbemediators
critical mediators
of oxidativeof
oxidative stress-mediated cell death [59]. Thus, the combined treatment with PT-PBS 10 and MEL-1.5Cancers 2019, 11, 1109 11 of 19
Cancers 2019, 11, x 11 of 19
stress-mediated cell death [59]. Thus, the combined treatment with PT-PBS 10 and MEL-1.5 induces
induces
lipid lipid peroxidation
peroxidation in both
in both cancer cellcancer
lines, cell
whichlines, which correlates
correlates with the cytotoxic
with the cytotoxic effect
effect of the of the
combined
combined treatment observed
treatment observed above. above.
Figure6.6.Change
Figure Changein inmembrane
membrane integrity
integrity upon PT-PBS 10, MEL-1.5
MEL-1.5 andand combined
combinedtreatment
treatmentininboth
both
cancercellcell
cancer lines,
lines, by (a)by (a) measurement
measurement of the concentration
of the concentration of theproduct
of the peroxidation peroxidation product
malondialdehyde
malondialdehyde
(MDA), and (b) flow (MDA), and (b)
cytometry flow cytometry
analysis analysis with
with a fluorescent probe.a fluorescent probe.
All values are All values
expressed as ±are
SD;
* = p ≤ 0.05; ** = p ≤ 0.01. Fluorescence images of (c) A375 and (d) MCF7 cells, stained with lipid/lipid
expressed as ± SD; * = p ≤ 0.05; ** = p ≤ 0.01. Fluorescence images of (c) A375 and (d) MCF7 cells, stained
with lipid/lipid
peroxide detection peroxide
reagents. detection reagents. represents
Red fluorescence Red fluorescence represents
non-oxidized non-oxidized
membrane membrane
lipids, DAPI (blue)
lipids, DAPI
represents the(blue)
nuclearrepresents the nuclear
counterstain counterstain
and green and
represents thegreen represents
oxidized the oxidized
membrane bars =
membrane
lipids. Scale
50lipids.
µm. Scale bars = 50 µm.
3.4.
3.4.Effect
EffectofofPT-PBS
PT-PBSand
andMEL
MELon
on Malignant
Malignant Melanoma
Melanoma Cancer
Cancer Tumors
Tumors of
of the
the TUM-CAM Model
TUM-CAM Model
Malignant
Malignantsolid
solid tumours
tumours were
were analysed
analysed macroscopically
macroscopically by by using
using HEHE and
and Ki-67
Ki-67 staining.
staining.The
The
stained
stainedtumour
tumourtissue
tissuesections
sectionsdisplayed
displayedchanges
changes inin
morphology
morphology upon
upon allall
treatments. Interestingly,
treatments. Interestingly,the
combined treatment
the combined induced
treatment moremore
induced cellular shrinking
cellular and and
shrinking presence of pyknotic
presence of pyknoticdarkdark
small nuclei
small as a
nuclei
result of chromatin
as a result condensation,
of chromatin compared
condensation, to the PT-PBS
compared to the 10 and MEL-1.5
PT-PBS 10 and treatments alone (Figure
MEL-1.5 treatments alone7a).
In(Figure
contrast,
7a).untreated (control)
In contrast, cells(control)
untreated presented a more
cells prominent
presented a moremalignant
prominentphenotype
malignantwith mitotic
phenotype
with mitotic
activity activity Figure
(HE staining, (HE staining,
7a). To Figure
assess the7a).proliferative
To assess thestateproliferative
of cells instate of cellstumours,
the treated in the treated
tissue
tumours, tissue sections were stained for the proliferation marker Ki-67. The
sections were stained for the proliferation marker Ki-67. The untreated tumours presented the highest untreated tumours
presented
levels thepositive
of Ki-67 highestcells.
levels
Weofobserved
Ki-67 positive cells. We
that tumours observed
exposed to thethat tumours
combined exposed
treatment to the
presented
combined
the treatment
lowest number ofpresented the lowest
Ki-67 positive cells, number
followedofby Ki-67 positive
tumours cells, with
treated followed by tumours
PT-PBS treated
10 and MEL-1.5
with (Figure
alone PT-PBS7b).10 and MEL-1.5
These resultsalone
suggest(Figure 7b).combined
that the These results suggest
treatment ofthat the combined
MEL+PT-PBS has treatment
a detrimentalof
MEL+PT-PBS has a detrimental effect on cell proliferation, as it reduced the number of Ki-67 positive
cells more efficiently than the sum of the individual treatments.Cancers 2019, 11, 1109 12 of 19
effect on cell proliferation, as it reduced the number of Ki-67 positive cells more efficiently than
Cancers 2019, 11, x
the
12 of 19
sum of the individual treatments.
InIn agreement
agreement with with the
the histological
histological analysis of tumour
tumour specimens,
specimens, the
the tumour
tumour weight
weightalsoalso
demonstrated
demonstrated aa reduction
reduction of of tumour
tumour size
size upon
upon treatment
treatment (Figure 7c,d). The
The combined
combinedtreatment
treatment
significantly
significantlyreduced
reduced the the tumour
tumour weight by approx. 76%,76%, whereas
whereasthe
thetumours
tumourstreated
treatedwith
withPT-PBS
PT-PBS
10
10and
andMEL-1.5
MEL-1.5 showed
showed aa reduction
reduction inin weight
weight of approx. 30%
30%and
and35%,
35%,respectively
respectively(Figure
(Figure7c).7c).
Hence,
Hence, these
these results
results indicate
indicate that the combined treatment
treatment induced
induced aa synergistic
synergisticreduction
reductionofofcell
cell
proliferation,
proliferation,as asits
itseffect
effectonon tumour
tumour weight
weight (76% reduction) waswas approximately
approximately11% 11%higher
higherthan
thanthe the
sumof
sum ofboth
bothtreatments
treatments (reductions
(reductions of 30% +
of 30% + 35%).
35%). These
Thesefindings
findingsare
arein
inagreement
agreementwithwiththe
theininvitro
vitro
resultsshown
results shownabove.above.
Figure7.7. The
Figure The combined treatment reduced the the tumour
tumour size
sizeand
andexpression
expressionof ofthe
theproliferative
proliferativemarker
marker
Ki-67in
Ki-67 inmelanoma
melanoma cancer
cancer tumours
tumours in ovo. (a) (a) Representative
Representative images
imagesof ofHE
HEandand(b)
(b)Ki-67
Ki-67staining
stainingofof
tumoursexposed
tumours exposedtoto PT-PBS
PT-PBS 10,10, MEL-1.5
MEL-1.5 or combined
or combined treatment.
treatment. ScaleScale bars represent
bars represent 50 µm.50(c)µm. (c)
Weight
Weight reduction
reduction upon treatments
upon treatments in tumoursin tumours
in ovo. Eachin dotovo. Each dot
represents one represents
tumour. (d)one tumour. (d)of
Quantification
Quantification
tumour weight inof percentage
tumour weight in percentage
(treated/control (treated/control
* 100%) * 100%)
after treatment after10,
(PT-PBS treatment
MEL-1.5 (PT-PBS 10,
or combined
MEL-1.5 or Vertical
treatment). combined treatment).
arrows Vertical
indicate arrows
reduction inindicate
tumourreduction in tumour
weight. All weight.
values are All values
expressed as ±are
SD;
= p ≤ 0.01.
**expressed as ± SD; ** = p ≤ 0.01.
3.5.
3.5.Plasma
Plasma Oxidation
Oxidation of
of MEL:
MEL: Mass
Mass Spectrometry Analysis
Spectrometry Analysis
To
Tobetter
betterunderstand
understandthethe
synergistic effect
synergistic of PT-PBS
effect and and
of PT-PBS MEL,MEL,we investigated the effect
we investigated the of plasma
effect of
treatment on the oxidation level of MEL. For this purpose, we dissolved MEL
plasma treatment on the oxidation level of MEL. For this purpose, we dissolved MEL either in either in untreated
(control)
untreatedor(control)
in PT-PBSor buffer and buffer
in PT-PBS we incubated
and we the solution
incubated thefor 1, 60, orfor
solution 120
1, min.
60, orFigure
120 min.8 shows
Figurethe
8
native MS measurements of the control (a) and the plasma-treated (b) samples.
shows the native MS measurements of the control (a) and the plasma-treated (b) samples.Cancers 2019, 11, 1109 13 of 19
Cancers 2019, 11, x 13 of 19
Figure 8. Native mass spectrometry (MS) of MEL. The figure shows an overview of native MS spectra
Figure 8. Native mass spectrometry (MS) of MEL. The Figure shows an overview of native MS spectra
of MEL solubilized either in (a) untreated or (b) plasma-treated PBS buffer after different time points of
of MEL solubilized either in (a) untreated or (b) plasma-treated PBS buffer after different time points
incubation (0: 1 min; 1: 60 min; 2: 120 min). The inset in each spectrum displays the m/z region from
of incubation (0: 1 min; 1: 60 min; 2: 120 min). The inset in each spectrum displays the m/z region from
700 to 750 (zoom-in of the [M + 4H]4+ species). The satellite peaks highlighted in the insets correspond
700 to 750 (zoom-in of the [M + 4H]4+ species). The satellite peaks highlighted in the insets correspond
to oxidations of MEL.
to oxidations of MEL.
The indices refer to the different time points of incubation (0: 1 min, 1: 60 min, 2: 120 min).
The indices
As illustrated, the refer to the different
comparison betweentime points
control andofplasma
incubation (0: 1 min,
treatment 1: 60no
reveals min, 2: 120 min).
differences As
in the
illustrated, the comparison between control and plasma treatment reveals no differences in the
oxidation level of MEL. The observed oxidations (700–750 m/z) may originate from the electrospray
oxidation level of MEL. The observed oxidations (700–750 m/z) may originate from the electrospray
ionization [60], as indeed reported for MEL [61], but at much harsher operating conditions than applied in
ionization [60], as indeed reported for MEL [61], but at much harsher operating conditions than
this experiment. Moreover, the measurements do not show an increase in the number of oxidations over
applied in this experiment. Moreover, the measurements do not show an increase in the number of
time. Thus, no differences were observed in the spectra acquired after one minute and after two hours.
oxidations over time. Thus, no differences were observed in the spectra acquired after one minute
Independent of whether the oxidations are already present in solution or are induced by the electrospray
and after two hours. Independent of whether the oxidations are already present in solution or are
ion source, in any case the plasma treatment applied in the form of solubilizing MEL in plasma-treated
induced by the electrospray ion source, in any case the plasma treatment applied in the form of
PBS buffer does not have any influence on these observed oxidations. Hence, we can conclude that MEL
solubilizing MEL in plasma-treated PBS buffer does not have any influence on these observed
oxidations. Hence, we can conclude that MEL is not oxidized by plasma, and that the synergisticCancers 2019, 11, 1109 14 of 19
is not oxidized by plasma, and that the synergistic effects of MEL and PT-PBS must be attributed to
other effects. One possibility is the enhanced translocation of MEL through the cell membrane upon
plasma-induced oxidation of the phospholipids. This will be discussed in the next section.
3.6. MEL Translocation across Native and Oxidized Phospholipid Membrane Revealed through
MD Simulations
To gain further insight into the experimentally observed synergetic effect between MEL and the
RONS present in PT-PBS and to investigate the mechanisms of MEL access to cancer cells through
oxidized membranes, we performed US MD simulations. This method allows us to elucidate the MEL
translocation across the native and oxidized PLBs, based on the FEPs plotted in Figure 9.
Based on the polarity of the lipids, the hydrophilic part refers to the upper and lower lipid head
groups (light blue colour in Figure 9a), while the hydrophobic part refers to the lipid tails of the PLB (grey
colour in Figure 9b–e). In the native case, when MEL enters from the water phase to the hydrophilic
head group of the upper leaflet (see Figure 9b,c), it shows a high affinity with the (charged) head groups
of the PLB, due to strong Coulomb interaction [62]. As a result, the potential of mean force for insertion
of MEL shows a drop in the free energy barrier, making insertion of MEL favourable (see first minimum
near z = 1.5–2 nm in Figure 9a, indicated with the arrow). Subsequently, the N-terminal of MEL moves
through the hydrophobic tail region (see Figure 9d,e) and experiences a permeation barrier at the centre
of the bilayer. It is due to the fact that the residues of MEL near the C-terminal (i.e., LYS21 , ARG22 , LYS23
and ARG24 ) with a net charge of +4 prefer to stay at the upper head group-water interface, whereas the
N-terminal residue LYS7 with a net charge of +1 prefers to move into the inner head group-tail interface,
which eventually leads to an increase of the free energy barrier at the centre of the PLB [62]. When (the
N-terminal of) MEL traverses further towards the lower leaflet, the free energy drops again, because
most of the hydrophobic residues of MEL stay in the hydrophobic region of the PLB. Finally, at the
lower head group region of the PLB, the energy rises again, because the charged residue LYS7 near the
N-terminal of MEL binds with the head group of the lower leaflet, resulting in a new barrier against
translocation [40]. Moreover, as MEL penetrates through the bilayer, its conformation changes, but most
of its helical structure is retained at the surface of the PLB (see Figure 9b–d).
It is important to notice that the first free energy maximum for the native case (see Figure 9a) is
29.28 ± 1.04 kJ/mol, obtained at the centre of the bilayer (i.e., z = 0 nm) and the second maximum is
24.9 ± 2.3 kJ/mol, obtained at around z = −2 nm, which indicates that MEL has to face multiple barriers
across the bilayer, making the translocation more difficult. In addition, we observed an asymmetric
free energy profile, that is most likely due to the disturbance and conformational changes in the PLB,
which was observed in other simulation studies as well [62].
On the other hand, in the oxidized PLB, the energy reaches a minimum in the centre of the bilayer,
because when the lipid tails are oxidized, they become less apolar and hence the hydrophilicity of the
membrane core increases dramatically, so that MEL can penetrate more easily. In addition, on top of
the general minimum in free energy, there are multiple free energy local maxima and minima, due to
interactions of the amino acid side chains of MEL with the lipid tails.
Previous reports suggest that cancer cells are more susceptible than normal cells to oxidative
damage and cell death induced by CAP treatments [26,63–66]. In silico studies of CAP-induced
oxidation of phospholipids in cell membranes demonstrated that cell membranes with higher fractions
of cholesterol (i.e., normal cells) were protected from pore formation. In contrast, when lower
concentrations of cholesterol were present (i.e., cancer cells), the cell membrane was more vulnerable
to oxidative stress and it favoured pore formation [48]. The pores generated in the cell membrane
facilitated the pass of plasma-generated ROS into the intracellular compartment [67,68], where they
could exert further oxidative damage to cells. Our simulation results are in agreement with the
literature, as we demonstrate here that RONS present in PT-PBS (e.g., H2 O2 , NO3 − and NO2 −
ions [24,30] oxidize the cell membrane (as can be deduced from the lipid peroxidation experiments, see
Figure 6). In addition, from Figure 9a we conclude that the free energy barrier for the transport ofYou can also read