Myalgic encephalomyelitis/chronic fatigue syndrome patients exhibit altered T cell metabolism and cytokine associations
←
→
Page content transcription
If your browser does not render page correctly, please read the page content below
The Journal of Clinical Investigation                                                                                                                               RESEARCH ARTICLE

Myalgic encephalomyelitis/chronic fatigue syndrome
patients exhibit altered T cell metabolism and cytokine
associations
Alexandra H. Mandarano,1 Jessica Maya,1 Ludovic Giloteaux,1 Daniel L. Peterson,2 Marco Maynard,3 C. Gunnar Gottschalk,3
and Maureen R. Hanson1
Department of Molecular Biology and Genetics, Cornell University, Ithaca, New York, USA. 2Sierra Internal Medicine at Incline Village and 3Simmaron Research Institute, Incline Village, Nevada, USA.
1

            Myalgic encephalomyelitis/chronic fatigue syndrome (ME/CFS) is a complex disease with no known cause or mechanism.
            There is an increasing appreciation for the role of immune and metabolic dysfunction in the disease. ME/CFS has historically
            presented in outbreaks, often has a flu-like onset, and results in inflammatory symptoms. Patients suffer from severe fatigue
            and postexertional malaise. There is little known about the metabolism of specific immune cells in patients with ME/CFS. To
            investigate immune metabolism in ME/CFS, we isolated CD4+ and CD8+ T cells from 53 patients with ME/CFS and 45 healthy
            controls. We analyzed glycolysis and mitochondrial respiration in resting and activated T cells, along with markers related
            to cellular metabolism and plasma cytokines. We found that ME/CFS CD8+ T cells had reduced mitochondrial membrane
            potential compared with those from healthy controls. Both CD4+ and CD8+ T cells from patients with ME/CFS had reduced
            glycolysis at rest, whereas CD8+ T cells also had reduced glycolysis following activation. Patients with ME/CFS had significant
            correlations between measures of T cell metabolism and plasma cytokine abundance that differed from correlations seen in
            healthy control subjects. Our data indicate that patients have impaired T cell metabolism consistent with ongoing immune
            alterations in ME/CFS that may illuminate the mechanism behind this disease.

Introduction                                                                                              bles a flu-like illness (4). Some patients have diagnosed infections at
Myalgic encephalomyelitis/chronic fatigue syndrome (ME/CFS)                                               the onset of the disease (2). Because of the outbreaks, onset of the
is a poorly understood and debilitating disease. An estimated                                             illness, and symptoms, the potential identification of a pathogen in
836,000 to 2.5 million Americans have ME/CFS (1). Patients suf-                                           ME/CFS is a research priority. Despite this, no viral, bacterial, or
fer from severe fatigue, unrefreshing sleep, cognitive impairment,                                        eukaryotic pathogen has yet been identified as a cause of ME/CFS.
postexertional malaise, pain, gastrointestinal symptoms, and                                                   Characterization of the immune system in patients is an
orthostatic intolerance. In addition, many patients with ME/CFS                                           alternative method for exploring possible immune or infectious
experience flu-like symptoms, such as tender or swollen lymph                                             components in ME/CFS. There is substantial evidence that the
nodes, fever, muscular pain, headache, and sore throat. Diagnosis                                         immune system plays a role and is dysregulated in ME/CFS. Many
is established through the application of 1 or more sets of criteria,                                     studies have investigated the abundance of cytokines or immune
as summarized in a 2015 report from the Institute of Medicine                                             cell subpopulations in patients with ME/CFS, often with conflict-
(1). The disease is variable in severity, with approximately one-                                         ing results. However, there have been changes identified in cyto-
quarter of patients being house- or bed-bound at some point in the                                        kines over the duration of the illness or among patients with dif-
course of their illness (1). The vast majority of patients with ME/                                       fering disease severities (1, 5–7). Cytokines reported to be altered
CFS do not recover, and there are no known causes or approved                                             in abundance include TNF-α, TGF-β, IFN-γ, IL-1α, IL-1β, IL-6, and
treatments for this disease (2).                                                                          IL-4 (1, 5–10). Some studies have also reported differences in the
     Historically, there have been clustered outbreaks of ME/CFS                                          frequency of CD4+ versus CD8+ T cells, Tregs, and/or memory T
worldwide, including major outbreaks in the 1980s in the United                                           cells in patients with ME/CFS (10–16).
States in Incline Village, Nevada, and Lyndonville, New York (3). The                                          Interestingly, NK cells from subjects with ME/CFS have con-
onset of ME/CFS can either be sudden or gradual but often resem-                                          sistently been reported to exhibit reduced cytotoxicity compared
                                                                                                          with NK cells from healthy controls (1). There have similarly been
                                                                                                          reports of decreased CD8+ T cell cytotoxicity in ME/CFS patients,
      Related Commentary: p. 1102                                                                         as well as decreased granzyme A and perforin in patient CD8+
                                                                                                          T cells (16, 17). Others have reported increased dexamethasone
Conflict of interest: The authors have declared that no conflict of interest exists.
                                                                                                          sensitivity and decreased proliferation of CD4+ T cells, but no
Copyright: © 2020, American Society for Clinical Investigation.
Submitted: July 30, 2019; Accepted: November 26, 2019; Published: February 10, 2020.
                                                                                                          difference in cell death of either CD4+ or CD8+ T cells (10, 18).
Reference information: J Clin Invest. 2020;130(3):1491–1505.                                              Overall, our understanding of functional impairment in ME/CFS
https://doi.org/10.1172/JCI132185.                                                                        T cells remains limited.

                                                                                                         jci.org   Volume 130   Number 3   March 2020                                            1491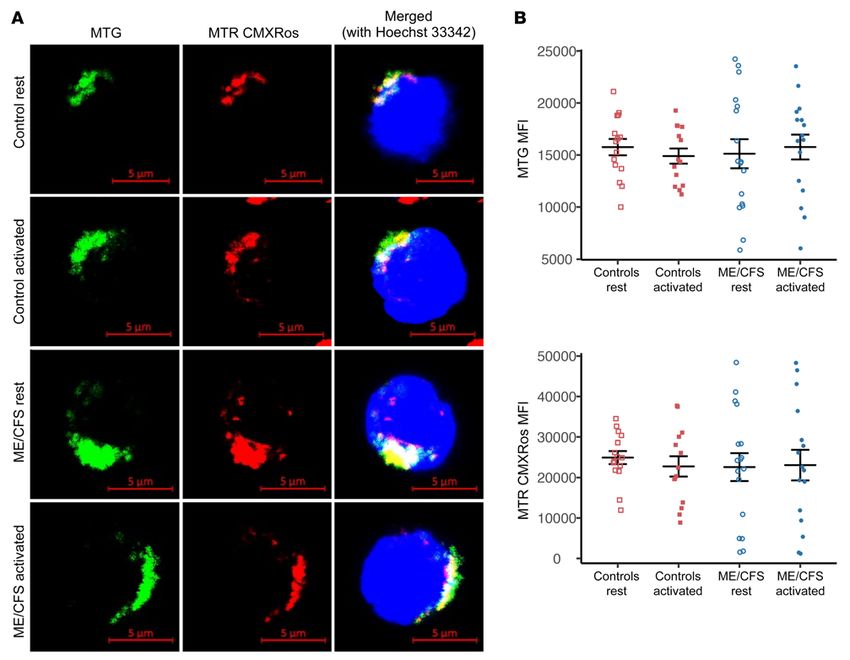
RESEARCH ARTICLE                                                                                    The Journal of Clinical Investigation

     Given the symptoms of fatigue and postexertional malaise,            extensive survey information on each subject. We then assayed
there has also been substantial research into metabolism in               both mitochondrial metabolism and glycolysis in resting and stim-
patients with ME/CFS. Studies have shown some evidence of oxi-            ulated T cells. We also characterized mitochondria and GLUT1
dative stress and decreased coenzyme Q10 in ME/CFS (19–22).               abundance on these cells. Finally, we determined the abundance
The findings are conflicting with regard to ME/CFS cellular mito-         of cytokines in plasma from the same subjects and analyzed our
chondrial content, but multiple studies have found no difference          data for correlations.
in specific mitochondrial complex activities (19, 23–25). Our labo-
ratory previously reported no association between mitochondrial           Results
SNPs and ME/CFS, although some SNPs correlated with specific              Subjects in the study population. Study subjects were recruited by
symptoms in patients (26). Others have also found no clinically           Daniel Peterson at Simmaron Research in Incline Village, Neva-
relevant mitochondrial SNPs in patients with ME/CFS (27, 28).             da, and fulfilled the Canadian Consensus Criteria. A total of 53
     More recently, multiple metabolomics analyses have been              patients with ME/CFS and 45 healthy controls were included
conducted in plasma, serum, and urine from patients with ME/              in the study. The composition of the patient and control groups
CFS and from healthy controls (29–34). These analyses have                was similar with regard to sex and age (Table 1). With regard to
shown numerous differentially abundant metabolites in patients            race, an overwhelming number of the participants were White.
with ME/CFS that belong to pathways such as fatty acid metab-             Only 1 patient and 1 control subject identified themselves as His-
olism, the citric acid (TCA) cycle, and glucose and amino acid            panic or Latino. Patients had an average illness duration of 21.7
metabolism (29–34). Alterations in plasma metabolites likely              years, and most patients reported being ill for more than 10 years
mean that cellular metabolism is also altered in ME/CFS.                  (Table 1). In addition, patients reported an average of 6.7 years
     Metabolism is critical to the function of all cells but is partic-   between their first symptoms and ME/CFS diagnosis (Table 1).
ularly imperative for the proper function of the immune system.           Of the 53 patients with ME/CFS, 24 reported a gradual onset and
Immunometabolism, or the study of how immune cell metabolism              26 reported a sudden onset of the disease; the onset type was
underlies the function and response of the immune system, plays           unknown for the remaining 3 patients (Table 1). The patients with
a role in many human diseases. Specifically, quiescent T cells use        ME/CFS were also asked for the triggering event of their illness,
little anabolic metabolism (35). In response to an immune chal-           if known. The vast majority of patients stated that either a known
lenge, T cells increase their utilization of oxidative phosphoryla-       viral infection (n = 18) or viral-like illness (n = 23) preceded their
tion, glycolysis, and glutaminolysis, while decreasing fatty acid         illness (Table 1). We were unable to control for medications in
oxidation (35–37). These shifts in metabolism require changes in          this study, but all subjects were asked to provide a list of current
the surface expression of substrate transporters (37). Changes in T       medications and supplements.
cell metabolism are driven by specific signaling pathways and are              All subjects were asked to complete the specific symptom
highly regulated. Proper metabolic programs at rest and following         severity form, which involves rating common ME/CFS symptoms
an immune challenge are essential for optimal T cell effector func-       from 0 if not experienced to 10 if very severe. The patients report-
tion, proliferation, and viability (37, 38).                              ed statistically significantly higher scores for all of the specific
     Dysfunction in immunometabolism can contribute to the                symptom severity scale items (Table 1). In particular, the patients
establishment and/or maintenance of human disease. Increased T            scored high on impaired memory or concentration, fatigue, mus-
cell metabolism or ROS production can contribute to inflammation          cle tenderness or pain, and postexertional malaise (Table 1). Addi-
and/or autoimmunity (39–42). Conversely, hypometabolism, or a             tionally, the subjects completed the 36-item short-form survey
failure to increase metabolism following an immune challenge, can         (SF-36), which calculates a score for various dimensions of health,
help maintain a chronic infection or cancer progression (42–45).          with 100 indicating no disability in a dimension and 0 indicating
Specifically, chronic infection can lead to T cell exhaustion, in which   severe disability. Patients with ME/CFS had statistically signifi-
metabolism and, in turn, effector functions are impaired (46, 47).        cantly lower scores on all dimensions of the SF-36 survey, espe-
     Characterization of immunometabolism in ME/CFS may pro-              cially with regard to physical health and vitality (Table 1). Patients
vide insight into the mechanism of the disease, potential causes,         reported an average Bell scale score of 37.1 compared with 96.7 for
and targets for treatment. Mitochondrial dysfunction in neutro-           healthy controls (P < 0.001) (Table 1). The Bell scale ranges from
phils from individuals with ME/CFS has previously been reported           0 to 100, where 100 reflects a healthy individual and 0 reflects
(48, 49). A recent pilot study reported decreased glycolytic reserve      severe disability or impairment (52). Thus, ME/CFS patient survey
in ME/CFS NK cells (50). Tomas et al. found reduced measure-              scores reflected substantial impairment compared with scores for
ments of mitochondrial respiration in ME/CFS PBMCs at rest, but           healthy controls and confirmed that our study population had the
no difference in glycolysis (51). However, we still do not know how       expected characteristics of the disease.
the metabolism of other immune cells, such as T cells, is affect-              Both ME/CFS and healthy control subjects were asked a
ed in ME/CFS. Additionally, the capacity of specific ME/CFS               series of questions about gastrointestinal conditions and/or symp-
immune cells to reprogram their metabolism is unknown.                    toms, comorbidities, and family health history. Thirteen patients
     In order to investigate T cell metabolism and its potential          with ME/CFS had a previous cancer diagnosis compared with 4
role in ME/CFS, we sought to characterize metabolism in ME/               healthy controls (P = 0.08) (Supplemental Table 1; supplemental
CFS CD4+ and CD8+ T cells at rest and following activation. Both          material available online with this article; https://doi.org/10.1172/
CD4+ and CD8+ T cells were isolated from samples collected from           JCI132185DS1). Of 53 patients with ME/CFS, 35 (66%) report-
45 healthy controls and 53 patients with ME/CFS. We obtained              ed some kind of gastrointestinal symptom, whereas only 8 of 45

   1492              jci.org   Volume 130   Number 3   March 2020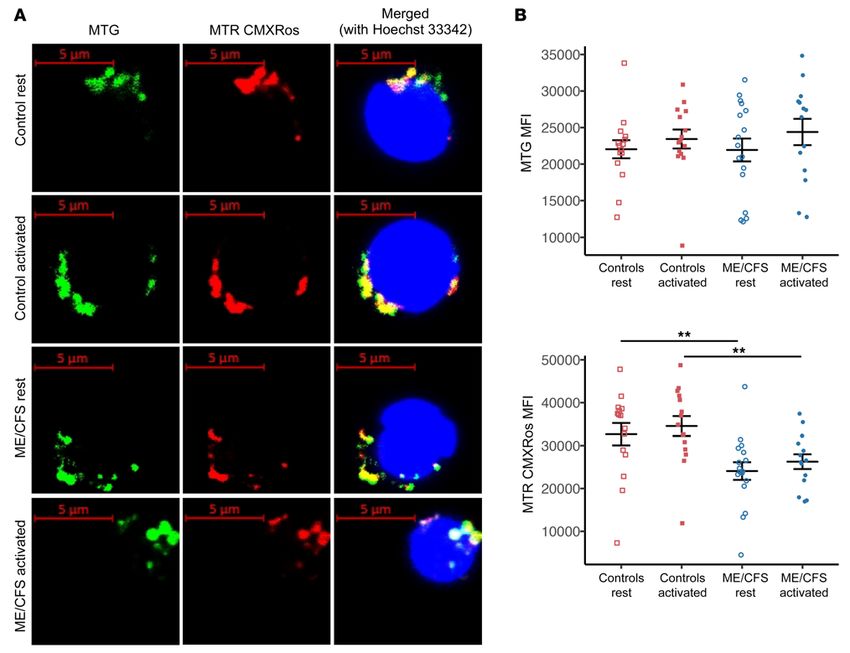
The Journal of Clinical Investigation RESEARCH ARTICLE
ry disease (P = 0.03) (Supplemental
Table 1. Study population characteristics and survey responses
Table 1). Among the patients with
ME/CFS Healthy controls P value ME/CFS, 73.6% indicated having
(n = 53) (n = 45) some kind of allergy compared with
Age 50.8 ± 16.2 50.2 ± 17.5 0.86 48.9% of healthy controls (P = 0.02)
Illness duration (yr) 21.7 ± 12 (n = 50) – – (Supplemental Table 1).
Time from symptoms to diagnosis (yr) 6.7 ± 7 (n = 44) – – CD4+ T cell mitochondrial metabo-
Bell scale score 37.1 ± 15.7 96.7 ± 6.4 < 0.001 lism is not altered in patients with ME/
Sex Male 22 19 1 CFS. Blood samples were collected
Female 31 26 from patients with ME/CFS and
Race American Indian and Alaska Native 0 0
healthy control subjects at Simmaron
Asian 0 2
Research (Incline Village, Nevada,
Black or African American 0 0
USA). Samples from both patients and
White 52 42
Two or more races 1 0
control subjects were collected over a
Ethnicity Hispanic or Latino 1 1 1 period of approximately 18 months.
Not Hispanic or Latino 45 39 – PBMCs were isolated immediately,
Unknown 7 5 – frozen, and later shipped overnight
Onset type Gradual 24 – – on dry ice to Cornell University. T
Sudden 26 – – cells were isolated from all samples
Unknown 3 – – using magnetic bead kits to separate
Triggering event Known infection 18 – – CD8+ T cells by positive selection and
Viral-like illness 23 – – CD4+ T cells by negative selection.
Other 3 – – To investigate whether mito-
Unknown 9 – – chondrial respiration is altered in
Specific symptom severity Fatigue 6.9 ± 1.9 1.4 ± 1.5 < 0.001 patient and healthy control T cells,
(0 = none, Impaired memory or concentration 6.2 ± 2.4 1.3 ± 1.7 < 0.001
10 = very severe) we used an Agilent Seahorse XFe96
Recurrent sore throat 2.9 ± 2.8 0.3 ± 1.1 < 0.001
extracellular flux analyzer with a
Tender lymph nodes 3.5 ± 3 0.6 ± 1.5 < 0.001
Mito Stress Test. The Mito Stress Test
Muscle tenderness or pain 5.7 ± 2.9 0.9 ± 1.6 < 0.001
Joint pain 4.8 ± 3.1 1.1 ± 1.8 < 0.001
gives measurements of basal respira-
Headache 4.3 ± 3.2 0.9 ± 1.1 < 0.001 tion, ATP production, maximal res-
Disturbed sleep or waking unrefreshed 7.2 ± 2.4 1.5 ± 1.7 < 0.001 piration, spare respiratory capacity,
Postexertional malaise 7.6 ± 2.5 1 ± 1.5 < 0.001 nonmitochondrial respiration, and
36-Item short-form Physical function 41.8 ± 22.9 88.9 ± 22.5 < 0.001 proton leak. In order to compare rest-
survey Role – physical 6.6 ± 20.3 93.3 ± 18 < 0.001 ing mitochondrial respiration as well
Body pain 40.8 ± 24.4 87.8 ± 15 < 0.001 as the capability of patients’ T cells
General health 22.8 ± 14.9 76.7 ± 15.7 < 0.001 to remodel mitochondrial metab-
Vitality 18.6 ± 19.3 71.7 ± 16 < 0.001 olism following activation, we also
Social functioning 31.4 ± 26 90.5 ± 15.3 < 0.001 ran a Mito Stress Test after stimu-
Role – emotional 64.8 ± 46 90.7 ± 18.7 0.008 lation. For both CD8+ and CD4+ T
Mental health 70.1 ± 19.8 83.5 ± 33 0.04 cells, we assayed metabolism at rest
Physical component score 24.2 ± 7.5 52 ± 8.2 < 0.001
and after overnight stimulation with
Mental component score 43.8 ± 11 53.7 ± 10.4 < 0 .001
anti-CD3/anti-CD28 beads and IL-2.
We confirmed our activation method
via flow cytometric analysis of the
early activation marker CD69 on our
(17.8%) healthy controls reported gastrointestinal symptoms (P < cells (Supplemental Figure 1). Both ME/CFS and healthy control
0.001) (Supplemental Table 1). Strikingly, 43.4% of patients report- T cells had significantly increased CD69 MFI after overnight
ed being diagnosed with irritable bowel syndrome (IBS) compared stimulation (Supplemental Figure 1). We did not always have a
with only 6.7% of controls (P < 0.001) (Supplemental Table 1). A sufficient number of T cells to include a subject in every assay.
total of 33 of 53 (62.3%) patients had at least 1 family member with The number of viable PBMCs we received varied among differ-
an immune- or inflammation-related disease, whereas only 15 of ent subjects, and some subjects had a greater frequency of T cells
45 (33.3%) healthy controls reported the same (P = 0.008). This than others, as is expected (53). In particular, the sample size for
was largely driven by an increased incidence of rheumatoid arthri- activated cell assays was reduced in order to perform preferential
tis and type 1 diabetes for family members of patients with ME/ assays of cells in circulation.
CFS (Supplemental Table 1). No control subjects reported immune For CD4+ T cells, we detected no significant difference in bas-
or inflammatory disease diagnoses, but 7 patients with ME/CFS al mitochondrial respiration between healthy control and ME/CFS
reported being diagnosed with at least 1 immune or inflammato- cells at rest (Figure 1A). We observed a small but nonsignificant
jci.org Volume 130 Number 3 March 2020 1493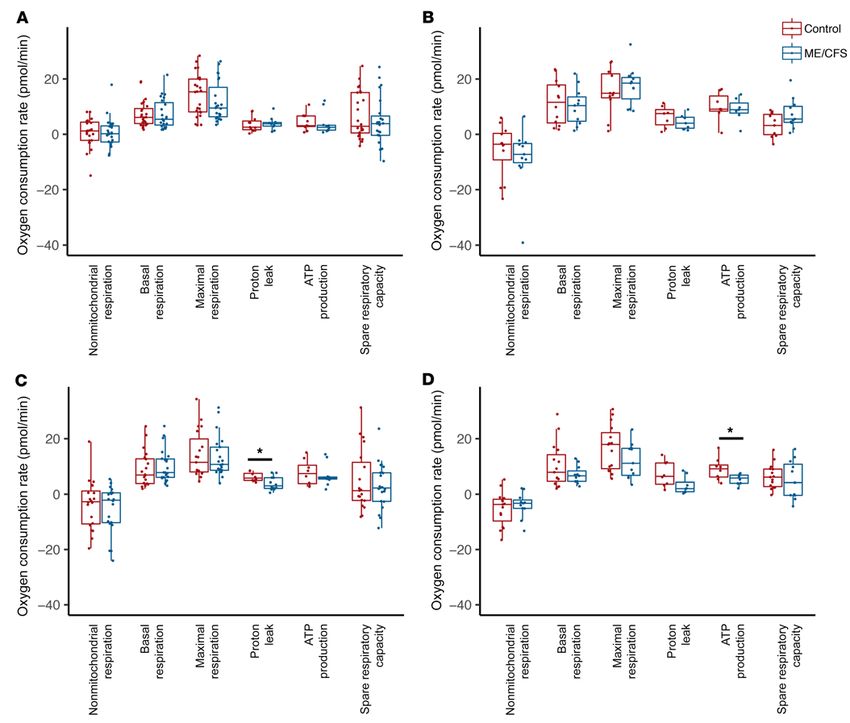
RESEARCH ARTICLE                                                                                                The Journal of Clinical Investigation

Figure 1. ME/CFS CD8+ T cell proton leak and ATP production are reduced compared with healthy control samples. (A) Resting mitochondrial respiration
parameters for healthy control and ME/CFS CD4+ T cells, including nonmitochondrial respiration (n = 24 healthy control samples; n = 23 ME/CFS samples
[n = 24/23]), basal respiration (n = 24/23), maximal respiration (n = 24/23), proton leak (n = 11/10), ATP production (n = 11/10), and spare respiratory capac-
ity (n = 24/23). (B) Mitochondrial respiration parameters for healthy control and ME/CFS CD4+ T cells after overnight stimulation with anti-CD3/anti-CD28
and IL-2, including nonmitochondrial respiration (n = 12/11), basal respiration (n = 12/11), maximal respiration (n = 11/11), proton leak (n = 7/7), ATP pro-
duction (n = 7/7), and spare respiratory capacity (n = 11/11). (C) Resting mitochondrial respiration parameters for healthy control and ME/CFS CD8+ T cells,
including nonmitochondrial respiration (n = 20/22), basal respiration (n = 20/22), maximal respiration (n = 19/21), proton leak (n = 8/12), ATP production
(n = 8/12), and spare respiratory capacity (n = 19/21). (D) Mitochondrial respiration parameters for healthy control and ME/CFS CD8+ T cells after stimula-
tion, including nonmitochondrial respiration (n = 15/11), basal respiration (n = 15/11), maximal respiration (n = 15/11), proton leak (n = 8/8), ATP production
(n = 8/8), and spare respiratory capacity (n = 15/11). Box plots represent the median (middle line) and 25th and 75th quartiles (bottom and top edges of
box). Whiskers represent 1.5 times the IQR and outliers are defined as values beyond whiskers. *P < 0.05 by Wilcoxon rank-sum test.

decrease in maximal respiration in ME/CFS CD4+ T cells com-                            We found no significant difference in basal mitochondrial respi-
pared with healthy control CD4+ T cells, but not in spare respirato-              ration between patient and healthy control CD4+ T cells after over-
ry capacity (Figure 1A). Both maximal respiration and spare respi-                night stimulation (Figure 1B). We also observed no difference in max-
ratory capacity varied widely in healthy control and ME/CFS CD4+                  imal respiration or ATP production (Figure 1B). In ME/CFS CD4+ T
T cells at rest (Figure 1A). We detected no significant difference in             cells, we detected a small increase in spare respiratory capacity and a
proton leak between CD4+ T cells from patients with ME/CFS ver-                   reduction in proton leak compared with healthy control CD4+ T cells,
sus those from control subjects (Figure 1A). ATP production was                   but neither difference was statistically significant (Figure 1B).
slightly reduced in patients’ CD4+ T cells at rest compared with                       Both healthy control and ME/CFS CD4+ T cells displayed
cells from healthy controls, but there were 2 outliers (Figure 1A).               higher, although nonsignificant, basal and maximal mitochondri-

   1494                jci.org   Volume 130   Number 3   March 2020
The Journal of Clinical Investigation RESEARCH ARTICLE
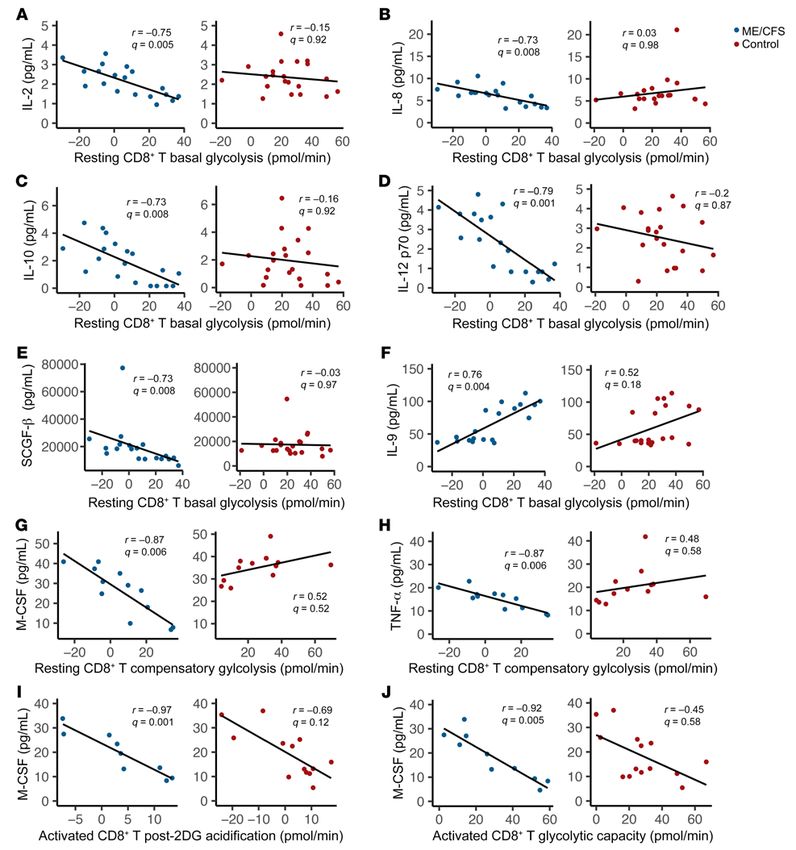
Figure 2. Mitochondrial mass and membrane potential do not differ between healthy control and ME/CFS CD4+ T cells. (A) MTG, MTR CMXRos, and
Hoechst 33342 staining of representative resting and activated control and ME/CFS CD4+ T cells. The experiment was conducted 4 times for each con-
dition. Scale bars: 5 μm. (B) MTG and MTR CMXRos MFI as determined by flow cytometry in healthy control and ME/CFS CD4+ T cells at rest and after
overnight activation (n = 15 healthy control samples at rest; n = 14 healthy control samples after activation; n = 17 ME/CFS samples at rest; n = 16 ME/CFS
samples after activation). Data represent the mean ± SEM. MTG, MitoTracker Green; MTR, MitoTracker Red.
al respiration following activation compared with cells at rest (Fig- efficiency (Figure 1C). ATP production was slightly decreased, but
ure 1, A and B). In both groups, we observed a substantial variation there was high variability in both groups (Figure 1C). We found no
in mitochondrial metabolism after activation (Figure 1, A and B). difference in spare respiratory capacity between patient and con-
ATP production was markedly increased in healthy control CD4+ trol CD8+ T cells at rest (Figure 1C).
T cells following activation and trended higher in ME/CFS CD4+ T After activation, we detected a small reduction in basal
cells (Figure 1, A and B). mitochondrial respiration in ME/CFS CD8+ T cells compared
Overall, CD4+ T cells from patients displayed no significant with healthy control cells (Figure 1D). ME/CFS CD8+ T cells also
differences in mitochondrial respiration either at rest or after over- showed a small but nonsignificant decrease in maximal respi-
night stimulation. This suggests no major defects in mitochondrial ration (Figure 1D). We observed no difference in spare respira-
metabolism within ME/CFS CD4+ T cells. Furthermore, ME/CFS tory capacity between patient and healthy control CD8+ T cells
CD4+ T cells did not appear to have a defect in their response to after activation (Figure 1D). Proton leak trended lower in stimu-
activation via mitochondrial respiration. lated ME/CFS CD8+ T cells compared with healthy control cells,
ME/CFS CD8+ T cells have decreased proton leak and ATP pro- which was consistent with the decrease observed in resting
duction. We then analyzed mitochondrial respiration in total CD8+ cells (Figure 1D). However, ATP production was significantly
T cells. We detected no significant difference in basal or maximal decreased in ME/CFS CD8+ T cells after activation, suggesting
mitochondrial metabolism between healthy control and ME/CFS that the decreased proton leak does not result in improved ATP
CD8+ T cells at rest (Figure 1C). However, proton leak was signifi- production (Figure 1D).
cantly reduced in CD8+ T cells from patients with ME/CFS versus Healthy control CD8+ T cell metabolism showed a small
those from healthy controls, suggesting increased mitochondrial increase in basal respiration from rest to activation (Figure 1, C and
jci.org Volume 130 Number 3 March 2020 1495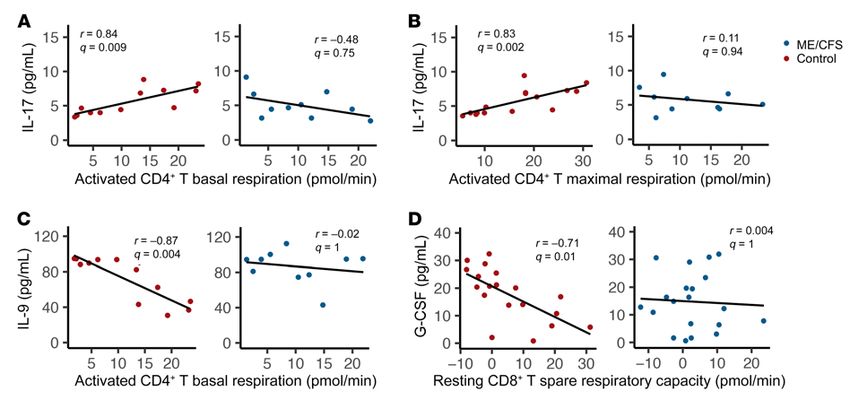
RESEARCH ARTICLE                                                                                           The Journal of Clinical Investigation

Figure 3. Mitochondrial membrane potential is decreased in CD8+ T cells from patients with ME/CFS. (A) MTG, MTR CMXRos, and Hoechst 33342 stain-
ing of representative resting and stimulated control and ME/CFS CD8+ T cells. The experiment was conducted 4 times for each condition. Scale bars: 5 μm.
(B) MTG and MTR CMXRos MFI as determined by flow cytometry in healthy control and ME/CFS CD8+ T cells at rest and after overnight activation (n = 15
healthy control samples at rest; n = 15 healthy control samples after activation; n = 17 ME/CFS samples at rest; n = 14 ME/CFS samples after activation).
Data represent the mean ± SEM. **P < 0.01 by Kruskal-Wallis followed by Dunn’s test with FDR-based multiple testing correction. MTG, MitoTracker
Green; MTR, MitoTracker Red.

D). Meanwhile, ME/CFS CD8+ T cells showed either no change                     mitochondrial membrane potential. We evaluated mitochondria
or a decrease in basal mitochondrial metabolism after activation               by confocal microscopy as well as flow cytometry. For confocal
compared with resting cells (Figure 1, C and D). The same pattern              microscopy, cells were also stained with Hoechst 33342 to visual-
was found in both maximal respiration and ATP production (Fig-                 ize nuclei. Both the microscopic and flow cytometric experiments
ure 1, C and D). Thus, ME/CFS CD8+ T cells may be less able to                 were conducted after overnight resting or stimulation of cells to
induce metabolism following activation.                                        determine how T cell mitochondria from patients and controls
     Overall, these data indicate possible mitochondrial dysfunc-              respond to activation.
tion in ME/CFS CD8+ T cells. The lack of increased metabolism                      Confocal microscopy revealed no difference in MTG or MTR
in ME/CFS CD8+ T cells and additional differences between cells                CMXRos staining of CD4+ T cells (Figure 2A). Both at rest and fol-
from patients versus those from controls after activation suggest              lowing activation, the MitoTracker dyes costained well in merged
an impaired ability to reprogram metabolism.                                   images of CD4+ T cells from patients and controls (Figure 2A). We
     CD4+ T cell mitochondrial mass and membrane potential do not              observed no morphological differences in mitochondria within
differ between patients and controls. To further investigate mito-             CD4+ T cells from patients and controls, although the fluorescence
chondria in ME/CFS T cells, we sought to characterize mitochon-                image resolution was limited (Figure 2A).
drial morphology and membrane potential in T cells. We stained                     Flow cytometry revealed no significant difference in MTG
both CD4+ and CD8+ T cells with MitoTracker Green (MTG) and                    MFI between healthy control and ME/CFS CD4+ T cells either at
MitoTracker Red (MTR) CMXRos simultaneously. MTG indi-                         rest or after stimulation, indicating that there was no difference
cates mitochondrial mass, whereas MTR CMXRos is sensitive to                   in mitochondrial mass in either state (Figure 2B). Furthermore,

   1496               jci.org   Volume 130   Number 3   March 2020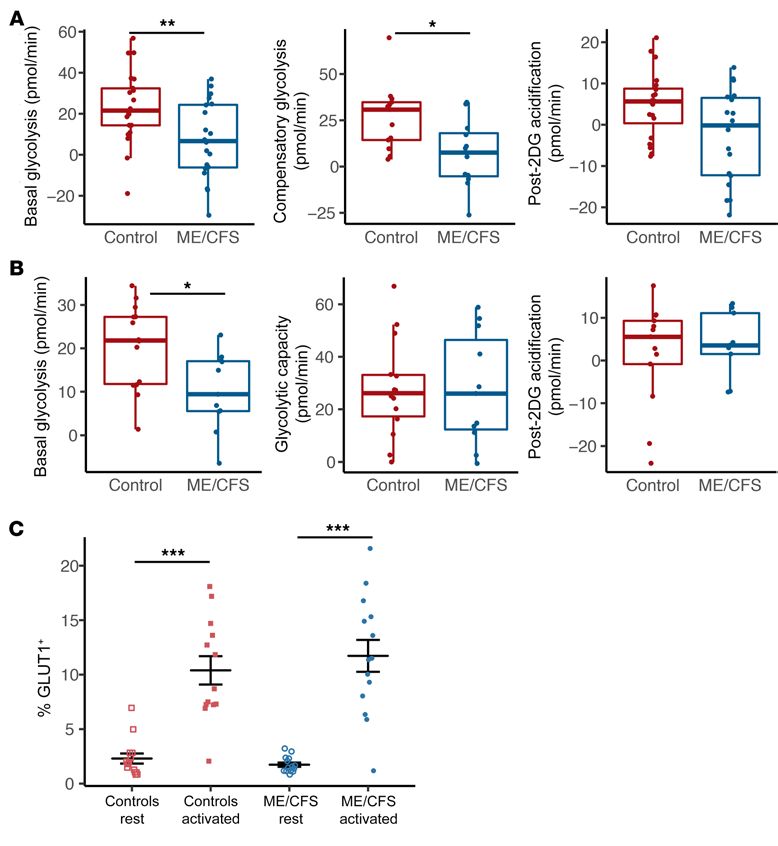
The Journal of Clinical Investigation RESEARCH ARTICLE
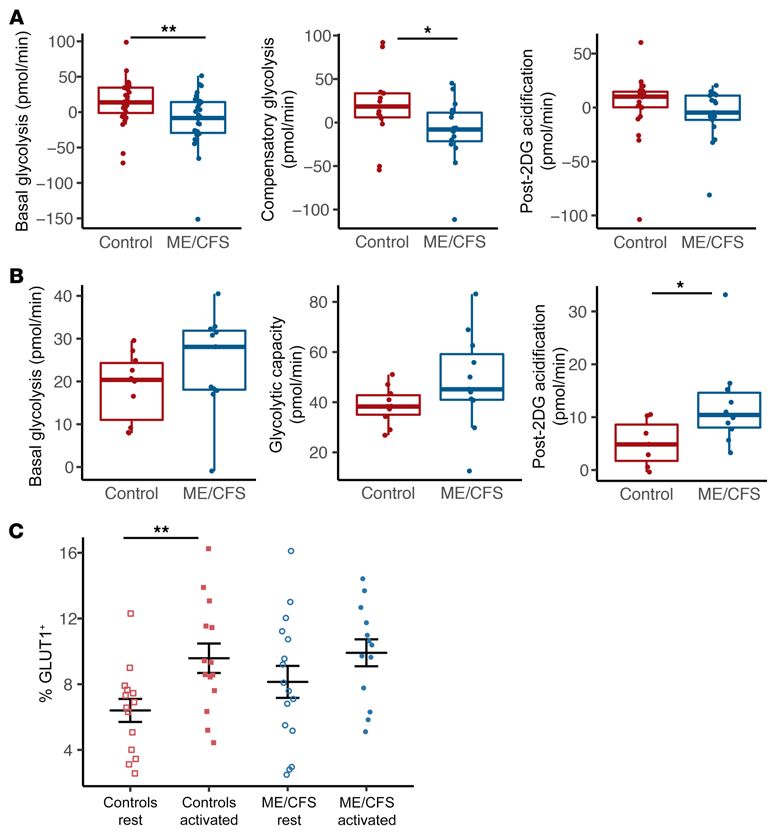
Figure 4. Basal glycolysis is reduced
in ME/CFS CD4+ T cells. (A) Rest-
ing glycolysis measurements from
Seahorse extracellular flux analysis of
healthy control and ME/CFS CD4+ T
cells, including basal glycolysis (n = 28),
compensatory glycolysis (n = 15 healthy
control samples; n = 16 ME/CFS samples
[n = 15/16]), and post-2DG acidification
(n = 22/17). (B) Glycolysis measurements
in stimulated healthy control and
ME/CFS CD4+ T cells, including basal
glycolysis (n = 10/11), glycolytic capacity
(n = 10/11), and post-2DG acidification
(n = 7/10). (C) Percentage of GLUT1+
cells in resting and activated CD4+ T
cells from patients with ME/CFS and
healthy controls (n = 14 healthy control
samples at rest; n = 14 healthy control
samples after activation; n = 16 ME/CFS
samples at rest; n = 13 ME/CFS samples
after activation). Box plots represent
the median (middle line) and 25th and
75th quartiles (bottom and top edges of
box). Whiskers represent1.5 times the
IQR) and outliers are defined as values
beyond the whiskers. For dot plots, data
represent the mean ± SEM. *P < 0.05;
**P < 0.01, by Wilcoxon rank-sum test
(A and B) and Kruskal-Wallis followed
by Dunn’s test with FDR-based multiple
testing correction (C).
we observed no significant differences in MTR CMXRos MFI scopic images, we observed no significant difference in MTG MFI
between healthy control and ME/CFS CD4+ T cells at rest or after between healthy control and ME/CFS CD8+ T cells at rest (Figure
activation (Figure 2B). As such, there was also no apparent differ- 3B). We noted a small but nonsignificant increase in MTG MFI
ence in mitochondrial membrane potential in CD4+ T cells from following overnight stimulation of cells from both control sub-
patients compared with those from controls. jects and patients (Figure 3B). MTR CMXRos was also slightly
ME/CFS CD8+ T cells have decreased mitochondrial membrane increased in healthy control and ME/CFS CD8+ T cells following
potential. We also visualized CD8+ T cells via confocal microscopy activation. However, ME/CFS CD8+ T cells showed significantly
to assess mitochondrial morphology, mass, and membrane poten- lower MTR CMXRos both at rest and after activation compared
tial. MTG staining revealed no difference in mitochondria in cells with healthy control CD8+ T cells (Figure 3B). Thus, CD8+ T cells
from healthy controls versus those from patients with ME/CFS from patients had no difference in mitochondrial mass in either
(Figure 3A). However, at rest and after stimulation, we observed state but had decreased mitochondrial membrane potential com-
ME/CFS CD8+ T cells with mitochondria that were stained by MTG pared with healthy control cells.
but had little to no MTR CMXRos staining (Figure 3A). Meanwhile, ME/CFS CD4+ T cell glycolysis is reduced at rest compared with
CD8+ T cells from healthy controls showed an even costaining of healthy control cells. The second major, although less efficient,
MTG and MTR CMXRos, similar to that observed with CD4+ T energy-producing pathway in the cell is glycolysis. Glycolysis plays
cells (Figure 3A). We found no observable difference in mitochon- a significant role in immune cell function and is critical to T cell
drial morphology between healthy control and ME/CFS CD8+ T activation. We thus investigated whether glycolysis in ME/CFS T
cells in either state. Further imaging experiments, particularly by cells functions comparably to glycolysis in healthy control cells.
electron microscopy, will be necessary to determine whether there Additionally, we sought to determine whether ME/CFS T cells can
are differences not detectable by fluorescence microscopy. properly stimulate glycolysis following activation. We assessed gly-
We then used flow cytometry to quantify fluorescence of the colysis in both CD8+ and CD4+ T cells at rest and after stimulation
2 mitochondrial dyes in CD8+ T cells. Consistent with our micro- using the Seahorse XFe96 extracellular flux analyzer. For resting
jci.org Volume 130 Number 3 March 2020 1497RESEARCH ARTICLE The Journal of Clinical Investigation
Figure 5. Basal glycolysis is reduced
in ME/CFS CD8+ T cells. (A) Rest-
ing glycolysis measurements from
Seahorse extracellular flux analysis
of healthy control and ME/CFS CD8+
T cells, including basal glycolysis
(n = 21 healthy control samples; n
= 20 ME/CFS samples [n = 21/20]),
compensatory glycolysis (n = 13/12),
and post-2DG acidification (n = 20/18).
(B) Glycolysis measurements in stim-
ulated healthy control and ME/CFS
CD8+ T cells, including basal glycolysis
(n = 14/11), glycolytic capacity (n =
14/11), and post-2DG acidification
(n = 13/9). (C) Percentage of GLUT1+
cells in resting and activated CD8+
T cells from patients with ME/CFS
and healthy controls (n = 14 healthy
control samples at rest; n = 13 healthy
control samples after activation; n =
14 ME/CFS samples at rest; n = 14 ME/
CFS samples after activation). Box
plots represent the median (middle
line) and 25th and 75th quartiles
(bottom and top edges of box).
Whiskers represent 1.5 times the IQR
and outliers are defined as values
beyond the whiskers. For dot plots,
data represent the mean ± SEM. *P
< 0.05, **P < 0.01, and ***P < 0.001,
by Wilcoxon rank-sum test (A and B)
and Kruskal-Wallis followed by Dunn’s
test with FDR-based multiple testing
correction (C).
T cells, we analyzed glycolysis with a Seahorse Glycolytic Rate between healthy control and patient CD4+ T cells after overnight
Assay, which provides quantitative measurements of basal glycoly- stimulation, suggesting that activation was sufficient to over-
sis, compensatory glycolysis, and post–2-deoxyglucose (post-2DG) come the decrease in resting glycolysis (Figure 4B). There was,
acidification. Given the limited number of cells we had available however, substantial variation in glycolysis in stimulated ME/
for assaying glycolysis after activation, we instead used a combined CFS cells. Likewise, glycolytic capacity was not significantly dif-
drug injection strategy that allowed simultaneous measurements ferent between control and ME/CFS CD4+ T cells after activa-
of glycolysis and mitochondrial respiration. This involved a typical tion, despite the small increase in glycolytic capacity observed
Mito Stress Test with an added final injection of 2DG and 5 mea- in patients’ cells (Figure 4B). Post-2DG acidification was signifi-
surements. Because we used this strategy, in stimulated cells we cantly higher in ME/CFS CD4+ T cells compared with that in CD4+
compared basal glycolysis as well as glycolytic capacity, or the gly- T cells from healthy controls, despite the slight decrease in post-
colysis induced by the injection of oligomycin, and post-2DG acid- 2DG acidification observed in resting cells (Figure 4B). This may
ification. We did not make direct comparisons between compensa- indicate increased extracellular acidification from nonglycolytic
tory glycolysis and glycolytic capacity, but we were able to compare sources in activated ME/CFS CD4+ T cells. Additionally, this find-
basal glycolysis from rest to activation. ing may explain the small increase in glycolytic rates compared
When we assayed glycolysis in CD4+ T cells at rest, we found with control cells.
that basal glycolysis was significantly lower in cells from patients Between rest and stimulation, we found that basal glycolysis
with ME/CFS compared with those from healthy controls (Fig- increased in both healthy control and ME/CFS CD4+ T cells, but
ure 4A). Compensatory glycolysis was also significantly reduced this difference was only substantial in ME/CFS cells (Figure 4, A
at rest in ME/CFS CD4+ T cells (Figure 4A). Post-2DG acidifica- and B). Post-2DG acidification did not differ in healthy control
tion was slightly but not significantly decreased in ME/CFS CD4+ CD4+ T cells from rest to activation but was higher in ME/CFS
T cells compared with healthy control CD4+ T cells (Figure 4A). CD4+ T cells after activation, indicating increased extracellular
Interestingly, we found no difference in basal glycolysis rates sources of acidification following stimulation (Figure 4, A and B).
1498 jci.org Volume 130 Number 3 March 2020The Journal of Clinical Investigation RESEARCH ARTICLE
As glycolysis depends on glucose uptake through the main glu- multiple testing. Correlations with a FDR-adjusted P value (q
cose transporter GLUT1, we also determined the GLUT1 surface value) below 0.01 were considered significant. We also ana-
abundance via flow cytometry. The percentage of GLUT1+ cells lyzed correlations in patients and controls separately to deter-
was significantly increased in healthy control subjects and showed mine whether both groups shared the same relationships within
an increasing trend in patients with ME/CFS after stimulation, the data. Finally, we determined whether T cell metabolism was
when compared with resting cells. (Figure 4C). We detected no different between patients with or without IBS or inflammatory
significant differences in the percentage of GLUT1+ cells between bowel disease (IBD).
healthy control and ME/CFS CD4+ T cells, either at rest or after We found no significant correlations between T cell metabo-
activation (Figure 4C). However, we observed a small increase lism and survey data in patients with ME/CFS or healthy controls.
in GLUT1+ cells in ME/CFS CD4+ T cells compared with control Additionally, T cell metabolism was not significantly different
CD4+ T cells at rest, despite the reduction in glycolysis. in patients with IBS or IBD compared with those without either
ME/CFS CD8+ T cell glycolysis is decreased at rest and after acti- disease. However, we found a number of significant correlations
vation. We next investigated glycolysis in CD8+ T cells. As with between plasma cytokines and metabolism. Most interestingly,
CD4+ T cells, we found that basal glycolysis was significantly these correlations were unique in patients with ME/CFS com-
reduced in ME/CFS CD8+ T cells at rest (Figure 5A). Compensato- pared with the control group. In patients with ME/CFS, we found
ry glycolysis was also significantly reduced in ME/CFS CD8+ T cells significant negative correlations between resting basal glycolysis
at rest (Figure 5A). Post-2DG acidification was reduced, although in CD8+ T cells and the abundance of IL-2, IL-8, IL-10, IL-12 p70,
this difference was not significant. Unlike our CD4+ T cell results, and SCGF-β (Figure 6, A–E). None of these correlations were sig-
ME/CFS CD8+ T cells also had significantly lower basal glycolysis nificant in healthy control subjects (Figure 6, A–E). Conversely,
after activation compared with healthy control CD8+ T cells (Figure we found a significant positive correlation between resting basal
5B). We observed no significant difference in glycolytic capacity or glycolysis in CD8+ T cells and abundance of IL-9 (Figure 6F). This
post-2DG acidification between ME/CFS and control stimulated same trend was present in healthy controls but was not significant
CD8+ T cells (Figure 5B). There was high variability in glycolytic (Figure 6F). Resting CD8+ T cell compensatory glycolysis had sig-
capacity in cells from both groups (Figure 5B). nificant negative correlations with macrophage-CSF (M-CSF)
There were minimal changes in glycolysis between rest and and TNF-α (Figure 6, G and H). Interestingly, we observed the
activation for both healthy control and ME/CFS CD8+ T cells (Fig- opposite trends in healthy control cells (Figure 6, G and H). Fol-
ure 5, A and B). Interestingly, we detected a slight, nonsignificant lowing stimulation, patient CD8+ T cell post-2DG acidification
increase in post-2DG acidification in ME/CFS CD8+ T cells fol- and glycolytic capacity both correlated negatively with M-CSF
lowing stimulation, similar to the response we observed in ME/ abundance (Figure 6, I and J). In healthy controls, the same rela-
CFS CD4+ T cells (Figure 5, A and B). The reduced basal glycolysis tionships existed but were not significant (Figure 6, I and J). As
after activation may indicate an impaired ability of CD8+ T cells many of these cytokines are proinflammatory, it is surprising that
to remodel glycolysis after activation, similar to what we observed their abundance correlated with reduced metabolism in ME/CFS
with mitochondrial respiration. CD8+ T cells.
We also quantified GLUT1+ cells via flow cytometric analysis We detected 4 significant correlations between cytokines and
of ME/CFS and healthy control CD8+ T cells. Like CD4+ T cells, measures of metabolism in control subjects, primarily in activated
CD8+ T cells from both groups had an increased percentage of CD4+ T cell data. Stimulated CD4+ T cell basal mitochondrial res-
GLUT1+ cells following stimulation (Figure 5C). Additionally, we piration and maximal respiration were positively correlated with
again observed no significant differences in the abundance of the proinflammatory cytokine IL-17 (Figure 7, A and B). Mean-
GLUT1+ cells between healthy control and ME/CFS cells, either while, in patients with ME/CFS, these correlations were nonsig-
at rest or after activation (Figure 5C). Nevertheless, we detected nificant, and maximal respiration was negatively associated with
a lower percentage of GLUT1+ cells in patient CD8+ T cells at rest IL-17 (Figure 7, A and B). We observed a significant negative cor-
than in healthy control CD8+ T cells (Figure 5C). relation between plasma IL-9 and activated CD4+ T cell basal res-
Plasma cytokines uniquely correlate with T cell metabolism in piration that was not present in patients with ME/CFS (Figure 7C).
patients with ME/CFS. In addition to PBMCs, we collected EDTA Finally, we detected a significant negative correlation between
plasma samples from all subjects. To further investigate immune resting CD8+ T cell spare mitochondrial respiratory capacity and
function in ME/CFS, we analyzed plasma cytokine abundance in G-CSF in healthy controls, but not in patients with ME/CFS (Fig-
37 healthy control and 36 ME/CFS samples via a 48-plex magnetic ure 7D). Overall, patients with ME/CFS and healthy controls have
bead–based immunoassay. Of the 48 cytokines and chemokines unique correlations between plasma cytokines and T cell metabo-
measured, 44 were detected. We compared cytokine abundance lism that further indicate immune alterations in ME/CFS.
in plasma of patients with ME/CFS and healthy controls and found
no significant differences between the groups for any of the 44 Discussion
cytokines detected (Supplemental Table 2). T cells have previously been implicated in ME/CFS through func-
Although we did not detect differences in plasma cytokine tional assays and surface marker characterization. The clustered
abundance between patients and controls, we were interested outbreaks of ME/CFS, onset of disease, and immune-related symp-
in determining whether T cell metabolism correlated with the toms all suggest an infectious trigger. Altered cytokine profiles,
levels of plasma cytokines or survey data. To do this, we per- reduced NK cell cytotoxicity, and previously successful treatments
formed a Spearman’s correlation test with FDR correction for for patients further implicate the immune system in the disease (1).
jci.org Volume 130 Number 3 March 2020 1499RESEARCH ARTICLE The Journal of Clinical Investigation
Figure 6. Plasma cytokines are uniquely correlated with T cell metabolism in patients with ME/CFS. Significant correlations between plasma cytokines
and cellular metabolism in patients and nonsignificant correlations in healthy controls. Correlations between resting CD8+ T cell (CD8+ T) basal glycolysis and
(A) IL-2 (n = 19 patients; n = 21 controls), (B) IL-8 (n = 18 patients; n = 19 controls), (C) IL-10 (n = 19 patients; n = 21 controls), (D) IL-12 p70 (n = 19 patients; n = 21
controls), (E) SCGF-β (n = 19 patients; n = 20 controls), (F) and IL-9 (n = 19 patients; n = 21 controls); between resting CD8+ T cell compensatory glycolysis and
(G) M-CSF (n = 12 patients; n = 12 controls) and (H) TNF-α (n = 12 patients; n = 12 controls); (I) between activated CD8+ T cell post-2DG acidification and M-CSF
(n = 9 patients; n = 13 controls); and (J) between activated CD8+ T cell glycolytic capacity and M-CSF (n = 10 patients; n = 14 controls). All correlations were
evaluated using a Spearman’s correlation test with FDR-based multiple testing correction, where a q value of less than 0.01 was considered significant.
In our study population, we saw evidence of immune involve- teria (54, 55). Furthermore, for patients, the increase in either
ment in ME/CFS through our survey data. Of the 53 patients with comorbid diagnosis or diagnoses of relatives with immune-related
ME/CFS, 41 reported either a known viral infection or a viral-like conditions supports a role for the immune system and potential
illness as the trigger of their disease. Patients with ME/CFS had genetic predisposition for the disease.
a higher prevalence of gastrointestinal symptoms or disorders, Our study population was well balanced with regard to sex,
which has previously been reported and linked to altered gut bac- which allowed us to characterize T cells in both male and female
1500 jci.org Volume 130 Number 3 March 2020The Journal of Clinical Investigation RESEARCH ARTICLE
Figure 7. Plasma cytokines correlate with T cell metabolism in healthy controls. Significant correlations between plasma cytokines and cellular metab-
olism in healthy control subjects and nonsignificant correlations in patients. Correlations between (A) activated CD4+ T cell basal respiration and IL-17 in
control subjects (n = 12) and patients (n = 10); (B) between activated CD4+ T cell maximal respiration and IL-17 in control subjects (n = 15) and patients (n =
10); (C) between activated CD4+ T cell basal respiration and IL-9 in control subjects (n = 12) and patients (n = 10); and (D) between resting CD8+ T cell spare
respiratory capacity and G-CSF in control subjects (n = 19) and patients (n = 20). All correlations were evaluated using a Spearman’s correlation test with
FDR-based multiple testing correction, where a q value of less than 0.01 was considered significant.
subjects. Almost all subjects were White, which is common in This may relate to the stimulation methods used. It is worth noting
ME/CFS studies but not necessarily reflective of the true patient that MitoTracker MFI also ranged greatly in all populations.
population (1). Our population was composed mainly of patients In CD8+ T cells, we only observed a significant reduction in
with long-duration disease, which is not surprising, given that proton leak in ME/CFS cells at rest compared with healthy control
the average time to diagnosis reported was nearly 7 years. Thus, cells. A decrease in proton leak would suggest an increase in mito-
an analysis of T cell metabolism in patients with short- versus chondrial respiratory efficiency, yet basal respiration, maximal
long-duration disease was not possible in this study, but a future respiration, and ATP production were not significantly different in
investigation including more patients with short-duration disease ME/CFS CD8+ T cells compared with healthy control cells. After
may yield additional insights. activation, we observed a similar phenotype. As a whole, basal
Given the evidence of a dysfunctional immune system in respiration in ME/CFS CD8+ T cells did not increase to the same
patients with ME/CFS and the increasing appreciation of the extent as that in healthy control cells following stimulation, sug-
role that immune metabolism plays in T cell function, we sought gesting an impairment in the ability of these ME/CFS CD8+ T cells
to investigate metabolism in ME/CFS CD4+ and CD8+ T cells. A to undergo metabolic reprogramming.
previous study found reduced mitochondrial respiration in ME/ Our study of mitochondria in CD8+ T cells through imag-
CFS PBMCs compared with healthy control PBMCs, but our study ing revealed a significant reduction in mitochondrial membrane
is the first to our knowledge to study specific T cell metabolism potential in ME/CFS CD8+ T cells both at rest and after activation.
in ME/CFS (51). We characterized the 2 main energy-producing This was surprising in light of the observed decrease in proton leak
pathways — oxidative phosphorylation and glycolysis — in cells in patients’ cells but is nonetheless supported by other observa-
and their underlying cellular components. tions of hypometabolism in ME/CFS immune cells (50, 51, 59).
Our study of mitochondrial respiration revealed that ME/CFS Furthermore, a subset of ME/CFS CD8+ T cell samples had more
CD4+ T cells had no dysfunction in mitochondrial metabolism or mitochondrial mass at rest than did CD8+ T cells from healthy con-
any difficulty in increasing respiration in response to activation. trol subjects. Both healthy control and ME/CFS CD8+ T cells had
The wide variation in many measures of metabolism was expected, expected increases in mitochondrial mass and membrane potential
but limited our ability to differentiate between patient and control after activation, although this difference was nonsignificant and
cells. Our main limitation was sample size, primarily for overnight insufficient to overcome the reduced mitochondrial membrane
stimulation experiments. As expected and previously shown, both potential in ME/CFS cells (60). In fact, the difference in mitochon-
ME/CFS and healthy control CD4+ T cells had increased mito- drial membrane potential was greater following overnight stimu-
chondrial respiration after activation (37, 56). There were also lation. This may help explain the impaired metabolic response to
no differences in mitochondrial mass or membrane potential activation and the greater observable differences in mitochondrial
between ME/CFS and healthy control CD4+ T cells. Surprisingly, respiration in stimulated cells. A decrease in mitochondrial mem-
we observed no significant increase in mitochondrial mass follow- brane potential has been seen following chronic viral infection and
ing activation, which has previously been demonstrated (57, 58). is a common feature of T cell exhaustion (43, 45, 61).
jci.org Volume 130 Number 3 March 2020 1501RESEARCH ARTICLE The Journal of Clinical Investigation
In both CD4+ and CD8+ T cells from patients with ME/CFS, which was positively correlated with ME/CFS CD8+ T cell glycoly-
we found significant reductions in basal glycolysis and compen- sis, is a T cell growth factor but has complex effects (63). In patients
satory glycolysis at rest. Interestingly, reduced plasma glucose in with breast cancer, IL-9–producing Th9 cells led to improved
ME/CFS has previously been reported (34). Reductions in glu- CD8+ T cell cytotoxicity, which would require an increase in cellu-
cose metabolism, without concurrent increases in mitochondrial lar metabolism (68). IL-9 was negatively correlated with activated
respiration, indicate hypometabolism in ME/CFS cells. Following CD4+ T cell basal respiration in healthy controls, which could be
stimulation, we observed no significant difference in CD4+ T cell related to IL-9–induced improvement of Treg function (69).
basal glycolysis or glycolytic capacity, indicating that activation Cytokines produced by other immune cells or T cell subsets
was sufficient to overcome resting defects in glycolysis. ME/CFS are also secreted into plasma and contributed to our measure-
and healthy control CD4+ T cells both had increased glycolysis ments. Nevertheless, ME/CFS CD8+ T cells have multiple neg-
from rest to activation as expected, again suggesting that ME/CFS ative correlations between metabolism and plasma cytokines
CD4+ T cells are capable of proper metabolic reprogramming (36). where positive correlations might be expected (63). This finding
In contrast, ME/CFS CD8+ T cells still had significantly decreased suggests that the relationship between proinflammatory cyto-
basal glycolysis compared with healthy controls after activation. kines in plasma and T cell metabolism is altered in patients with
Along with our findings in CD8+ T cell mitochondrial respiration ME/CFS and implicates specific cytokines in ME/CFS that merit
after activation, this significant decrease in glycolysis supports further investigation.
an impairment in the ME/CFS CD8+ T cell metabolic response to It is clear that the immune system plays a role in ME/CFS.
activation. Nevertheless, there were minimal changes in the rates Our data indicate that there are existing reductions in resting T
of glycolysis in patient and healthy control CD8+ T cells between cell metabolism in patients. In particular, CD8+ T cells had altered
resting and activated states. mitochondrial membrane potential and an impaired metabolic
In both CD4+ and CD8+ T cells, the percentage of GLUT1+ cells response to activation. Both CD4+ and CD8+ T cells had signifi-
was increased following stimulation, as previously shown in T cells cant reductions in glycolysis. This hypometabolism in T cells
(62), with no significant differences between cells from patients aligns with other findings of hypometabolism in ME/CFS cells
and control subjects. We detected a slight increase in the percent- (50, 51, 59). Furthermore, patients with ME/CFS appeared to
age of ME/CFS CD4+ T cells that are GLUT1+ compared with con- have altered relationships between plasma cytokine abundance
trols. However, we observed a small reduction in the percentage and T cell metabolism, in which proinflammatory cytokines unex-
of ME/CFS CD8+ T cells that are GLUT1+ at rest compared with pectedly correlated with hypometabolism. Such a dysregulation
control cells, which is consistent with the decrease in glycolysis at may indicate that ME/CFS T cells have lost responsiveness to
rest. A previous study of T cell exhaustion demonstrated increased some proinflammatory cytokines. Along with hypometabolism in
rather than decreased GLUT1 expression with impaired glycolysis immune cells, this is consistent with a possible ongoing infection
(61). Additionally, glucose may be used for alternative pathways (42), though such an infectious agent has not yet been identified. A
that are not measured by the Seahorse assays. high priority moving forward will be to determine the mechanism
When we analyzed all of our data for correlations, we found behind hypometabolism in ME/CFS T cells as well as how altered
significant correlations between plasma cytokine abundance and metabolism affects the function of these cells.
measures of T cell metabolism, which were unique in patients
with ME/CFS compared with controls. ME/CFS CD8+ T cell gly- Methods
colysis had multiple significant correlations with cytokines that Study population. Study participants were recruited by Simmaron
are known to be proinflammatory or with growth factors (63–65). Research (Incline Village, Nevada, USA). The subjects with ME/CFS
This is especially interesting, given the reduced basal glycolysis were established patients of Daniel Peterson. Healthy controls and
we observed in patients with ME/CFS. In particular, IL-2 would be patients with ME/CFS completed approved questionnaires including an
expected to induce glycolysis in T cells, rather than impair glycol- SF-36, a Bell scale, a specific symptom inventory, and additional ques-
ysis (66). Proinflammatory cytokines might be expected to be pos- tions regarding symptoms, comorbidities, and family health history.
itively correlated with T cell metabolism, yet they were negatively Sample collection and processing. Blood (80 mL) from each subject
correlated with ME/CFS T cell metabolism. was collected into EDTA tubes and immediately processed for collec-
In healthy controls, the proinflammatory cytokine IL-17 was tion of aliquots of whole blood, plasma, and PBMCs. Briefly, EDTA tubes
positively correlated with stimulated CD4+ T cell basal and max- were spun at 500 ×g for 5 minutes, and plasma was removed and stored
imal respiration (63). Interestingly, these same relationships had at –80°C. Blood was diluted 1:2 in PBS and layered over Histopaque 1077
negative trends in patients with ME/CFS. (Sigma-Aldrich) in 50-mL SepMate tubes (STEMCELL Technologies).
Other cytokines of interest had unique relationships with ME/ SepMate tubes were spun at 1200 ×g for 10 minutes. Excess plasma was
CFS and healthy control T cell metabolism. IL-10, which was also removed, and cells were poured into a clean 50-mL conical tube. Cells
negatively correlated with ME/CFS CD8+ T cell glycolysis, is an were washed once with PBS at 120 ×g to remove platelets and then a
immunosuppressive cytokine that has previously been linked to second time at 300 ×g for 5 minutes. PBMCs were then resuspended in
chronic infection, immune cell exhaustion, and inhibition of T freezing medium (60% RPMI 1640, 30% FBS, 10% DMSO) and stored
cell activation (46, 63, 67). In these examples, diminished T cell in isopropanol-containing freezing containers at –80°C to slow freezing.
metabolism would be predicted so that the negative correlation PBMCs and plasma aliquots were shipped overnight on dry ice within
with glycolysis in ME/CFS CD8+ T cells is expected. Nonetheless, 1 month of isolation to Cornell University. PBMCs were stored long
the absence of this correlation in healthy controls is notable. IL-9, term in liquid nitrogen, and plasma was stored at –80°C.
1502 jci.org Volume 130 Number 3 March 2020The Journal of Clinical Investigation RESEARCH ARTICLE
Immune cell isolation. Specific immune cell subsets were isolated analysis. The percentage of GLUT1+ cells and the MFI of MTG, MTR
using STEMCELL EasySep kits on a STEMCELL EasyEights magnet. CMXRos, and CD69 were calculated in this cell population. For CD4+
PBMCs were thawed quickly in a 37°C water bath. Following a wash in T cells, CD4+ or CD3+CD4+ cells were gated following live/dead exclu-
RPMI 1640, PBMCs were treated at room temperature with 10 mg/mL sion. Then, the percentage of GLUT1+ cells and the MFI of MTG, MTR
DNase I for 10 minutes and then strained through a 37-μm cell strain- CMXRos, and CD69 were determined.
er to remove any remaining clumps. After a second wash, cells were Confocal microscopy. Confocal microscopic imaging of immune
isolated using the EasySep Human CD19 Positive Selection II Kit, the cells was completed at the Cornell Biotechnology Resource center
EasySep Human CD56 Positive Selection II Kit, the EasySep Human using a Zeiss LSM710. Cells were incubated at 37°C overnight, with or
CD8 Positive Selection II Kit, and the EasySep Human CD4+ T Cell without stimulating reagents, as described above. Cells were stained
Isolation Kit, sequentially, and following the manufacturer’s instruc- for 30 minutes at 37°C with Hoechst 33342 (2 μg/mL), MTG (100
tions. Isolated cells were frozen and stored as described above. nM), and MTR CMXRos (50 nM). Cells were then washed in RPMI
Extracellular flux analysis. Extracellular flux experiments were 1640 media without FBS and moved onto a glass-bottom 24-well
conducted on a Seahorse XFe96 (Agilent Technologies) at Dart- MatTek plate coated with 22.4 mg/mL Cell-Tak. The plate was spun
mouth-Hitchcock Medical Center (Lebanon, New Hampshire, USA) down at 300 ×g for 1 minute with no brake. Images were taken imme-
or at the Cornell University Biotechnology Resource Center. Cells diately following staining using a ×63 oil immersion objective with
analyzed at Dartmouth-Hitchcock Medical Center were transported 12-bit depth, bidirectional scanning, and a ×3.6 zoom of the area of
on dry ice and immediately placed in a –150°C freezer. Cells for rest- interest. Images were captured either as a single image or by focus
ing assays were thawed on the day of the experiment and washed in stacking. Maximum intensity projections were created from the focus
Seahorse assay media (RPMI without phenol red, 10 mM glucose, stacks using Zen 2.5 software (Zeiss).
1 mM HEPES, 2 mM glutamine, 10 mM sodium pyruvate). Cells were Plasma cytokine analysis. EDTA plasma was thawed and diluted
counted on a Bio-Rad TC20 with trypan blue to assess viability pri- 1:2 prior to analysis. A total of 48 cytokines and chemokines were mea-
or to seeding in triplicate in a Seahorse XFe96 Cell Culture Micro- sured simultaneously for each participant’s plasma sample using the
plate treated with Cell-Tak (22.4 mg/mL) (Corning, Thermo Fisher Bio-Plex Pro Human Cytokine Screening Panel, 48-plex (Bio-Rad).
Scientific). The plate was spun at 300 ×g for 1 minute with no brake Samples were run in duplicate on a MAGPIX Multiplexing System
to adhere cells. Assays were run using a Seahorse Mito Stress Kit, a (Luminex) at the Human Nutritional Chemistry Service Laboratory at
Seahorse Glycolytic Rate Assay, or a Mito Stress Kit, with an added Cornell University. The kit is designed to measure the following — IL-1
final injection of 2DG with 5 measurements. Drugs were injected at superfamily: IL-1α, IL-1β, IL-1Rα; IL-2, IL-2Rα, IL-3, IL-4, IL-5, IL-7,
the following final concentrations: 1 μM oligomycin, 1 μM FCCP, 0.5 IL-9, IL-13, IL-15, IL-18; IL-6 family: IL-6, leukemia-inhibitory fac-
μM rotenone/antimycin A, and 50 mM 2DG. For activation assays, tor (LIF); IL-12 family: IL-12p40, IL-12p70; IL-10; IL-17; IFN family:
cells were cultured in complete RPMI overnight prior to the assay, with IFN-α2, IFN-γ; TNF: TNF-α, TNF-β, TNF-related, apoptosis-inducing
addition of STEMCELL Technologies’ stimulating reagents Immuno- ligand (TRAIL); GM-CSF; CC chemokines: monocyte chemoattrac-
Cult (25 μL/mL) (anti-CD3 and anti-CD28) and IL-2 (80 U/mL). tant protein 1 (MCP-1, also known as CCL2), macrophage inflamma-
Seahorse data were first normalized on the basis of cell-seeding tory protein 1-α/β (MIP-1α, also known as CCL3), MIP-1β (also known
density per 100,000 viable cells using Wave Software. Data were as CCL4), regulated upon activation, normal T cell expressed, and
further analyzed in RStudio. All Seahorse variables were calculated secreted RANTES (CCL5), monocyte chemotactic protein 3 (MCP-3,
according to Agilent Seahorse report generator manuals. Glycolytic also known as CCL7), eotaxin (CCL11), cutaneous T cell–attracting
capacity, determined for our activated cell assays, was determined to chemokine (CTACK, also known as CCL27); CXC chemokines:
be the maximum glycolytic proton efflux rate after injection of oligo- growth-regulated protein α GROα (CXCL1), IL-8 (CXCL8), monokine
mycin. For glycolysis data, the glycolysis-specific proton efflux rate was induced by IFN-γ (MIG, also known as CXCL9), IP-10 (CXCL10),
calculated as described by Agilent Technologies (70). Data were only stromal cell–derived factor 1-α (SDF-1, also known as CXCL12); PDGF
retained if at least 2 replicates gave quality data for a given variable. family/VEGF subfamily: PDGFBB, VEGFA; and macrophage migra-
Basal respiration and maximal respiration were required to be positive tion inhibitory factor (MIF), lymphocyte chemoattractant factor IL-16
(above nonmitochondrial respiration levels), whereas ATP production (LCF), stem cell growth factor β (SCGF-β), FGF basic (FGFb), β nerve
could not be greater than total basal respiration. Basal glycolysis was growth factor (βNGF), HGF, stem cell factor (SCF), macrophage-CSF
required to be higher than post-2DG acidification. Seahorse variable (M-CSF), and granulocyte-CSF (G-CSF). Concentrations were cal-
measurements are thus an average of 2–3 technical replicates. culated using xPONENT 4.2 software for MAGPIX (Luminex). A
Flow cytometry. Flow cytometric analysis was performed on a BD 5-parameter logistic regression model (5PL) with weighting was used
FACS Aria II in 5-mL round-bottom polystyrene tubes or on a Thermo to create standard curves derived from the known reference concen-
Fisher Attune NxT Analyzer with a 96-well, deep-well, round-bottom trations supplied by the manufacturer and to calculate final concen-
plate at the Cornell Biotechnology Resource Center. Each cell type was trations (expressed in pg/mL) by interpolation. This method gives the
stained with a specific cocktail of antibodies at rest and following stim- greatest dynamic range for each standard curve (71). For statistical
ulation (Supplemental Table 3). Cells were stimulated as described comparisons, samples with concentrations below the limit of detec-
above. All cells were thawed and cultured overnight in complete tion (LOD) were assigned the value corresponding to the midpoint
RPMI 1640 prior to staining. Flow cytometric analysis was conducted between zero and the LOD for that analyte.
immediately following the staining protocol. Data analysis was con- Statistics. Statistical analysis was conducted in RStudio and Micro-
ducted using Kaluza Software (Beckman Coulter). CD8+ T cells were soft Excel. For survey data, pairwise statistical testing was done using
first gated as viable, and then CD3+CD8+ cells were gated for further a Wilcoxon rank-sum test, whereas dichotomous response questions
jci.org Volume 130 Number 3 March 2020 1503You can also read