Label-free digital holo-tomographic microscopy reveals virus-induced cytopathic effects in live cells - bioRxiv
←
→
Page content transcription
If your browser does not render page correctly, please read the page content below
bioRxiv preprint first posted online Aug. 27, 2018; doi: http://dx.doi.org/10.1101/401075. The copyright holder for this preprint
   (which was not peer-reviewed) is the author/funder, who has granted bioRxiv a license to display the preprint in perpetuity.
                                      All rights reserved. No reuse allowed without permission.

Label-free digital holo-tomographic microscopy
   reveals virus-induced cytopathic effects
                   in live cells
                    Artur Yakimovich1,b , Robert Witte1,a , Vardan Andriasyana , Fanny Georgia , and Urs F. Grebera,

                                                              1
                                                                These authors contributed equally to this work
                            a
                                Department of Molecular Life Sciences, University of Zurich, Winterthurerstrasse 190, 8057 Zurich, Switzerland
                                 b
                                   MRC Laboratory for Molecular Cell Biology, University College London, Gower St, London WC1E 6BT, UK

Cytopathic effects (CPEs) are a hallmark of infections. CPEs                             tion. For example, distinct levels of CPE correlate with the
can be observed by phase contrast or fluorescence light mi-                              amounts of newly synthesized virus particles (6). In case of
croscopy, albeit at the cost of phototoxicity. We report that                            adenovirus infected cells may lyse and release large amounts
digital holo-tomographic microscopy (DHTM) reveals distinct                              of viral particles following strong CPE cells, while persis-
patterns of virus infections in live cells with minimal perturba-                        tently infected cells produce low amounts of progeny over
tion. DHTM is label-free, and records the phase shift of low
                                                                                         long terms and have weak CPEs (7, 8). Yet, the extent of
energy light passing through the specimen on a transparent sur-
face. DHTM infers a 3-dimensional (3D) tomogram based on
                                                                                         CPE not always correlates with virion production, as cells
the refractive index (RI). By measuring RI and computing the                             undergoing programmed cell death feature strong CPE at low
refractive index gradient (RIG) values DHTM unveils on op-                               viral titers (9–11). As viruses hijack cellular resources, CPEs
tical heterogeneity in cells upon virus infection. We find that                          elicited by virus infection may have distinct features, such as
vaccinia virus (VACV), herpes simplex virus (HSV) and rhi-                               loss of membrane integrity, cell shrinkage, increased chro-
novirus (RV) infections progressively and distinctly increased                           matin density, cell detachment from the substratum, forma-
RIG. VACV, but not HSV and RV infection induced oscilla-                                 tion of syncytia, loss or enforcement of the cytoskeleton, and
tions of cell volume, while all three viruses altered cytoplasmic                        reorganization of intracellular membranes (1, 12, 13). De-
membrane dynamics, and induced apoptotic features akin to the                            spite the predictive nature of CPE for clinical and biological
chemical compound staurosporin, but with virus-specific signa-                           infections, time-resolved 3D analyses of virus-induced CPE
tures. In sum, we introduce DHTM for quantitative label-free
                                                                                         are missing.
microscopy in infection research, and uncover virus-type spe-
cific changes and CPE in living cells at minimal interference.                           Here we describe a new approach using 3D digital holo-
                                                                                         tomographic microscopy (DHTM) to study of the CPEs in-
Live cell Imaging | Virus Infection | Holography | Label-free microscopy                 duced by three different viruses: vaccina virus (VACV), a
Correspondence: urs.greber@imls.uzh.ch                                                   large DNA virus replicating in the cytoplasm, herpes sim-
                                                                                         plex virus type 1 (HSV-1), a large DNA virus replicating in
                                                                                         the nucleus, and rhinovirus (RV), a small RNA virus repli-
Introduction
                                                                                         cating on cytoplasmic membranes. Classical video-enhanced
Viruses have a dual nature, the particle and the infected cell.                          contrast optical microscopy, such as interference microscopy
At the onset of an infection the particle introduces proteins,                           and bright-field microscopy are limited by uneven image
DNA or RNA, and sometimes lipids into the host cell. The in-                             field intensity, lack of tomographic information and a focus-
fected cell either produces viral components that are encoded                            dependent size inflation of structures due to diffraction limi-
in the viral genome, or raises an immune reaction against the                            tation (14). In contrast, DHTM allows prolonged quantitative
virus, and silences the infection. In the former case, the in-                           time-resolved 3D image acquisition using an ultra-low pow-
fected cell develops a cytopathic effect (CPE). CPEs are diag-                           ered laser (520 nm class 1 with 0.2 mW/mm2 ) without recog-
nostic hallmarks of a particular virus, and well known to oc-                            nizable phototoxicity at high temporal and spatial resolution
cur in cell cultures (for reviews, see (1, 2)). CPE can predict                          (15).
clinical outcomes in vivo. Examples include exacerbation of
steatosis by hepatitis C virus, apoptosis in trigeminal ganglia
by herpes simplex virus (HSV), or aseptic meningitis, paraly-                            Results
sis, cardiomyelitis, and herpangina by enteroviruses, includ-                            We infected HeLa cells with the VACV strain Western
ing poliovirus, coxsackievirus and enterovirus (EV) type 71                              Reserve harboring an early/late GFP expressed transgene
(3–5). While virus-induced CPE and cell death are exac-                                  (VACV_WR E/L-GFP, in the following referred to as VACV-
erbated by cytokine responses, cytotoxic T cells or natural                              GFP) at a multiplicity of infection (MOI) of 2, fixed the cells
killer (NK) cells, virus-induced CPE of cultured cells appar-                            8 h post infection (pi) with para-formaldehyde, and recorded
ently proceeds in a cell-autonomous manner.                                              the refractive index (RI), nuclear DAPI stain and GFP inten-
The nature and the extent of CPE depend on the virus, the cell                           sity by correlative DHTM and fluorescence microscopy and
type, the host innate response, and the progression of infec-                            compared to non-infected cells. At 8 h pi, all cells inoculated

                                                                                                     Yakimovich & Witte et al.   |   bioRχiv   |   August 29, 2018   |   1–13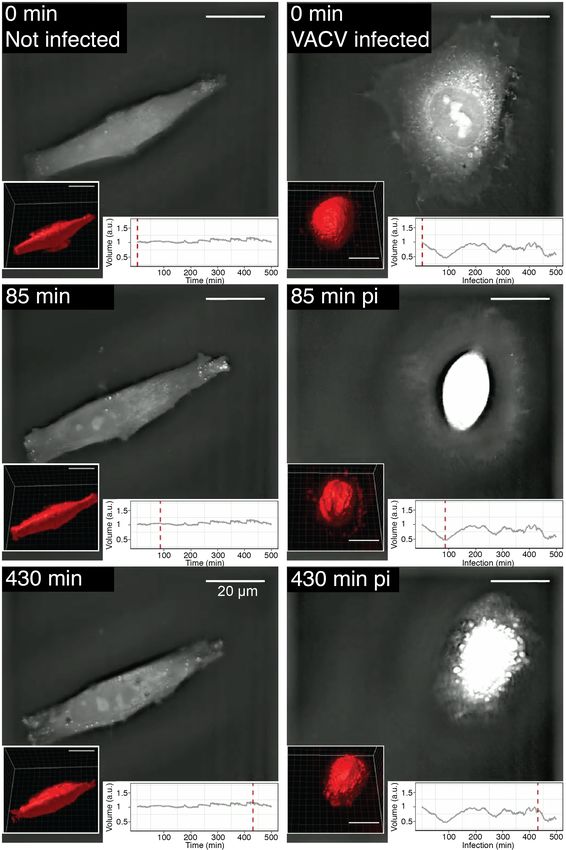
bioRxiv preprint first posted online Aug. 27, 2018; doi: http://dx.doi.org/10.1101/401075. The copyright holder for this preprint
 (which was not peer-reviewed) is the author/funder, who has granted bioRxiv a license to display the preprint in perpetuity.
                                    All rights reserved. No reuse allowed without permission.

with VACV-GFP were infected based on their GFP inten-
sity and DAPI staining of cell nuclei, whereas the uninfected
cells’ GFP intensity was in the range of the background (Fig.
1A). Based on the RI change across a volume, the RI gradient
(RIG) can be computed across the whole cell, similar to the
RIG across an index gradient lens (for a simplistic illustra-
tion, see Fig. 1B, C).
We next imaged VACV-GFP infected and uninfected cells in
live cell mode by DHTM at early to late stages of VACV
infection in 2 h intervals up to 8 h pi (Fig. 2A). A progres-
sive and prominent change in RI was observed in the infected
cells, visualized in scaled pseudo-color. In contrast, the un-
infected cells as well as the VACV-GFP infected cells treated
with the deoxy-nucleoside analogue cytarabine (AraC), an in-
hibitor of VACV late gene expression (16, 17), showed less
prominent RI changes, although AraC-treated cells inocu-
lated with VACV-GFP exhibited a strong increase in RI in
the cell nucleus. We quantified the RI change by deriving
the RIG values across the entire cells (Fig. 2B). The RIG
values of the VACV-GFP-infected cells gradually increased
over the progression of the infection, reaching 3-fold at 8 h
pi compared to the RIG before infection. In contrast, the RIG
values of uninfected cells remained largely constant over 8
h. The AraC-treated cells showed only a small RIG increase
of about 1.3-fold, suggesting that RIG increase is predom-
inantly due to viral late gene expression. VACV infections
exhibit membrane blebbing phenotypes at early and late time
points, as well as focal bud-like swellings (18). Such fea-
tures are diagnostic of a contractile cell cortex, as described
in uninfected cells in cell migration and response to mechan-
ical cues (19). We noticed an increased fraction of blebbing
cells over 2-8 h pi in presence of AraC (Fig. 2C). This is
distinct from membrane blebbing during entry (20), and sug-
gests that blebbing at late infection stages does not require
viral late gene expression, and does not affect the RIG.
To test if similar morphology changes of the VACV-GFP
infected cells can be observed with an alternative imaging
modality, we infected HeLa cells with VACV-GFP at MOI
2, and imaged cells in live phase-contrast and fluorescence
modes at 5 min intervals for 8 h (Fig. 3, Video1.mp4) in
a high-throughput light microscope. In agreement with the                  Fig. 1. Correlative digital holo-tomographic microscopy and light microscopy
DHTM imaging results, the VACV-GFP infected cells ex-                      of fixed and permeabilized cells. (A) Representative images of HeLa-ATCC cells
pressed the GFP transgene at increasing intensity over the                 incubated with 2 ml RPMI at 37◦ C for 8 h, fixed in 4% PFA in PBS, and imaged
                                                                           with a DHTM microscope and an attached epifluorescence module. Cells were
course of infection. As observed in the DHTM experiments,                  either infected with VACV expressing GFP under control of early/late promoters
we observed host cell rounding, contractions and late stage                (VACV_E/L-GFP; top and middle panel) at MOI 2, or remained uninfected (bottom
blebbing of the infected cells, while the features of the unin-            panel). Top panel depicts a VACV-GFP-infected cell in early infection stage. Middle
                                                                           panel depicts rounding cell, indicating late stage VACV infection. Bottom panel
fected cells remained largely invariant.                                   depicts an uninfected cell. RI is displayed in grey, GFP in green, nuclei stained with
We next investigated the dynamic properties of the VACV-                   DAPI appear in blue. Scale bar indicates 20 µ m. (B) Schematic illustrations of RI
GFP-infected cells by using the holographic information, in-               computation. A cell can be thought of as a gradient index microlens, changing its
                                                                           optical properties depending on biochemical activities. (C) RIG is derived from RI
cluding cell volume. We reasoned that a change in cell vol-                and represents a voxel-based measurement of the difference of the refractive index
ume might result in changes of the density of the cytoplasm,               in 3D space. The RIG value of the voxel in the middle is represented as a middle
and hence affect the refractive properties of the cell. The                blue box, which is calculated based on the difference to the light-blue blue voxels
                                                                           in the 3D neighborhood. Note that the reference beam (curved green dashed line)
accuracy of volumetric measurements based on DHTM was                      does not pass through the sample. RI is based on changes between the beam
first assessed with polystyrene beads of different nominal                 (straight green dashed line) and the reference beam.
sizes ranging from 0.5 to 4 µ m (Sup. Fig. 1A). Bead size was
determined by two different analysis methods, a pixel-based
method using the vendor’s software, STEVE, and an

2   |   bioRχiv                                                              Yakimovich & Witte et al.   |   Label-free DHTM of virus-induced CPE in live cells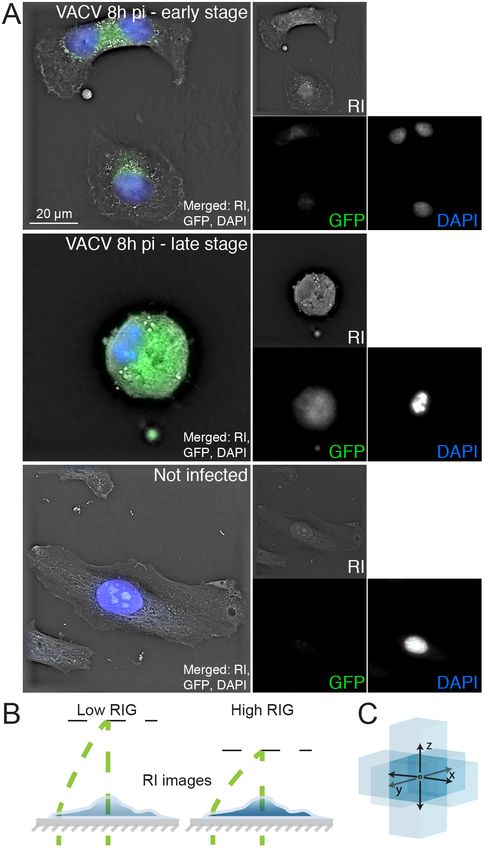
bioRxiv preprint first posted online Aug. 27, 2018; doi: http://dx.doi.org/10.1101/401075. The copyright holder for this preprint
   (which was not peer-reviewed) is the author/funder, who has granted bioRxiv a license to display the preprint in perpetuity.
                                      All rights reserved. No reuse allowed without permission.

Fig. 2. VACV late gene expression increases the cellular RIG. (A) Representative images of HeLa-ATCC cells incubated with 2 ml RPMI at 37◦ C for 8 h, and imaged
at 2 h intervals by DHTM. Cells were uninfected, infected with VACV-GFP at MOI 2, or infected with VACV-GFP at MOI 2 in presence of 10 µ M AraC. Cell perimeters on
the coverslip are outlined with white dashed lines. RIs are depicted as intensities values in a “thermal” lookup table. Images were obtained as holograms and depicted as
projections of maxima along the z-axis of the 3D stacks. Scale bar indicates 20 µ m. (B) Cell RIG quantification of (A). RIG values were normalized to 1 for 0 h pi. Bars
depict mean values ± SEM of at least 10 cells for each condition and time point. (C) Comparison of the frequency of “blebbing” phenotype in VACV-GFP infected cells
and VACV-GFP-infected cells in RPMI containing 10 µ M AraC. Data from at least 10 cells per time point and condition were acquired and manually scored as blebbing or
non-blebbing.

Yakimovich & Witte et al.   |   Label-free DHTM of virus-induced CPE in live cells                                                                        bioRχiv   |   3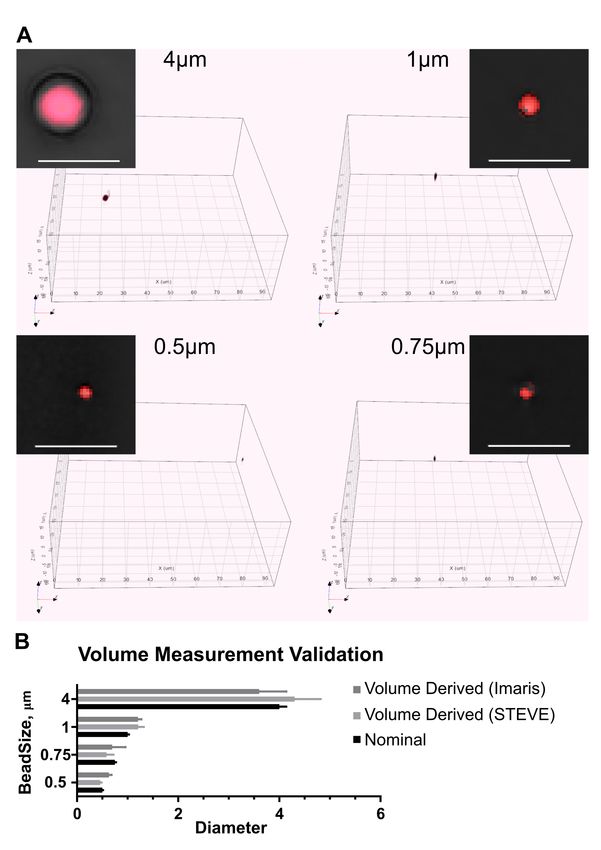
bioRxiv preprint first posted online Aug. 27, 2018; doi: http://dx.doi.org/10.1101/401075. The copyright holder for this preprint
 (which was not peer-reviewed) is the author/funder, who has granted bioRxiv a license to display the preprint in perpetuity.
                                    All rights reserved. No reuse allowed without permission.

object-based 3D-surface segmentation method using Imaris
(Sup. Fig. 1B). Both procedures yielded similar results, al-
though the object-based method were slightly more accurate.
To measure cell volume by DHTM, we used the image stack
segmentation procedure in Imaris. Time-resolved 3D live cell
DHTM imaging of infected and uninfected cells between 0
and 8 h pi indicated that the VACV-GFP infected cells under-
went a series of shrinkage and dilation phases, while the vol-
ume of the uninfected cells remained largely constant (Fig. 4,
Video2.mp4, Video3.mp4). The first shrinkage phase peaked
at about 100 min pi and reduced the cell volume by about
50% . This contraction was followed by a steady recovery
phase restoring the original volume at about 180 min pi. The
onset of the next shrinkage period was at 230 min, and lasted
about 40 min, followed by a short recovery phase of about 30
min, and a period of stable volume with minor fluctuations
until 440 min pi, when another shrinkage period occurred.
We did not detect a correlation between cell shrinkage or ex-
pansion with the RIG values, the latter steadily increasing
over the course of infection. We conclude that the VACV-
GFP infection-induced RIG increase is not caused by generic
changes of the cell volume. To further explore the correla-
tions of RIG and virus-induced CPE, we recorded RIG in
cells infected with HSV-1-GFP harboring a GFP transgene
under the constitutively active CMV promoter, and RV-A1a
at 0, 8, 10, 12, 14 and 16 h pi (Fig. 5A). In HSV-1-GFP-
infected cells, CPE was observed from 8 to 10 h pi on, fol-
lowed by cell surface roughening at 16 h pi. Remarkably,
RIG did not increase despite of the onset of CPE prior to 16
h pi (Fig. 5B). Cells infected with RV-A1a showed strong
CPE starting from 10 and 12 h pi, involving the condensa-
tion of cytoplasm. The RIG of RV-A1a infected cells steadily
increased at 10 to 16 h pi up to about 2.5-fold of the RIG
of the uninfected controls. This correlated with the induc-
tion of apoptosis, virus-controlled necroptosis, and the loss
of cytoskeletal elements, such as F-actin, as observed in pi-
cornavirus infections (21–23). Remarkably, RV-A1a-infected
cells adopted a transient branched shape at 12 to 14 h pi, be-
fore rounding up at 16 h pi (Fig. 5A).
Two distinct inhibitors of RV replication were employed to
test if the RIG increase was directly associated with RV-A1a
replication. The first inhibitor, PIK-93, blocks phosphatidyl-             Fig. 3. Cell morphology and VACV-GFP transgene expression visualized by
                                                                           automated and correlative phase-contrast and fluorescence live time-lapse
inositol-4-kinase class 3beta (PI4K3b) activity, and thereby
                                                                           microscopy. HeLa-ATCC cells were uninfected (left panel) or infected (right panel)
precludes the lipid remodeling by counter-current lipid fluxes             with VACV-GFP using the cold binding protocol (30 min inoculation on ice, wash
for virus replication (24). In absence of PI4K3b activity, vi-             and transfer to 37◦ C). Cells were imaged with a high-throughput wide-field micro-
                                                                           scope every 5 min for 8 h. Cells were visualized with transmission light, the GFP
ral replication is suppressed, because the altered lipid com-
                                                                           fluorescence was intensity color-coded (color bar ranging from transparent through
position of the replication membrane can no longer support                 blue to white). Scale bars indicate 50 µ m. See also Video1.mp4
viral host proteins necessary for virus replication (reviewed
in (25)). The second inhibitor, MLN9708, is a second gen-
eration inhibitor of the proteasome, which is required for en-
terovirus replication (26–28). Both PIK-93 and MLN9807
blocked the appearance of high RI/RIG structures, although
the effect of PIK-93 was incomplete (Fig. 6). The partial
effect of PIK-93 on RIG was, however, consistent with the
partial reduction of PI4P levels and the incomplete inhibition
of RV-A1a replication (24, 29). These results support the no-
tion that an increase of RIG in virus-infected host cells occurs

4   |   bioRχiv                                                              Yakimovich & Witte et al.   |   Label-free DHTM of virus-induced CPE in live cells
bioRxiv preprint first posted online Aug. 27, 2018; doi: http://dx.doi.org/10.1101/401075. The copyright holder for this preprint
(which was not peer-reviewed) is the author/funder, who has granted bioRxiv a license to display the preprint in perpetuity.
All rights reserved. No reuse allowed without permission.
and diffraction phase microscopy (37), because of its high
sensitivity, accuracy and non-invasiveness (15). The system
produces quantitative 3D information at high spatial and tem-
poral resolution. It readily measures the volume of cells and
subcellular structures. Furthermore, it can be used to acquire
two new dimensions of cell data, RI and RIG, which can-
not be readily assessed by other imaging modalities. The
methodology is robust, and overcomes a series of technical
limitations in live cell pathogen imaging, including the label-
ing of cellular and viral entities by chemical or genetically-
encoded fluorophores, and toxicity ensuing imaging (for re-
cent reviews, see (38, 39)). The non-invasiveness and low
laser power required for DHTM underscore the suitability of
DHTM for long-term live imaging.
Here, we introduce DHTM to virus research by employ-
ing three different viruses, VACV of the poxviridae, HSV-
1 of the herpesviridae and RV from the picornaviruses.
VACV is an enveloped, double-stranded DNA virus, repli-
cating and assembling particles in the cytoplasm (40). It
is used to immunize and protect humans against small pox
caused by variola virus, one of the deadliest viruses to man
(41, 42). VACV exploits apoptotic mimicry to enter host
cells through cellular blebbing, that is, protrusions of the
cell membrane, implicated in cytokinesis and cell motility
(20, 43, 44). VACV-induced morphological changes of host
cells include cell rounding, blebbing and bud-like swellings
(18). Picornaviruses are small, positive-sense single-stranded
RNA viruses with a non-enveloped icosahedral capsid of 28-
30 nm in diameter (45). RVs replicate in the cytoplasm on
Golgi-derived membranes that are closely associated with the
ER, and elicit a strong CPE in tissue culture (21, 24, 25).
Fig. 4. Cell morphology and volume dynamics of VACV-GFP-infected cells, HSV-1 is an enveloped, double-stranded DNA virus, well
visualized by label-free time-lapse DHTM. HeLa-ATCC cells were infected by
adapted to human hosts and controlled by innate immunity
VACV-GFP following the cold binding protocol. Cell holograms were acquired every
minute for 8 h, RI shown as greyscale images. Volume measurement was per- including the interferon induced human myxovirus resistance
formed using Imaris software by surfaced fitting and 3D rendering (see the lower protein B (MxB) (46). If HSV-1 breaks through the in-
left corner of each frame). Plots show the relative volume normalized to 0 min pi.
nate host defense, it replicates in the cell nucleus and sheds
The red dashed lines correspond to the time points related to the corresponding
hologram. Scale bars indicate 20 µ m. See also Video2.mp4, Video3.mp4. progeny prior to cell lysis (47, 48). In its latent state, HSV-1
evades the immune system, avoids CPE and downregulates
in a virus type-specific manner, and that RIG changes are a apoptosis (49, 50). Upon reactivation, HSV-1 is transmitted
reliable indicator of early and late CPE. The latter is often to the epidermal tissue where it causes lytic infection mani-
associated with virus-induced apoptosis, necrosis, or necrop- fested as epidermal blisters. We initially used DHTM to de-
tosis. We therefore tested if the apoptosis-inducing agent termine the volume of cells, and became aware of periodic
staurosporine (30) also induced a RIG response. DHTM to- shrinkage and expansion of VACV-infected cells, as well as
mography of 10 µ M staurosporine-treated cells (Fig. 7A) membrane blebbing at late stages of VACV but not in RV-A1a
confirmed that staurosporine induces an apoptotic phenotype infections. Cell volume dysregulation is known to contribute
as early as 1 h post treatment. Image quantifications in- to disorders, such as liver insufficiency, diabetic ketoacidosis,
dicated that RIG increased up to 4 h post application, and hypercatabolism, fibrosing disease, and sickle cell anemia, its
slightly decreased at 5 h (Fig. 7B). The extent of the RIG regulation affects cell proliferation, and apoptosis (51).
increase reached similar levels as upon RV-A1a infection,
thereby confirming that apoptotic phenotypes are tractable by
DHTM.
Discussion
DHTM is a noninvasive label-free light microscopy technol-
ogy. It measures the RI of a transparent object by an inter-
ference procedure (31–36). DHTM is superior to classical
optical techniques, such as tomographic phase microscopy
Yakimovich & Witte et al. | Label-free DHTM of virus-induced CPE in live cells bioRχiv | 5bioRxiv preprint first posted online Aug. 27, 2018; doi: http://dx.doi.org/10.1101/401075. The copyright holder for this preprint
(which was not peer-reviewed) is the author/funder, who has granted bioRxiv a license to display the preprint in perpetuity.
All rights reserved. No reuse allowed without permission.
Fig. 5. HSV-1 and RV increase cellular RIG late in infection. (A) Representative images of uninfected, HSV-1-GFP (MOI 10) infected HeLa-ATCC cells or RV-A1a (MOI
50) infected HeLa Ohio cells, imaged by a DHTM microscope at indicated time points. Cell perimeters on the coverslip are outlined with white dashed lines, and the refractive
indices are depicted as intensities in a “thermal” lookup table. Images were obtained as holograms, and the 3D stacks depicted as z-projections of maxima. Scale bars
indicate 20 µ m. (B) Normalized cell RIG of the data shown in (A). Bars depict mean values ± SEM of at least 10 cells for each condition and time point.
6 | bioRχiv Yakimovich & Witte et al. | Label-free DHTM of virus-induced CPE in live cellsbioRxiv preprint first posted online Aug. 27, 2018; doi: http://dx.doi.org/10.1101/401075. The copyright holder for this preprint
(which was not peer-reviewed) is the author/funder, who has granted bioRxiv a license to display the preprint in perpetuity.
All rights reserved. No reuse allowed without permission.
VACV infection-induced cell volume oscillation implies that
VACV regulates membrane trafficking, such as endocytosis
and secretion, and possibly also ion channels. For exam-
ple, the release of potassium, chloride and bicarbonate ions
is known to trigger cell shrinkage, or the accumulation of
sodium, potassium and chloride ions cell swelling through
the activation of cotransporters, exchangers or channel pro-
teins (51). In addition, shrinkage and swelling processes in-
volve organic osmolytes, such as sorbitol and glycerophos-
phorylcholine, which accumulate in shrinking cells and are
released in swelling cells. How exactly VACV controls these
processes to produce progeny remains an open question.
In addition to the accurate, noninvasive readout of cell vol-
ume, the RIGs measured by DHTM have served as an indi-
cator for the granularity of cell structures (52). We show that
specific RIG signatures indicate virus-induced CPEs. CPE
follows cell shrinkage and blebbing, and terminates by cell
death (13, 53). In fact, viruses control cell death processes,
including apoptosis or necroptosis, for example by diverting
upstream regulating kinases, such as RIPK1 in RV-infected
cells (2, 21). Other viruses prevent infection-induced apop-
tosis at early stages, gaining crucial time for production of
virus progeny (50, 54–56). At late infection stages, viruses
gain virulence by enhancing progeny virus release from the
cells (56–58). This leads to the notion that lytic infection
resembles a necrosis-like program, leading to the release of
both cellular contents and virus particles (7, 59).
CPE are elicited not only by wide range of pathogens, in-
cluding viruses and bacteria, but also emerge in malignant
cells during transformation, and in immune defense by cyto-
toxic cells for instance (6). Despite such insights, the CPE
has remained one of the least understood processes in in-
fection biology and pathology. This is in part a plethora of
virus-induced cell reactions tune the infection, including pro-
and anti-viral signaling and innate immunity response. CPE
arises because of the many altered processes in an infected
cell. It is triggered by a handful of viral genes introduced
into a naïve cell, and comprises pro- and anti-viral compo-
nents. Our results show that all tested viruses VACV, HSV-1
and RV-A1a induced RIG increase over the course of infec-
tion, with virus-specific kinetics, extent and signature. Im-
portantly, the RIG measurements scored CPE independent of
cell contractions and blebbing, which can not be uncoupled
in phase contrast microscopy. This indicates that RIG truly
measures new dimensions in CPE that have not been accessi-
ble with conventional microscopy analyses. It underlines the
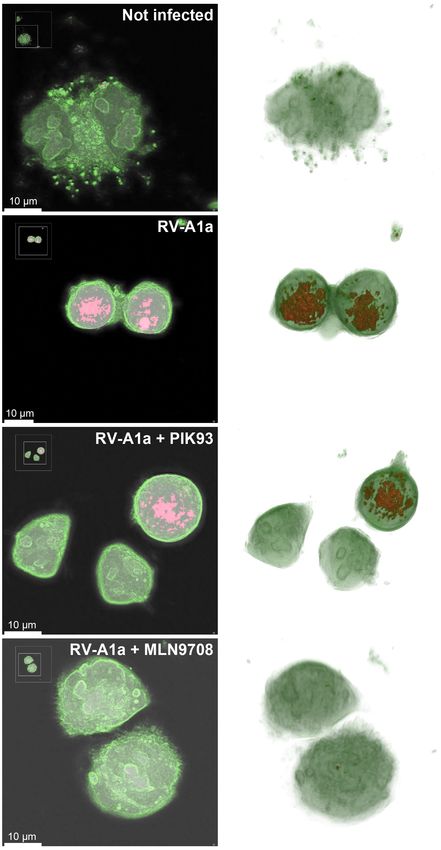
Fig. 6. Drug treatment inhibits changes in RIs of RV-A1a-infected cells. Rep-
superiority of DHTM over phase contrast microscopy, and resentative images of mock infected (top panel), or RV-A1a-infected (MOI 50) HeLa
allows the attribution of virus-specific processes to CPE. In Ohio cells (lower three panels). Cells were treated with either PIK93 (5 µ M), or
MLN9708 (10 µ M), and imaged by DHTM for 8 h at 1 min intervals. Cell mem-
case of VACV infection the RIG increase appeared to require
branes are labelled in green, high RI and RIG regions in red. The left row depicts
late viral gene expression, since RIG changes were impaired central z-slices of reconstructed holograms, and the right row 3D reconstructions of
by AraC, which inhibits late but not intermediate or early the holograms. See also Videos4-7.mp4. Scale bars as indicated.
genes. For RV, we infer that at the onset of RIG increase at
8 h pi not only cytoplasmic membranes are being rearranged
and expanded for viral replication, but also phase separation
processes occur in the perinuclear area, a hallmark of RV-
infected cells. With HSV-1, RIG increase was most dramatic
at 16 h pi, with large changes in the nucleus and the cyto-
Yakimovich & Witte et al. | Label-free DHTM of virus-induced CPE in live cells bioRχiv | 7bioRxiv preprint first posted online Aug. 27, 2018; doi: http://dx.doi.org/10.1101/401075. The copyright holder for this preprint
(which was not peer-reviewed) is the author/funder, who has granted bioRxiv a license to display the preprint in perpetuity.
All rights reserved. No reuse allowed without permission.
Materials and Methods
Cell lines and viruses. HeLa-ATCC from the American Type
Culture Collection (ATCC) were maintained in Dulbecco
Modified Eagle Medium (DMEM; GIBCO-BRL) contain-
ing 10% fetal calf serum (FCS), non-essential amino acids
(NEAA), and penicillin-streptomycin (GIBCO-BRL) at 37◦
C and 5% CO2 . All cell cultures were maintained in a
cell bank system and kept in low passages for all experi-
ments. Vaccinia virus strain International Health Department
J (VACV-IHD-J) containing early / late (E/L) GFP transgene
was kindly provided by J. Mercer (University College Lon-
don, UK) (17, 62). To obtain the purified mature virions
(MVs) cytoplasmic lysates were pelleted through a 36% su-
crose cushion for 90 min with Optima XPN-100 ultracen-
trifuge (Beckmann Coulter) SW32Ti rotor at 18,000 rpm.
The viral pellet was suspended in 10 mM Tris pH 9.0, and
virus separated from contaminating material on a 25 to 40%
sucrose gradient at 14,000 rpm for 45 min. Following cen-
trifugation, the viral band was collected by aspiration and
concentrated by pelleting at 14,000 rpm for 45 min. MVs
were suspended in 1 mM Tris-HCl pH 9.0 and titered for
plaque forming units (PFU) per ml as previously described
(63). The above method revealed an infectious particle to
PFU ratio of VACV-WR and VACV-IHD-J virus on monkey
kidney BSC40 cells in the range of 50:1 and 80:1, respec-
tively. RVs were grown in HeLa cells as described (64, 65).
Fig. 7. Staurosporine-induced apoptosis rapidly increases the cellular RIG. Cells were inoculated with a lysate from infected cells at
(A) Representative DHTM images of HeLa-Ohio cells incubated with staurosporine
(10 µ M) at 37◦ C for 5 h. Cell perimeters on the glass coverslip are outlined
33.5◦ C overnight. When CPE was visible in 80-90% of the
with white dashed lines, and RI depicted as intensities in “thermal” lookup table. cells, the media was removed and cells harvested by scraping
Images were obtained as holograms, and the 3D stacks depicted as z-projections and pelleting. Cells were lysed by three freeze/thaw cycles
of maxima. Scale bar indicate 20 µ m. (B) Cell RIG quantification of (A). RIG values
were normalized to 1 at 0 h post addition. Bars depict mean values ± SEM of at
in liquid nitrogen followed by addition of 1% NP40 and ho-
least 10 cells for each condition and time. mogenization with a Dounce homogenizer. The suspension
was centrifuged at 2,500 × g for 10 min and the supernatant
plasm, indicative of processes associated with virion produc- transferred into a new tube. Free RNA was digested by ad-
tion and release from the infected cell. dition of 150 µ g RNase per 10 ml and incubation at 37◦ C
In conclusion, we show that DHTM is suitable to analyze for 30 min. Virus was purified on a CsCl gradient and ex-
cell biological processes in virus-infected cells at high spatio- tensively dialyzed against 140 mM NaCl, 25 mM Hepes, 5
temporal resolution, without the need to introduce cell mark- mM MgCl2 . Aliquots were stored at -80◦ C. The HSV-1 re-
ers, or using high intensity laser light. DHTM convinces with combinant strain C12 expressing GFP from the major CMV
high spatial resolution with potential super-resolution options promoter was kindly provided by S. Efstathiou (University of
(32, 60). It enhances insights into CPE, a complex process Cambridge, Cambridge, UK), and used as described (46, 66).
induced by nearly all pathogens, and increasingly mined by
high-throughput screening assays (61). DHTM promotes the Cold-synchronized infections. Media and PBS were cooled
dynamic analyses of virus assembly, for example in phase to 4◦ C to prevent endocytosis. Cold virus inocu-
separated zones of the cytoplasm and the nucleus, and pro- lum in HEPES-buffered RPMI (Sigma), containing 10%
vides a deeper understanding of the nature of viruses. FCS, NEAA and penicillin-streptomycin (GIBCO-BRL) was
added to HeLa cells and incubated on ice for 30 min. Next,
ACKNOWLEDGEMENTS cells were washed three times with cold phosphate buffered
We thank all members of the Greber lab for discussions and comments through-
out the course of this work. We thank Nicole Meili and Melanie Grove for tissue saline (PBS) and overlaid with either 37◦ C warm carbon-
culture and general lab support. We acknowledge excellent technical support from ate buffered DMEM (GIBCO-BRL) containing 10% FCS,
Dr. Lisa Pollaro, Luca Clario and Dr. Sorin Pop (Nanolive SA, Ecublens, Switzer-
land). We thank the Center for Microscopy and Image Analysis at the University NEAA and penicillin-streptomycin or 37◦ C warm HEPES
of Zurich headed by Dr. Urs Ziegler for providing polystyrene beads. We thank buffered RPMI (Sigma) containing 10% FCS, non-essential
Dr. Jason Mercer (MRC LMCB, University College London, London, United King-
dom) for kindly providing Vaccinia virus IHD-J E/L-GFP. UFG acknowledges finan- amino acids and penicillin-streptomycin for automated mi-
cial support from the University of Zurich, the Swiss initiative in Systems Biology croscopy or tomographic holography respectively.
SystemsX.ch (VirX), and the Swiss National Science Foundation (grant numbers
310030B_160316 and 31003A_179256 / 1).
Automated time-lapse, multi-site, multi-channel microscopy.
Time-lapse multisite, multichannel microscopy on HeLa
cells grown in 96-well imaging plates (Greiner Bio-One)
8 | bioRχiv Yakimovich & Witte et al. | Label-free DHTM of virus-induced CPE in live cellsbioRxiv preprint first posted online Aug. 27, 2018; doi: http://dx.doi.org/10.1101/401075. The copyright holder for this preprint
(which was not peer-reviewed) is the author/funder, who has granted bioRxiv a license to display the preprint in perpetuity.
All rights reserved. No reuse allowed without permission.
was performed with an ImageXpress Micro Widefield High- 5. L Rubbia-Brandt, R Quadri, K Abid, E Giostra, P J Male, G Mentha, L Spahr, J P Zarski,
B Borisch, A Hadengue, and F Negro. Hepatocyte steatosis is a cytopathic effect of hepatitis
Content Analysis System (IXM-XL, Molecular Devices) mi- C virus genotype 3. J Hepatol, 33(1):106–115, 2000.
croscope with a synthetic air to CO2 mixture of 95% to 5% 6. N S Heaton. Revisiting the concept of a cytopathic viral infection. PLoS Pathog, 13(7):
, respectively, in a humidified environment at 37◦ C with a e1006409, 2017. doi: 10.1371/journal.ppat.1006409.
7. Artur Yakimovich, Heidi Gumpert, Christoph J Burckhardt, Verena A Lütschg, Andreas Ju-
20x objective. rgeit, Ivo F Sbalzarini, and Urs F Greber. Cell-free transmission of human adenovirus by
passive mass transfer in cell culture simulated in a computer model. Journal of virology, 86
(18):10123–37, sep 2012. ISSN 1098-5514. doi: 10.1128/JVI.01102-12.
Live label-free holographic tomography. Live holographic 8. Y Zheng, T Stamminger, and P Hearing. E2F/Rb Family Proteins Mediate Interferon In-
tomography was performed using a 3D Cell Explorer mi- duced Repression of Adenovirus Immediate Early Transcription to Promote Persistent Viral
Infection. PLoS Pathog, 12(1):e1005415, 2016. doi: 10.1371/journal.ppat.1005415.
croscope (Nanolive SA, Ecublens, Switzerland). Cells were 9. S K Chiou and E White. Inhibition of ICE-like proteases inhibits apoptosis and in-
grown and imaged using 35 mm Ibidi glass bottom µ -Dish creases virus production during adenovirus infection. Virology, 244(1):108–118, 1998. doi:
S0042-6822(98)99077-8[pii]10.1006/viro.1998.9077.
dishes (Ibidi GmbH, Germany). During imaging, temper- 10. C B Thompson. Apoptosis in the pathogenesis and treatment of disease. Science, 267
ature (37◦ C) and humidity was controlled using an Ibidi (5203):1456–1462, 1995.
11. Z Wang, X Xia, X Yang, X Zhang, Y Liu, D Wu, Y Fang, Y Liu, J Xu, Y Qiu, and X Zhou.
Heating & Incubation System (Ibidi GmbH, Germany), while A picorna-like virus suppresses the N-end rule pathway to inhibit apoptosis. Elife, 6, 2017.
the pH was maintained by using RPMI containing 20 mM doi: 10.7554/eLife.30590.
12. C Netherton, K Moffat, E Brooks, and T Wileman. A guide to viral inclusions, membrane
HEPES buffer. rearrangements, factories, and viroplasm produced during virus replication. Adv Virus Res,
70:101–182, 2007. doi: 10.1016/S0065-3527(07)70004-0.
13. H G Pereira. The cytopathic effect of animal viruses. Adv Virus Res, 8:245–285, 1961.
Cell tracking and volume measurement. To measure the cell
14. R D Allen. New observations on cell architecture and dynamics by video-enhanced contrast
volume, 3D stacks obtained by DHTM were digitally stained optical microscopy. Annu Rev Biophys Biophys Chem, 14:265–290, 1985. doi: 10.1146/
annurev.bb.14.060185.001405.
and voxel-segmented using STEVE (Nanolive SA, Ecublens, 15. Y Cotte, F Toy, P Jourdain, N Pavillon, D Boss, P Magistretti, P Marquet, and C Depeursinge.
Switzerland), exported as TIF-files and imported into Imaris Marker-free phase nanoscopy. Nat Photonics, 7:113–117, 2013. doi: doi:10.1038/nphoton.
2012.329.
(Bitplane AG, Switzerland). Next, a surface was fitted to the 16. F M Schabel Jr. The antiviral activity of 9-beta-D-arabinofuranosyladenine (ARA-A).
imported 3D voxels aimed at complete volume segmentation. Chemotherapia (Basel), 13(6):321–338, 1968.
17. A. Yakimovich, M. Huttunen, B. Zehnder, L.J. Coulter, V. Gould, C. Schneider, M. Kopf, C.J.
The fitted surface was tracked and enclosed features (volume, McInnes, U.F. Greber, and J. Mercer. Inhibition of poxvirus gene expression and genome
centroid position, centroid speed) were measured with Imaris replication by bisbenzimide derivatives. Journal of Virology, 91(18), 2017. ISSN 10985514.
doi: 10.1128/JVI.00838-17.
over the entire duration of the time-lapse experiment. Finally, 18. H Gamliel, A Polliack, and I Sarov. Surface features of vaccinia virus-infected human em-
the volume of each cell in a time-lapse series was normalized bryonic cells as studied by scanning electron microscopy. Virology, 83(1):195–203, 1977.
19. G T Charras, C K Hu, M Coughlin, and T J Mitchison. Reassembly of contractile actin cortex
to the cell volume at time zero. in cell blebs. J Cell Biol, 175(3):477–490, 2006. doi: 10.1083/jcb.200602085.
To benchmark the volume measurements from holographic 20. J Mercer and A Helenius. Vaccinia virus uses macropinocytosis and apoptotic mimicry to
enter host cells. Science, 320(5875):531–535, 2008.
tomography, we used polystyrene beads of 0.5, 0.75, 1 (Fluo- 21. M Lotzerich, P S Roulin, K Boucke, R Witte, O Georgiev, and U F Greber. Rhinovirus 3C
resbrite, Polysciences) and 4 µ m diameter (Tetraspeck, Ther- protease suppresses apoptosis and triggers caspase-independent cell death. Cell Death
Dis, 9(3):272, 2018. doi: 10.1038/s41419-018-0306-6.
moFisher). The beads were diluted in PBS, allowed to sedi- 22. J Seipelt, H D Liebig, W Sommergruber, C Gerner, and E Kuechler. 2A proteinase of human
ment to the bottom of the dish and imaged. We next quanti- rhinovirus cleaves cytokeratin 8 in infected HeLa cells. J Biol Chem, 275(26):20084–20089,
2000.
fied their volume either by voxel-segmentation and counting 23. K Sobo, A D Stuart, L Rubbia-Brandt, T D Brown, and T A McKee. Echovirus 11 infection
in STEVE or by surface fitting in Imaris (Sup. Fig. 1). induces dramatic changes in the actin cytoskeleton of polarized Caco-2 cells. J Gen Virol,
93(Pt 3):475–487, 2012. doi: 10.1099/vir.0.037697-0.
24. P S Roulin, M Lotzerich, F Torta, L B Tanner, F J van Kuppeveld, M R Wenk, and U F
Cell refractive index gradient measurement. RI of a material Greber. Rhinovirus Uses a Phosphatidylinositol 4-Phosphate/Cholesterol Counter-Current
is defined as speed of light in vacuum divided by the speed for the Formation of Replication Compartments at the ER-Golgi Interface. Cell Host Microbe,
16(5):677–690, 2014. doi: 10.1016/j.chom.2014.10.003.
of light in the particular material. RIG is a computed value 25. G A Belov. Dynamic lipid landscape of picornavirus replication organelles. Curr Opin Virol,
describing RI change within a neighborhood of a particular 19:1–6, 2016. doi: 10.1016/j.coviro.2016.05.003.
26. G Gao, J Zhang, X Si, J Wong, C Cheung, B McManus, and H Luo. Proteasome inhibition
voxel according to the Eq. 1. attenuates coxsackievirus-induced myocardial damage in mice. Am J Physiol Heart Circ
Measurement of the relative RIG of the cells was performed Physiol, 295(1):H401–8, 2008. doi: 10.1152/ajpheart.00292.2008.
27. E Kupperman, E C Lee, Y Cao, B Bannerman, M Fitzgerald, A Berger, J Yu, Y Yang,
by ‘digital staining’ in STEVE according to the user manual. P Hales, F Bruzzese, J Liu, J Blank, K Garcia, C Tsu, L Dick, P Fleming, L Yu, M Man-
The staining was aimed at segmenting at least 95% of the fredi, M Rolfe, and J Bolen. Evaluation of the proteasome inhibitor MLN9708 in preclinical
models of human cancer. Cancer Res, 70(5):1970–1980, 2010. doi: 10.1158/0008-5472.
manually determined cellular signal; next, the mean RIG of CAN-09-2766.
the digital staining was calculated. Boundaries were adjusted 28. X Si, B M McManus, J Zhang, J Yuan, C Cheung, M Esfandiarei, A Suarez, A Morgan, and
H Luo. Pyrrolidine dithiocarbamate reduces coxsackievirus B3 replication through inhibition
by shifting the RI outside of the 95% constraint. Finally RIG of the ubiquitin-proteasome pathway. J Virol, 79(13):8014–8023, 2005. doi: 10.1128/JVI.
of each cell in a time-lapse was normalized to the RIG of the 79.13.8014-8023.2005.
29. P Roulin, L Murer, and U F Greber. A single point mutation in the rhinovirus 2B protein
cell at the start of the time-lapse. reduces the requirement for phosphatidylinositol 4-kinase class 3beta in viral replication. in
revision, 2018.
30. H J Chae, J S Kang, J O Byun, K S Han, D U Kim, S M Oh, H M Kim, S W Chae, and H R
References Kim. Molecular mechanism of staurosporine-induced apoptosis in osteoblasts. Pharmacol
Res, 42(4):373–381, 2000. doi: 10.1006/phrs.2000.0700.
1. V I Agol. Cytopathic effects: virus-modulated manifestations of innate immunity? Trends 31. F Charriere, N Pavillon, T Colomb, C Depeursinge, T J Heger, E A Mitchell, P Marquet, and
Microbiol, 20(12):570–576, 2012. doi: 10.1016/j.tim.2012.09.003. B Rappaz. Living specimen tomography by digital holographic microscopy: morphometry of
2. E S Mocarski, J W Upton, and W J Kaiser. Viral infection and the evolution of caspase testate amoeba. Opt Express, 14(16):7005–7013, 2006.
8-regulated apoptotic and necrotic death pathways. Nat Rev Immunol, 12(2):79–88, 2012. 32. Y Cotte, M F Toy, N Pavillon, and C Depeursinge. Microscopy image resolution improvement
doi: 10.1038/nri3131. by deconvolution of complex fields. Opt Express, 18(19):19462–19478, 2010. doi: 10.1364/
3. G C Perng, C Jones, J Ciacci-Zanella, M Stone, G Henderson, A Yukht, S M Slanina, F M OE.18.019462.
Hofman, H Ghiasi, A B Nesburn, and S L Wechsler. Virus-induced neuronal apoptosis 33. V Lauer. New approach to optical diffraction tomography yielding a vector equation of diffrac-
blocked by the herpes simplex virus latency-associated transcript. Science, 287(5457): tion tomography and a novel tomographic microscope. J Microsc, 205(Pt 2):165–176, 2002.
1500–1503, 2000. 34. F Montfort, F Charriere, T Colomb, E Cuche, P Marquet, and C Depeursinge. Purely nu-
4. R E Rhoades, J M Tabor-Godwin, G Tsueng, and R Feuer. Enterovirus infections of the merical compensation for microscope objective phase curvature in digital holographic mi-
central nervous system. Virology, 411(2):288–305, 2011. doi: 10.1016/j.virol.2010.12.014. croscopy: influence of digital phase mask position. J Opt Soc Am A Opt Image Sci Vis, 23
Yakimovich & Witte et al. | Label-free DHTM of virus-induced CPE in live cells bioRχiv | 9bioRxiv preprint first posted online Aug. 27, 2018; doi: http://dx.doi.org/10.1101/401075. The copyright holder for this preprint
(which was not peer-reviewed) is the author/funder, who has granted bioRxiv a license to display the preprint in perpetuity.
All rights reserved. No reuse allowed without permission.
(11):2944–2953, 2006. 63. J. Mercer and P. Traktman. Investigation of Structural and Functional Motifs within the Vac-
35. M Paturzo, F Merola, S Grilli, S De Nicola, A Finizio, and P Ferraro. Super-resolution cinia Virus A14 Phosphoprotein, an Essential Component of the Virion Membrane. Jour-
in digital holography by a two-dimensional dynamic phase grating. Opt Express, 16(21): nal of Virology, 77(16):8857–8871, jul 2003. ISSN 0022-538X. doi: 10.1128/JVI.77.16.
17107–17118, 2008. 8857-8871.2003.
36. C J Sheppard, S S Kou, and C Depeursinge. Reconstruction in interferometric synthetic 64. A Jurgeit, R McDowell, S Moese, E Meldrum, R Schwendener, and U F Greber. Niclosamide
aperture microscopy: comparison with optical coherence tomography and digital holo- is a proton carrier and targets acidic endosomes with broad antiviral effects. PLoS Pathog,
graphic microscopy. J Opt Soc Am A Opt Image Sci Vis, 29(3):244–250, 2012. doi: 8(10):e1002976; 10.1371/journal.ppat.1002976, 2012. doi: 10.1371/journal.ppat.1002976.
10.1364/JOSAA.29.000244. 65. A Jurgeit, S Moese, P Roulin, A Dorsch, M Lotzerich, W M Lee, and U F Greber. An RNA
37. Y Park, M Diez-Silva, G Popescu, G Lykotrafitis, W Choi, M S Feld, and S Suresh. Refractive replication-center assay for high content image-based quantifications of human rhinovirus
index maps and membrane dynamics of human red blood cells parasitized by Plasmodium and coxsackievirus infections. Virol J, 7:264, 2010. doi: 10.1186/1743-422X-7-264.
falciparum. Proc Natl Acad Sci U S A, 105(37):13730–13735, 2008. doi: 10.1073/pnas. 66. D L Glauser, M Seyffert, R Strasser, M Franchini, A S Laimbacher, C Dresch, A P
0806100105. de Oliveira, R Vogel, H Buning, A Salvetti, M Ackermann, and C Fraefel. Inhibition of
38. I.-H. Wang, C.J. Burckhardt, A. Yakimovich, and U.F. Greber. Imaging, tracking and com- herpes simplex virus type 1 replication by adeno-associated virus rep proteins depends
putational analyses of virus entry and egress with the cytoskeleton. Viruses, 10(4), 2018. on their combined DNA-binding and ATPase/helicase activities. J Virol, 84(8):3808–3824,
ISSN 19994915. doi: 10.3390/v10040166. 2010. doi: 10.1128/JVI.01503-09.
39. R. Witte, V. Andriasyan, F. Georgi, A. Yakimovich, and U.F. Greber. Concepts in light mi-
croscopy of viruses. Viruses, 10(4), 2018. ISSN 19994915. doi: 10.3390/v10040202.
40. B Moss and N P Salzman. Sequential protein synthesis following vaccinia virus infection. J
Virol, 2(10):1016–1027, 1968.
41. S C Harrison, B Alberts, E Ehrenfeld, L Enquist, H Fineberg, S L McKnight, B Moss,
M O’Donnell, H Ploegh, S L Schmid, K P Walter, and J Theriot. Discovery of antivirals
against smallpox. Proc Natl Acad Sci U S A, 101(31):11178–11192, 2004.
42. B Moss. Smallpox vaccines: targets of protective immunity. Immunol Rev, 239(1):8–26,
2011. doi: 10.1111/j.1600-065X.2010.00975.x.
43. A C Humphries and M Way. The non-canonical roles of clathrin and actin in pathogen
internalization, egress and spread. Nat Rev Microbiol, 11(8):551–560, 2013.
44. I Morales, M A Carbajal, S Bohn, D Holzer, S E Kato, F A Greco, N Moussatche, and
J Krijnse Locker. The vaccinia virus F11L gene product facilitates cell detachment and
promotes migration. Traffic, 9(8):1283–1298, 2008. doi: 10.1111/j.1600-0854.2008.00762.x.
45. M G Rossmann, E Arnold, J W Erickson, E A Frankenberger, J P Griffith, H J Hecht, J E
Johnson, G Kamer, M Luo, A G Mosser, and Et al. Structure of a human common cold virus
and functional relationship to other picornaviruses. Nature, 317(6033):145–153, 1985.
46. M Crameri, M Bauer, N Caduff, R Walker, F Steiner, F D Franzoso, C Gujer, K Boucke,
T Kucera, A Zbinden, C Munz, C Fraefel, U F Greber, and J Pavlovic. MxB is an interferon-
induced restriction factor of human herpesviruses. Nat Commun, 9(1):1980, 2018. doi:
10.1038/s41467-018-04379-2.
47. B Roizman, D M Knipe, and R J Whitley. Herpes simplex viruses. In P M Howley DM Knipe,
editor, Fields Virology, volume 1, pages 1823–1897. LIPPINCOTT WILLIAMS & WILKINS,
Philadelphia, PA 19103 USA, 6th edition edition, 2013. ISBN ISBN-10: 1-4511-0563-0.
48. Y Yamauchi, K Kiriyama, H Kimura, and Y Nishiyama. Herpes simplex virus induces exten-
sive modification and dynamic relocalisation of the nuclear mitotic apparatus (NuMA) protein
in interphase cells. J Cell Sci, 121(Pt 12):2087–2096, 2008. doi: 10.1242/jcs.031450.
49. A Gupta, J J Gartner, P Sethupathy, A G Hatzigeorgiou, and N W Fraser. Anti-apoptotic
function of a microRNA encoded by the HSV-1 latency-associated transcript. Nature, 442
(7098):82–85, 2006. doi: 10.1038/nature04836.
50. R Leopardi, C Van Sant, and B Roizman. The herpes simplex virus 1 protein kinase US3 is
required for protection from apoptosis induced by the virus. Proc Natl Acad Sci U S A, 94
(15):7891–7896, 1997.
51. F Lang, M Foller, K Lang, P Lang, M Ritter, A Vereninov, I Szabo, S M Huber, and E Gulbins.
Cell volume regulatory ion channels in cell proliferation and cell death. Methods Enzymol,
428:209–225, 2007. doi: 10.1016/S0076-6879(07)28011-5.
52. B Rappaz, P Marquet, E Cuche, Y Emery, C Depeursinge, and P Magistretti. Measure-
ment of the integral refractive index and dynamic cell morphometry of living cells with digital
holographic microscopy. Opt Express, 13(23):9361–9373, 2005.
53. M L Coleman, E A Sahai, M Yeo, M Bosch, A Dewar, and M F Olson. Membrane blebbing
during apoptosis results from caspase-mediated activation of ROCK I. Nat Cell Biol, 3(4):
339–345, 2001. doi: 10.1038/35070009.
54. S Kettle, A Alcami, A Khanna, R Ehret, C Jassoy, and G L Smith. Vaccinia virus serpin
B13R (SPI-2) inhibits interleukin-1beta-converting enzyme and protects virus-infected cells
from TNF- and Fas-mediated apoptosis, but does not prevent IL-1beta-induced fever. J Gen
Virol, 78 ( Pt 3):677–685, 1997. doi: 10.1099/0022-1317-78-3-677.
55. M Kvansakul, H Yang, W D Fairlie, P E Czabotar, S F Fischer, M A Perugini, D C Huang, and
P M Colman. Vaccinia virus anti-apoptotic F1L is a novel Bcl-2-like domain-swapped dimer
that binds a highly selective subset of BH3-containing death ligands. Cell Death Differ, 15
(10):1564–1571, 2008. doi: 10.1038/cdd.2008.83.
56. L Rao, M Debbas, P Sabbatini, D Hockenbery, S Korsmeyer, and E White. The adenovirus
E1A proteins induce apoptosis, which is inhibited by the E1B 19-kDa and Bcl-2 proteins.
Proc Natl Acad Sci U S A, 89(16):7742–7746, 1992.
57. W Chen, P A Calvo, D Malide, J Gibbs, U Schubert, I Bacik, S Basta, R O’Neill, J Schickli,
P Palese, P Henklein, J R Bennink, and J W Yewdell. A novel influenza A virus mi-
tochondrial protein that induces cell death. Nat Med, 7(12):1306–1312, 2001. doi:
10.1038/nm1201-1306.
58. L Deszcz, E Gaudernak, E Kuechler, and J Seipelt. Apoptotic events induced by human
rhinovirus infection. J Gen Virol, 86(Pt 5):1379–1389, 2005. doi: 10.1099/vir.0.80754-0.
59. A Kaczmarek, P Vandenabeele, and D V Krysko. Necroptosis: the release of damage-
associated molecular patterns and its physiological relevance. Immunity, 38(2):209–223,
2013. doi: 10.1016/j.immuni.2013.02.003.
60. V Mico, Z Zalevsky, C Ferreira, and J Garcia. Superresolution digital holographic microscopy
for three-dimensional samples. Opt Express, 16(23):19260–19270, 2008.
61. K D McCormick, S Liu, J L Jacobs, E T Marques Jr., N Sluis-Cremer, and T Wang. De-
velopment of a robust cytopathic effect-based high-throughput screening assay to identify
novel inhibitors of dengue virus. Antimicrob Agents Chemother, 56(6):3399–3401, 2012.
doi: 10.1128/AAC.06425-11.
62. J Mercer, S Knebel, F I Schmidt, J Crouse, C Burkard, and A Helenius. Vaccinia virus
strains use distinct forms of macropinocytosis for host-cell entry. Proc Natl Acad Sci U S A,
107(20):9346–9351, 2010. doi: 10.1073/pnas.1004618107.
10 | bioRχiv Yakimovich & Witte et al. | Label-free DHTM of virus-induced CPE in live cellsbioRxiv preprint first posted online Aug. 27, 2018; doi: http://dx.doi.org/10.1101/401075. The copyright holder for this preprint
(which was not peer-reviewed) is the author/funder, who has granted bioRxiv a license to display the preprint in perpetuity.
All rights reserved. No reuse allowed without permission.
Equations
s 2 2 2
RI x+1,y,z − RI x-1,y,z RI x,y+1,z − RI x,y-1,z RI x,y,z+1 − RI x,y,z-1
RIG = + + (1)
2px 2py 2pz
here 2px , 2py , 2pz is the resolution of the image, and RI x ± 1, y ± 1, z ± 1 is the neighbouring pixels RI value.
Yakimovich & Witte et al. | Label-free DHTM of virus-induced CPE in live cells bioRχiv | 11bioRxiv preprint first posted online Aug. 27, 2018; doi: http://dx.doi.org/10.1101/401075. The copyright holder for this preprint
(which was not peer-reviewed) is the author/funder, who has granted bioRxiv a license to display the preprint in perpetuity.
All rights reserved. No reuse allowed without permission.
Appendix 1. Supplementary Information
This is a supplementary section to the preprint manuscript by Yakimovich & Witte et al. Supplementary Videos can be down-
loaded alongside with the manuscript. Source code used in this manuscript can be obtained from https://github.com/
ayakimovich/DHMViruses. All further information is available upon request.
Supplementary Figures.
Sup. Fig. 1: the volume measurement using polystyrene beads of defined size.. (A) Polystyrene beads (Tetraspeck,
ThermoFisher) of defined diameter were diluted in PBS, allowed to sediment to the bottom of the dishes and imaged using a
3D Cell Explorer microscope. Small boxes depict artificial RI stain of beads in red on black background. Large box shows full
3D visualization of acquired holograph. 3D stacks of the beads were digitally stained (voxel segmented) for an RI estimated
to cover at least 95% of the bead volumes. Scale bars indicate 5 µ m. (B) Comparison of volume quantification performed by
voxel summation either by voxel-segmentation and counting in STEVE software or by surface fitting in Imaris. Bead diameter
was computed based on voxel counts and voxel size and compared to the nominal diameter provided by the manufacturer.
12 | bioRχiv Yakimovich & Witte et al. | Label-free DHTM of virus-induced CPE in live cellsbioRxiv preprint first posted online Aug. 27, 2018; doi: http://dx.doi.org/10.1101/401075. The copyright holder for this preprint
(which was not peer-reviewed) is the author/funder, who has granted bioRxiv a license to display the preprint in perpetuity.
All rights reserved. No reuse allowed without permission.
Supplementary Videos.
Video 1: Cell morphology and VACV E/L-GFP transgene expression visualized by automated and correlative phase-
contrast and fluorescence live time-lapse microscopy.
HeLa-ATCC cells were either mock infected (left panel) or infected (right panel) with VACV_E/L-GFP virus (MOI 2). Cells
were imaged with a high-throughput widefield microscope every 5 min for 8 h. Samples were visualized with transmission
light. The GFP fluorescence was color-coded (color bar corresponding to fluorescence intensity from transparent through blue
to white). Scale bar indicates 50 µ m. The video is related to Fig. 3.
Video 2: Cell morphology and volume dynamics of an uninfected cell visualized using label-free time-lapse holographic
tomography.
HeLa-ATCC cells were treated with cold binding medium, followed by transfer to 37◦ C. Cell holograms were acquired every
minute for 8 h and shown as greyscale images. Volume measurement was performed using Imaris software by surfaced fitting
(3D rendering in the lower left corner of each frame). The volumes relative to 0 min time point are plotted. The red dashed
lines depict the corresponding time points in volume plot. Scale bar indicates 20 µ m. The video is related to Fig. 4.
Video 3: Cell morphology and volume dynamics of VACV infected cell visualized using label-free time-lapse holographic
tomography.
HeLa-ATCC cells were infected with VACV_E/L-GFP virus (MOI 2) by cold synchronization. Cell holograms were acquired
every minute for 8 h and shown as greyscale images. Volume measurement was performed using Imaris software by surfaced
fitting (3D rendering in the lower left corner of each frame), volume relative to 0 min is plotted. The red dashed lines depict the
corresponding time points in volume plot. Scale bar indicates 20 µ m. The video is related to Fig. 4.
Videos 4-7: Drug treatment inhibits RV-A1a induced RI changes
HeLa-Ohio cells were left uninfected (top panel), or infected with RV-A1a (MOI 50, lower three panels). Cells were left
untreated (upper two panels), or were treated with either 5 µ M PIK93, or 10 µ M MLN9708. Holographic images were
acquired at 1 min intervals for 8 h. Cell membranes are labelled in green, high refractive index and refractive index gradient
regions are labelled in red. Scale bars indicate 10 µ m. Still frames of the videos are provided in Fig. 6.
Yakimovich & Witte et al. | Label-free DHTM of virus-induced CPE in live cells bioRχiv | 13You can also read