Neurophysiological Correlates of Asymmetries in Vowel Perception: An English-French Cross-Linguistic Event-Related Potential Study
←
→
Page content transcription
If your browser does not render page correctly, please read the page content below
ORIGINAL RESEARCH
                                                                                                                                               published: 03 June 2021
                                                                                                                                      doi: 10.3389/fnhum.2021.607148

                                           Neurophysiological Correlates of
                                           Asymmetries in Vowel Perception: An
                                           English-French Cross-Linguistic
                                           Event-Related Potential Study
                                           Linda Polka 1,2* , Monika Molnar 3 , T. Christina Zhao 4,5 and Matthew Masapollo 6
                                           1
                                             School of Communication Sciences and Disorders, McGill University, Montreal, QC, Canada, 2 Center for Research on
                                           Brain, Language, and Music, McGill University, Montreal, QC, Canada, 3 Department of Speech-Language Pathology,
                                           University of Toronto, Toronto, ON, Canada, 4 Institute for Learning and Brain Sciences, University of Washington, Seattle,
                                           WA, United States, 5 Department of Speech and Hearing Sciences, University of Washington, Seattle, WA, United States,
                                           6
                                             Department of Speech, Language, and Hearing Sciences, University of Florida, Gainesville, FL, United States

                                           Behavioral studies examining vowel perception in infancy indicate that, for many vowel
                                           contrasts, the ease of discrimination changes depending on the order of stimulus
                                           presentation, regardless of the language from which the contrast is drawn and the
                                           ambient language that infants have experienced. By adulthood, linguistic experience
                           Edited by:      has altered vowel perception; analogous asymmetries are observed for non−native
                         Arild Hestvik,
 University of Delaware, United States
                                           contrasts but are mitigated for native contrasts. Although these directional effects
                        Reviewed by:
                                           are well documented behaviorally, the brain mechanisms underlying them are poorly
                             Yan H. Yu,    understood. In the present study we begin to address this gap. We first review recent
   St. John’s University, United States
                                           behavioral work which shows that vowel perception asymmetries derive from phonetic
                     Andreas Højlund,
          Aarhus University, Denmark       encoding strategies, rather than general auditory processes. Two existing theoretical
                   *Correspondence:        models–the Natural Referent Vowel framework and the Native Language Magnet model–
                           Linda Polka     are invoked as a means of interpreting these findings. Then we present the results of
                 linda.polka@mcgill.ca
                                           a neurophysiological study which builds on this prior work. Using event-related brain
                   Specialty section:      potentials, we first measured and assessed the mismatch negativity response (MMN,
        This article was submitted to      a passive neurophysiological index of auditory change detection) in English and French
               Speech and Language,
                a section of the journal   native-speaking adults to synthetic vowels that either spanned two different phonetic
    Frontiers in Human Neuroscience        categories (/y/vs./u/) or fell within the same category (/u/). Stimulus presentation was
      Received: 16 September 2020          organized such that each vowel was presented as standard and as deviant in different
           Accepted: 03 May 2021
                                           blocks. The vowels were presented with a long (1,600-ms) inter-stimulus interval
          Published: 03 June 2021
                                           to restrict access to short-term memory traces and tap into a “phonetic mode” of
                             Citation:
     Polka L, Molnar M, Zhao TC and        processing. MMN analyses revealed weak asymmetry effects regardless of the (i) vowel
                  Masapollo M (2021)       contrast, (ii) language group, and (iii) MMN time window. Then, we conducted time-
         Neurophysiological Correlates
 of Asymmetries in Vowel Perception:       frequency analyses of the standard epochs for each vowel. In contrast to the MMN
  An English-French Cross-Linguistic       analysis, time-frequency analysis revealed significant differences in brain oscillations
        Event-Related Potential Study.
                                           in the theta band (4–8 Hz), which have been linked to attention and processing
   Front. Hum. Neurosci. 15:607148.
    doi: 10.3389/fnhum.2021.607148         efficiency. Collectively, these findings suggest that early-latency (pre-attentive) mismatch

Frontiers in Human Neuroscience | www.frontiersin.org                             1                                             June 2021 | Volume 15 | Article 607148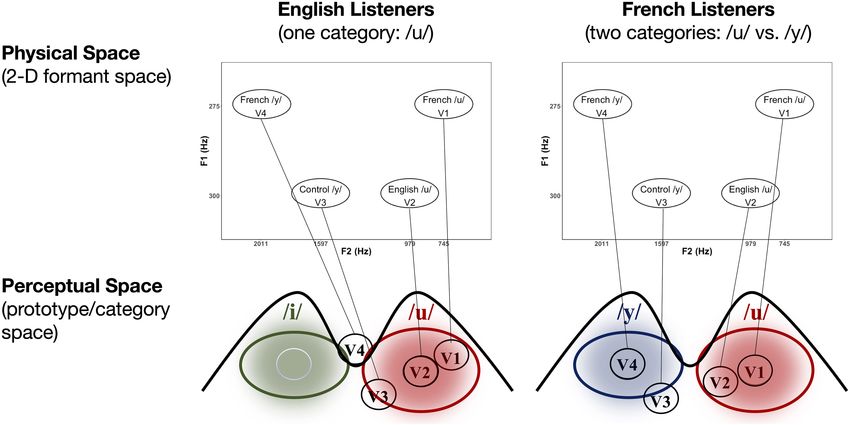
Polka et al.                                                                                                                Vowel Perception Asymmetries

                                          responses may not be a strong neurophysiological correlate of asymmetric behavioral
                                          vowel discrimination. Rather, asymmetries may reflect differences in neural processing
                                          efficiency for vowels with certain inherent acoustic-phonetic properties, as revealed by
                                          theta oscillatory activity.
                                          Keywords: vowel perception, mismatch negativity, prototypes, natural referent vowel framework, native language
                                          magnet model, brain rhythms

INTRODUCTION                                                                    vowel discrimination tasks. More specifically, infants perform
                                                                                better at discriminating a change from a relatively less peripheral
A central goal of research in the field of speech perception is to              to a relatively more peripheral vowel within F 1 –F 2 acoustic
explicate how listeners map the input acoustic signal onto the                  space, regardless of the language from which the contrast is
phonetic categories of language (for reviews, Cleary and Pisoni,                drawn. As an example, Bohn and Polka (2001) used the head-
2001; Fowler, 2003; Diehl et al., 2004; Samuel, 2011). Within this              turn conditioning procedure to test German-learning infants’
overarching agenda, developmentalists have addressed how this                   discrimination of the German/i/-/e/vowel contrast (Werker et al.,
mapping between acoustic and phonetic structures dynamically                    1998). In this task, infants hear a repeating background stimulus
changes via early language experience in the first year of life                 and are assessed on their ability to distinguish a change from
(Werker and Curtin, 2005; Kuhl et al., 2008; Best et al., 2016).                the background to a target stimulus. In the Bohn and Polka
This emphasis on describing infant attunement to native speech                  study, they counterbalanced presentation of each vowel; half
derived in large part from experimental investigations by Kuhl                  of infant subjects were tested with one direction of change
and colleagues (Grieser and Kuhl, 1989; Kuhl, 1991; Kuhl et al.,                (from /i/ to /e/) and half were tested with a change in the
1992; Iverson and Kuhl, 1995, 2000; Iverson et al., 2003).                      reverse direction (from /e/ to /i/). The results revealed that infants
Their studies with human infants, human adults, and rhesus                      performed better at discriminating the change from /i/ to /e/,
macaques revealed that early language experience profoundly                     compared to the reverse. Similar directional effects have been
alters speech perception by reducing discrimination sensitivity                 found with infants tested using numerous behavioral tasks and
close to phonetic category prototypes and boosting sensitivity at               a wide range of vowel contrasts (Polka and Bohn, 2003, 2011).
the boundaries between categories (Lotto et al., 1998; Guenther                 By adulthood, linguistic experience has altered vowel perception;
et al., 1999, 2004; Feldman et al., 2009).                                      similar asymmetries are observed for other non−native contrasts
    In more recent years, however, it has become increasingly clear             but not for native contrasts which are typically perceived with
that from infancy onward, speech processing involves generic                    near-perfect accuracy (Polka and Bohn, 2011; Dufour et al., 2013;
as well as language-specific perceptual biases. It is now known                 Tyler et al., 2014).
that infants from across diverse linguistic communities initially                  Over the last decade, Polka and colleagues have formulated
display generic, “language-universal” biases or preferences in                  and experimentally tested a theoretical framework, termed
their perception of phonetic segments (Polka and Bohn, 2003,                    the Natural Referent Vowel (NRV) framework, for explicating
2011; Nam and Polka, 2016). Moreover, these generic or “all-                    the processes underlying directional asymmetries (Polka and
purpose” speech biases, which are distinct from “language-                      Bohn, 2011; Masapollo et al., 2017a, 2018a; Polka et al., 2019).
specific” prototype categorization processes, have been identified              The NRV framework incorporates ideas across several existing
in adults (Masapollo et al., 2017a; Liu et al., 2021). These generic            phonetic theories, namely Steven’s Quantal Theory (Stevens,
speech biases are evident in studies showing that young infants                 1989), and Schwartz’s Dispersion-Focalization Theory (Schwartz
exhibit robust listening preferences for some speech sounds over                and Escudier, 1989; Schwartz et al., 1997, 2005). Quantal Theory
others (Polka and Bohn, 2011; Nam and Polka, 2016), and that                    posits that vocalic articulations affiliated with the extremes of
some phonetic contrasts are poorly distinguished early on (Polka                vowel space result in acoustic signals with obvious spectral
et al., 2001; Best and McRoberts, 2003; Larraza et al., 2020)                   prominences created by the convergence of adjacent formant
or show directional asymmetries in discrimination (Polka and                    frequencies. For example, when producing /i/ (the highest front
Bohn, 2003, 2011; Kuhl et al., 2006; Pons et al., 2012; Nam and                 vowel) F 2 , F 3 , and F 4 converge, when producing /y/ (the
Polka, 2016).                                                                   highest front rounded vowel) F 2 and F 3 converge, when
    The present research aims to improve our understanding                      producing /a/ (the lowest back vowel) and /u/ (the highest back
of the neural mechanisms and processes underlying vowel                         vowel) F 1 and F 2 converge. These convergence points have
perception biases observed in adults. It has been known for years               also been referred to as “focal points” (Boë and Abry, 1986).
that, early in development, infant perception is biased toward                  According to the Dispersion-Focalization Theory, the strong
articulatorily and acoustically extreme vowels. These findings                  tendency for vowel systems to select members found at the
have been reviewed and discussed extensively by Polka and                       extremes of articulatory/acoustic vowel space is driven by two
Bohn (2003, 2011), and have also been reinforced in recent                      factors. First, dispersion ensures that vowels are acoustically
meta-analyses (Tsuji and Cristia, 2017; Polka et al., 2019).                    distant from one another within vowel space, which enhances
Evidence supporting this view initially emerged from research                   perceptual differentiation. Second, focalization ensures that
revealing that infants show robust directional asymmetries in                   vowels have salient and stable phonetic structures making them

Frontiers in Human Neuroscience | www.frontiersin.org                       2                                       June 2021 | Volume 15 | Article 607148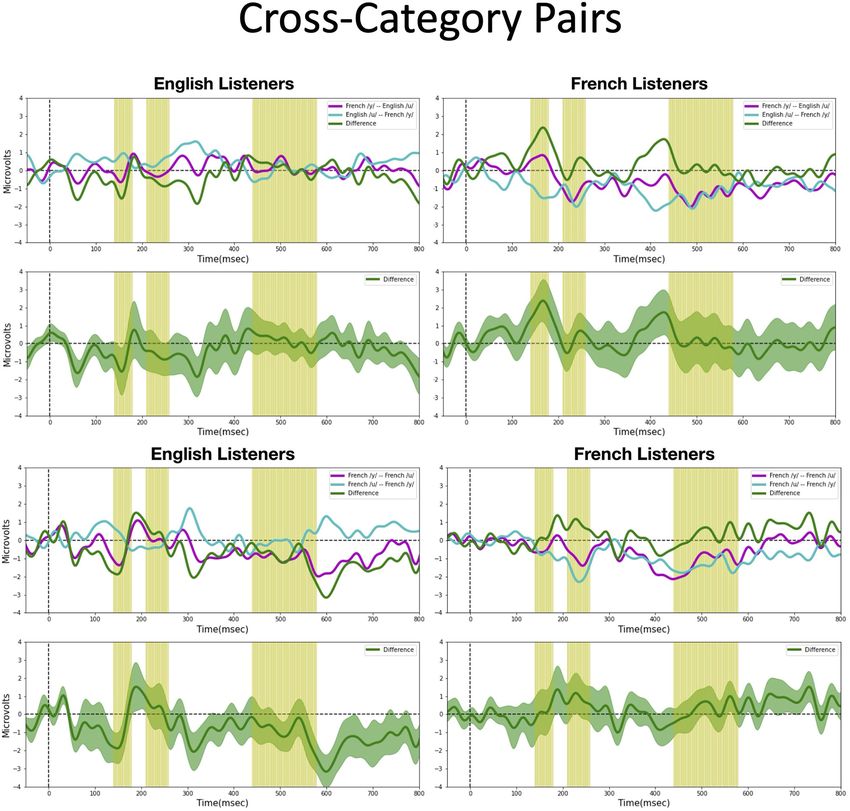
Polka et al.                                                                                                         Vowel Perception Asymmetries

strong anchors for perception and production. Focal vowels                Iverson and Kuhl, 1995; cf. Miller and Eimas, 1996; Guenther
will be easier for listeners to detect, encode, and retain in             et al., 1999, 2004; Feldman et al., 2009). Although NLM applies
phonological working memory.                                              to both consonants and vowels, most of the research supporting
    Concurring with these fundamental principles, the NRV                 the idea that there is a “warping” of within-category perceptual
framework (Polka and Bohn, 2011) offers additional insights into          space that is tied to variation in category goodness has focused
the aforementioned developmental findings by proposing that               on vowels (Kuhl, 1991; Kuhl et al., 1992; Iverson and Kuhl, 1995;
asymmetries in infant and adult vowel discrimination reflect a            Lotto et al., 1998). Moreover, NLM posits that speech perception
default, generic perceptual bias favoring focal vowels. In this           relies on general auditory mechanisms applied to acoustic rather
account, the focalization of acoustic energy boosts perceptual            than specifically phonetic information. Nevertheless, in the NLM
salience, which in turn, biases perception and gives rise to the          model, directional asymmetries are viewed as an experience-
directional asymmetries observed in phonetic discrimination               dependent bias favoring native prototype; asymmetries arise
tasks (Schwartz and Escudier, 1989; Masapollo et al., 2017a).             because listener sensitivity is reduced when discriminating a
In advancing this viewpoint, Polka and Bohn do not mean                   change from a more-prototypic to a less-prototypic vowel
to imply that perceptual asymmetries are attributable to low-             compared to the reverse. In line with this view, Kuhl (1991)
level auditory or psychoacoustic processes. As highlighted in             reported a directional asymmetry in which English-learning
Masapollo et al. (2017b, 2018a), NRV assumes that the effects             infants performed better at discriminating a change from a non-
of formant convergence on vowel perception reflect a phonetic             prototypic /i/ to a prototypic /i/, compared to a change from
bias that emerges when listeners are perceiving speech, rather            prototypic /i/ to non-prototypic /i/. Notably, in this case the
than a low-level sensitivity to raw acoustic energy. Compatible           prototypic /i/ was more focal (between F 2 and F 3 ) compared to
with this view, perception experiments have demonstrated that             the non-prototypic /i/. Thus, the observed asymmetry could be
asymmetries predicted by differences in formant proximity are             due to prototypicality and/or focalization effects.
observed whether vowels are heard or perceived visually in a                   Several English-French cross-linguistic studies assessed the
lip-reading task (Masapollo et al., 2017b, 2018a; Masapollo and           competing NRV and NLM accounts of asymmetries in vowel
Guenther, 2019), confirming that the “focal vowel” bias derives           perception (Masapollo et al., 2017a,b; Liu et al., 2021). The
from phonetic processing rather than low-level psychoacoustic             vowel /u/, as in boo, was chosen for use in these studies for
processes (Masapollo et al., 2019).                                       several reasons. First prior research established that Canadian
    Polka and Bohn (2011) have further argued that the focal              French speakers consistently produce more extreme /u/ gestures
vowel bias plays an important role in the acquisition and                 (resulting in lower and spectrally closer F 1 and F 2 values)
processing of vowels across the lifespan. Asymmetries that point          than Canadian English speakers. Accordingly, in the standard
to a focalization bias are observed in infants in the first few           vowel space, the mean location of French /u/ is more
months of life for both native and non-native vowel contrasts             peripheral than that of English /u/ (Escudero and Polka, 2003;
alike. Across the first year, as infants accrue specific linguistic       MacLeod et al., 2009; Noiray et al., 2011). This means that
experience, they begin tuning to native vowel contrasts. This             French /u/ has a more focal acoustic-phonetic form (with
will increase or diminish the initial focalization bias depending         closer convergence of F 1 and F 2 ) compared to English /u/.
on the vowel inventory of their native language. This generic             These differences in focalization and language-specific phonetic
bias is thought to provide a scaffold to support the acquisition          categorization between English and French speakers provided
of a more detailed vowel system. Thus, according to NRV, both             an ideal opportunity to assess how these factors influence adult
generic/focalization biases and language-specific biases influence        vowel perception.
vowel perception in mature, adult language users.                              In an initial study, Masapollo et al. (2017a) synthesized
    An alternative, but not mutually exclusive, account of                a set of vowels that were consistently identified as /u/ by
asymmetries derives from Kuhl’s Native Language Magnet                    native speakers of English and of French but that nevertheless
(NLM) model (Kuhl, 1991; Iverson and Kuhl, 1995; Kuhl                     varied in their stimulus goodness ratings, such that the best
et al., 2008). This model, which combines principles from                 French /u/ exemplars were more focal (between F 1 and
categorization and prototype theory (Rosch, 1975, 1977; Samuel,           F 2 ) compared to the best English /u/ exemplars. In an AX
1982) with statistical learning theory (Aslin and Newport, 2012),         (same/different) discrimination task, both English and French
posits that directional asymmetries reflect biases favoring native        listeners were found to perform better at discriminating
language phonetic category prototypes (i.e., adult-defined “best”         changes from the less to the more focal /u/ compared to the
instances of a category). NLM assumes that phonetic categories            reverse, regardless of variation in prototypicality. Similar results
emerge early in development as infants track distributional               were obtained using natural productions of English /u/ and
patterns in speech input during social interactions. Like other           French /u/ in tests with adults (Masapollo et al., 2017b) and
cognitive/perceptual categories, phonetic categories have an              infants (Polka et al., 2018). These findings established the focal
internal structure organized around a central, prototypic member          vowel bias in adults, demonstrated that this perceptual bias favors
(Kuhl, 1991). Furthermore, Kuhl claims that these prototypes              vowels with greater formant convergence and established that
have a “magnet-like” effect, which shrinks the immediate                  this bias operates independently of biases related to language-
perceptual space making it more difficult to discriminate variants        specific prototype categorization.
surrounding a prototype compared to variants surrounding a                     In a subsequent study, Liu et al. (2021) presented Canadian
non-prototype of the same category (Kuhl, 1991; Kuhl et al., 1992;        English listeners with a finer grained series of vowels varying from

Frontiers in Human Neuroscience | www.frontiersin.org                 3                                      June 2021 | Volume 15 | Article 607148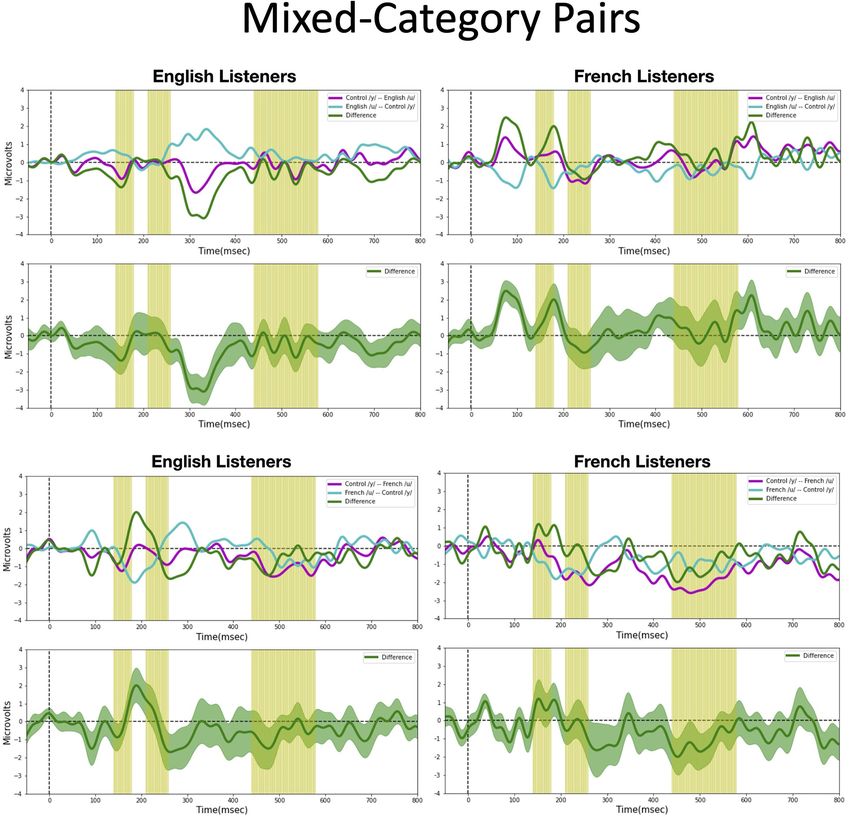
Polka et al.                                                                                                          Vowel Perception Asymmetries

the less-focal/English prototypic /u/ to the more-focal/French             relatively short inter-stimulus-intervals (ISIs) (approximately
prototypic /u/ identified in the prior Masapollo et al. (2017a)            500 ms) in order to “build up” or “strengthen” the short-
study. In an AX discrimination task, the stimulus pairings                 term memory “trace” for the repeated standard stimulus that
included one-step, two-step, and three-step intervals along the            develops online during the course of the experiment. The
series. The results revealed that focalization and prototype effects       MMN is generally thought to reflect activity differences in
were both present but were differentially influenced by the size of        neurons in or near the auditory cortex that detect a discrepancy
the acoustic intervals along the stimulus series. More specifically,       (or mismatch) between the deviant percept and short-term
asymmetries favoring the English /u/ prototype emerged when                trace of the standard (Näätänen et al., 2007). In tasks using
subjects were discriminating small stimulus differences (1-step)           relatively short ISIs, there will be less time for the short-
close to the prototype stimulus. When stimulus differences were            term memory trace to decay between successive stimuli, and
larger (2- or 3-steps) discrimination asymmetries favored more             thus brain responses will reflect the basic resolution of the
focal exemplars of /u/ (Masapollo et al., 2015). Collectively, these       auditory system. Conversely, when the ISI is longer, the length
findings demonstrate, at the behavioral level, that directional            of time that each stimulus is buffered in memory increases,
asymmetries in adult vowel perception reveal a generic “focal              short-term traces will decay, and brain responses will reflect
vowel” bias that shapes the global structure of the vowel space            stimulus encoding processing and long-term representations
(explained by NRV) as well as a more subtle experience-                    of phonological units (for discussion, see Strange, 2011). In
dependent bias that alters perception of the local internal                the current research, we used a long ISI to better elicit a
structure of native vowel categories (as described by NLM).                “phonetic mode” of processing and to restrict access to short-
    Although the existing behavioral data indicate that directional        term memory traces. As previously discussed, NRV posits
asymmetries may be well predicted from a combination of                    that focalization biases reflect phonetic processes rather than
salient spectral information and category “goodness” ratings,              auditory processes in speech perception (Polka and Bohn, 2011;
the neural underpinnings of these effects remain to be                     Masapollo et al., 2017a,b, 2018a,b). In keeping with this view,
determined. Here, we present data from neurophysiological                  several previous behavioral studies have shown that in AX
experiments with adults from different language backgrounds                discrimination tasks, vowel order effects emerge or increase
to begin to uncover these “brain-to-perception” relations                  as the ISI increases, whereas overall perceptual performance
and generate new hypotheses within the NRV and NLM                         improves and asymmetries decrease when the ISI decreases
theoretical frameworks. We wish to provide data that help                  (Polka and Bohn, 2011; Masapollo et al., 2018b; Polka et al.,
to characterize what aspects of neural processing corroborate              2019). For example, when testing adult discrimination of a non-
extant behavioral findings. Toward this end, we investigated               native contrast, Polka and Bohn (2011) observed a directional
whether we can observe asymmetries in the neurophysiological               asymmetry when they used a 1,500 ms ISI, but not when they
correlates of adult vowel perception, focusing on two neural               used a 500 ms ISI.
measurements at the cortical level: (1) the mismatch negativity                On the basis of the aforementioned behavioral findings
(MMN) that indexes neural sensitivity to vowel change;                     (Masapollo et al., 2017a; Liu et al., 2021), we generated several
and (2) brain oscillatory activity in the theta (4–8 Hz)                   hypotheses concerning MMN responses measured using a long
frequency band that indexes processing efficiency. While                   ISI. First, for relatively large (cross-category /u/ vs /y/) phonetic
focalization biases have always been tested and demonstrated               differences, we predicted (à la NRV) that the MMN will exhibit
behaviorally by directional effects in discrimination tasks,               greater amplitude (and/or a shorter latency) in response to
examining the neural responses to vowels may provide us                    changes from less-focal to more-focal vowels compared to the
with a new window to understand vowel processing and the                   reverse, but that these asymmetries will be weaker in French
representation of “central” versus “peripheral” vowels in a                listeners because the /u/ - /y/ contrast is native in French but non-
more direct manner.                                                        native in English. Second, for relatively small (within-category)
    We recorded auditory event-related potentials (ERPs) and               phonetic differences, we hypothesized (à la NLM) that the MMN
first computed the MMN response to within-category and cross-              would exhibit greater amplitude (and/or a shorter latency) in
category vowel contrasts in native English- and French-speaking            response to changes from less-prototypic to more-prototypic
listeners. The vowel stimuli were previously used in an ERP                vowels compared to the reverse. This hypothesis would be
study (Molnar et al., 2013) that compared vowel processing                 supported if the MMN showed opposite asymmetries across
in bilingual and monolingual adults. The experimental design               the two language groups. More specifically, English listeners
of this study also permitted an exploration of perceptual                  would be expected to show a larger (and/or earlier) MMN when
asymmetries, which is our present goal. Four stimuli were chosen           the English-prototypic /u/ occurs as a deviant among French-
from an acoustic vowel continuum (described below) ranging                 prototypic /u/ standards compared to the reverse, whereas French
perceptually from /i/ to /y/ to /u/; the selected tokens include           listeners would be expected to show a larger (and/or earlier)
variants of /u/ and /y/ that form cross-category stimulus pairs (in        MMN when the French-prototypic /u/ occurs as a deviant among
French) and within-category stimulus pairs (in both languages).            the English-prototypic /u/ standards compared to the reverse.
The psychophysical distances between the cross-category and                Similarly, for the French group only, the MMN should be
within-category stimulus pairs were equated.                               larger (and/or earlier) when the French-prototypic /y/ occurs
    Prior studies examining the MMN in auditory oddball                    as a deviant among the French-non-prototypic /y/ standards
paradigms (Näätänen et al., 2007) have typically employed                  compared to the reverse. Yet another possibility is that directional

Frontiers in Human Neuroscience | www.frontiersin.org                  4                                      June 2021 | Volume 15 | Article 607148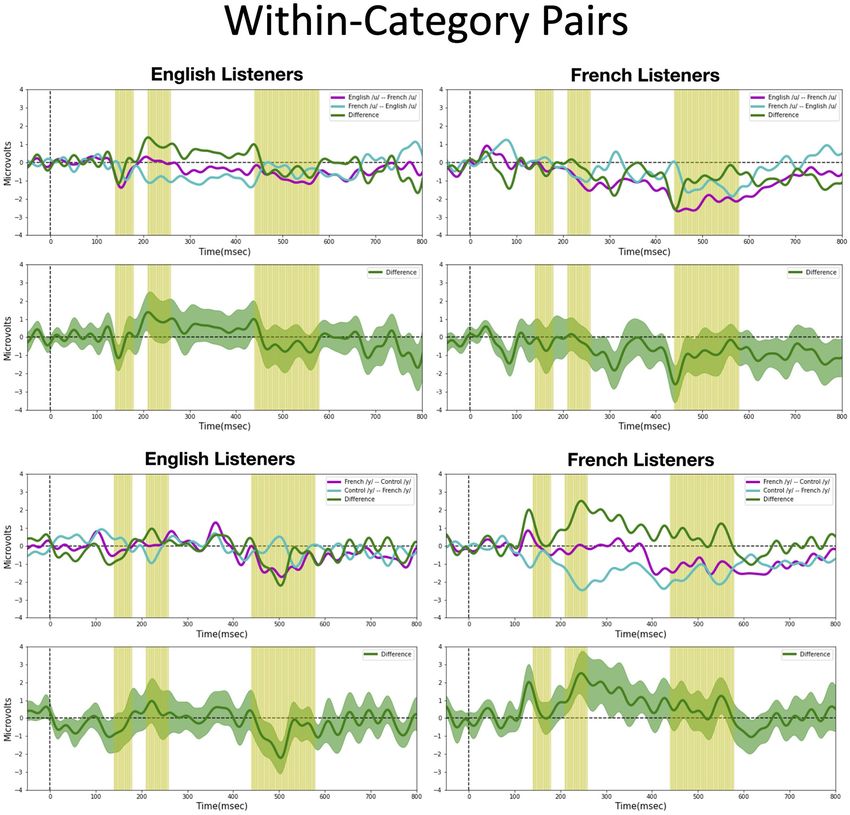
Polka et al.                                                                                                         Vowel Perception Asymmetries

asymmetries observed at the behavioral level may be reflected           raised in a monolingual home and educated in a monolingual
by ERP components with latency differences relative to the              school in their respective language; (3) no experience learning
MMN. Because the MMN is thought to reflect “pre-attentive”              a second language before 10 years of age; (4) no experience
processes, it may be too early of a cortical response to reflect        conversing in a second language on a regular basis, having rated
asymmetries, which do not appear to derive from early stages            their speaking and listening abilities in a second language with
of acoustic processing (Polka and Bohn, 2011; Masapollo                 a maximum of 4 out of 10 on the LEAP-Q; and (5) their speech
et al., 2018b; Polka et al., 2019). Recently it has also been           samples were rated 5 (native-like) on average.
demonstrated that MMNs recorded in an oddball paradigm
with a longer ISI (e.g., 600 vs. 2,600 ms) reflect sensitivity          Stimuli
to language-specific phonological information rather than the           In our previous behavioral studies (Molnar et al., 2010; Masapollo
acoustic information in speech sounds (Yu et al., 2017, 2018).          et al., 2017a), we synthesized a broad array of 128 vowels that
An additional goal of the current study was to go beyond                covered the entire upper region of vowel space and ranged in F 1
examination of the classic MMN response and track cortical              (from 275 to 330 Hz) and F 2 (from 476 to 2,303 Hz) in equal
oscillations. While the MMN response may seem like a more               psychophysical steps on the bark scale (Zwicker and Terhardt,
direct comparison with the existing behavioral discrimination           1980). All stimuli were synthesized using the Variable Linear
findings, comparing the neural responses to the standard trials         Articulatory Model (Maeda, 1979, 1990; Boë, 1999; Ménard et al.,
across the four vowels may provide us with a more direct                2004, 2009). The variants were created by manipulating the
look at how vowels with different acoustic characteristics are          values of F 1 and F 2 ; the values of F 0 , F 3 , F 4 , and F 5 remained
processed in the brain. We identified the theta band neural             constant for all vowels at 120, 2,522, 3,410, and 4,159 Hz,
oscillation (4–8 Hz) to be a good measure to characterize               respectively. Each stimulus was 400 ms in duration and had
vowel processing, as it has been argued to provide a measure            the same intonation and intensity contours. In pilot studies,
of “neural efficiency” during speech processing (Zhang et al.,          these stimuli were presented to native, monolingual Canadian
2011; Bosseler et al., 2013). We hypothesized that, if formant          English (n = 5) and Canadian French (n = 5) listeners, who
convergence influences attention or cognitive effort (à la NRV),        were asked to give their phonetic identification and goodness
then theta rhythms should show reduced power in response to             ratings on a 5-point-scale (1 = very poor, 5 = very good).
more-focal compared to less-focal vowels. If, on the other hand,        We found, as expected, that vowel judgments systematically
stimulus prototypicality influences cognitive effort (à la NLM),        varied as a function of F 2 : For English listeners, the vowels
then theta rhythms should show reduced power in response                varied perceptually from /u/(“oo”) to /i/(“ee”) as F 2 values
to more prototypic native vowel exemplars compared to less              increased, whereas for French listeners, the vowels varied
prototypic ones.                                                        perceptually from /u/(“oo”) to /y/ (as in the French word “but”)
                                                                        to /i/ (ee) as the F 2 values increased (Note that in Canadian
                                                                        English, /y/ does not occur (Escudero and Polka, 2003; MacLeod
MATERIALS AND METHODS                                                   et al., 2009).
                                                                            Based on the results of these initial tests, we then selected
Participants                                                            34 vowels to present to larger groups of English (n = 13)
Thirty normal-hearing right-handed adults participated in the           and French (n = 13) listeners in a subsequent experiment
current experiment: 15 were native Canadian English speakers            for identification and goodness ratings. This reduced stimulus
(average age = 25, seven females) and 15 were native Canadian           set included 22 high back vowels targeting English /u/ and
French speakers (average age = 26 years, seven females). All were       French /u/ vowel (F 1 = 275 and 300 Hz; F 2 = 4,548 to
healthy young adults with no history of a speech, language, or          979 Hz), and 12 high front vowels targeting English /i/ and
other neurological impairment. Informed consent was obtained            French /i/ and /y/ (F 1 = 275 and 300 Hz; F 2 = 1,753 to
according to the McGill University human research committee.            2,202 Hz). Note that we also synthesized two additional filler
Four additional participants were tested but excluded from the          vowels (/o/[“oh”] and /@/[“uh”]) to include in the stimulus set to
analysis due to technical problems with the data acquisition (2)        provide some variation in vowel quality. This made it easier to
and poor data quality caused by artifacts (2). The EEG/ERP              assess whether participants were successful in identifying vowel
data for these participants was collected in a previous study           quality differences using key words. The results of these tests
(Molnar et al., 2013).                                                  were then used to select four vowel tokens (shown in Figure 1)
   Participants’ language background was assessed using                 for use in the current neurophysiological study: a good exemplar
two measures: (1) The Language Experience and Proficiency               of French /u/ (F 1 = 275 Hz, F 2 = 745 Hz), a good exemplar of
Questionnaire (LEAP-Q) which was developed specifically                 English /u/ (F 1 = 300 Hz, F 2 = 979 Hz), a good exemplar of
to evaluate bilingual and multilingual individuals’ linguistic          French /y/ (F 1 = 275 Hz, F 2 = 2,011 Hz), and a poor exemplar
experience (Marian et al., 2007); and (2) a speech sample               of Canadian French /y/ (F 1 = 300 Hz, F 2 = 1,597 Hz). The
evaluated by monolingual speakers of Canadian English (n = 3)           selected variants of /u/ (V1 and V2) and /y/ (V3 and V4) were
and Canadian French (n = 3) using a scale from 1 (“no ability in        equally distant on the bark scale (Zwicker and Terhardt, 1980)
the given language”) to 5 (“native-like ability”).                      along both the F 1 and F 2 dimensions. The French-prototypic/u/is
   Participants had to meet the following criteria to be included       the most focal between F 1 and F 2 (Figure 1, top panel),
in the study: (1) no prior linguistic or phonetics training; (2)        whereas the French-prototypic /y/ is the most focal between

Frontiers in Human Neuroscience | www.frontiersin.org               5                                        June 2021 | Volume 15 | Article 607148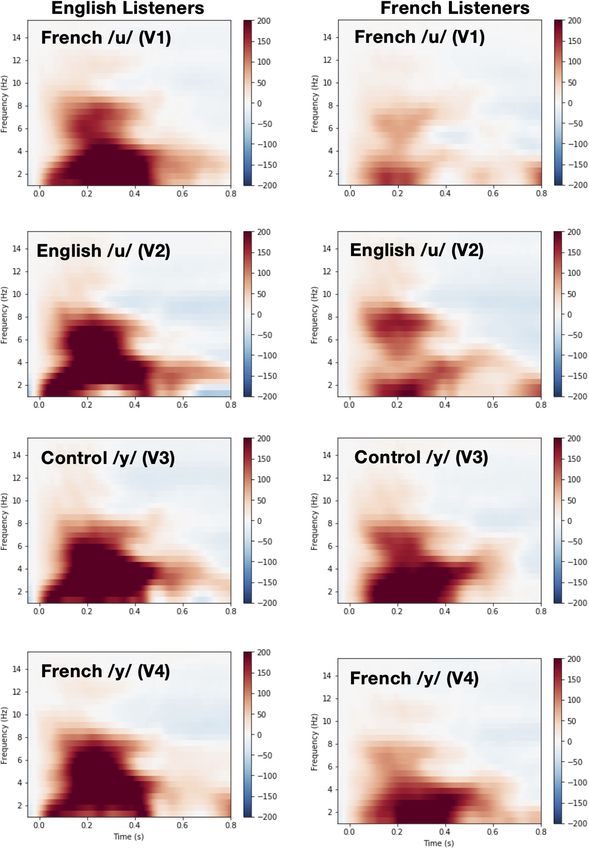
Polka et al.                                                                                                                                  Vowel Perception Asymmetries

  FIGURE 1 | Formant values for the vowel stimuli in F 1 –F 2 and F 2 –F 3 spaces. F 1 is related to the degree of constriction formed by the tongue in the vocal tract with
  lower F 1 values corresponding to a tighter constriction formed by a higher tongue position. F 2 is related to the location of the tongue constriction along the length of
  the vocal tract, with higher F 2 values corresponding to constrictions closer to the lips. Lip rounding (lip compression and protrusion) increases vocal tract length,
  which in turn, has the effect of lowering all formants, especially F 3 .

F 2 and F 3 (Figure 1, bottom panel). Table 1 gives the lower                             passive “multi-deviant oddball” task (Näätänen et al., 2004), as
formants [F 1 –F 3 (Hz)] and their corresponding bandwidths                               schematized in Figure 3. As shown in Figures 3A,B, different
for each vowel stimulus. Figure 2 schematizes the underlying                              from the multi-feature paradigm, we also made sure there were
perceptual vowel spaces for each language group [English (top)                            at least two standards prior to each deviant. Further, rather
vs. French (bottom)].                                                                     than assigning the role of standard to one specific stimulus
                                                                                          alone and the role of deviant to the other (remaining) stimuli
Procedure and Design                                                                      of interest, as is typically done, all the vowels were presented
Vowel perception was assessed with ERPs. The stimuli were                                 both as standards and as deviants across the four different
presented across four different experimental blocks using a                               presentation blocks. This provided a way to control for potential

Frontiers in Human Neuroscience | www.frontiersin.org                                 6                                              June 2021 | Volume 15 | Article 607148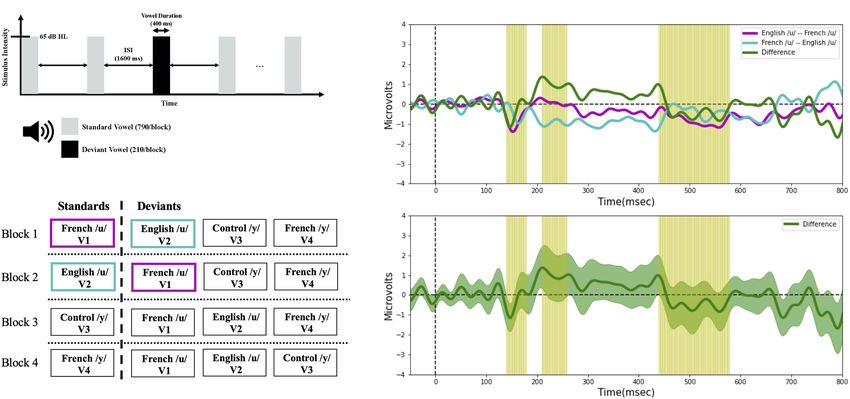
Polka et al.                                                                                                                   Vowel Perception Asymmetries

TABLE 1 | Formant frequency and bandwidth (Hz) for the lower formants (F1, F2,       (0.4–40, 0.4–100 Hz) were also computed. They resulted in the
and F3) for each vowel stimulus.
                                                                                     same findings reported here, but data included more noise.
Stimulus             F1          F2          F3         B1        B2        B3          Event-related potentials were time-locked to vowel onset
                                                                                     and were computed separately for the standard and deviant
French/u/(V1)       275         745         2522        85        30        35       conditions of each vowel. Only the standard immediately
English/u/(V2)      300         979         2522        85        30        35       preceding a deviant stimulus was included in the calculation of
Control/y/(V3)      300        1597         2522        85        30        35       ERPs for standards in order to use the same number of stimuli
French/y/(V4)       275        2011         2522        85        30        35       in forming the standard and the deviant. The epochs were 850-
                                                                                     ms long (-50 ms pre-stimulus and 800 ms post-stimulus onset)
                                                                                     and were baseline corrected to the time period from 50 ms of
differences in the N1 and P2 components (which overlap with the                      pre-stimulus onset to 50 ms of post-stimulus activity. We opted
MMN) due to physical differences among the evoking stimuli.                          for this baseline correction (instead of the typical –100 ms to 0)
Within each block (in Figure 3B), a standard vowel alternated                        because there was a 50 ms (±4 ms) silence at the beginning of
with three deviant vowels that differed in their first and second                    each sound file that we had realized once the experiment was
formant frequencies. The sequences of the four blocks were                           completed. Future studies that wish to replicate our procedure
counter-balanced across subjects and language groups (English                        should select time windows based on the actual stimulus onset,
vs. French). The deviant and standard ratio was roughly 20:80                        not the specific values reported here. Figure 4 shows the obtained
(each block contained 1,000 stimuli; 790 standards, 210 deviants                     ERP responses to each vowel token (V1 vs. V2 vs. V3 vs.
[70 of each deviant vowel token]), and the inter-stimulus                            V4) when presented in the contextual role of standard versus
interval (ISI) was 1,600 ms. Within each block, deviants and                         deviant for each language group [English (left panels) vs. French
standards were presented in a pseudo-random order ensuring                           (right panels)].
that at least two standards preceded each deviant. During the
recording sessions, participants sat in a comfortable armchair                       Mismatch Negativity Response Analyses
in an electrically shielded sound-attenuated booth and watched                       A directional asymmetry is essentially a context effect, i.e., a
a silent movie under the instruction to ignore the stimuli. The                      difference found when the same stimuli are presented in a
stimulus output intensity was 65 decibels in hearing level (dB HL)                   different order (or context). In behavioral discrimination tasks,
and delivered to both ears through insert earphones (Etymotic                        directional asymmetries are assessed by comparing outcome
Research). The experimental sessions lasted approximately 3.5 h                      measures (e.g., accuracy) across different orders (AB vs. BA).
including preparation time (approximately 40 min) and breaks                         With ERP recordings, we can track neural processing of the
(approximately 30 min).                                                              individual stimuli within a sequence, which allows us to examine
                                                                                     order/context effects at a deeper level. This was optimized by the
                                                                                     current study design which ensured that subjects were presented
EEG Recording
                                                                                     each vowel within a pair as the deviant and also as a standard.
EEG data were continuously recorded (500 Hz/32 bit sampling
                                                                                     For example, for vowel pair V1–V2, we can ask whether the
rate; Neuroscan Synamps2 amplifier) from 20 sites on the
                                                                                     processing of V1 is different (faster, stronger) when it follows V2
scalp with cap-mounted Ag-Ag/Cl electrodes (Electro-cap
                                                                                     (serving as the deviant) than when it proceeds V2 (serving as the
International, Inc., Eaton, OH, United States), based on the
                                                                                     standard). With this in mind, MMN waveforms were calculated
international 10–20 system of electrode placement: Fp1/2, F7/8,
                                                                                     by subtracting standard ERPs from deviant ERPs of the same
F3/4, T3/4, C3/4, T5/6, P3/4, O1/2, Fpz, Fz, Cz, Pz, and Oz. Eye
                                                                                     vowel, which allows us to target the context effects. For example,
movements and blinks were detected using electro-oculography
                                                                                     in the present study, to characterize the neural processing of the
(EOG). Vertical and horizontal EOG were recorded from bipolar
                                                                                     V1–V2 vowel pair we first calculated two MMN responses. The
electrodes placed above and below the left eye, and at the
                                                                                     first MMN indexes the processing of V1 (in context of V2); to
outer corner of each eye, respectively. All EEG electrodes were
                                                                                     do so we took the ERPs recorded when V1 was the deviant (and
referenced against the right mastoid, and an electrode located
                                                                                     V2 was the standard) minus the ERPs recorded when V1 was
between Fz and Fpz provided the ground. Electrode impedances
                                                                                     the standard (and V2 was the deviant); the result is plotted in
were kept under 3 kOhm.
                                                                                     Figure 3C (purple line). The second (or reverse) MMN indexes
                                                                                     the processing of V2 (in the context of V1); to do so we took
Data Preprocessing and Analysis                                                      the ERPs recorded when V2 was the deviant (and V1 was the
EEG data were analyzed using Brain Vision Analyzer software                          standard) minus the ERPs recorded when V2 was the standard
(Brain Products GmbH, Germany), including offline band-pass                          (and V1 was the deviant); the result is plotted in Figure 3C
filtering (0.5–30 Hz) and artifact rejection with a ±50 microvolts                   (turquoise line).
(µV) deviation criterion at all channels except for Fp1 and Fp2,                         We then conducted two types of analyses to examine whether
which were clearly more affected by eye movements than the                           asymmetries emerged in the neurophysiological responses to
rest of the channels. Consequently, Fp1 and Fp2 were excluded                        each of the vowel pairs: (i) a hypothesis-based analysis focused to
from any further analysis and data processing. Artifact rejection                    examine possible directional effects on MMN responses in three
resulted in data loss within a range of 3.45 and 11.09% across                       a priori time windows identified in Molnar et al. (2013), and (ii)
participants. Note that analyses with other band-pass settings                       an exploratory temporal clustering analysis to reveal additional

Frontiers in Human Neuroscience | www.frontiersin.org                            7                                     June 2021 | Volume 15 | Article 607148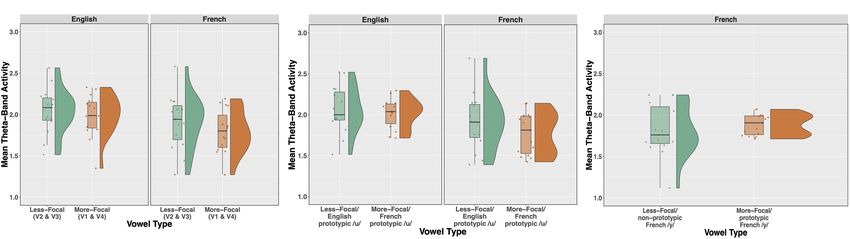
Polka et al.                                                                                                                              Vowel Perception Asymmetries

  FIGURE 2 | Schematic of the hypothesized relationship between physical (2D F 1 –F 2 formant) space and perceptual (prototype/category) space in the case of the
  current vowel stimuli for both English (left) and French (right) listeners (see text for explanation).

  FIGURE 3 | (A) Timeline of the stimulus presentation in the oddball task. (B) Schematic of the experimental design, and (C) example MMN waveforms. Four
  experimental blocks were presented to each participant in a randomized order. The color coding in panel (B,C) illustrates the ERP averaging technique applied in the
  current study. For example, to characterize the detection of V1 among V2 (i.e., V2 → V1 direction), the MMN (purple line) was calculated by subtracting the ERPs to
  French /u/ (V1) as deviant measured in a block where the English /u/ (V2) was the standard, from the ERPs to French /u/ (V1) as standard in a separate block.
  Conversely, to characterize the detection of V2 among V1 (i.e., V1 → V2 direction), the MMN (turquoise line) was calculated by subtracting the ERPs to
  English /u/ (V2) as deviant measured in a block where the French /u/ (V1) was the standard, from the ERPs to English /u/ (V2) as standard in a separate block. In this
  way, we obtained an average ERP for the standards and for the deviants that was unaffected by the physical characteristics of the stimuli, and only the oddball effect
  was present when comparing the standard and deviant waveforms. The same averaging technique was applied with the rest of the contrasts. To test for directional
  asymmetries in the MMN, difference waves (green line) were then computed by subtracting the MMN waveform for the two opposite stimulus orders (e.g., V2 → V1
  vs. V1 → V2); this is shown in the bottom panel of 3C with the green shaded region representing the standard error.

Frontiers in Human Neuroscience | www.frontiersin.org                               8                                             June 2021 | Volume 15 | Article 607148
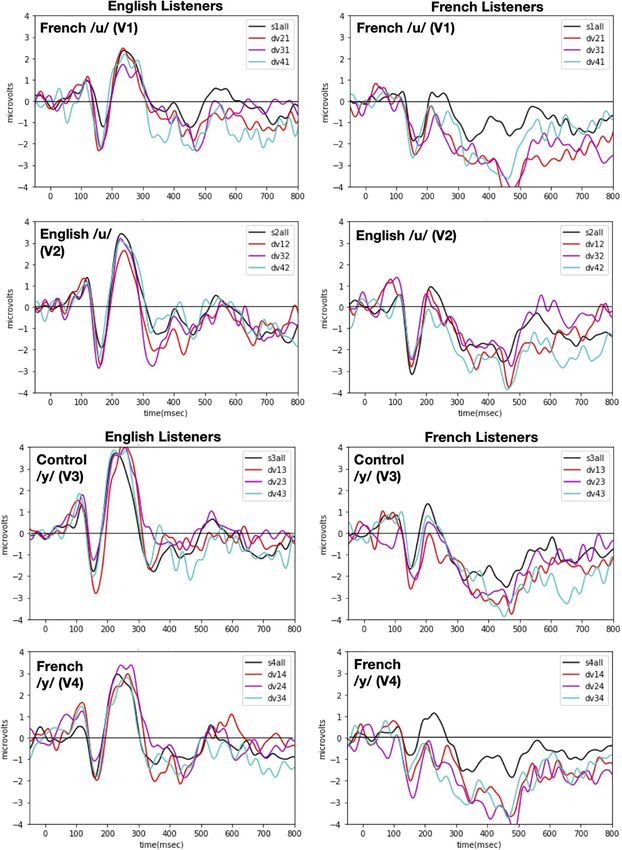
Polka et al.                                                                                                                              Vowel Perception Asymmetries

  FIGURE 4 | ERP responses recorded with each of the four vowel tokens as the standard (V1, V2, V3, and V4 from top panel to bottom panel) and for each language
  group (English Listeners: left panels and French Listeners: right panels). Each panel shows ERP responses recorded when one vowel (indicated in the left hand
  corner) was presented as the standard with each of the other vowels as the deviant. As indicated in the right hand corner, the deviants are plotted as different color
  lines and as a black line when all deviants are combined. Note: in labeling the waves, the first number designates the deviant vowel and the second number
  designates the standard, e.g., for dv21 and V2 is the deviant when V1 is the standard.

time windows where MMN responses may be asymmetrical                                    all the conditions across all the participants) on the Fz electrode,
within the entire epoch (Maris and Oostenveld, 2007). The time                          and corresponding to time points associated with the N1, MMN,
windows for the hypothesis-based analysis were selected by the                          and the late negativity. The visual inspection yielded three
visual inspection of the grand average waveforms (that included                         consecutive latency time windows: 140–180 ms, 210–260 ms,

Frontiers in Human Neuroscience | www.frontiersin.org                               9                                             June 2021 | Volume 15 | Article 607148
Polka et al.                                                                                                         Vowel Perception Asymmetries

and 440–580 ms. For each vowel pair (e.g., V1–V2) we then                  between 4 and 8 Hz. Repeated ANOVAs and paired-sample
computed the average MMN (V1 in context of V2) and reverse                 t-tests were then performed on the individual means to test
MMN (V2 in context of V1) value within each of these latency               for effects of formant proximity and stimulus prototypicality on
windows for each participant. These values were submitted to               theta activity. Greenhouse-Geisser corrections were applied when
separate analyses of variance (ANOVAs)–latency window (140–                appropriate and partial eta-squared (η2p ) was calculated for main
180 vs. 210–260 vs. 440–580 ms) × direction (MMN vs. reverse               effects and interactions.
MMN)–for each vowel pair (V1–V2, V1–V3, V1–V4, V2–V3,
V2–V4, and V3–V4).
   An additional hypothesis-based analysis, was conducted based            RESULTS
on the amplitude of the MMN difference wave computed by
subtracting the MMN waveforms for each vowel within a                      Mismatch Negativity Response Analyses
pair; the amplitude difference was computed at each latency                We assessed possible asymmetric patterns in the
window (140–180 vs. 210–260 vs. 440–580 ms). For example,                  neurophysiological responses to all six vowel pairs within
as shown for vowel pair V1–V2 in Figure 3C, the green line                 each language group and also cross-linguistically. Each of
represents the difference between the MMN for V1 (MMN                      the six vowel pairs fell into one of three stimulus types: (1)
above) and the MMN for V2 (reverse MMN above); the                         cross-category pairs (V1–V4 and V2–V4) with relatively large
green shaded area in the lower panel represents the standard               acoustic differences; (2) within-category pairs (V1–V2 and
error, and the yellow shading corresponds to the three latency             V3–V4) with relatively small acoustic differences; and (3) mixed-
windows. Within each language group, MMN difference waves                  category pairs (V1–V3 and V2–V3) with intermediate acoustic
were calculated for each of the six vowel pairs (V1–V2, V1–                differences. Figures 5–7 show the MMN results averaged across
V3, V1–V4, V2–V3, V2–V4, and V3–V4) and averaged across                    six electrode sites (F3, F4, Fz, C3, C4, and Cz) and plotted as
six electrode sites (F3, F4, Fz, C3, C4, and Cz). Within                   a function of language group (English vs. French) and vowel
each latency window, we averaged the values across the time                contrast (V1–V2; V2–V3;V3–V4; V1–V4; V2–V4; and V1–V3),
window for each participant and then submitted these values                grouped by stimulus type (cross-category vs. within-category
to separate mixed ANOVAs–latency window (140–180 vs. 210–                  vs. mixed-category; the dark green shaded area represents the
260 vs. 440–580 ms) × language group (English vs. French)–for              standard error, and the yellow shading corresponds to the
each vowel pair.                                                           three latency windows). The ANOVA results comparing the
   Finally, the exploratory temporal clustering analysis was               MMN waves in each direction for each of the three a priori
conducted to determine whether there were any additional                   latency windows are summarized in Table 2; none of the
latency windows (not tested in the aforementioned analysis) in             vowel pairs showed a main effect of direction or an interaction
which the MMN difference waves were significantly different                effect (p > 0.05). The ANOVA results comparing the MMN
from 0 (the value expected if there is no order/context effect)            difference waves for each language group and for each of the
within the entire epoch. This was a data-driven approach with no           three a priori latency windows are summarized in Table 3;
a priori hypotheses with regard to the latency window(s) where             none of the vowel pairs showed any main or interaction effects
the difference waveforms would significantly differ from 0 µV              (p > 0.05). The temporal cluster analyses also failed to reveal
(see Maris and Oostenveld, 2007). Specifically, we deployed the            asymmetric MMN response in other temporal windows, except
threshold-free cluster enhancement (TFCE) extension method                 for a small region of the MMN response to the V2–V3 vowel pair
(Smith and Nichols, 2009) which allows for improved sensitivity,           (described below).
but more interpretable output than traditional cluster-based                   Cross-category pairs (Figure 5). For the cross-category (/u-
thresholding. First, the TFCE values were generated by summing             y/) vowel pairs (V1–V4 and V2–V4), recall the following NRV
across a series of thresholds, thus avoiding selecting an arbituary        predictions: (1) for non-native (English) listeners, the MMN
threshold and then the p values for each time sample were                  response will be greater (and/or earlier) when the more focal
calculated through permutation. The analysis was performed                 variants (V1 and V4) serve as the deviant stimulus, whereas (2)
using the TFCE cluster test with a start = 0, step = 0.01,                 for native (French) listeners, vowel processing for cross-category
and 3,000 permutations, implemented in MNE python software                 pairs is predicted to be more symmetrical. No reliable asymmetry
(Gramfort et al., 2014).                                                   was found for either vowel pair in any of the pre-selected
                                                                           latency windows for either language group. No additional
Time-Frequency Analysis                                                    significant time windows were revealed by the exploratory
Finally, to characterize theta activity (4–8 Hz) during vowel              temporal cluster analyses.
processing, we conducted time-frequency analyses on the ERPs of                Within-category pairs (Figure 6). For the within-category pairs
the standard trials for each vowel, using the multi-taper method           (V1–V2 and V3–V4), recall that NRV predicts that the MMN
implemented in MNE python (Gramfort et al., 2014). Similar                 response will be greater (and/or earlier) when the more focal
to the MMN analyses, the ERPs of the standard trials were                  variants (V1 and V4) serve as the deviant stimulus compared
also averaged across the F3, F4, Fz, C3, C4, and Cz electrode              to the reverse, regardless of native language. In contrast, NLM
sites. The mean theta-band activity for each vowel and each                predicts that the MMN response will be greater (and/or earlier)
participant was further extracted by averaging across the time             when the more prototypical variant of a native vowel category
window between 0 and 600 ms and across the frequency band                  serves as the deviant stimulus compared to the reverse. According

Frontiers in Human Neuroscience | www.frontiersin.org                 10                                     June 2021 | Volume 15 | Article 607148
Polka et al. Vowel Perception Asymmetries FIGURE 5 | Mismatch negativities (as described in Figure 3C) for each stimulus type: Cross-category pairs, the mean MMNs for each stimulus presentation order (purple and turquoise lines) and difference waveform (green lines) (in the top half of each panel) and the difference waveform plotted with the standard error for the group (as the dark green shaded region) in the bottom half of each panel. The light green shading indicates the pre-selected time windows used in the hypothesis-based anayses. The MMNs are plotted for each language group wth English Listeners on the left and French Listeners on the right. The vowel pair for each MMN is indicated in the legend at right hand corner of each panel with the standard followed by the deviant (e.g., French /y/ – French /u/ denotes an MMN with French /u/ (V1) as the deviant in the context of French /y/ (V4) as standard). to this view, the MMN is expected to be stronger in the English windows. However, for the V3–V4 pair in the 210–260 ms listeners when V2 serves as the deviant among V1 standards, time window, the difference wave was significantly above 0 whereas for the French listeners, the MMN is expected to be [t(14) = 2.20, p = 0.04], such that the MMN was stronger in stronger in the French listeners when V1 serves as the deviant the French group when V4 was the deviant compared to when among V2 standards and when V4 serves as the deviant among V3 was the deviant). This finding is consistent with both NRV V3 standards. Although there was a trend for the MMN responses and NLM since the French prototypic /y/ (V4) is more focal to pattern in the manner predicted by NLM across both language (between F 2 and F 3 ) than the non-prototypic French /y/ (V3). groups for the V1–V2 vowel pair, these differences did not No additional significant time windows were revealed by the reach statistical significance in any of the predetermined latency cluster analyses. Frontiers in Human Neuroscience | www.frontiersin.org 11 June 2021 | Volume 15 | Article 607148
Polka et al.                                                                                                                              Vowel Perception Asymmetries

  FIGURE 6 | Mismatch negativities (as described in Figure 3C) for each stimulus type: Within-category pairs, the mean MMNs for each stimulus presentation order
  (purple and turquoise lines) and difference waveform (green lines) (in the top half of each panel) and the difference waveform plotted with the standard error for the
  group (as the dark green shaded region) in the bottom half of each panel. The light green shading indicates the pre-selected time windows used in the
  hypothesis-based anayses. The MMNs are plotted for each language group wth English Listeners on the left and French Listeners on the right. The vowel pair for
  each MMN is indicated in the legend at right hand corner of each panel with the standard followed by the deviant (e.g., French /y/ – French /u/ denotes an MMN with
  French /u/ (V1) as the deviant in the context of French /y/ (V4) as standard).

   Mixed-category pairs (Figure 7). For the mixed-category pairs                        using pre-selected time windows. However, the exploratory,
(V2–V3 and V1–V3), NRV predicts that the MMN response will                              temporal cluster permutation tests revealed an asymmetric MMN
be greater when the more focal stimulus (V1 and V2) serves as                           response between V2 and V3 or both English and French listeners
the deviant compared to the reverse. NLM would predict that                             but in opposite directions. For the English group, the time
the MMN should be greater in the English group (in which V1,                            windows between 292–300 and 324–334 ms in the difference
V2, and V3 are perceived as variants of the native /u/ category)                        wave were significantly below 0 (p < 0.05), whereas for the French
when V2 serves as the deviant among V3 standards since V2 is the                        group, the time window in the difference wave between 66 and
category prototype. Here, no significant asymmetries were found                         104 ms was significantly above 0 (p < 0.05). These asymmetries
for either vowel contrast for either language group in the analyses                     do not align across language groups; for the English group, the

Frontiers in Human Neuroscience | www.frontiersin.org                              12                                             June 2021 | Volume 15 | Article 607148
Polka et al.                                                                                                                              Vowel Perception Asymmetries

  FIGURE 7 | Mismatch negativities (as described in Figure 3C) for each stimulus type: Mixed-category pairs. the mean MMNs for each stimulus presentation order
  (purple and turquoise lines) and difference waveform (green lines) (in the top half of each panel) and the difference waveform plotted with the standard error for the
  group (as the dark green shaded region) in the bottom half of each panel. The light green shading indicates the pre-selected time windows used in the
  hypothesis-based anayses. The MMNs are plotted for each language group wth English Listeners on the left and French Listeners on the right. The vowel pair for
  each MMN is indicated in the legend at right hand corner of each panel with the standard followed by the deviant (e.g., French /y/ – French /u/ denotes an MMN with
  French /u/ (V1) as the deviant in the context of French /y/ (V4) as standard).

MMN was stronger when the stimuli were presented in the                                 cluster enhancement method that we applied is designed to
direction going from V3 to V2, whereas for the French group,                            isolate meaningful, non-random effects, through a data-driven
the MMN was stronger when the stimuli were presented in the                             approach. Given that the time windows tagged to have significant
direction going from V2 to V3. While the English results may be                         asymmetries using this method are quite short and also do not
interpreted as a prototype effect, neither NRV nor NLM explicitly                       temporally align across the language groups these results should
predicted the directional effect observed in the French group.                          be interpreted with caution. These MMN findings alone do not
   Overall, both the hypothesis-based and the exploratory                               provide sufficient evidence to draw conclusions about the neural
analyses failed to provide evidence that the MMN responses                              processes that underlie the asymmetries in vowel processing that
to these vowel stimuli are asymmetric. The threshold-free                               are observed in behavior.

Frontiers in Human Neuroscience | www.frontiersin.org                              13                                             June 2021 | Volume 15 | Article 607148
Polka et al.                                                                                                                         Vowel Perception Asymmetries

TABLE 2 | Repeated measures an analysis of variance (ANOVA) on mismatch negativities (MMN) amplitude presented for each stimulus type (cross-category vs.
within-category vs. mixed-category).

Effect                                                     F                          df                              p                                   np2

Cross-category pairs

Vowel pair: more-focal French/u/(V1) vs. more-focal French/y/(V4)

Latency window                                           1.497                         2                           0.233                                 0.049
Direction                                                0.003                         1                           0.954
Polka et al.                                                                                                                         Vowel Perception Asymmetries

TABLE 3 | Mixed ANOVA on MMN Amplitude difference (MMN minus reversed MMN) for each stimulus type (cross-category vs. within-category vs. mixed-category).

Effect                                                   F                           df                           p                                    np2

Cross-category pairs

Vowel pair: more-focal French/u/(V1) vs. more-focal French/y/(V4)

Latency window                                        1.542                          2                          0.224                                 0.052
Language group                                        0.718                          1                          0.404                                 0.025
Latency window × Group                                0.148                          2                          0.856                                 0.005

Vowel pair: less-focal English/u/(V2) vs. more-focal French/y/(V4)

Latency window                                        0.802                          2                          0.451                                 0.028
Language group                                        1.308                          1                          0.262                                 0.045
Latency window × Group                                2.067                          2                          0.137                                 0.069
With in-category pairs

Vowel pair: more-focal French/u/(V1) vs. less-focal English/u/(V2)

Latency window                                        1.279                          2                          0.285                                 0.044
Language group                                        0.354                          1                          0.557                                 0.012
Latency window × Group                                0.349                          2                          0.683                                 0.012

Vowel pair: less-focal/control/y/(V3) vs. more-focal/control/y/(V4)

Latency window                                        2.253                          2                          0.12                                  0.074
Language group                                        1.554                          1                          0.223                                 0.053
Latency window × Group                                0.094                          2                          0.894                                 0.003
Mixed-category pairs

Vowel pair: less-focal English/u/(V2) vs. more-focal control French/y/(V3)

Latency window                                        0.431                          2                          0.618                                 0.015
Language group                                        0.823                          1                          0.372                                 0.029
Latency window × Group                                2.176                          2                          0.132                                 0.072

Vowel pair: more-focal French/u/(V1) vs. more-focal control French/y/(V3)

Latency window                                        2.185                          2                          0.122                                 0.072
Language group                                        0.002                          1                          0.965
Polka et al.                                                                                                                           Vowel Perception Asymmetries

  FIGURE 8 | Time-Frequency plots showing brain oscillations for each vowel during pre-deviant standard trials (averaged across the F3, F4, Fz, C3, C4, and Cz
  electrode sites, 0–600 ms time window and between 4 and 8 Hz) and for each language group [English (left panel) vs. French (right panel)].

2011), and/or stimulus prototypicality, as predicted by the NLM                       French-speaking adults. Recent behavioral research using very
model (Kuhl, 1991; Kuhl et al., 2008)? To address this, we focused                    similar /u/ stimuli (Masapollo et al., 2015, 2017a; Liu et al., 2021)
on the MMN and theta brain rhythms elicited in response to                            has shown directional asymmetries that are consistent with NRV
cross-category and within-category vowel pairs by English- and                        when acoustic differences are relatively large, and that follow

Frontiers in Human Neuroscience | www.frontiersin.org                            16                                           June 2021 | Volume 15 | Article 607148
You can also read


