Zero-Emission Bus Rollout Plan - February 2021 Prepared for: Prepared By: SFMTA
←
→
Page content transcription
If your browser does not render page correctly, please read the page content below
SFMTA Zero-Emission Bus Rollout 1

         Zero-Emission Bus
         Rollout Plan

Prepared for:

Prepared By:

February 2021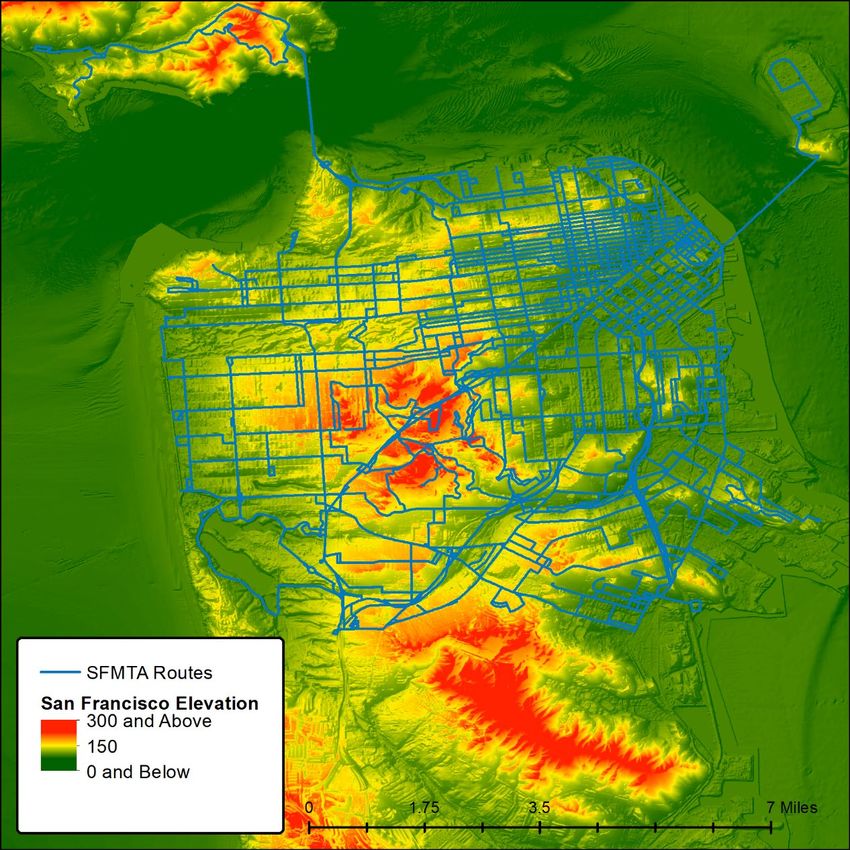
SFMTA Zero-Emission Bus Rollout 2

Table of Contents
1    Rollout Plan Summary ....................................................................... 5
2    Introduction ........................................................................................ 6
     2.1     Background .......................................................................................................................... 6
     2.2     Rollout Plan Approach ....................................................................................................... 14
     2.3     Rollout Plan Structure ........................................................................................................ 14

3    Fleet and Acquisitions ..................................................................... 15
     3.1     Existing Bus Fleet .............................................................................................................. 15
     3.2     Procurement Schedule....................................................................................................... 17

4    Facilities and Infrastructure Modifications .................................... 20
     4.1     Overview of Existing Facilities............................................................................................ 20
     4.2     ZEB Facility and Infrastructure Strategy ............................................................................ 21
     4.3     ZEB Transition.................................................................................................................... 23
     4.4     Transition Considerations .................................................................................................. 24
     4.5     Summary of Yard Enhancements ...................................................................................... 27

5    Equity Considerations ..................................................................... 50
     5.1     Disadvantaged Communities ............................................................................................. 50
     5.2     Summary of The SFMTA’s DACs ...................................................................................... 50

6    Workforce Training .......................................................................... 53
     6.1     Training Requirements ....................................................................................................... 53

7    Costs and Funding Opportunities .................................................. 55
     7.1     Preliminary Capital Expenditure Costs .............................................................................. 55
     7.2     Potential Funding Sources ................................................................................................. 56

8    Start-Up and Scale-Up Challenges ................................................. 58
Appendices
Appendix A – The SFMTA’s Board Resolution
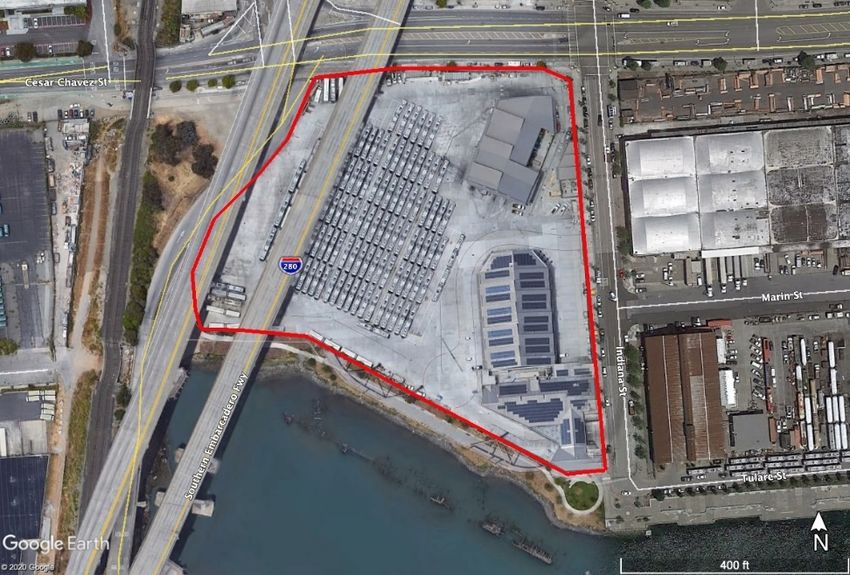
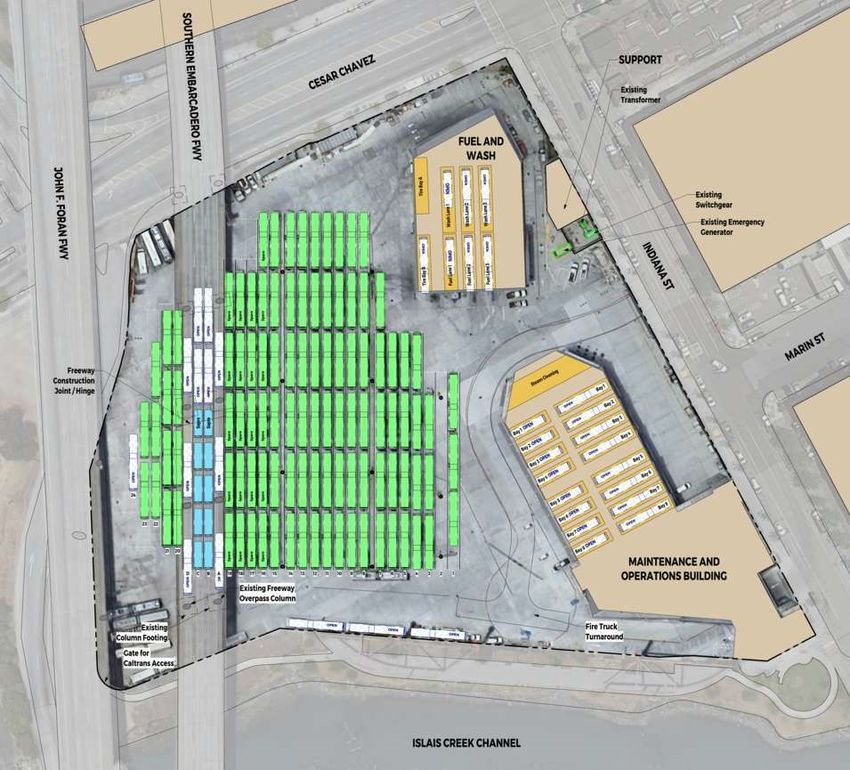
SFMTA Zero-Emission Bus Rollout 3

List of Figures
Figure 2-1. Plug-In and Pantograph Charging ............................................................................................ 7
Figure 2-2. SFMTA System Map .............................................................................................................. 10
Figure 2-3. San Francisco Service and Elevation Profile ......................................................................... 11
Figure 2-4. Vehicle Block 1005 Elevation Change ................................................................................... 12
Figure 3-1. Inverted Pantograph and Charge Rails .................................................................................. 17
Figure 3-2. Percentage of ZEB and Fossil Fuel Fleet (2020-2040) .......................................................... 19
Figure 4-1. The SFMTA’s Bus Yards ........................................................................................................ 21
Figure 4-2. Inverted Pantographs and Modular Support Structure ........................................................... 22
Figure 4-3. SFMTA Staging Example ....................................................................................................... 24
Figure 4-4. Conceptual Schedule ............................................................................................................. 26
Figure 4-5. Flynn Yard - Existing Conditions (Aerial) ................................................................................ 28
Figure 4-6. Flynn Yard - Existing Conditions (Site Plan) .......................................................................... 29
Figure 4-7. Flynn Yard - Full ZEB Build-Out ............................................................................................. 30
Figure 4-8. Islais Creek Yard - Existing Conditions (Aerial)...................................................................... 32
Figure 4-9. Islais Creek Yard - Existing Conditions (Site Plan) ................................................................ 33
Figure 4-10. Islais Creek Yard - Full ZEB Build-Out ................................................................................. 35
Figure 4-11. Kirkland Yard - Existing Conditions (Aerial) ......................................................................... 37
Figure 4-12. Kirkland Yard - Existing Conditions (Site Plan) .................................................................... 38
Figure 4-13. Kirkland Yard - Full ZEB Build-Out ....................................................................................... 39
Figure 4-14. Potrero Yard - Existing Conditions (Aerial)........................................................................... 41
Figure 4-15. Presidio Yard - Existing Conditions (Aerial) ......................................................................... 43
Figure 4-16. Woods Yard - Existing Conditions (Aerial) ........................................................................... 45
Figure 4-17. Woods Yard - Existing Conditions (Site Plan) ...................................................................... 46
Figure 4-18. Woods Yard - Full ZEB Build-Out ......................................................................................... 48
Figure 5-1. The SFMTA’s Disadvantaged Communities and Bus Yards .................................................. 52

List of Tables
Table 3-1. Summary of the SFMTA’s Existing Bus Fleet.......................................................................... 15
Table 3-2. Summary of the SFMTA’s Future Bus Purchases (Through 2040) ......................................... 18
Table 4-1. Summary of Existing Yards and Fleets ................................................................................... 20
Table 4-2. SFMTA ZEB Yard Summary.................................................................................................... 27
Table 4-3. Flynn Yard ZEB Infrastructure Summary ................................................................................. 29
Table 4-4. Islais Creek Yard ZEB Infrastructure Summary....................................................................... 34
Table 4-5. Kirkland Yard ZEB Infrastructure Summary ............................................................................ 38
Table 4-6. Potrero Yard ZEB Infrastructure Summary .............................................................................. 41
Table 4-7. Presidio Yard ZEB Infrastructure Summary ............................................................................ 43
Table 4-8. Woods Yard ZEB Infrastructure Summary .............................................................................. 47
Table 5-1. The SFMTA’s Disadvantaged Communities - Yard Summary ................................................ 51
Table 5-2. The SFMTA’s Disadvantaged Communities - Route Summary .............................................. 51
Table 6-1. Zero-Emission Bus Training Modules (Sample) ...................................................................... 53
Table 7-1. Preliminary Capital Expenditure Estimates by Yard ................................................................ 56
Table 7-2. ZEB Funding Opportunities ..................................................................................................... 56
SFMTA Zero-Emission Bus Rollout 4

Acronyms & Abbreviations
BEB       Battery Electric Bus

CalEPA    California Environmental Protection Agency

CARB      California Air Resources Board

CEQA      California Environmental Quality Act

CNG       Compressed Natural Gas

DAC       Disadvantaged Community

dHEB      Diesel-Hybrid Electric Bus

FCEB      Fuel Cell Electric Bus

ICEB      Internal Combustion Engine Bus

ICT       Innovative Clean Transit

kW(h)     Kilowatt (hour)

MME       Muni Metro East

O&M       Operations & Maintenance

OCS       Overhead Catenary System

PG&E      Pacific Gas & Electric

RNG       Renewable Natural Gas

SMR       Steam-Methane Reform

SFPUC     San Francisco Public Utilities Commission

SFMTA     San Francisco Municipal Transportation Agency

FTA       Federal Transit Administration

WDT       Wholesale Distribution Tariff

ZE        Zero-Emission

ZEB       Zero-Emission Bus
SFMTA Zero-Emission Bus Rollout 5

1 Rollout Plan Summary
                                                         Agency Background
Transit Agency’s Name                                                 San Francisco Municipal Transportation Agency
Mailing Address                                                       1 S. Van Ness Avenue
                                                                      San Francisco, CA 94105
Transit Agency’s Air District                                         Bay Area Air Quality Management District
Transit Agency’s Air Basin                                            San Francisco
Total number of Buses in Annual Maximum Service                        680 1
Urbanized Area                                                        San Francisco - Oakland
Population of Urbanized Area                                          3,557,982 2
Contact information of general manager, chief operating Jeffrey Tumlin
officer, or equivalent                                  Director of Transportation
                                                        415.646.2522
                                                        jeffrey.tumlin@sfmta.com
                                                         Rollout Plan Content
                                                     3                No
Is your transit agency part of a Joint Group
Is your transit agency submitting a separate Rollout      N/A
Plan specific to your agency, or will one Rollout Plan be
submitted for all participating members of the Joint
Group?
Please provide a complete list of the transit agencies                N/A
that are members of the Joint Group (optional)
Contact information of general manager, chief operating N/A
officer, or equivalent staff member for each participating
transit agency member
Does Rollout Plan have a goal of full transition to ZE                Yes
technology by 2040 that avoids early retirement of
conventional transit buses?
                                          Rollout Plan Development and Approval
Rollout Plan’s approval date                                          03.18.21
Resolution No.                                                        XXXX
Is copy of Board-approved resolution attached to the                  Yes (Appendix A)
Rollout Plan?
Contact for Rollout Plan follow-up questions                          Bhavin Khatri, PE, PMP
                                                                      Zero Emission Program Manager
                                                                      415.646.2586
                                                                      bhavin.khatri@sfmta.com
Who created the Rollout Plan?                                         Consultant
Consultant                                                            WSP

1
  This is based on January 2020 (pre-COVID) service.
2
  ACS 2019 (https://censusreporter.org/profiles/40000US78904-san-francisco-oakland-ca-urbanized-area/)
3
  The ICT regulation defines a Joint ZEB Group or Joint Group (13 CCR § 2023.2) as two or more transit agencies that choose to
form a group to comply collectively with the ZEB requirements of section 2023.1 of the ICT regulation.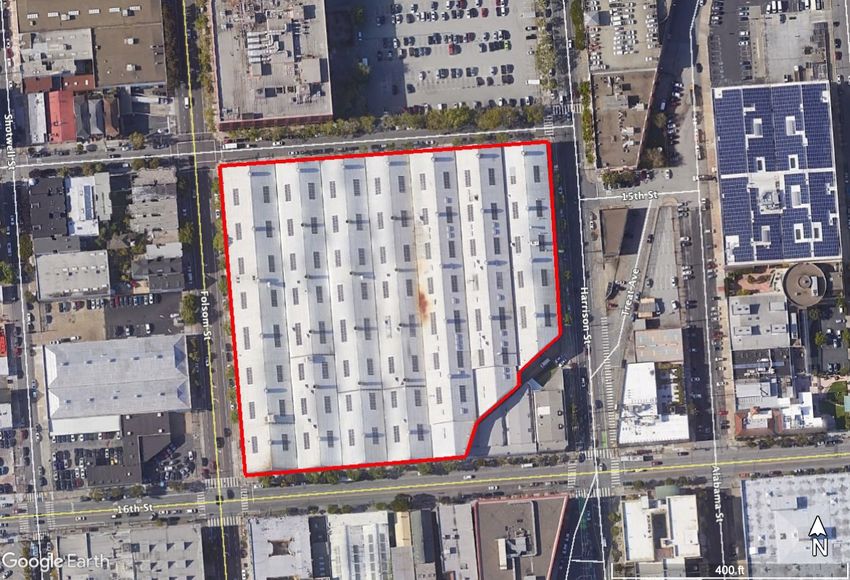
SFMTA Zero-Emission Bus Rollout 6

2 Introduction
In accordance with the California Air Resource Board’s (CARB) Innovative Clean Transit regulation (ICT
regulation), the following report serves as the San Francisco Municipal Transportation Agency’s (SFMTA)
Rollout Plan to transition its bus fleet to 100% zero-emission (ZE) by 2040.

2.1     Background
2.1.1   California Air Resource Board’s Innovative Clean Transit Regulation
Effective October 1, 2019, the ICT regulation requires all public transit agencies in the state to transition
from internal combustion engine buses (ICEBs) to zero-emission buses (ZEBs), such as battery-electric
(BEB) or fuel cell electric (FCEB), by 2040. The regulation requires a progressive increase of an agency’s
new bus purchases to be ZEBs based on its fleet size.

To ensure that each agency has a strategy to comply with the 2040 requirement, the ICT regulation
requires each agency, or a coalition of agencies, to submit a ZEB Rollout Plan before purchase
requirements take effect. The Rollout Plan is considered a living document and is meant to guide the
implementation of ZEB fleets and help transit agencies work through many of the potential challenges
and explore solutions. Each Rollout Plan must include several required components and must be
approved by the transit agency’s governing body through the adoption of a resolution, prior to submission
to CARB.

According to the ICT regulation, each agency’s requirements are based on its classification as either a
“Large” or “Small” transit agency. The ICT defines a Large Transit Agency as an agency that operates in
the South Coast or the San Joaquin Valley Air Basin and operates more than 65 buses in annual
maximum service or it operates outside of these regions, but in an urbanized area with a population of at
least 200,000 and has at least 100 buses in annual maximum service. A Small Transit Agency is an
agency that doesn’t meet the above criteria.

The SFMTA, as a Large Transit Agency must comply with the following requirements:

        July 1, 2020 – Board of Directors (Board) approved Rollout Plan must be submitted to CARB

        January 1, 2023 – 25% of all new bus purchases must be ZE

        January 1, 2026 – 50% of all new bus purchases must be ZE

        January 1, 2029 – 100% of all new bus purchases must be ZE

        January 1, 2040 – 100% of fleet must be ZE

        March 2021 – March 2050 – Annual compliance report due to CARB

Due to the impacts of COVID-19, the SFMTA requested and was granted an extension for the submission
of the Rollout Plan to March 31, 2021. The purpose of this request was to ensure that critical items such
as the SFMTA’s direction and decisions on trolley buses, yard rebuilds, and future funding were included
in the analysis to define the framework of its ZEB transition more accurately.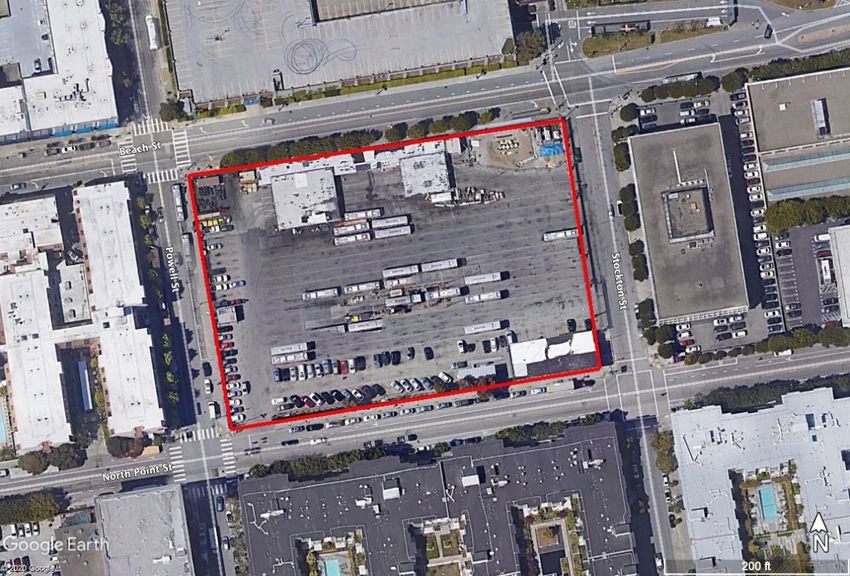
SFMTA Zero-Emission Bus Rollout 7

2.1.2      Zero-Emission Bus Technologies
According to the ICT regulation, a ZEB is a bus with zero tailpipe emissions and is either a BEB or a
FCEB. The following subsections provide a brief overview of each technology and how they compare to
ICEBs. While both BEB and FCEB technologies provide ZE benefits, the feasibility and viability of their
application is largely based on an agency’s service and operational parameters. The following provides a
brief overview of BEB and FCEB technologies.

Battery-Electric Buses (BEBs)
BEBs use onboard batteries to store and distribute energy to power an electric motor and other onboard
systems. Similar to many other battery-powered products, BEBs must be charged for a period of time to
be operational.

BEB charging technology exists to charge vehicles at the yard (overnight or midday) or on-route (typically
during layovers). A yard charging strategy typically consists of buses with high-capacity (kilowatt-hour or
kWh) battery packs that are charged for four to eight hours with “slow” chargers - usually less than 100
kilowatts (kW) – while being stored overnight. An on-route charging strategy typically consists of buses
with low-capacity battery packs that are charged with “fast” chargers – usually in excess of 100 kW –
during bus layovers (typically 5-20 minutes). BEBs are charged via several dispenser types (conductive
and inductive) and orientations (overhead or ground-mounted). The most common dispensers in the U.S.
market are plug-in and pantographs, as presented in Figure 2-1.

                                             Figure 2-1. Plug-In and Pantograph Charging

Sources: YorkMix (Left) and ABB (formerly ASEA Brown Boveri) (Right)

Under existing conditions, BEBs cannot meet the ranges that ICEBs can. BEBs typically have a range of
125-150 miles, which is highly dependent on a myriad of factors, including climate, driving behavior, and
topography. For this reason, if an agency’s service blocks cannot be completed with BEBs, other capital-
intensive strategies may be needed to meet range requirements, including, but not limited to additional
BEBs, on-route charging infrastructure, service changes, and/or a mixed-fleet strategy with the
incorporation of FCEBs.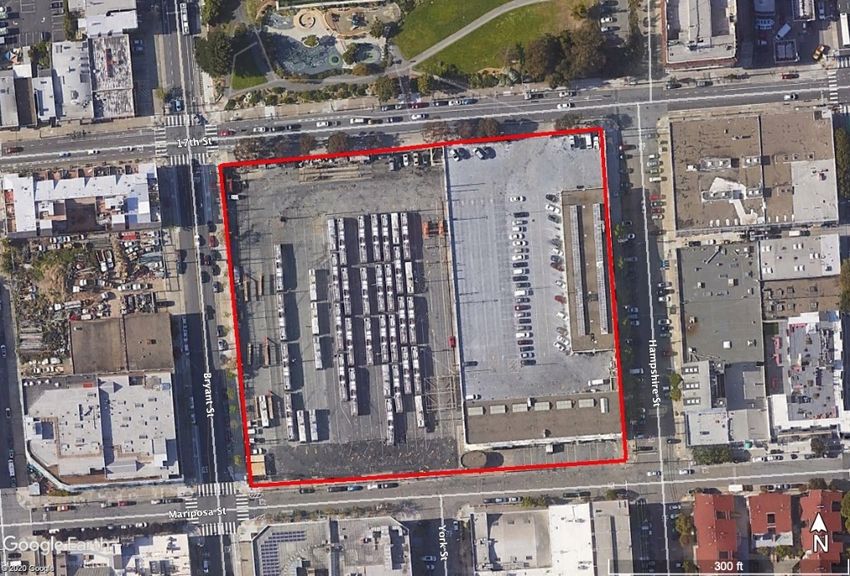
SFMTA Zero-Emission Bus Rollout 8

Fuel Cell Electric Buses (FCEBs)
FCEBs can typically replace ICEBs at a 1:1 replacement ratio without significant changes to operations
and service. A FCEB uses hydrogen and oxygen to produce electricity through an electrochemical
reaction to power the propulsion system and auxiliary equipment. This ZE process has only water vapor
as a byproduct. The fuel cell is generally used in conjunction with a battery, which supplements the fuel
cell’s power during peak loads and stores electricity that is recaptured through regenerative braking,
allowing for better fuel economy.

The process, operations, and equipment used to refuel hydrogen buses is similar to “lighter-than-air” fuels
such as compressed natural gas (CNG). Typically, hydrogen is produced via steam-methane reform
(SMR) or electrolysis. SMR, the most common method of producing hydrogen, uses high-pressure steam
to produce hydrogen from a methane source, such as natural gas. Electrolysis, on the other hand, uses
an electric current to decompose water into hydrogen and oxygen. After the hydrogen is produced, it can
be delivered to the site via pipeline or delivered by a truck (as either a gas or liquid). Hydrogen is then
stored, compressed, and dispensed to the buses on-site. Depending on space availability and resources,
some agencies can produce hydrogen on-site.

Some of the most pressing challenges for FCEB operations is the limited supply network and the amount
of energy, space, and high capital costs required to isolate, compress, and store hydrogen. Also, if
renewable natural gas (RNG) - such as methane capture from organic matter – is not used as an
alternative to natural gas via SMR operations, there are some concerns that FCEBs may not be the most
sustainable vehicle to achieve GHG targets.

2.1.3   ZEB Suitability for the SFMTA’s Service and Operations

The choice between adopting BEBs or FCEBs is contingent on the unique needs and conditions of an
agency. Several variables need to be factored into this decision, including costs associated with bus
acquisitions and associated infrastructure, spatial requirements, energy/fuel costs, and community
acceptance. Based on existing conditions and the stated variables, BEBs appear to be the most suitable
technology for the SFMTA to meet the requirements of the ICT regulation. The following provides a brief
summary of the main findings of this analysis:

BEBs are more affordable than FCEBs at this time. There are barriers to entry for both BEBs and
FCEBs, with both technologies exceeding the cost ICEBs. However, BEBs have achieved better
economies of scale and are currently significantly less expensive than FCEBs.

The SFMTA’s bus facilities are too space-constrained to accommodate FCEB-supporting
infrastructure. Infrastructure to support BEBs (charging cabinets, dispensers, and associated utility
equipment) can all be contained within the SFMTA’s yard (either elevated or ground-mounted). In
contrast, the infrastructure required for FCEBs (storage tanks, dispensers, etc.) requires a large footprint
due to sizing and the National Fire Protection Association’s (NFPA) required buffers. For example, a
15,000-gallon vertical hydrogen storage tank has a footprint of approximately 40 by 50 feet (not including
the fueling island). This same tank would need to be located at least 75 feet from all air intakes, 50 feet
from liquid or gas lines, and at least 25 feet from public ways, railroads, and property lines due to NFPA
requirements. With the SFMTA’s yards already being space-constrained in an urban environment, the
SFMTA would risk losing a lot of potential bus parking – assuming that the infrastructure complies with
NFPA requirements.

The SFMTA’s existing rates for electricity are very competitive. With exceptionally low energy costs,
powering BEBs is expected to be significantly less expensive than supplying hydrogen via liquid delivery.
Hydrogen costs currently average around $8/kg and can have wide variability depending on local
production supply and distance from the chosen supplier.
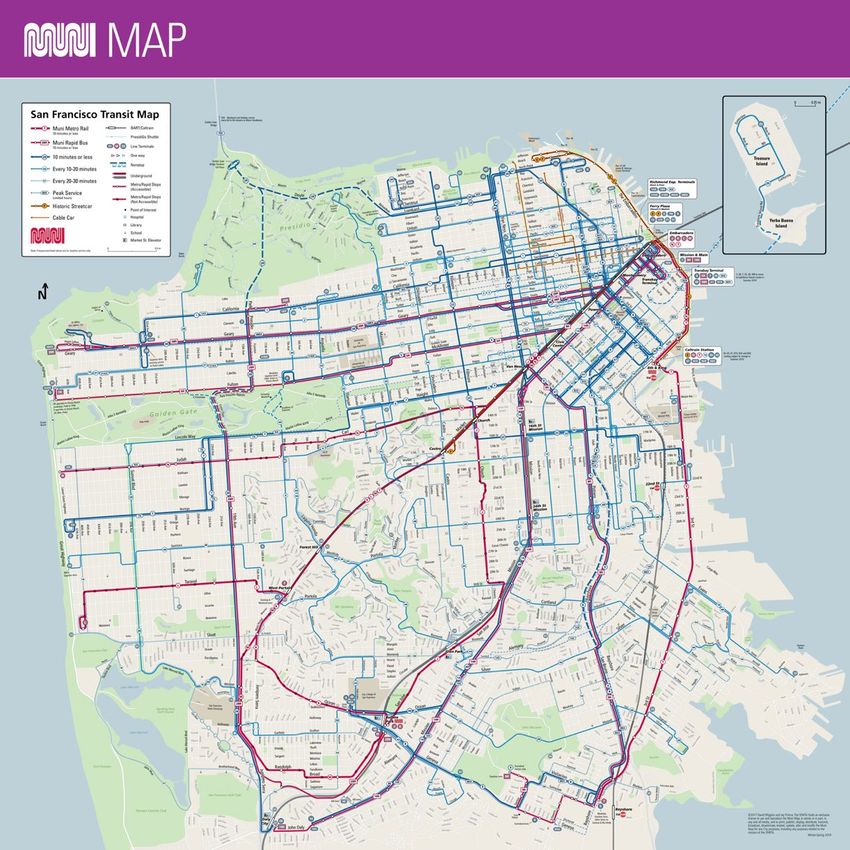
SFMTA Zero-Emission Bus Rollout 9

Hydrogen operations in the SF’s dense neighborhoods may be a barrier to public acceptance.
BEBs are widely accepted by communities and supported in terms of sustainability initiatives by both
cities and transit agencies alike. This is in large part due to near or zero local emissions and quiet
operations. Communities are generally more cautious with the installation of hydrogen storage near their
community due to the risk of hydrogen seepage and combustion. When located near urban or residential
areas, significant stakeholder outreach is often required to garner support for on-site hydrogen storage.
With the majority of the SFMTA’s yards located in urban regions, adoption of hydrogen may result in
community pushback and potential delays in rollout.

2.1.4    San Francisco Municipal Transportation Agency
The SFMTA is a department of the City and County of San Francisco. The SFMTA plans and operates
bus, rail, historic streetcar, cable car, and paratransit transit service within the City and County of San
Francisco. In addition, the SFMTA also manages parking, traffic, bicycling, walking, and taxis in the city.
Prior to the COVID-19 pandemic, the SFMTA provided approximately 726,000 weekday and 220 million
annual passenger boardings. 4 71% of these boardings — 520,000 per weekday and over 156 million
annually — occurred on 76 weekday bus routes. Ridership from 654,300 weekday boardings in FY06 to
726,100 in FY16. 5

Service Area
The SFMTA serves approximately 49 square miles within the City and County of San Francisco (Figure
2-2). San Francisco has added over 78,000 residents and over 175,000 jobs since 2009, and now has a
population of 883,000 and 720,000 total jobs. 6

Utility Provider
The San Francisco Public Utilities Commission (SFPUC) provides electrical service for the SFMTA
service area by way of Pacific Gas & Electric (PG&E) electrical infrastructure. The SFPUC operates
Hetch Hetchy Power, a Publicly Owned Utility. Although the SFPUC has served all municipal agencies
within the City and County of San Francisco for many decades, it relies upon PG&E’s transmission and
distribution grid to serve its customers, for which PG&E receives a fee.

This situation, with the lack of designated service territory boundaries between the two utilities, is unlike
any other in the country, and greatly limits the SFPUC’s visibility into the detailed grid infrastructure and
capacities. Despite multiple requests to gather details, PG&E will not provide information on feeder
capacities unless the SFPUC submits an application for service through the Wholesale Distribution Tariff
(WDT), a process that may require upwards of $150,000 and two years+ per service location to perform a
System Impact Study to determine the capacity available for new loads.

Under the WDT, each SFPUC customer inter-tie point is viewed by PG&E as a utility-to-utility connection.
As such, PG&E applies the rules of the WDT to each SFPUC customer connection. This is significant to
the SFMTA in several ways, but particularly in terms of project timelines and budget. Each service
upgrade that utilizes the PG&E grid must go through PG&E’s review process. The SFPUC therefore has
no control over processing delays or resource constraints. Upon completion of the review, any grid or
infrastructure upgrades required by PG&E are born solely by the SFPUC customer. Being an SFPUC
customer, the SFMTA would not be eligible for any betterment cost sharing, like PG&E retail customers

4
  SFMTA Short-Range Transit Plan Fiscal Year 2019 – Fiscal Year 2030, p. 9.
5
  SFMTA Bus Fleet Management Plan 2017-2030, p. 25.
6
  SFMTA San Francisco Mobility Trends Report 2018, Jan 28, 2019, p2.
SFMTA Zero-Emission Bus Rollout 10

would, regardless of the quantity of PG&E customers that would benefit from the investment. Similarly,
the SFMTA is ineligible for PG&E’s EV Fleet programs, which provide funding for grid infrastructure builds
and upgrades that support EV charging.

                                                      Figure 2-2. SFMTA System Map

Source: SFMTA, Winter/Spring 2019, prior to COVID- 19 induced service suspension

Environmental Factors
San Francisco’s Mediterranean climate is characterized by dry summers and wet winters with relatively
mild temperatures. Temperature does not vary much throughout the year, with average high
temperatures of approximately 70°F during the summer, and average low temperatures of 45°F during
the coldest winter days.
SFMTA Zero-Emission Bus Rollout 11
Topography is varied, with scores of hills ranging from seal level to over 900 feet in elevation. This varied
topography, combined with the effects of cold ocean currents, gives rise to microclimates.
The SFMTA’s buses must travel over multiple hills in a day – the steepest grade is 23%. Figure 2-3
shows San Francisco’s service and the elevation profile, with much of the service feeding into downtown
(which is near sea-level) over numerous hills. An example of the elevation change a transit vehicle may
do while in-service is shown in Figure 2-4 with weekday vehicle block 1005 continuously traveling up and
down hills for the entirety of its service. The block gains a total of 3,542 meters or 2.2 miles in a day (the
equivalent of over 38 football fields or 11.6 times the height of San Francisco’s tallest building, the
Salesforce Tower, at 1,070 feet).
Figure 2-3. San Francisco Service and Elevation ProfileSFMTA Zero-Emission Bus Rollout 12
Source: WSP, USGS DEM
Figure 2-4. Vehicle Block 1005 Elevation Change
Source: WSP, USGS DEM
Schedule and Operations
As of January 2020, the SFMTA directly operates 844 diesel-hybrid and trolley buses on 76 regular
weekday routes, which include supplemental Muni Metro Rail Owl service and routes with Rapid and
Express service (e.g. Route 14, Route 14R, and Route 14X are three different routes) but excludes
weekend-only route 76X and intermittent service to the Chase Center (78X and 79X). 7 These buses are
served by six maintenance and storage yards: Flynn, Islais Creek, Kirkland, Potrero, Presidio, and
Woods. Bus support functions also occur at 1399 Marin, and the SFMTA is planning bus storage
improvements on 4 undeveloped acres east of the Muni Metro East light rail division. The SFMTA’s trolley
buses operate exclusively out of Potrero and Presidio yards, both of which are over 100 years old.
The SFMTA’s fixed-route bus service is organized into six categories or types of service:
1 Rapid Bus: Routes that operate every 10 minutes, or more frequently, all day on weekdays and are
the focus of transit-priority measures.
2 Frequent: Routes that also operate every 10 minutes, or more frequently, all day on weekdays in major
corridors, but make more frequent stops than Rapid Bus routes.
3 Grid: Routes that form the framework of “trunk” routes across the city (along with Rapid and Frequent
bus routes, and Muni SFMTA), with 12-30 minute headways all day on weekdays.
4 Connector: Shorter routes that provide coverage (including neighborhood “circulator” service to hillside
neighborhoods) that generally operate every 30 minutes all day on weekdays.
5 Specialized: Routes with a focused purpose, including: express routes (primarily peak period-only
services for commuters); supplemental service (to middle and high schools); and special event service
(i.e., sporting events, concerts, etc.). Frequencies on these routes vary.
6 Owl: Some routes operate 24 hours a day, while other overnight routes (operating between 1 and 5
a.m.) are comprised of segments of multiple routes.
COVID-19-Related Impacts
As a response to the economic and health impacts of COVID-19, the SFMTA has made major interim
service changes, including the closure of Muni Metro and prioritization of core bus routes (per the Muni
Core Service Plan).
7
This is based on January 2020 (pre-COVID) service.SFMTA Zero-Emission Bus Rollout 13 The Muni Core Service Plan (April 2020) prioritizes the most-used routes to provide access to San Francisco’s medical facilities while also increasing the volume of buses (to promote social distancing) for riders that are most reliant on transit. As of September 2020, the COVID-19 situation has resulted in a 71% reduction in bus boardings and a 95% reduction in transit revenue compared to the same time in 2019. The federal government, through the CARES Act, provided some relief to the SFMTA to address the funding shortfall. However, long-term service levels will be contingent on revenues, ridership, and finding creative solutions to deliver that service efficiently and effectively. COVID-19 directly impacts the SFMTA’s transition to an all-ZEB fleet due to increased uncertainty of various important factors: future ridership, changes and adaptations to service planning, continued emergency declarations and operations, general economic health or recession, and capital funding. 2.1.5 The SFMTA’s Existing ZEB Efforts The SFMTA is a national leader in confronting climate change and embracing the prospects of a ZE future. The SFMTA has taken multiple steps to not only meet the requirements of CARB’s ICT regulation, but also its own ambitious ZE goals, as detailed below. — The SFMTA currently operates the largest fleet of ZE trolley buses in North America. Trolley buses run on 100% greenhouse gas-free hydropower via an overhead catenary system (OCS). The SFMTA also operates over 600 diesel-hybrid vehicles that run on batteries and renewable diesel. — In April 2018, in celebration of Earth Day, the then current mayor, Mark Farrell, committed the City of San Francisco to net-zero greenhouse gas emissions by 2050, which would eliminate the city’s carbon footprint. The SFMTA is already doing its part and accounts for less than 2% of citywide transportation emissions (45%). — In partnership with the San Francisco Department of the Environment, the SFPUC, and other city agencies and stakeholders, the SFMTA supported the development of the Electric Mobility Roadmap that lays out a vision for reducing public health and environmental impacts of private transportation. The Roadmap also identifies strategies to help realize an emission-free transportation sector. — In May 2018, the Board adopted its Zero-Emission Vehicle Policy resolution (ZEV Policy). Under the ZEV Policy, demonstrating the SFMTA’s to achieving a 100% BEB fleet by 2035. 8 — In November 2019, the SFMTA procured nine 40-foot BEBs (three each from New Flyer, Proterra, and BYD). These buses will be piloted in regular revenue service to analyze performance and to assist in developing a long-term charging strategy (expected delivery in early 2021). 9 This pilot program includes an electrical and facility upgrade at Woods Yard to accommodate BEB charging equipment and infrastructure. — In 2018, as part of its Green Zone program, the SFMTA replaced 68 buses with diesel-hybrid buses outfitted with higher capacity batteries and a GPS-enabled switch, which automatically switches the bus to EV mode as it enters geo-fenced areas (Green Zones) throughout the city. In Green Zones, 8 Due to the impacts of COVID-19 (reduction in ridership, funding, etc.), the SFMTA is revisiting this policy to align it with the ICT regulation (2040). 9 Nine buses are currently procured with an additional three in negotiations.
SFMTA Zero-Emission Bus Rollout 14

    the vehicles operate entirely on battery power, reducing and eliminating SFMTA-generated emissions
    in some of the city’s most environmentally burdened communities.

— In February 2020, the SFMTA awarded a contract to WSP to provide a roadmap for the SFMTA’s
  transition to BEB facilities and transit fleet vehicles. This partnership will produce several deliverables
  that will guide the SFMTA to meet their electrification goals, including a BEB Facility Implementation
  Master Plan (Master Plan).

2.2     Rollout Plan Approach
In accordance with the Rollout Plan Guidance, this document provides an overview of several key
components to the SFMTA’s ZEB transition, including fleet acquisitions, schedule, training, and funding
considerations.

Due to the rapidly evolving nature of ZEB technologies, it is likely that the recommended approaches in
this Rollout Plan will be adjusted and changed over time. For that reason, the SFMTA will continue to
evaluate technologies and strategies throughout the transition process. Areas that are currently under
study will be indicated, where applicable. The service-related information in this Rollout Plan is based on
January 2020 service (pre-COVID) and the fleet numbers are based on September 2020.

It should also be noted that COVID-19 has caused unprecedented losses in the SFMTA’s revenue
through the loss of ridership (fares) and the reduction in sales tax revenue. For these reasons, the
SFMTA has reduced service and operations and continues to adapt in the near term and forecast the
long-term implications on the system and the agency’s capital projects and goals. While the impact of
COVID-19 on the SFMTA’s electrification pursuant to the ICT regulation is still unclear, the SFMTA will
continue planning and adjust as needed once COVID-19 is stabilized and trends are more predictable.

2.3     Rollout Plan Structure
In accordance with CARB’s Rollout Plan Guidance, the SFMTA’s Rollout Plan includes all required
elements. The required elements and corresponding sections are detailed below:

— Transit Agency Information (Section 1: Rollout Plan Summary)

— Rollout Plan General Information (Section 1: Rollout Plan Summary)

— Technology Portfolio (Section 2.1.3: ZEB Suitability for the SFMTA’s Service and Operations)

— Current Bus Fleet Composition and Future Bus Purchases (Section 3: Fleet and Acquisitions)

— Facilities and Infrastructure Modifications (Section 4: Facilities and Infrastructure Modifications)

— Providing Service in Disadvantaged Communities (Section 5: Equity Considerations)

— Workforce Training (Section 6: Workforce Training)

— Potential Funding Sources (Section 7: Costs and Funding Opportunities)

— Start-up and Scale-up Challenges (Section 8: Start-up and Scale-up Challenges)
SFMTA Zero-Emission Bus Rollout 15
3 Fleet and Acquisitions
The following section provides an overview of the SFMTA’s existing fleet, planned ZEB technology, and
proposed procurement schedule.
3.1 Existing Bus Fleet
The SFMTA bus fleet includes diesel-hybrid (dHEB) and electric trolley buses ranging from 30- to 60-feet.
As of September 2020, the SFMTA operates a fleet of 844 buses.
The fleet is served by six bus maintenance and storage yards, two for trolley buses, two for 60-foot
buses, and two for standard (30- and 40-foot) buses. Table 3-1 provides a detailed overview of the
SFMTA’s existing bus fleet.
Table 3-1. Summary of the SFMTA’s Existing Bus Fleet
In Service
Manufacturer Series Fuel Type Length Year Bus Type Quantity
8601-8662; 8701-8710;
2013 111
8713-8750
8711 2014 1
8800-8859; 8861; 8864-
2016 66
8866; 8869; 8871
40’ Standard
8751-8780; 8860; 8862-
8863; 8867-8868; 8870; 2017 66
8872-8901
8902-8955 2018 54
dHEB
8956-8969 2019 14
6500-6544; 6546-6553;
2015 54
6700
New Flyer 6545; 6554; 6560-6605l;
2016 78
6701-6730
60’ Articulated
6606-6644; 6646-6647;
2017 44
6649-6650; 6653
6645; 6648; 6651-6652;
2018 48
6654-6697
5701-5798 2018 98
40’ Standard
5799-5885 2019 87
7201-7225 2015 24
Trolley Bus
7224; 7226-7260 2016 36
60’ Articulated
7261-7280 2017 20
7281-7293 2018 13
Orion 8501-8530 dHEB 30’ 2007 Standard 30
Total Buses 844
Source: SFMTA, September 2020SFMTA Zero-Emission Bus Rollout 16 3.1.1 Battery-Electric Bus Technologies As previously mentioned, the SFMTA intends to transition to an all-BEB fleet. The SFMTA’s future BEBs are expected to have specifications that are compatible with the Society of Automotive Engineers’ (SAE) J1772 (plug-in) and SAE J3105 (pantograph) charging standards. By supporting both standards, the SFMTA’s buses will have the flexibility of charging in multiple layouts and orientations. The plug-in standard will allow buses to charge while being serviced, and the pantograph standard will allow buses to charge at the base and at potential on-route charging locations. The roof-mounted charging rails that are associated with the pantograph standard will allow the SFMTA’s BEBs to access “fast” high-power charging (in excess of 150 kW) for a limited duration. Based on the SFMTA’s existing service needs and yard configurations, it is recommended that an inverted pantograph-charging strategy be implemented to support BEBs at all six yards. The pantographs will be supported by an overhead frame that covers the surface of the bus parking tracks. The overhead strategy was deemed to be the most suitable due to space constraints at the SFMTA’s yards. The overhead frame will also be able to support photovoltaic panels (where applicable) and electrical equipment and components (conduit, etc.). Exceptions to the overhead frame solution could potentially occur in multi-level facilities as they are rebuilt, such as Potrero and Presidio Yards. Future design of those facilities would likely either include an overhead frame or an equipment mezzanine, but the SFMTA will leave those decisions to the facility design teams. The proposed facility layouts for each yard are based on utilizing a 150-kW DC charging cabinet in a 1:2 charging orientation (one DC charging cabinet energizes two separate dispensers/buses). This charger- to-dispenser ratio maximizes space utility, reduces capital costs, and meets the requirements to charge the fleet during servicing and dwell time on the site while minimizing the peak electrical demand. That said, the SFMTA continues to monitor technological advancements and may explore other strategies that are advantageous to the SFMTA. Figure 3-1 shows an example of a pantograph and charge rails.
SFMTA Zero-Emission Bus Rollout 17

                             Figure 3-1. Inverted Pantograph and Charge Rails

Source: WSP

3.2       Procurement Schedule
In accordance with the ICT regulation, the SFMTA will prioritize ZEB purchases and progressively increase the
percentage of ZEB purchases over time. As planned, starting in 2027, all of the SFMTA’s new bus purchases will
be ZEB - two years before the ICT regulation requires.

Early retirement should not be an issue pursuant to the ICT regulation (2040) based on the SFMTA’s
future purchases. However, if early retirement becomes a risk, one potential strategy is to place newly
acquired buses on the SFMTA’s longest (distance) service blocks. This will ensure that buses meet the
Federal Transit Administration’s (FTA) 500,000-mile minimal useful life requirement sooner. Prior to
implementing such a measure, the SFMTA will conduct an equity analysis to ensure that service
distribution and vehicle choice is equitable across neighborhoods and districts.

Table 3-2 summarizes the SFMTA’s anticipated procurements through 2040 and Figure 3-2 presents the
percentage of the fleet that are powered by ZE technologies or fossil fuels through the same timeframe.
These are built on the assumption that BEBs and associated battery capacities will be available to meet
the SFMTA’s service block ranges so that a 1:1 replacement ratio is achievable. It should be noted that
this is contingent on the availability of funding, whether battery technology can meet the SFMTA’s range
SFMTA Zero-Emission Bus Rollout 18
requirements, and whether facilities and utility enhancements are completed. The COVID-19 pandemic
has caused uncertainty in the long-term impacts to the SFMTA’s funding and service. Staff is actively
analyzing these changes and will update the schedule accordingly.
In 2025, the SFMTA plans to apply at least 28 “Bonus Credits” to their procurement to satisfy the 25%
ZEB purchase requirement. In the year 2027 and beyond, all new bus purchases will be 100% BEB – two
years prior to the ICT regulation’s requirements.
Table 3-2. Summary of the SFMTA’s Future Bus Purchases (Through 2040)
Zero-Emission Buses Conventional Buses
Total
Year Buses Number Pct. Bus Type Fuel Type Number Pct. Bus Type Fuel Type
2020 0 0 0% - - 0 0% - -
2021 30 0 0% - - 30 100% Std. dHEB
2022 0 0 0% - - 0 0% - -
2023 0 0 0% - - 0 0% - -
2024 0 0 0% - - 0 0% - -
2025 112 0 0% - 112 100% Std. dHEB
2026 0 0 0% - BEB 0 0% - -
2027 54 54 100% Artic. BEB 0 0% - -
2028 144 144 100% Std./Artic. BEB 0 0% - -
2029 110 110 100% Std./Artic. BEB 0 0% - -
2030 126 126 100% Std./Artic. BEB 0 0% - -
2031 50 50 100% Std./Artic. BEB 0 0% - -
2032 20 20 100% Artic. BEB 0 0% - -
2033 141 141 100% Std./Artic. BEB 0 0% - -
2034 87 87 100% Std. BEB 0 0% - -
2035 0 0 0% - - 0 0% - -
2036 0 0 0% - - 0 0% - -
2037 112 112 100% Std. BEB 0 0% - -
2038 0 0 0% - - 0 0% - -
2039 54 54 100% Artic. BEB 0 0% - -
2040 144 144 100% Std./Artic. BEB 0 0% - -
Source: WSP
Note: The SFMTA’s existing trolley buses and dHEBs are expected to be replaced with BEBs 15 and 12 years after their in-service date, respectfully. This
procurement schedule assumes a 1:1 replacement ratio with BEBs being replaced every 12 years (mirroring 12-year warranties) and does not incorporate fleet
growth projections/additions as these are still currently under study.SFMTA Zero-Emission Bus Rollout 19
Figure 3-2. Percentage of ZEB and Fossil Fuel Fleet (2020-2040)
100%
90%
80%
70%
60%
50%
40%
30%
20%
10%
0%
2020
2021
2022
2023
2024
2025
2026
2027
2028
2029
2030
2031
2032
2033
2034
2035
2036
2037
2038
2039
2040
ZEB Fossil Fuel
Source: WSP
3.2.1 ZEB Bonus Credits
Based on the ICT regulation, the SFMTA is entitled to 18 bonus credits for their existing trolley buses 10
and will have 12 bonus credits available for their planned BEB pilot buses 11, resulting in 30 available
credits for the SFMTA. As indicated above, the SFMTA plans to exercise these credits in the 2025
procurement. In lieu of the 25% ICT ZEB purchase requirement, the SFMTA will use 28 of their credits
(25% of 112 buses).
3.2.2 ZEB Range Requirements and Costs
Approximately 9% of the SFMTA’s existing bus blocks travel farther than 150 miles per weekday – a
range that exceeds current batteries’ capabilities. 12 To reduce impacts to service, there are several
strategies that the SFMTA can consider to meet service (range) requirements, including midday charging,
battery/charging management systems, on-route chargers, additional bus purchases, and solar and
battery storage. In addition, with battery technology rapidly evolving, future battery capacities and
efficiencies may be sufficient to serve all blocks. However, this currently appears as a risk to full
conversion to BEB and is discussed later in this Plan.
3.2.3 ZEB Conversions
Conventional bus conversions to ZEB technologies are not currently being considered. However, the
SFMTA will remain open to conversions if they are deemed financially feasible and align with ZEB
adoption goals.
10
Per the ICT regulation: “Each electric trolley bus placed in service between January 1, 2018, and December 31, 2019, receives
one-tenth of a Bonus Credit that will expire by December 31, 2024.”
11
Nine buses are currently procured with an additional three in negotiations.
12
This is based on January 2020 (pre-COVID) service.SFMTA Zero-Emission Bus Rollout 20
4 Facilities and Infrastructure
Modifications
The following sections provide an overview of the existing fleet (by yard), proposed charging strategies,
infrastructure, yard improvements, and program schedule.
4.1 Overview of Existing Facilities
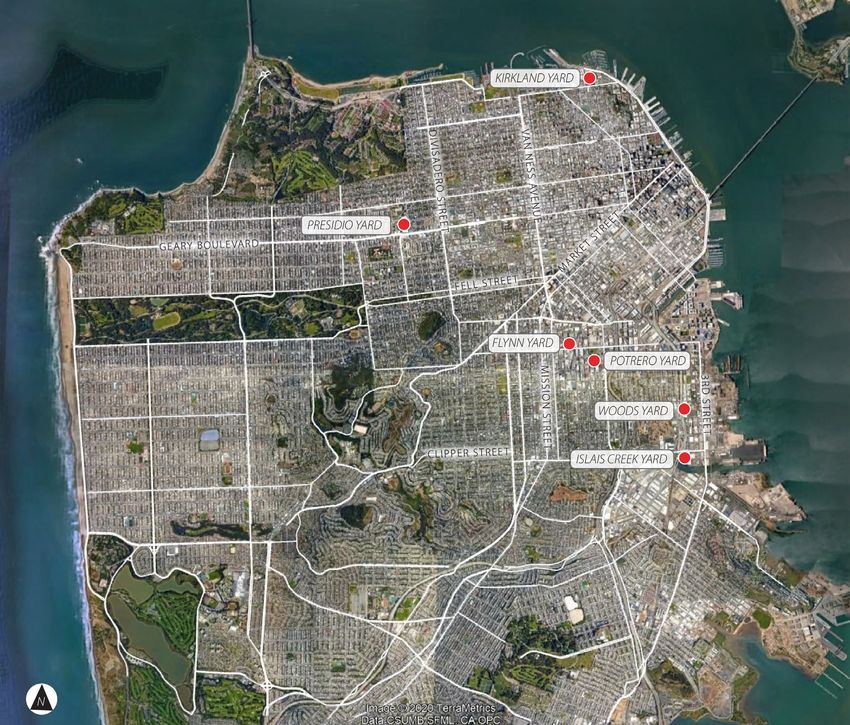
The SFMTA has six yards, all of which will require significant capital improvements to accommodate a
100% ZEB. Table 4-1 summarizes the number and type of buses that are currently stored at each facility
and Figure 4-1 presents the locations of each yard.
Table 4-1. Summary of Existing Yards and Fleets
Diesel-Hybrid Buses Trolley Buses
Yard Address Total 30’ 40’ 60’ 40’ 60’
Flynn 1940 Harrison St. 119 - - 119 - -
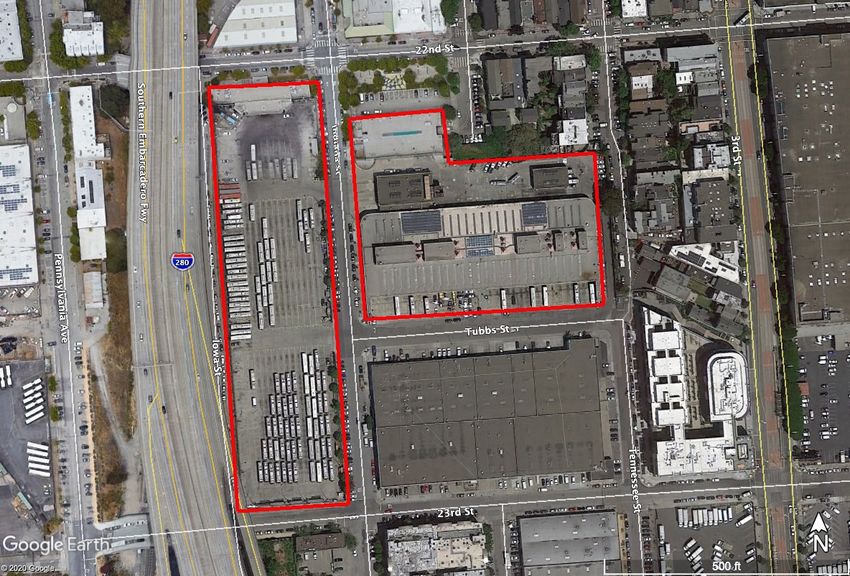
Islais Creek 1301 Cesar Chavez St. 115 10 - 105 - -
Kirkland 2301 Stockton St. and 151 91 - 91 - - -
Beach St.
Potrero 2500 Mariposa St. 146 - - - 53 93
Presidio 949 Presidio Ave. 132 - - - 132 -
Woods 1095 Indiana St. 241 20* 221 - - -
Total 844 30 312 224 185 93
Source: SFMTA Master Fleet Assign Ratio, September 2020SFMTA Zero-Emission Bus Rollout 21
Figure 4-1. The SFMTA’s Bus Yards
Source: WSP
4.2 ZEB Facility and Infrastructure Strategy
Since ZEB technology continues to evolve, it is difficult to commit to a costly strategy that may quickly
become outdated or obsolete. However, it is also important to ensure that strategies are future-ready. For
this reason, the recommended facility and infrastructure modifications are based on what each yard is
planned to accommodate in 2040 per the 2017 SFMTA Facilities Framework report and resulting Building
Progress capital program. Since service changes and bus movements may occur multiple times a year,
by establishing a full-build scenario, the SFMTA can optimize and tailor strategies based on existing (or
anticipated) service.
The SFMTA’s transition to an all-BEB fleet will require an increase in the electrical supply to the site,
enhancements and expansions of electrical equipment, and the installation of gantries, chargers,
dispensers, and other components. These modifications must occur at all six yards. While the SFMTA is
not currently actively seeking on-route charging locations, we remain open to the concept, particularly if it
is required to meet the service plan.SFMTA Zero-Emission Bus Rollout 22
During preliminary concept discussions, both conductive and inductive charging solutions were
considered and analyzed by the SFMTA and the design team. Based on several factors, including the
space constraints at each yard and the desire for uniform infrastructure for ongoing maintenance
efficiency, the SFMTA committed to an inverted pantograph strategy for all yards. However, where
applicable, such as in maintenance areas, plug-in dispensers may be utilized.
To support the inverted pantographs, a scalable and modular overhead support structure is proposed in
open bus yards to retain maximum bus parking capacity while implementing BEB charging. This type of
overhead structure can be rapidly modified to meet changes in the SFMTA’s fleet mix. The system
consists of an overhead structure spanning up to four tracks of bus parking with pantographs mounted at
various five-foot intervals as required by the assigned bus fleet. Charger cabinets, switchboards,
transformers, and all electrical distribution will be kept above the bus parking area, where possible, to
avoid costly trenching and reduce service interruptions during the transition.
Figure 4-2 illustrates inverted pantographs mounted to the modular overhead support structure.
Figure 4-2. Inverted Pantographs and Modular Support Structure
Source: WSP
Note: The frame can also support plug-in dispensers.
The proposed layouts are based on utilizing a 150-kW DC charging cabinet in a 1:2 or 1:3 charging
orientation (one DC charging cabinet energizes two separate dispensers/buses). This charger-to-
dispenser ratio would meet the requirements to charge the SFMTA’s fleet overnight and minimize peak
electrical demand.SFMTA Zero-Emission Bus Rollout 23 4.3 ZEB Transition The process of integrating BEBs into the SFMTA’s fleet is very complex. Each yard will need to have sufficient power (utility enhancements) and charging infrastructure in place before buses are delivered. While the utility enhancements can generally be done without impacting normal operations, the installation of the support structure and charging equipment (chargers, switchgear, transformer, etc.) could negatively impact operations. For that reason, the planning of distinct on-site construction stages and program-level phasing is essential. Staging To avoid service disruptions and operational impacts, the SFMTA’s yards will undergo BEB upgrades in several on-site stages. These “stages” are segments of the yard that will be temporarily shut down to install the necessary BEB-supporting infrastructure. The buses that would normally occupy the staging space will be temporarily relocated on-site (if space allows) or to a neighboring yard or facility. This approach will ensure that construction and normal operations can proceed concurrently. This construction method avoids the complete shutdown of the yard undergoing improvements, which reduces the risks of service impacts. The number of stages and number of buses that need to be temporarily relocated during each stage vary based on a yard’s layout, existing fleet, and additional capacity. Phasing In order to electrify the fleet by 2040, it will be necessary to have multiple yards undergoing construction, concurrently. “Phases” are essentially classifications of when and how these yards are grouped. Typically, the phase in which a yard is transitioned is based on agency’s priorities or technical feasibility. The SFMTA is also concurrently implementing a facility capital rebuild program. When conceived in 2017, the Building Progress Program proposed rebuilds of the SFMTA’s three oldest and most obsolete facilities: Potrero Yard, Presidio Yard, and Kirkland Yard. The Building Progress Program must be adapted to accommodate BEB infrastructure projects. The number of phases, stages, and details on bus relocations are currently being analyzed and will be finalized in the SFMTA’s ongoing Feasibility and Fleet Transition Plan Study. Figure 4-3 presents a concept of Islais Creek Yard and how its construction can be staged. .
SFMTA Zero-Emission Bus Rollout 24

                                    Figure 4-3. SFMTA Staging Example

Source: WSP

4.4       Transition Considerations
There are multiple factors and timetables that must be considered to meet the SFMTA’s ZEB fleet goals
in accordance with the ICT regulation. Since BEBs are not operational unless the facilities are in place to
energize them, it is essential to meet deadlines because it can impact both service and ICT regulation
compliance.

The following provides a brief overview of the various processes and timetable assumptions for each,
Figure 4-4 presents the proposed schedule for the SFMTA’s ZEB fleet conversion.

Bid Documents
The electrification process will require multiple subject matter experts, planners, designers, architects,
engineers, OEMs, and contractors. For this reason, multiple requests for proposals (RFPs) will need to be
developed and put out for bid for various phases of the project. For example, there may need to be an
SFMTA Zero-Emission Bus Rollout 25 RFP for a firm to take the project from 30% design to 100% design. There may also be a separate RFP for the construction component. This assumes a typical design-bid-build concept. For more complex rebuild projects, like Potrero and Presidio Yards, the projects will be delivered in a joint development progressive design-build or design-build model. The SFMTA will continue to evaluate the best strategy to meet goals. If a design-bid-build strategy were to be implemented, it is assumed that each stage of bidding would take six months. BEB-Supporting Enhancements With the amount of time it will take to construct the pantograph-supporting structures and other BEB enhancements, it is assumed that each “stage” of construction at a yard will take approximately six months to be completed. For example, a yard with three distinct stages would take approximately 18 months to be BEB-ready. Utility Infrastructure Enhancements Even with BEBs and BEB-supporting equipment in place, the fleet can only operate if the electrical utility and supporting circuits can meet the energy and power demands of the BEBs. In the SFMTA’s case, power is provided by PG&E by way of SFPUC. The SFMTA must undergo a lengthy and uncertain process to request and receive additional power. This process includes an application, a study, permitting, planning and design, and construction (on behalf of SFPUC). This process could take as long as five years. The utility enhancements dictate when a yard is deemed fully operational for BEBs. Bus Procurements It is assumed that buses can be procured 18 months before the conclusion of the BEB-supporting enhancements. Typically, ordering buses is not an arduous endeavor. However, the procurements will have to be aligned with the construction of charging equipment at the yard and utility enhancements. Environmental Clearance Yards that are scheduled to be demolished and rebuilt, such as Potrero and Presidio, are considered “projects” under the California Environmental Quality Act (CEQA) and an environmental impact report (EIR) will need to be prepared. The process of developing and certifying an EIR can take 2-3 years, pre- construction. The other four divisions may be exempt from developing an EIR pursuant to California’s Senate Bill 288, if all requirements, including workforce and labor provisions, of the exemption can be met. The exemption, in part, grants extensions to “transit agency projects to construct or maintain infrastructure to charge or refuel zero-emission transit buses,” However, the specific details and guidelines for the exemptions will be further evaluated in subsequent stages of planning. Temporary Relocations The SFMTA’s 1399 Marin and Muni Metro East (MME) facilities have been identified as sites that can temporarily store and dispatch buses during construction at other sites. For instance, when Potrero and Presidio are being reconstructed, the SFMTA is planning to temporarily relocate their trolley bus fleets there. Procurement tables and construction schedules will have to be in alignment with the timing of these temporarily relocations to avoid scheduling delays or impacts to operations or service. Yard Management and Operations The layout and operations of the yard will be vastly different during and after construction. Currently, there are no range issues with the SFMTA’s buses and the time it takes to fuel buses is negligible. However, with the transition to BEBs, more considerations to how buses are parked, operated, and dispatched will
SFMTA Zero-Emission Bus Rollout 26

be required due to the reduction in range and relatively long charge times. These issues will be even
more important during the time(s) that yards are operating mixed fleets (BEB and dHEB). To mitigate any
negative impacts to operations, significant planning and updates to standard operating procedures will be
needed to achieve a successful transition.

Schedule
As indicated above, there are multiple prevailing factors that will dictate the SFMTA’s transition schedule.
Figure 4-4 illustrates a conceptual schedule that can meet ICT regulation goals. This schedule largely
follows the priorities of the 2017 Facilities Framework report and uses the utility provider’s conservative
five-year estimate as the span of time it will take to enhance all facilities. This schedule does not consider
the specifics of bus procurement quantities, service planning, or phasing and is highly contingent on the
SFMTA’s funding and PG&E and SFPUC’s ability to meet construction deadlines.

It should also be noted that the SFMTA is currently evaluating the cost effectiveness of implementing the
BEB transition at two facilities that are generally in poor condition (Kirkland and Woods). The capital
investment of BEB conversion is significant, and the SFMTA is committed to fiscally responsible capital
projects that meet the larger needs of the SFMTA’s service and workforce. All of these factors will have
impacts to the conceptual schedule.

                                      Figure 4-4. Conceptual Schedule

Source: WSP
You can also read