Existing Transportation System - Chapter 1: Introduction - Riverside Park in Evans. Image Credit: City of Evans - NFRMPO
←
→
Page content transcription
If your browser does not render page correctly, please read the page content below
Chapter 1: Introduction

Chapter 2
Existing Transportation System

             Riverside Park in Evans.
                                  12 Image Credit: City of Evans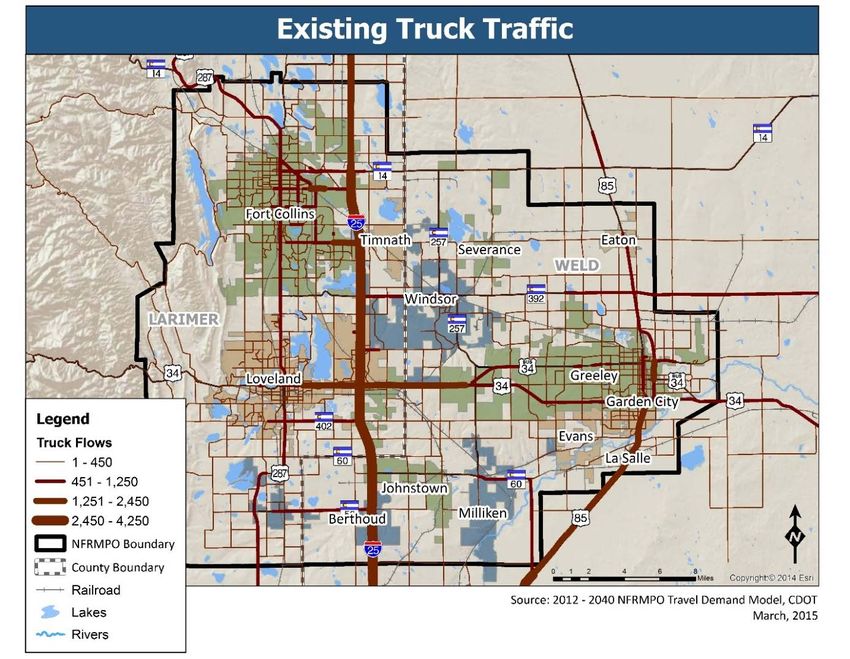
Chapter 2: Existing Transportation System
Chapter 2: Existing Transportation System
A. Regionally Significant Corridors
The concept of Regionally Significant Corridors (RSCs) was used in previous regional transportation plans (RTPs)
to focus limited transportation dollars on the corridors most significant to the region. Since this plan is corridor‐
based, the RSCs set the stage for the overall plan.
Identification and grouping of individual corridors was done in the 2035 RTP. The corridors were updated and
affirmed in the 2035 RTP and carried forward in this RTP as ungrouped individual corridors. A RSC in the North
Front Range Metropolitan Planning Organization (NFRMPO) is defined as:
An important link in a multi‐modal, regional network comprised of existing or new transportation
corridors that connect communities and/or activity centers by facilitating the timely and safe movement
of people, goods, information, and services.
Three criteria were used to identify RSCs:
1. Includes all State Highways
Colorado Department of Transportation (CDOT) requires a corridor vision be developed for all state
highways as part of the regional transportation plan. Since this is required by CDOT, and most state
highways are regional in nature, this was established as the first criteria.
2. Functional Classification
Roadways must have a functional classification of minor arterial or higher, as defined by the appropriate
government agency.
The higher the functional classification, the greater the likelihood trips are longer and the roadway
connects more than one community or destination.
3. Connectivity
The corridor must go through, or plan to go through, more than one governmental jurisdiction and
connect activity centers.
This plan used the Colorado State Parks’ Colorado Front Range Trail Corridor Plan, the CDOT Eastern Colorado
Mobility Study, and the NFRMPO’s 2013 Regional Bike Plan to define the criteria for RSCs. The RSCs are
organized by alpha/numeric order from Interstate, US Highway, State Highway, Larimer County Road, Weld
County Road, and then the remaining corridors. Table 2‐1 describes the 27 RSCs whose numbers correspond to
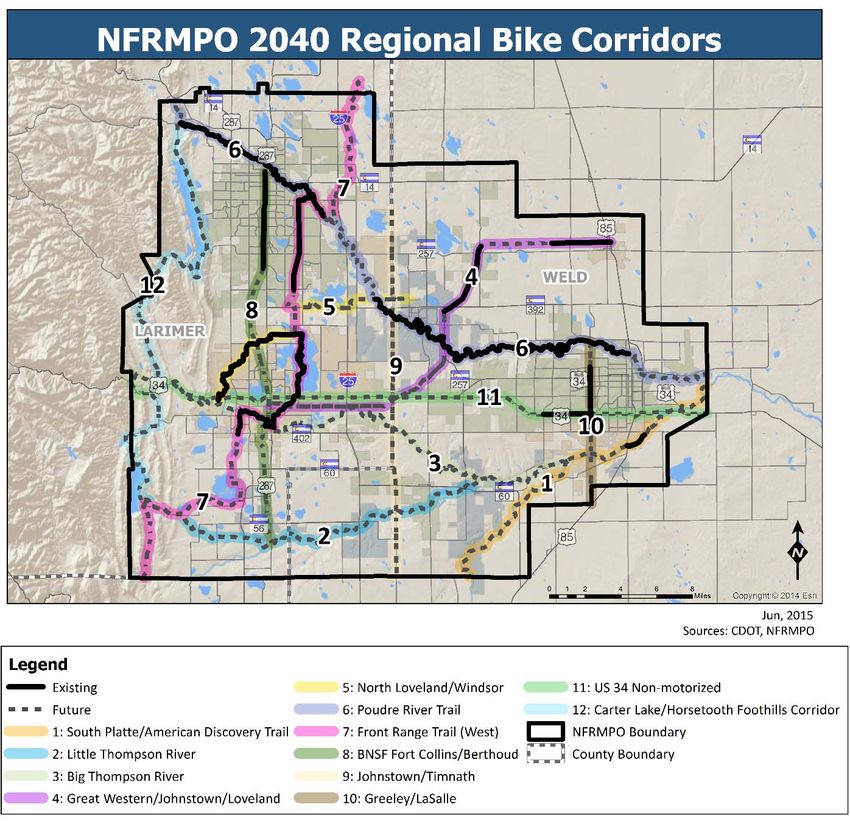
the locations in Figure 2‐1. The plan also includes the 12 Regional Bike Corridors (RBCs) from the Bike Plan, Table
2‐2, whose numbers correspond to the locations in Figure 2‐2. A vision plan detailing each corridor is included in
Chapter 9.
13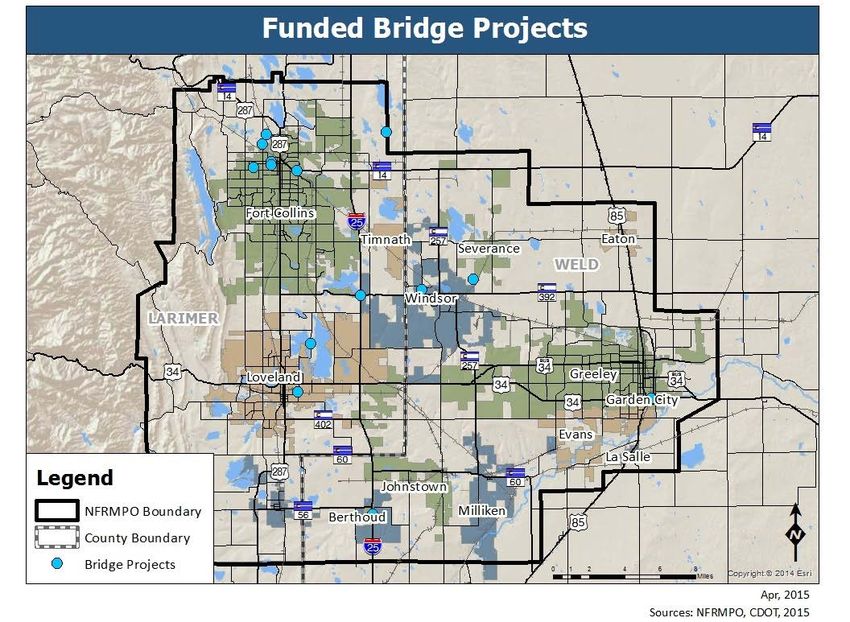
Chapter 2: Existing Transportation System

                                  Table 2‐1: Regionally Significant Corridors
Corridor         Corridor
                                                                   Description
Number      Name/Component
   1               I‐25                   Northern NFRMPO boundary to southern NFRMPO boundary
   2              US 34                    Western NFRMPO boundary to eastern NFRMPO boundary
   3       US 34 Business Route                 US 34 on the west to eastern NFRMPO boundary
   4              US 85                       Weld CR 70 on the north to Weld CR 48 on the south
   5       US 85 Business Route                      US 34 on the west to US 85 on the east
                                     Northern NFRMPO boundary to southern NFRMPO boundary, includes
   6             US 287
                                                                 Berthoud Bypass
  7                 SH 1                      Northern NFRMPO boundary to US 287 on the south
  8                SH 14                       US 287 on the west to eastern NFRMPO boundary
  9                SH 56                          US 287 on the west to Weld CR 17 on the east
  10               SH 60                  Larimer CR 17 on the west to Two Rivers Parkway on the east
  11              SH 257              SH 14 on the north to SH 60 on the south, includes offset in Windsor
  12              SH 392                             US 287 on the west to US 85 on the east
  13              SH 402                         Larimer CR 17 on the west to US 85 on the east
  14           Larimer CR 3            Crossroads Boulevard on the north to southern NFRMPO boundary
  15           Larimer CR 5                         SH 14 on the north to US 34 on the south
  16          Larimer CR 17                        US 287 on the north to SH 56 on the south
  17          Larimer CR 19                        US 287 on the north to US 34 on the south
  18            Weld CR 13                   SH 14 on the north to the southern NFRMPO boundary
  19            Weld CR 17        Crossroads Boulevard Extension on the north to southern NFRMPO boundary
  20           35th Avenue                         O Street on the north to US 85 on the south
  21           65th Avenue                       SH 392 on the north to 59th Street on the south
  22           83rd Avenue                Northern NFRMPO boundary to southern NFRMPO boundary
  23       Crossroads Boulevard                       I‐25 on the west to US 85 on the east
  24          Harmony Road                Larimer CR 17 on the west to the eastern NFRMPO boundary
  25          Mulberry Street          Larimer CR 19 on the west to Riverside Avenue (SH 14) on the east
  26          Prospect Road                      US 287 on the west to Larimer CR 5 on the east
                                     Vine Drive on the north to the southern NFRMPO boundary, following
  27         Timberline Road
                                       Timberline Road to Larimer CR 9E (road approximate) to Weld CR 7

                                                    14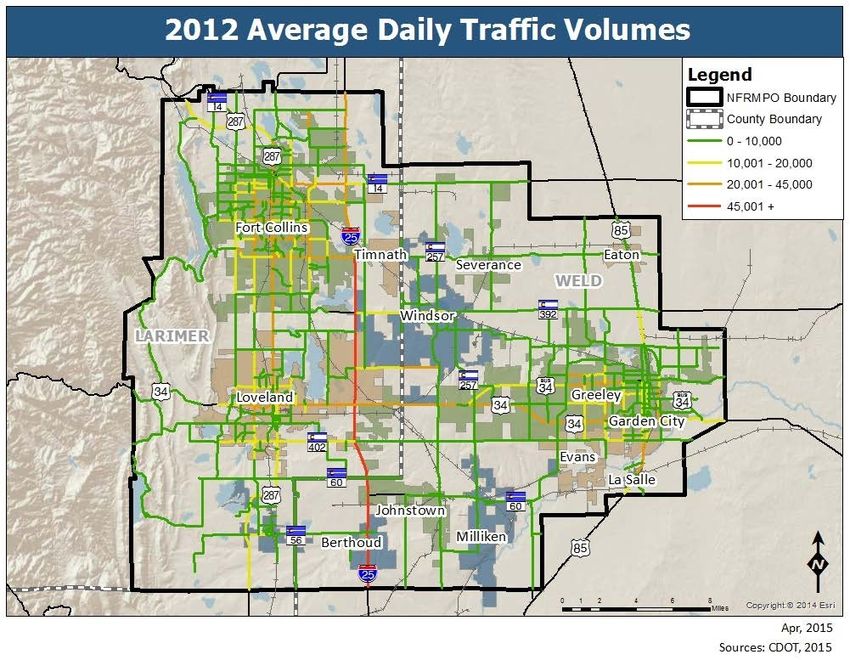
Chapter 2: Existing Transportation System

            Table 2‐2: Regional Bike Corridors
Corridor                       Corridor Name
Number
   1               South Platte/American Discovery Trail
   2                        Little Thompson River
   3                         Big Thompson River
   4                Great Western/Johnstown/Loveland
   5                       North Loveland/Windsor
   6                           Poudre River Trail
   7                       Front Range Trail (West)
   8                     BNSF Fort Collins/Berthoud
   9                         Johnstown/Timnath
  10                            Greeley/LaSalle
  11                        US 34 Non‐motorized
  12              Carter Lake/Horsetooth Foothills Corridor

                            15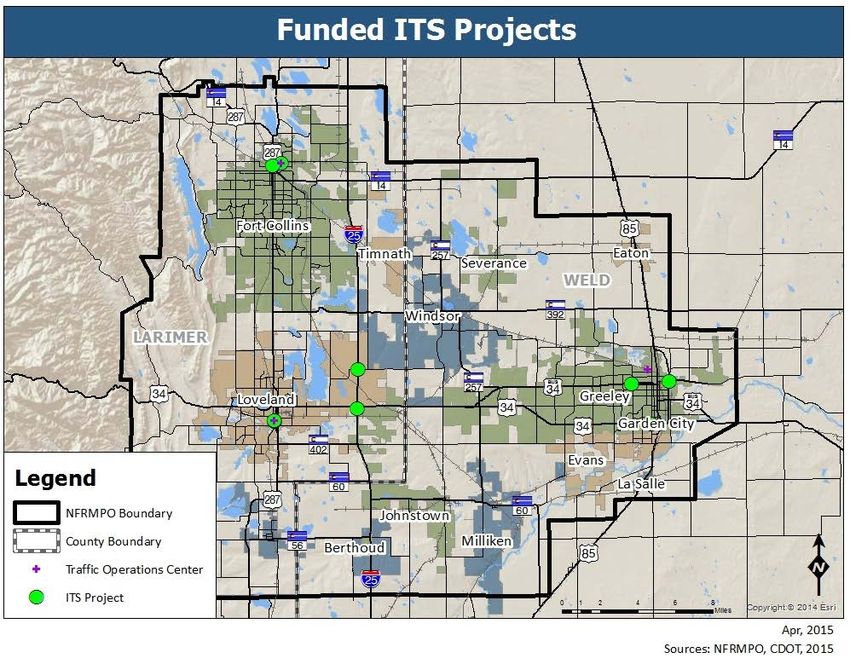
Chapter 2: Existing Transportation System

Figure 2‐1: NFRMPO 2040 Regionally Significant Roadway Corridors

                               16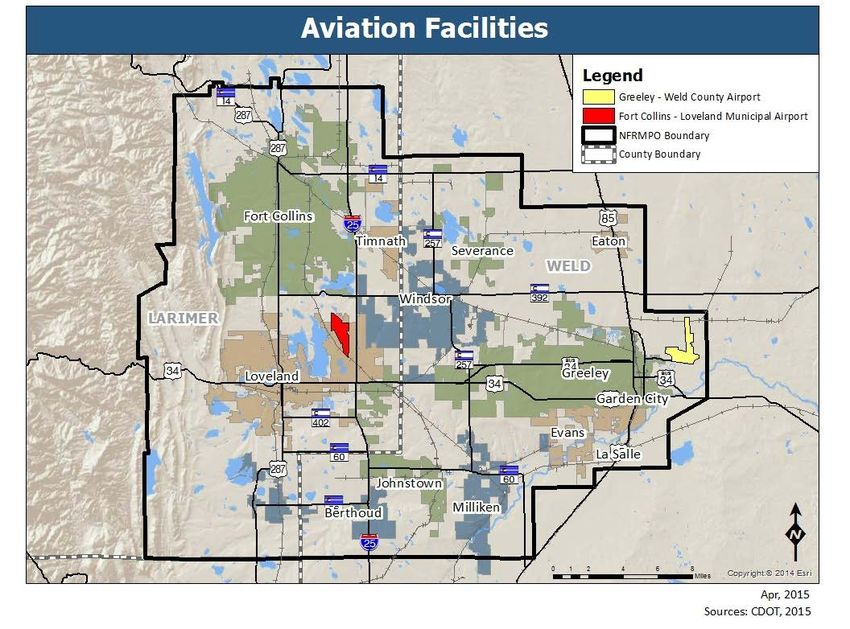
Chapter 2: Existing Transportation System

Figure 2‐2: NFRMPO 2040 Regional Bike Corridors

                      17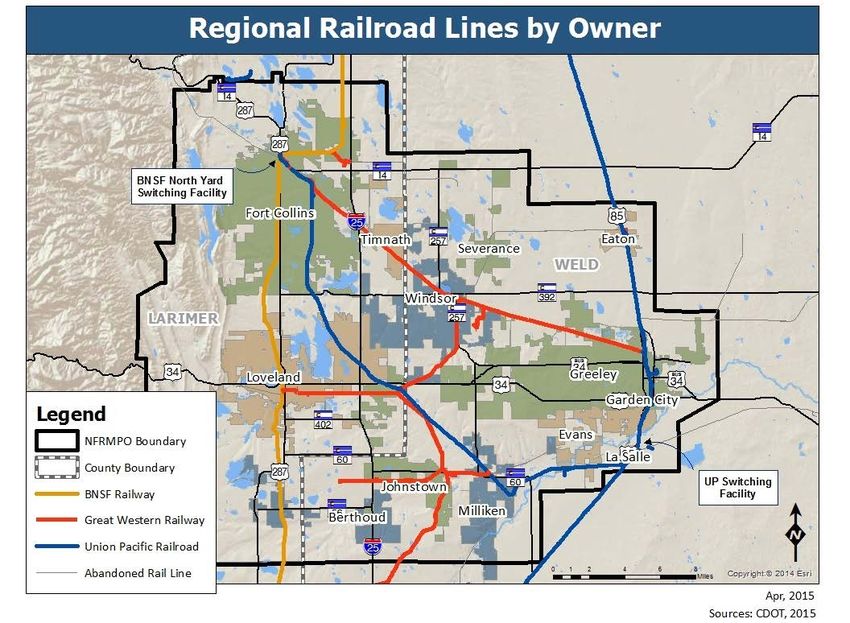
Chapter 2: Existing Transportation System
B. Roadway System
Currently, the roadway system is the principal transportation component within the region. This network
provides a system for vehicular traffic, such as cars and trucks, but it also provides basic infrastructure for transit
service and non‐motorized traffic.
Functional Classification
The roadway network is comprised of a hierarchy of facilities defined by their functional classification and how
they serve the mobility and access needs of the users. As mobility increases on a roadway, access decreases; and
conversely, as access increases, mobility decreases.
The functional classification descriptions that follow are the basis for the 2040 Regional Travel Demand Model
(RTDM). The definitions are based on the Federal Highway Administration’s (FHWA) Highway Functional
Classification Concepts, Criteria and Procedures document.3 The functional classification of each roadway
reflects its role in the regional system. Functional classification has specific implications for the administration of
federal aid highway programs. Transportation planning agencies use functional classification as a means to
identify corridor preservation, access management, and roadway design requirements.
Interstates: All routes which comprise the Interstate Highway system are considered interstate
highways. Interstates are designed with mobility and long‐distance travel in mind. I‐25 is the only
interstate highway in the North Front Range region.
Freeway and Expressways: Freeways and expressways have directional travel lanes, which are
usually separated by some type of physical barrier, and their access and egress points are limited to on‐
and off‐ramp locations or a very limited number of at‐grade intersections. Freeways and expressways
are designed and constructed to maximize their mobility function, and abutting land uses are not
directly served by them.
Principal Arterial: Urban Principal Arterials serve major activity centers, the highest traffic volume
corridors, and longest trip demands. Principal Arterials interconnect and provide continuity for major
rural corridors to accommodate trips entering and leaving urban areas and movements through the
urban area. They serve demand for intra‐area travel between the central business district and outlying
residential areas.
Minor Arterial: Minor arterials collect and distribute traffic from principal arterials, freeways, and
expressways to streets of lower functional classification and, in some cases, allow traffic to directly
access properties. They serve secondary traffic generators such as community business centers,
neighborhood shopping centers, multifamily residential areas, and traffic between neighborhoods.
Access to land use activities is generally permitted, but should be consolidated, shared, or limited to
larger‐scale users. Minor arterial street spacing is recommended to be at half‐mile intervals.
Major Collectors: Major collectors serve traffic circulation in higher density residential and
commercial/industrial areas. They distribute and channel trips between Local Roads and Arterials,
usually over a distance of greater than three‐quarters of a mile. They allow for higher speeds and more
signalized intersections.
3
http://www.fhwa.dot.gov/planning/processes/statewide/related/highway_functional_classifications/fcauab.pdf
18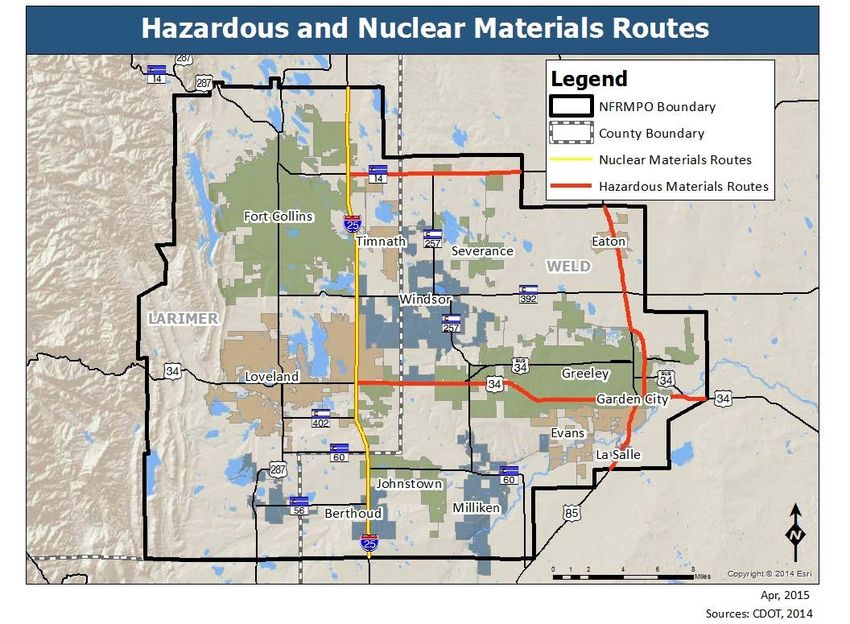
Chapter 2: Existing Transportation System
Minor Collectors: Minor collectors serve traffic circulation in lower density residential and
commercial/industrial areas. They distribute and channel trips between Local Roads and Arterials,
usually over a distance of less than three‐quarters of a mile. They allow for lower speeds and fewer
signalized intersections
Local: The primary function of local roads is to provide access to adjacent land uses in both urban and
rural areas. They carry no through‐traffic movement and constitute the mileage not classified as part of
the Arterial and Collector systems.
Table 2‐3 summarizes these classifications and provides examples of roads within the North Front Range region.
The lane mileage provided represents the lane mileage included in the 2040 Regional Travel Demand Model
(RTDM) and does not include all of the lane miles in the region.
Table 2‐3: Examples of Functional Classification in the NFRMPO Model
Functional Class Lane Mileage (2012) Regional Examples
Freeway 109 Interstate 25
Expressway 232 US Route 85, US Route 34
Principal Arterial 573 State Highway 392
Minor Arterial 737 State Highway 14/Mulberry Street
Weld County Route 39, Larimer County
Collector 1,144
Route 19/Taft Hill Road
Ramps 16 I‐25 Entrance and Exit Ramps
Frontage Road 60 I‐25 Frontage Road
Total 2,870
Source: North Front Range 2012 Base Year Regional Travel Model
Existing Daily Traffic Volumes
Figure 2‐3 shows the 2012 daily traffic volumes on major roadways on and off the National Highway System
(NHS) in region. The major traffic volumes are located along the major routes within the region. I‐25 south of
Harmony Road/Weld County Route 74 has the highest traffic volume in the region with over 45,000 daily trips,
with US 34 and US 287 seeing heavy traffic as well. Conversely, many collectors see less than 10,000 trips per
day.
19
Chapter 2: Existing Transportation System

                                    Figure 2‐3: Average Daily Traffic Volumes

Roadway Surface Condition
CDOT monitors roadway conditions on the State Highway system on a weekly basis and completes a pavement
review annually. Roadways are given a rank based on the roughness and rutting of the roadway surface, as well
as the amount of cracking and patching. A “good” surface condition corresponds to a remaining service life
greater than 11 years; a “fair” surface condition corresponds to a remaining service life between six and 11
years; and a “poor” surface condition corresponds to a remaining service life of less than six years. Roadway
conditions from CDOT’s system are shown in Figure 2‐4. Many of the region’s important highways and
connections are in “poor” condition.

In 2013, CDOT shifted from using “Remaining Service Life” to “Drivability Life”. Drivability Life focuses on how
long a highway segment will have acceptable driving conditions based on an assessment of pavement
smoothness, surface cracking, rutting, and safety.4 There are three categories: “High Drivability Life” will have

4
 CDOT 2014 Transportation Deficit Report, 2014.
https://www.codot.gov/library/AnnualReports/2014‐annual‐transportation‐deficit‐report.pdf

                                                         20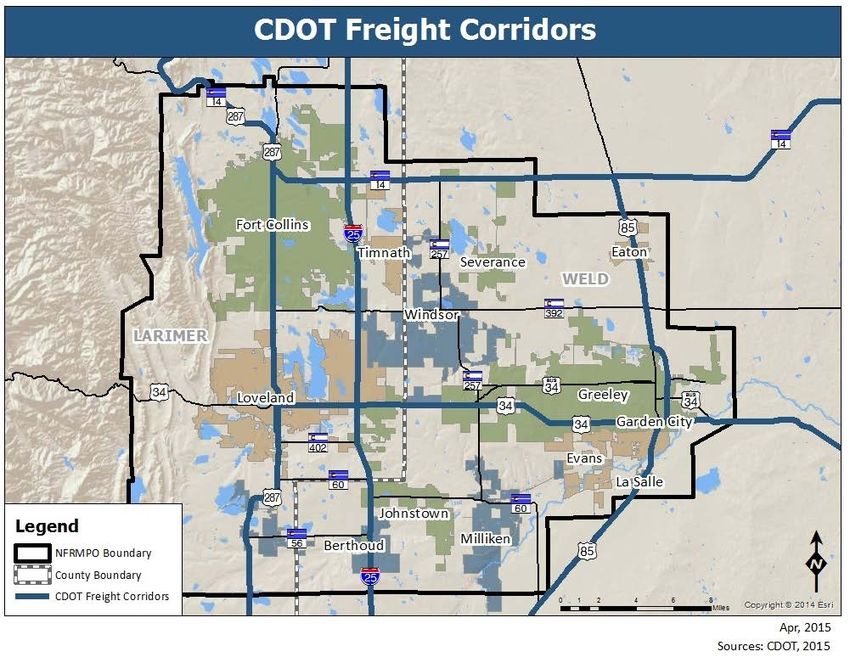
Chapter 2: Existing Transportation System

acceptable driving conditions for more than 10 years; “Moderate Drivability Life” will have acceptable driving
conditions for four to 10 years; and “Low Drivability Life” will have acceptable driving conditions for fewer than
four years. In the future, the NFRMPO will address Drivability Life when considering roadway surface conditions
during the Call for Projects and Transportation Improvement Program (TIP) processes.

A variety of construction projects have improved roadway surface quality in certain areas, while other areas
have not been improved and have deteriorated. Noticeable improvements can be seen along the I‐25 corridor
south of CO 392 to the NFRMPO’s southern boundary, and along portions of US 34. Meanwhile, US 287 has seen
roadway surface quality decrease although there is significant construction underway or planned in 2015.

                                  Figure 2‐4: 2012 Roadway Surface Conditions

Special Roadway Corridors
Roadways are categorized by their regional and national significance or by their scenic or historic value. Multiple
roadways within the NFRMPO’s boundaries fit the NHS criteria based on their significance and one regional
highway is considered scenic and historic.

                                                        21
Chapter 2: Existing Transportation System
National Highway System
The NHS includes interstate highways as well as a portion of the urban and rural major arterial system.
Approximately 102 miles of NHS roadways are within the NFRMPO boundary, as shown on Figure 2‐5. FHWA has
designated “High Priority Corridors” as a focus for improvements to enhance mobility for trade (both domestic
and international) and to promote economic development. Camino Real, the High Priority Corridor in the North
Front Range region, extends from Mexico to Canada via I‐25 through Colorado.
Scenic and Historic
The State of Colorado has identified more than 2,000 miles of roadway as Scenic Byways. The Cache la Poudre ‐
North Park (SH 14 and US 287) is the only designated Scenic Byway within the NFRMPO boundary.
Approximately seven miles of this byway are within the northern portion of the region. The route follows US 287
from the Cache La Poudre River northwest as shown in Figure 2‐5.
Figure 2‐5: National Highway System
Hazardous and Nuclear Materials
Due to safety reasons, the transportation of hazardous and nuclear materials is limited to designated roadways.
Figure 2‐6 illustrates the roadways in the region the State of Colorado has designated for the transportation of
hazardous and nuclear materials. As shown, three routes are designated for transporting hazardous materials (I‐
22Chapter 2: Existing Transportation System
25, SH 14, US 34, and US 85), while one route is designated for transporting nuclear materials (I‐25). Federal and
State regulations prohibit these materials from being shipped using other routes.
Figure 2‐6: Hazardous and Nuclear Materials Routes
Bridge Conditions
Major strides have been made to fix and repair bridges within the State using Highway Safety Improvement
Program (HSIP) or Funding Advancements for Surface Transportation Economic Recovery Act (FASTER) funding.
Colorado voters approved FASTER in 2009. The FASTER program designated State funds for safety
improvements, bridge repairs, and transit expansion. Working with CDOT, municipalities within the region have
invested a variety of resources and funds into fixing bridges.
CDOT defines structurally deficient bridges as those needing to be monitored and/or repaired, but does not
imply possible collapse or unsafe driving conditions.5 If a structurally deficient bridge becomes unsafe, the
structure will be closed. Functionally obsolete bridges are those built to standards not used today. Possible
standards include adequate lane widths, shoulder widths, or vertical clearances for current or expected traffic.
5
CDOT FASTER Bridge Enterprise FAQ, 2015. https://www.codot.gov/programs/BridgeEnterprise/BridgeFAQs
23Chapter 2: Existing Transportation System
FHWA produces an annual National Bridge Inventory (NBI), which is the result of surveying the number of
structurally deficient and functionally obsolete bridges across the country. Since 2007, 58 new bridges have
been constructed in Larimer and Weld counties. The number of structurally deficient bridges has increased,
though the number of functionally obsolete bridges has decreased. Figure 2‐7 shows the combined number of
structurally deficient, functionally obsolete, and total deficient (combined structurally deficient and functionally
obsolete) bridges in Larimer and Weld counties, from 2007‐2014. The increase in structurally deficient bridges is
attributed to the 2013 floods in Northern Colorado. Many of these bridges should be repaired or reconstructed
using flood relief funding.
Figure 2‐7: Bridge Conditions
250
200
NUMBER OF BRIDGES
150
100
50
0
2007 2008 2009 2010 2011 2012 2013 2014
YEAR
Number Structurally Deficient Number Functionally Obsolete Total Deficient Bridges
Source: National Bridge Inventory, 2015
Fifteen bridges have been or are in the process of being repaired using State funding, as shown in Table 2‐4.
These projects repair deficient bridges along major corridors within the region. Figure 2‐8 maps the projects
listed in Table 2‐4.
24Chapter 2: Existing Transportation System
Table 2‐4: Funded Bridge Projects
Bridge Municipality Project Status Funding Source
US 85 Bypass: 5th‐US 34 Greeley In design Bridge On‐System
US 34/85 Interchange Greeley In design Bridge On‐System
US 34 & US 85 Bridge Greeley In design Bridge On‐System
Larimer CR 50 at Larimer and
Larimer County In design Bridge Off‐System
Weld Canal
Larimer CR 3 at Larimer Under
Larimer County Bridge Off‐System
County Canal construction
Larimer CR 17 at Poudre Under
Larimer County Bridge Off‐System
River construction
LaPorte‐Whitcomb Bridge at
Fort Collins Complete Bridge Off‐System
Arthur’s Ditch
Madison Avenue at Greeley‐
Loveland Complete Bridge Off‐System
Loveland Canal
Weld CR 21 at Greeley No. 2
Weld County Complete Bridge Off‐System
Canal
Shields Street at Larimer
Fort Collins Complete Bridge Off‐System
County Canal No. 2
Bryan Avenue at Mulberry
Fort Collins Complete Bridge Off‐System
Street
Windsor 15th Street at
Windsor Complete Bridge Off‐System
Greeley No. 2 Canal
Larimer CR 11C at Horseshoe
Larimer County Complete Bridge Off‐System
Lake Spillway
Under Bridge Enterprise
SH 14: Cache La Poudre Fort Collins
construction Pool
I‐25 Service Road over Little Bridge Enterprise
Berthoud Complete
Thompson River Pool
Larimer County Road 48 over Not Yet Bridge Enterprise
Larimer County
I‐25 Scheduled Pool
US 287 at Meadow Lane Bridge Enterprise
Larimer County Complete
(over Draw) Pool
Under
I‐25 & SH 392 Interchange Windsor Safety Pool
construction
Source: CDOT FASTER projects, http://www.coloradodot.info/projects/faster, 2014
25Chapter 2: Existing Transportation System
Figure 2‐8: Funded Bridge Projects
In addition to the construction projects listed in Table 2‐4, CDOT has identified additional bridges rated in poor
condition, Table 2‐5. These bridges may receive funding to fix structural deficiencies as it becomes available.
Table 2‐5: Bridges with Structural Deficiencies
Bridge Municipality Rating Type of Work
Prospect Road over I‐25 Fort Collins 49 Replacement
US 287 at Meadow Lane (over Draw) Larimer County 47.2 Replacement
Larimer County Road 48 over I‐25 Larimer County 46.2 Yet to be Determined
I‐25 Service Road over Little Thompson River Weld County 45.3 Replacement
SH14 over Coal Bank Creek Weld County 28.7 Replacement
Source: http://www.coloradodot.info/programs/BridgeEnterprise/poor‐bridges/
26Chapter 2: Existing Transportation System
Safety
Crash data for State and federal roadways within the NFRMPO are collected annually by CDOT. Table 2‐6 shows
the crash rate per 100M vehicle miles traveled (VMT) for the major State and federal highways based on crash
data from 2008 to 2012. The Crash Rate per 100M VMT was calculated using FHWA’s formula:
R = Crash Rate
C = Number of Crashes
V = AADT
Table 2‐6: Crash Rate per 100M VMT (2008‐2012)
Route Total Crashes Crash Rate Per 100M VMT
I‐25 3,024 83.23
US 287 4,281 359.52
SH 1 91 259.20
SH 257 325 120.82
US 85 952 209.26
SH 14 776 133.95
SH 392 677 173.56
US 34 2,265 140.81
US 34 Business 1,411 445.67
SH 60/SH 56 414 157.27
SH 263 34 152.96
SH 402 123 137.15
State Facilities Average ‐‐ 197.78
Source: CDOT Crash Data, 2008–2012
As shown in Table 2‐6, many of the region’s busiest roads have higher crash rates per 100M VMT than more
rural facilities. These corridors should be targeted for safety improvements in the future.
Figure 2‐9 shows the total number of crashes on State and federal highways within the region divided into fatal,
injury, and property damage only (PDO) crashes. Crashes have steadily increased from 2008 to 2012, with a
sharp increase in fatal and PDO crashes. In all, there were nearly 3,000 crashes within the region; of those, 300
crashes had at least one injury, while 17 were fatal. More severe crashes occurred within municipal boundaries
at or near intersections. Arterial roadways, particularly through more densely populated areas, often experience
high crash rates due to interchange access and intersection related crashes. Crashes along I‐25 may be
attributed to congestion and heavy directional flow during peak hours.
27Chapter 2: Existing Transportation System
Figure 2‐9: Crashes on State Highway Corridors
Crashes on State Highway Corridors
3500
3000
Number of Crashes
2500
2000
1500
1000
500
0
2008 2009 2010 2011 2012
Fatal 9 13 9 3 17
Injury 333 314 258 263 290
Property Damage Only 2310 2683 2456 2712 2676
Source: CDOT Crash Data, 2008–2012
C. Freight
FHWA estimates by 2040 the nation’s transportation system will handle cargo valued at more than $39 Trillion,
compared with $17.4 Trillion in 2012.6 Volumes, in tons, will increase by nearly 45 percent over 2012 levels by
2040 from 19.7 Billion to 28.5 Billion respectively. These huge increases in freight movement will place even
greater demands on the nation’s transportation system. It is critical for transportation planning agencies
throughout the country to integrate freight considerations into their long range planning processes. It is clear a
variety of strategies are needed to address the challenges surrounding the projected growth of freight
transportation.
Truck Freight
As part of the State Highway Freight Plan, CDOT identified Freight Corridors throughout the State with input
from the freight industry and other key stakeholders. Within the region, these corridors are: I‐25; US 34; US 85;
US 287; and SH 14. The corridors are shown in Figure 2‐10.
6
FHWA Freight Facts and Figures 2013:
http://www.ops.fhwa.dot.gov/Freight/freight_analysis/nat_freight_stats/docs/13factsfigures/pdfs/fff2013_highres.pdf
28Chapter 2: Existing Transportation System
Figure 2‐10: CDOT Freight Corridors
A large amount of freight is moved by truck through the region. Table 2‐7 shows the commodity flows in all of
Larimer and Weld counties for 2010 and predicted for 2040. Total tonnage moved through the region is
expected to increase by 63.6 percent by 2040. Long‐haul freight truck traffic is concentrated on major routes
connecting metropolitan areas, ports, border crossings, and major hubs.7
Table 2‐7: Existing Commodity Flows (2010)
Inbound Tonnage Outbound Tonnage Total Tonnage
County (thousands) (thousands) (thousands)
2010 2040 2010 2040 2010 2040
Larimer 8,901.73 11,999.59 9,361.32 17,616.89 18,263.04 31,825.94
Weld 14,209.05 25,672.22 17,846.56 30,210.83 29,846.16 55,883.05
Source: Transearch 2010; IHS Global Insight, CDOT, 2015
7
FHWA Freight Facts and Figures 2013:
http://www.ops.fhwa.dot.gov/Freight/freight_analysis/nat_freight_stats/docs/13factsfigures/pdfs/fff2013_highres.pdf
29Chapter 2: Existing Transportation System
Figure 2‐11 shows the existing level of truck traffic from the 2040 RTDM, using natural breaks in the data set.
The numbers provided are total flows, or the total number of trucks in both directions per day. The most heavily
used truck routes in the region are I‐25, US 34, US 85, US 287, and SH 14. As shown, I‐25 carries the heaviest
volume of truck traffic, followed by US 85 and US 34. The Port of Entry, located on I‐25 in Fort Collins, recorded a
total of 960,759 trucks in 2014, with 215,999 passing through the port itself.8
Figure 2‐11: Existing Truck Traffic
To evaluate the safety of truck travel on the roadway network, the percentage of overall crashes involving trucks
was compared against the percentage of truck traffic on the region’s top 10 truck routes. Table 2‐8 compares
Annual Average Daily Truck Traffic (AADTT), Annual Average Daily Traffic (AADT), and the percent truck crashes
along the heaviest‐traveled corridors. This comparison can be used to evaluate safety on routes with high truck
traffic. Table 2‐8 uses the percentage of truck traffic, a weighted average of the State Highway segments that
comprise the corridor, and the percentage of truck crashes (the percent of the total crashes involving a truck),
which is also a weighted average for the corresponding State Highway segments. Due to limitations in the data
for non‐State Highway facilities, this comparison is limited to the State Highway portions of the RSCs. The truck
traffic is for the year 2012 and the truck crash percentages are for the five year period from 2008 to 2012. As
8
Colorado State Patrol, 2015.
30Chapter 2: Existing Transportation System
shown in Table 2‐8, there does not appear to be a clear correlation between the percent truck traffic and the
percent truck crashes.
Table 2‐8: Truck Crash Rates
Percent Percent
AADTT AADT Total Truck
Roadway Truck Truck
(Truck) (All Traffic) Crashes Crashes
Traffic Crashes
I‐25 6,780 57,520 11.8% 3,024 184 6.1%
US 85 1,385 15,750 8.8% 952 78 8.2%
SH 257 454 6,730 6.8% 325 13 4.0%
SH 392 606 9,060 6.7% 677 29 4.3%
SH 14 1,236 19,641 6.3% 776 36 4.6%
US 34 1,328 26,956 4.9% 3,676 95 2.6%
US 85
497 10,550 4.7% 446 19 4.3%
Business
SH 60 321 6,907 4.7% 312 18 5.8%
US 287 880 20,404 4.3% 2,512 38 1.5%
SH 56 358 8,300 4.3% 102 3 2.9%
Sources: CDOT, 2015
Freight Rail
Rail freight in the region is primarily moved on the BNSF Railway and Union Pacific Railroad (UPRR) lines, which
carry between two and 17 trains per day. In 2012, freight railroads originated 30.6M tons of commodities and
terminated 29.7M tons within Colorado. Tables 2‐9 and 2‐10 show the top five commodities originated and
terminated within the State in 2012. Coal was the largest commodity shipped from and within Colorado, making
up 74 percent of originating rail traffic and 58 percent of terminating rail traffic.
Table 2‐9: Colorado Originated Rail Freight (2012)
Commodity Percent of Total Tons
Coal 74% 22,776,000
Other 11% 3,354,000
Cement 6% 1,721,000
Food Products 3% 954,000
Waste & Scrap 3% 947,000
Source: Association of American Railroads, Rail Fast Facts, 2015
31Chapter 2: Existing Transportation System
Table 2‐10: Colorado Terminated Rail Freight (2012)
Commodity Percent of Total Tons
Coal 58% 17,138,000
Other 23% 6,856,000
Stone, sand,
8% 2,475,000
gravel
Intermodal 4% 1,132,000
Food Products 4% 1,059,000
Source: Association of American Railroads, Rail Fast Facts, 2015
Railroads are classified according to the annual gross operating revenue from the railroad operations. A Class I
Railroad is a railroad which had an operating revenue of at least $433.2M in 2011. A regional or short‐line
railroad has annual operating revenue of less than $20M and typically services a small number of towns or
businesses or performs short haul trips between larger railroad lines. Both BNSF Railway and UPRR are classified
as Class I Railroads and the Great Western Railway is considered a regional/short‐line railway. These railroads
are described in more detail in the following section and shown in Figure 2‐12.
Union Pacific Railroad (UPRR): UPRR is a Class I Railroad which has several rail lines in the North
Front Range region. The north‐south line runs from the Denver metro region through the North Front
Range to Wyoming, generally following the US 85 Corridor. The majority of the east‐west line of the
UPRR runs between Milliken and LaSalle, with a switching yard in LaSalle, and from Milliken into Fort
Collins. There are 17 trains per day on the UPRR.
BNSF Railway: BNSF is a Class I Railroad which travels the length of the NFRMPO region, passing
through Fort Collins, Loveland, and Berthoud, parallel to US 287, with a switch yard in Fort Collins. Six
trains operate per day on the BNSF line.
Great Western Railway of Colorado (GWR): GWR is a regional/short‐line railroad. GWR operates
a total of 80 miles of track and interchanges with both BNSF and UPRR. The company operates freight
service between Loveland and Johnstown, with spur lines to Milliken and Longmont. Another line
connects north from Kelim (east of Loveland) to Windsor, and from there to Greeley and Fort Collins.
GWR also owns a branch line from Johnstown to Welty (just west of Johnstown). GWR serves a diverse
customer base including the Great Western Industrial Park. GWR is managed by OmniTRAX.
32Chapter 2: Existing Transportation System
Figure 2‐12: Regional Railroad Lines by Owner
Freight Safety
Freight vehicles and passenger vehicles interact on the roadway system and at the 316 at‐grade railroad
crossings in the region. Table 2‐11 lists the number of crashes at these at‐grade rail crossings. In the 10‐year
period between 2004 and 2014, 25 incidents between trains and passenger vehicles occurred at regional at‐
grade railroad crossings, with nine injuries and two fatalities.
33Chapter 2: Existing Transportation System
Table 2‐11: Railroad Crossing Crashes
Crossing Roadway Crossing
Year Railroad County City/Town Fatality Injury
ID Name Protection
GWR Weld Windsor S45106Y SH 257 Watchman ‐‐ 1
2005 UP Weld Eaton 804856D CR 76 Stop signs ‐‐ ‐‐
nd
UP Weld Greeley 816131K 22 Street Cross bucks ‐‐ ‐‐
Highway traffic
GWR Larimer Loveland 872128C Denver Avenue signal, Cross ‐‐ ‐‐
bucks
Eastman Park Cross bucks,
GWR Weld Windsor 871917X ‐‐ ‐‐
Drive Flagged by crew
2006
Standard Flashing
Light Signal,
UP Weld Milliken 804538S SH 257 ‐‐ ‐‐
Audible, Cross
bucks
UP Weld Milliken 804539Y CR 52 Cross bucks ‐‐ 3
Gates, Cantilever
Horsetooth
BNSF Larimer Fort Collins 244622C Flashing Light 1 ‐‐
Road
Signal
Gates, Standard
2007
Flashing Light
UP Weld Eaton 804853H 2nd Street ‐‐ ‐‐
Signal, Audible,
Cross bucks
GWR Weld Windsor 244889T CR 15 Cross bucks ‐‐ ‐‐
Gates, Standard
Flashing Light
GWR Larimer Fort Collins 244647X Summit View ‐‐ ‐‐
Signal, Audible,
cross bucks
Highway Traffic
2008 GWR Larimer Loveland 921967R Boise Avenue Signals, Wigwags, ‐‐ ‐‐
Bells
Cross bucks, Stop
UP Weld Eaton 804852B CR 72 ‐‐ ‐‐
sign
Cross bucks, Stop
UP Weld LaSalle 804355Y CR 48 ‐‐ ‐‐
sign
BNSF Larimer Fort Collins 244632H Plus Street Cross bucks 1 ‐‐
2010 UP Weld Eaton 804855W 5th Street Cross bucks ‐‐ ‐‐
GWR Weld Windsor 245106Y CR 23 Cross bucks ‐‐ 1
BNSF Larimer Loveland 245032J Private Road Stop signs ‐‐ ‐‐
2011
UP Weld Eaton 804852B CR 72 Stop signs ‐‐ ‐‐
2012 UP Larimer Fort Collins 804501C CR 32 Gates ‐‐ ‐‐
34Chapter 2: Existing Transportation System
D. Bicycle and Pedestrian System
Bicycle System
Regional Bicycle Plan
The NFRMPO completed and adopted the NFRMPO Regional Bicycle Plan on March 7, 2013. This plan reports
existing and proposed bicycle facilities on RSCs. The purpose of the plan is to:
Provide a summary of existing bicycle facilities;
Identify opportunities to connect and enhance the regional bicycle system;
Identify regional bicycle corridors and provide implementation steps;
Provide member governments with tools to support local bicycle planning;
Position the NFRMPO to pursue multiple funding sources (including State and federal sources); and
Fulfill the federal requirement to address bicycle planning as a component of the RTP.
The plan identifies existing facilities within the region, as well as 12 regional bicycle corridors which could serve
as main routes for bicycle and pedestrian travel between and through local communities as well as connections
to areas adjacent to the region. While certain segments of the regional bicycle corridors exist today, much of the
network remains conceptual. One of the goals outlined in the plan is for the NFRMPO to provide local assistance
in the planning and funding of these corridors. Table 2‐1 lists locations of the 12 regional bicycle corridors as
outlined in the plan.
Existing Bicycle Facilities
Facilities identified in the plan include multi‐use off‐street trails, on‐street bicycle lanes, and on‐street bicycle
routes. The following are common definitions of these facilities:
Multi-Use Off-Street Facility – a hard or soft surface trail designed to be used by commuters and
recreationalists. These facilities are accessible to bicycles, pedestrians, equestrians, and other non‐
motorized users.
On-Street Bicycle Lane ‐ an on‐street bicycle facility delineated by pavement markings and
signage for the use of bicyclists. Typically located on roadways with a classification of collector and
above.
On-Street Bicycle Route – an on‐street bicycle facility, delineated by signage only. These
facilities tend to be located on lower volume residential streets or in semi‐rural areas.
The facilities shown in Figures 2‐13 and 2‐14 were identified from a number of sources, the NFRMPO Regional
Bicycle Plan, local Master Street Plans and Standards, as well as existing local bicycle and pedestrian plans. They
were further refined during discussions with individual local governments. Table 2‐12 shows the miles of bicycle
facilities currently exist in the region.
35Chapter 2: Existing Transportation System
Table 2‐12: Existing Bicycle Facility Miles
On‐Street Bike On‐Street Bicycle Multi‐Use Off‐Street
Community
Lane Miles Route Miles Facility Miles
Berthoud 2 0 1
Eaton 0 0 2
Evans 0 0 24
Fort Collins 142 25 31
Greeley 44 39 34
Garden City 0 0 0
Johnstown 2 0 0
LaSalle 0 2 0
Loveland 83 15 3
Milliken 0 0 4
Severance 1 0 0
Timnath 0 0 1
Windsor 20 0 22
Larimer County 69 2 26
Weld County 11 0 59
Total: 374 83 207
Source: NFRMPO Regional Bicycle Plan, 2013
36Chapter 2: Existing Transportation System
Figure 2‐13: Off‐Street Bicycle Facilities
37Chapter 2: Existing Transportation System
Figure 2‐14: On‐Street Bicycle Facilities
38Chapter 2: Existing Transportation System
Pedestrian System
Existing Pedestrian Facilities
The NFRMPO also gathered data on existing pedestrian facilities, which includes multi‐use off‐street trails and
sidewalks. The following are common definitions of these types of facilities:
Multi-Use Off-Street Facility – a hard or soft surface trail designed to be used by commuters and
recreationalists. These facilities are accessible to bicycles, pedestrians, equestrians, and other non‐
motorized users. Figure 2‐15 shows multi‐use off‐street facilities.
Sidewalk – a paved walkway along the side of an existing street or roadway. Sidewalks are
essential to support local transit service access.
The facilities in Figure 2‐15 were identified from a number of sources, the NFRMPO Regional Bicycle Plan, local
Master Street Plans and Standards, as well as existing local bicycle and pedestrian plans. They were further
refined by discussions with individual local governments. Sidewalk totals were only gathered for the
communities of Evans, Fort Collins, Greeley, Loveland, and portions of Windsor due to limited Graphic
Information Systems (GIS) resources in many of the member communities.
Table 2‐13 shows current data gathered on the number of pedestrian facilities within the region.
Table 2‐13: Existing Pedestrian Facilities
Multi‐Use
Sidewalk
Community Off‐Street
Miles
Facility
Berthoud 1 ‐‐
Eaton 2 ‐‐
Evans 24 147
Fort Collins 31 844
Greeley 34 968
Garden City 0 ‐‐
Johnstown 0 ‐‐
LaSalle 0 ‐‐
Loveland 3 475
Milliken 4 ‐‐
Severance 0 ‐‐
Timnath 1 ‐‐
Windsor 22 ‐‐
Larimer County 26 ‐‐
Weld County 59 ‐‐
Total: 207 2,434
Sources: NFRMPO Regional Bicycle Plan, 2013;
NFRMPO Cities, Towns, and Counties, 2014
39Chapter 2: Existing Transportation System
Figure 2‐15: Existing Sidewalks
40Chapter 2: Existing Transportation System
Bicycle and Pedestrian Count Locations
One challenge to implementing a regional bicycle system is documenting the system’s performance. In 2010,
CDOT established a formal bicycle and pedestrian counting program which included the purchase of permanent
and mobile bicycle and pedestrian counters for the State. In November 2014, NFRMPO staff met with CDOT, the
City of Fort Collins, and Colorado State University (CSU) to establish the location for a permanent counter along
a regional and local bicycle facility. It was determined a counter should be placed at the intersection of the
Mason Corridor Trail (RBC 8: BNSF Fort Collins/Berthoud Trail) and the Spring Creek Trail in Fort Collins to gather
accurate, year‐round information on both bicycle commuters and recreational trail users. RBC 8 was identified
as a possible location for a permanent bicycle counter location in the Regional Bicycle Plan.
Currently, the cities of Fort Collins, Greeley, and Loveland are the only municipalities collecting count data on
their bicycle and pedestrian trail systems. Greeley and Loveland use mobile electronic counters to gather data,
while Fort Collins recruited volunteers to conduct manual counts at the locations provided in Tables 2‐14
through 2‐16. Counts were collected between January, 2013 and September, 2014.
Table 2‐14: Fort Collins Bicycle and Pedestrian Counts
Estimated
Location Daily
Average
Ziegler Road and Kechter Road 200
Power Trail at Horsetooth Road Trailhead 500
Mason Trail at Horsetooth Road Trailhead 650
Spring Creek Trail at Drake Road Trailhead 1,400
Horsetooth Road and Shields Street Intersection 450
Fossil Creek Trail at Spring Canyon Park Trailhead 900
Poudre River Trail at Lincoln Avenue Trailhead 950
Spring Creek Trail at Lee Martinez Park Trailhead 1,700
Mountain Avenue at Mason Street Intersection 1,150
Laurel Street and Remington Street Intersection 1,800
Prospect Road at Remington Street Intersection 1,800
Spring Creek Trail at Centre Avenue Trailhead 1,200
Taft Hill Avenue at LaPorte Avenue Intersection 750
Mountain Avenue at Remington Street Intersection 450
Source: City of Fort Collins, 2014
41Chapter 2: Existing Transportation System
Table 2‐15: Greeley Bicycle and Pedestrian Counts
Daily Peak Day Count
Location Peak Day
Average Volume Month
Poudre River Trail at Island
69 211 Monday January
Grove Trailhead
Poudre River Trail at 25th
72 335 Sunday January
Avenue Trailhead
Poudre River Trail at 35th
149 437 Sunday May
Avenue Trailhead
Poudre River Trail at 35th
240 403 Saturday July
Avenue Trailhead
Source: City of Greeley, 2014
Table 2‐16: Loveland Bicycle and Pedestrian Counts
Daily Peak Day Count
Location Peak Day
Average Volume Month
June 4 –
North Taft Avenue – Between
46 49 Wednesday December
8th Street and 10th Street
31, 2013
Source: City of Loveland, 2014
E. Transportation Demand Management Program
Transportation Demand Management (TDM) strategies are actions which improve transportation system
efficiency by altering transportation system demand rather than roadway capital expansion. TDM strategies
include the following:
Reducing trip length or time;
Encouraging off‐peak travel; and
Reducing single‐occupancy vehicles (SOV) on roadways.
In 1996, the NFRMPO began implementation of the SmartTrips™ program for Northern Colorado with
designated staff from the NFRMPO and the communities of Fort Collins, Greeley, and Loveland. The program
was part of a package of strategies developed to reach the goals established by the NFRMPO which include
reducing the number of trips made by SOVs by 10 percent by the year 2015.
The NFRMPO currently provides several TDM programs, including the VanGo™ vanpooling program, ride
matching through the Go Portal (www.smarttrips.org), and business outreach services and events.
NFRMPO Household Survey of 2010 and Implications for TDM
The NFRMPO conducted a household survey in 2009 for the NFRMPO sub‐regions. Staff collected data
throughout the region and documented it in the NFRMPO Household Survey of 2010. The survey was conducted
42Chapter 2: Existing Transportation System
in the same manner across all sub‐regions, providing a snapshot of current travel behavior throughout the North
Front Range. The data has been used to target TDM service improvements for existing programs as well as
exploring the potential for new services and programs in the region.
Key differences between the cities, towns, and rural areas in the region are reflected in household travel
behavior. Some characteristics include:
Fort Collins – Fort Collins households report smaller‐than‐average household sizes and fewer
vehicles. These households report the highest levels of non‐motorized travel in a typical week and
the highest levels of transit pass ownership. Household members have higher‐than‐average
education levels and more students per household than the other areas. Fort Collins respondents
have a higher average number of bicycles per household and report riding a bicycle or walking to
work or school more frequently than other parts of the region.
Greeley/Evans – Households in the Greeley/Evans area are the most unique of the four areas.
Consisting of more retirees and minorities than other areas, these households tend to be smaller,
with fewer vehicles, fewer students, fewer workers, lower incomes, and the highest disability rates.
The Greeley/Evans area has higher renter rates, and respondents are more likely to hold a transit
pass than other areas of the region, with the exception of Fort Collins. Households in the
Greeley/Evans area use transit more frequently than other parts of the region. Thirteen percent of
Greeley/Evans drivers do not have a driver’s license, which may contribute to higher levels of
walking or transit use.
Loveland – Loveland households tend towards average regional characteristics. They report
somewhat smaller household sizes and number of workers per household, but higher‐than‐average
renters. Loveland households have above‐average transit usage for the region.
Larimer County – Household size in unincorporated Larimer County is smaller than average, but
respondents report the highest number of vehicles per household. They have the highest licensure
rate, lowest levels of disability, above‐average number of workers per household, and have the
highest reported income levels in the region.
Weld County – Respondents in unincorporated Weld County are similar to those in Larimer
County, with the exception that they have lower education rates and more Hispanic households
than the regional average. They are younger, have more students, and report the largest household
size. Transit use is lowest in unincorporated areas of Weld County.
I-25 Carpool Park and Ride Study
In the summer of 2010, the NFRMPO conducted a survey to determine how Park‐n‐Rides (PNRs) were being
used along the I‐25 corridor in the region. The six regional PNRs were surveyed during the morning (a.m.) and
evening (p.m.) peak periods on weekdays, during July and August 2010. The regional PNRs include:
Harmony Road (Fort Collins) –Exit #265
SH 392 (Windsor) – Exit #262
US 34 (Loveland) – Exit #257
43Chapter 2: Existing Transportation System
SH 402 (Loveland) – Exit #255
SH 60 (Johnstown) – Exits #252 and #254
SH 56 (Berthoud) – Exit #250
The results of the surveys show a significant change in PNR use compared to previous surveys. Highlights from
the 2010 survey include:
SH 402 and SH 60 approached or exceeded 100 percent capacity on the days surveyed. At the SH
402 PNR, which currently has 88 paved spaces, users were also parking in a makeshift unpaved
extension of the lot.
SH 392 had the largest drop in use (from 36 vehicles in previous surveys to 11‐12 vehicles).
License plate data collected from 532 license plates and matched with home addresses in Northern
Colorado revealed 38 percent of the cars at the six PNRs were from the Fort Collins area, while 25
percent were from the Loveland area. Berthoud, Greeley, Johnstown, and Denver Metro area each
yielded between 9 and 10 percent.
Carpools represent more than 70 percent of the overall usage at PNRs in the NFRMPO region.
Vanpools accounted for 24 percent of the vehicles leaving in the morning and 20 percent of the
vehicles arriving in the afternoon. The Harmony Road PNR had the largest number of morning and
afternoon carpools (39 and 48 vehicles, respectively).
54 percent of carpools in both the morning and afternoon contained two passengers while the three
passenger vehicles accounted for 11 and 18 percent, respectively.
Regional TDM Efforts
NFRMPO serves as the regional coordinator for TDM programs in the North Front Range. This includes the
VanGo™ Vanpool Services program and business outreach.
VanGo™
The VanGo™ program, managed by the NFRMPO, provides vanpool services to meet the origin and destination
needs of commuters in the region and between the North Front Range and the Denver Metro area. The
program, which began in 1994, has grown over the last 20 years to more than 400 riders and 74 routes in 2014.
SmartTrips™
The NFRMPO has focused on regional modes of transportation, including carpooling and vanpooling along with
the ridesharing website www.smarttrips.org. The NFRMPO developed a free online tool, The Go Portal, which
allows commuters to find carpool matches, calculate commute savings, and get information on commute
options.
CarGo™
Carpool matching is provided by CarGo™, a ridesharing system available through the SmartTrips™ website. The
CarGo™ program enables users to receive personalized carpool matches. The tool matches carpool participants
who live near each other and are traveling in the same direction, during the same time period, to share the ride
to school or work.
44Chapter 2: Existing Transportation System
Bicycle Programs
The NFRMPO works with CDOT and local governments to promote Bike Month and Bike to Work Day every June.
Additionally, there are more than 290 miles of bicycle facilities (bike routes, paths, lanes, and off‐street trails)
within ¼‐mile of the RSCs in the region (I‐25, US 34, and US 287 and parallel facilities, as defined in Section A).
The SmartTrips™ website allows users to track miles of bicycle travel. Tracking these miles serves as an
important performance measure for the program. Personal and employer incentives will need to be employed
to increase reporting participation.
Local Government TDM Efforts
Local governments in the region are also involved in TDM efforts. Transit and bicycle programs are the most
common focus of TDM efforts in the NFRMPO region. Some local governments have also developed ITS which
provide information to travelers about traffic, weather, construction, and other travel factors.
City of Fort Collins
The City of Fort Collins is the largest city in the NFRMPO region, with a population of 143,986 (2010 Census). It is
an economic and academic hub within the region and is home to CSU.
FCTrip
FCTrip is a web‐based application that provides information to travelers in the City of Fort Collins, including:
Timely and accurate information regarding traffic conditions;
Information on weather conditions;
Information on work area traffic, road construction, and road/lane closures; and
Up‐to‐the‐minute photographs of major intersections.
FCTrips provides this information through a network of closed‐circuit television cameras, video detectors, and
pavement sensors. Users are able to view real‐time maps that provide information on traffic conditions,
construction, and road closures. An example FCTrip map is shown in Figure 2‐16.
Fort Collins Bike Library
The Fort Collins Bike Library was established in conjunction with FC Bikes – City of Fort Collins, New Belgium
Brewery, the Downtown Development Authority, and Bike Fort Collins – a non‐profit group established in 2005
for bicycle advocacy. The Bike Library provides bicycle and equipment rental service for residents, students, and
visitors to Fort Collins for a minimal cost (first day free, $10 each additional day). Members can borrow a bike for
as short as one hour or for as long as seven days. The bike library provides a fleet of commuter bikes, cruiser
bikes, children’s bikes, striders, tandem bicycles, and bicycle trailers to attract a broad user base. As of May
2015, just over 24,000 registered patrons have checked out over 24,000 bikes, logged over 275,000 miles,
109,000 rider days, and prevented nearly 125 metric tons of CO₂ from being released into the atmosphere.9
9
According to FC Bikes and Bike Fort Collins
45Chapter 2: Existing Transportation System
Figure 2‐16: FCTrip Map
Transfort
Transfort offers Passfort, an employer‐based bus program which allows for a bulk purchase of bus passes. All
buses are equipped with bicycle racks to increase multimodal transportation opportunities.
FC Bikes
FC Bikes is the bicycle program established for the City of Fort Collins. In 2014, Fort Collins completed an
updated Bicycle Master Plan that covers a cost‐effective approach to bicycle infrastructure, connectivity,
policies, and programs. The plan aims to implement bicycle infrastructure improvements which will help the City
achieve Diamond Status on Bicycle Friendliness by the League of American Bicyclists by the year 2020. The goals,
principles, and policies that pertain to bicycling established in the City’s Plan and the Transportation Master Plan
have laid the foundation for the current policies, projects, and programs as well as the focus for the numerous
recommendations provided. In addition, FC Bikes promotes bicycling in the City by sponsoring events such as
Bike to Work Day, Winter Bike to Work Day (in December), and BikeWinter, encouraging cyclists to ride
throughout the winter. Winter Bike to Work Day in December is the cornerstone event, with increased numbers
of participants in each year since its inception in 2007. The City of Fort Collins Transportation Board
incorporated a bicycle sub‐committee in 2009.
46Chapter 2: Existing Transportation System
Climatewise
Climatewise is a free, voluntary City of Fort Collins program that assists local businesses and the environment
through the promotion of waste reduction, energy savings, alternative transportation, water conservation, and
practicing pollution prevention.
Colorado State University – TDM Programs
With an enrollment of 26,775 students for the 2015 Spring Semester,10 CSU has a significant transportation
impact on the City of Fort Collins. The presence of students and faculty impacts the City’s demographics and
transportation system. For example, Fort Collins has a higher level of bicycle commuting than the national
average and other parts of the region. This can be partially attributed to the student population. In addition,
more than 35 percent of Fort Collins households reported that someone walks or bikes to work or school at least
once a week.11 CSU has implemented TDM programs to alleviate parking issues and congestion on campus.
All CSU students, faculty, and staff are able to ride the Transfort bus system at no cost, using their university
identification card. The transit center at Lory Student Center, opened in 2006, includes a Transfort customer
counter, flat screen monitors displaying departure times and news stories, and an indoor passenger waiting area
to increase comfort and convenience. The transit center is certified LEED Gold.
The Fort Collins Bike Library also has a station at the Lory Student Center, providing students, faculty, and staff
access to bicycles. CSU has hundreds of user‐friendly bike racks to accommodate an estimated 14,200 bicycle
parking spaces on the main campus and 1,100 spaces at the satellite campuses.12 CSU also provides a full subsidy
for employee vanpools through the VanGo™ program.
City of Loveland
In 2012, the City of Loveland completed their Bicycle and Pedestrian Plan which covers strategies and activities
to increase the use and convenience of bicycle and pedestrian facilities throughout the City. The plan aims to
provide goals and objectives to provide a safe and effective bicycle and pedestrian system, fill in missing
segments in the system, design and develop a complete streets system, and develop a continued source of
funding for bicycle and pedestrian infrastructure.
Loveland also sponsors an annual Bike to Work Day event, including a business challenge to encourage
employers to promote cycling as a transportation option to their employees. Additionally, the City of Loveland's
Engineering Department has partnered with the Thompson School District to promote Safe Routes to School
Program. This program benefits children and the community by reducing traffic congestion in school zones,
improving air quality, increasing physical activity for children and adults, and promoting safe neighborhoods.
City of Greeley
The City of Greeley is home to approximately 115 miles of bike lanes, trails, and paths and was designated a
Bronze Level Bicycle Friendly CommunitySM by the League of American Bicyclists in May 2013. Greeley’s Bicycle
10
Colorado State University Census Enrollment, spring 2015. Department of Institutional Research, Colorado State
University
11
NFRMPO Household Survey of 2010
12
Colorado State University Bicycle Master Plan, 2014
47Chapter 2: Existing Transportation System
Master Plan was adopted in May 2015 and aims to increase investment in the bicycle and pedestrian system
through a dedicated budget and implementation of a complete street program.
The City also hosts a number of cycling events throughout the year, including bike to work day and pop‐up
demonstrations of enhanced bicycle facilities. Greeley has also used the Safe Routes to School Program to
provide funding for school zone enhancements to the bicycle and pedestrian system.
Local Transit Programs
Transit is a large portion of TDM and Section H of this chapter provides more detail about the various regional
transit programs.
Employer-based TDM programs
Employer‐promoted TDM programs are an effective, locally‐based mechanism to increase employee use of
alternative modes for their commute to work.
A notable employer‐based TDM effort in the region is the New Belgium Brewery. New Belgium actively
promotes and supports bicycle commuting within their company and nation‐wide. New Belgium employees
receive a custom cruiser bicycle after one year of employment with the company. Team Wonderbike is New
Belgium’s bicycle commuter advocacy program with more than 10,000 members who have pledged to offset
more than eight million car miles per year by riding their bikes. New Belgium also offers local grants,
sponsorships, and product donations to applicants whose objectives align with New Belgium’s.
CDOT offers TDM programs to its employees located throughout Colorado. Employees who work in the NFRMPO
region are provided with a monthly commuter check worth $35 to subsidize vanpool costs. Employees who
travel to the Denver metro area for meetings are provided with a RTD Eco Pass allowing them to ride transit.
Full‐time employees who commute to the Denver region from the NFRMPO region are also provided with Eco
Passes. CDOT sponsors Bike to Work Day events in June at all of its statewide offices and provides incentives for
employees to ride their bikes to work through the month of July.
Several regional employers promote transportation alternatives in conjunction with other events at the
workplace, most commonly health fairs, including:
Advanced Energy, Inc.
AMD
Avago Technologies
Gallegos Sanitation
Hach
Hewlett‐Packard
Intel
LSI Corporation
McKee Medical Center
Platte River Power Authority ‐ Rawhide Power Plant
Rickards Long & Rulon, LLP
Poudre River Public Library District
48Chapter 2: Existing Transportation System
State Farm Insurance – Great Western Region
Weld County
Woodward Governor
F. Aviation Facilities
Two airports currently operate within the NFRMPO region: Fort Collins‐Loveland Municipal and Greeley‐Weld
County. The Fort Collins Downtown Airport closed in 2006. Each of the two operating facilities is described in
more detail in the following sections. Figure 2‐17 shows the location of the two regional airports.
Figure 2‐17: Regional Airports
Fort Collins-Loveland Municipal Airport
Fort Collins‐Loveland Municipal Airport (FNL) is a Major Commercial Service Aviation airport, which operates
under a limited Federal Aviation Regulation (FAR) Part 139 certificate. This Regulation establishes operation
procedures for commercial service. The airport previously had regularly scheduled commercial service through
Allegiant Air, which was discontinued in October 2012. The airport has two runways ‐ 15/33 and 6/24. Runway
15/33 is 8,500 feet in length and has a width of 100 feet. This runway has an asphalt surface with high intensity
runway lighting. Runway 6/24 is 2,273 feet in length and 40 feet in width. This runway has an asphalt surface,
but does not have any runway lighting. The airport is equipped with a VHF (Very High Frequency) Omni‐
49You can also read