RETHINKING THE BUS: FIVE ESSENTIAL STEPS FOR IMPROVING MOBILITY IN THE CAPITAL REGION - SEPTEMBER 2018
←
→
Page content transcription
If your browser does not render page correctly, please read the page content below
Issue Brief

RETHINKING THE BUS:
FIVE ESSENTIAL STEPS
FOR IMPROVING MOBILITY
IN THE CAPITAL REGION

SEPTEMBER 2018
Acknowledgement: This Greater Washington Partnership appreciates
the thoughtful insights and strong commitment from our partners
in development of this brief, and we stand together in working with
regional transit agencies and others to execute its recommendations:
Greater Baltimore Committee, Central Maryland Transportation
Alliance, Greater Washington Board of Trade, Coalition for Smarter
Growth, DC Sustainable Transportation, ChamberRVA, and RVA
Rapid Transit. The team has benefited from the expert guidance of
Jacob Mason of the Institute for Transportation Development Policy
and Kirk Hovenkotter of TransitCenter in developing this brief. The
Partnership thanks Sarah Kline of SK Solutions for her research,
counsel, and management of this issue brief.
EXECUTIVE SUMMARY

In the Capital Region of Baltimore, Washington, and
Richmond, more than ten million people rely on the region’s         FIGURE 1. PERCENT CHANGE IN POPULATION
transportation system every day. But traffic congestion             & BUS RIDERSHIP BY METRO AREA, 2010-2017
is increasing, commutes are becoming longer and more
frustrating, and many people still struggle to access jobs and          15%
opportunity reliably and affordably. To address these issues,
                                                                        10%
multiple elements of the transportation network require
                                                                         5%
attention, from improving the performance of key highways1
to seamlessly connecting our mobility options.2 Though long              0%
overlooked, buses are also a key part of the solution to the             -5%
region’s mobility challenges.
                                                                       -10%

While there have been notable improvements to bus                      -15%
service in recent years, the region can do more to allow               -20%
buses to reach their full potential as a mobility solution.
                                                                       -25%
All transportation stakeholders—from local and state
governments to transit agencies to the private sector—have a           -30%
                                                                                  BALTIMORE             WASHINGTON              RICHMOND
role to play in rethinking the bus.

Buses have natural advantages over other types of                          POPULATION          BUS RIDERSHIP

transportation: they come in many sizes, are affordable and         Source: U.S. Census and TransitCenter’s NTD Transit Ridership Analysis, 2002-
accessible to nearly everyone, and can serve all types of           2017.

areas. Buses can provide long-distance commuter service
or short trips around a city, and they run on existing roads
without requiring expensive new infrastructure. In short,           FIGURE 2. CHANGE IN BUS RIDERSHIP, 2010-2017
buses can be a cost-effective, efficient solution for moving
                                                                               METRO AREA                                      CHANGE
people, particularly in heavily-populated areas.

                                                                  Baltimore                                                                 -23.52%
However, many parts of the United States, including the
Capital Region, have not fully valued or maximized the power
                                                                  Washington                                                                  -7.68%
of the bus. Local and state governments, which own the
roads on which buses travel, typically require buses to use       Richmond                                                                  -24.66%
the same congested lanes and wait at the same red lights as
cars, despite their ability to carry many times more people       20 largest U.S. bus systems                                               -11.85%

and offer a viable alternative to single occupancy vehicles.
                                                                 Note: 20 largest bus systems based on 2017 ridership.
Bus service has been limited by competing funding priorities.    Source: TransitCenter’s NTD Transit Ridership Analysis, 2002-2017.

                                                                                                                                                       3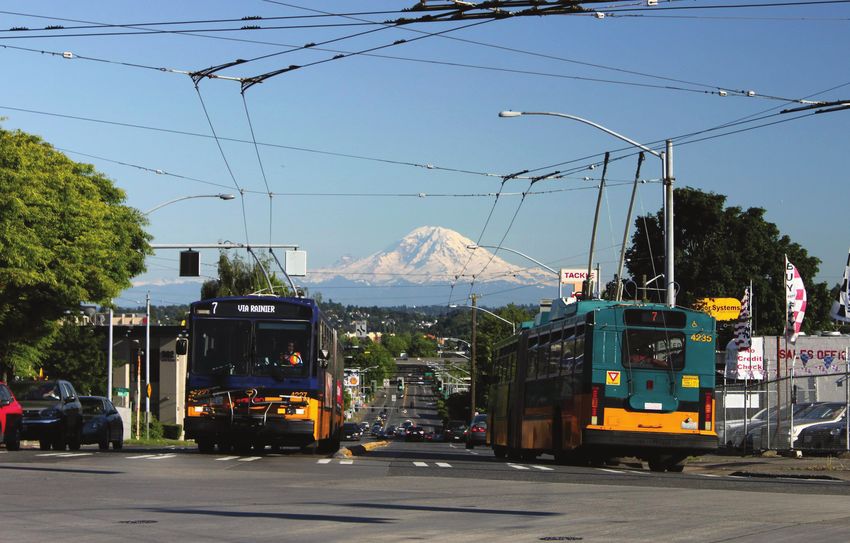
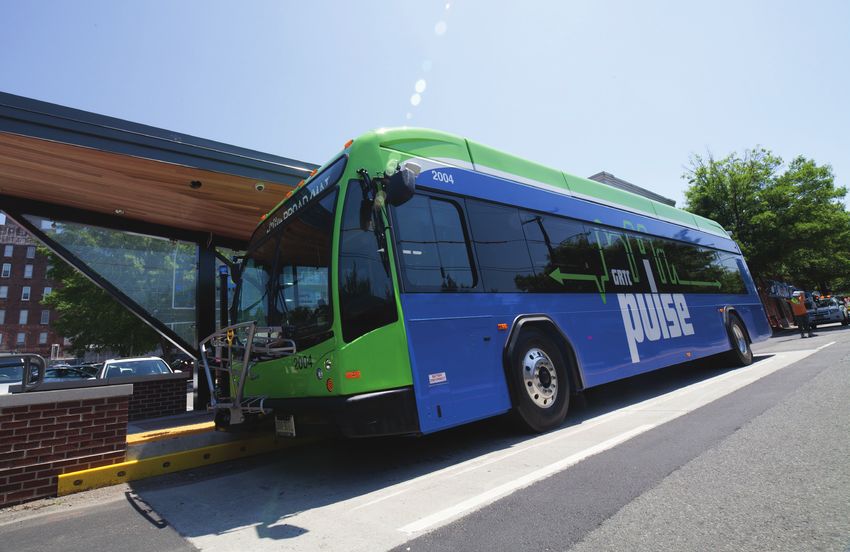
Credit: GRTC Transit System

Other modes—bikeshare, rail, ride-sharing—have captured          It’s time for the Capital Region to rethink the bus. The region
the spotlight, engendering regional conversations about          needs buses that are fast, reliable, and frequent. Riding the
strategies and solutions that rarely include buses.              bus should be easy and convenient and the experience should
                                                                 be comfortable, safe, and modern. Capital Region consumers
As a result, buses are often the slowest vehicles on the road,   should be able to count on buses to take them where they
and the ride of last resort for many people. It is no wonder     need to go, not leave them waiting at the stop. Buses should
that bus ridership has been declining in the Capital Region,     be treated as a valued part of the transportation system and
mirroring a national trend. (See Figures 1 and 2.)               empowered to effectively serve the needs of consumers in
                                                                 the region.
Slow buses and declining ridership limit the region’s
economic potential. Poor service does little to combat           There are some promising changes already in place, and
traffic congestion, which costs people both time and money.      other efforts are underway. The Greater Richmond Transit
Unreliable public transportation makes it harder for workers     Company (GRTC) recently launched the Pulse, the longest
to find jobs and for the region’s employers to recruit talent.   bus rapid transit (BRT) line in the Capital Region and
This in turn undermines the region’s ability to attract new      the Richmond metro area’s first BRT service, as well as a
and expanded businesses. While a significant investment has      complete redesign of routes within the city. The Maryland
already been made in buses (the region’s bus fleet totals more   Transit Administration (MTA) implemented a major redesign
than 3,800 vehicles3), as a whole, the region has not fully      of Baltimore’s bus routes to increase frequency on major
leveraged the potential of this important asset to help solve    corridors and improve reliability. Residents and visitors
mounting transportation challenges.                              in Washington are enjoying faster service on the region’s

4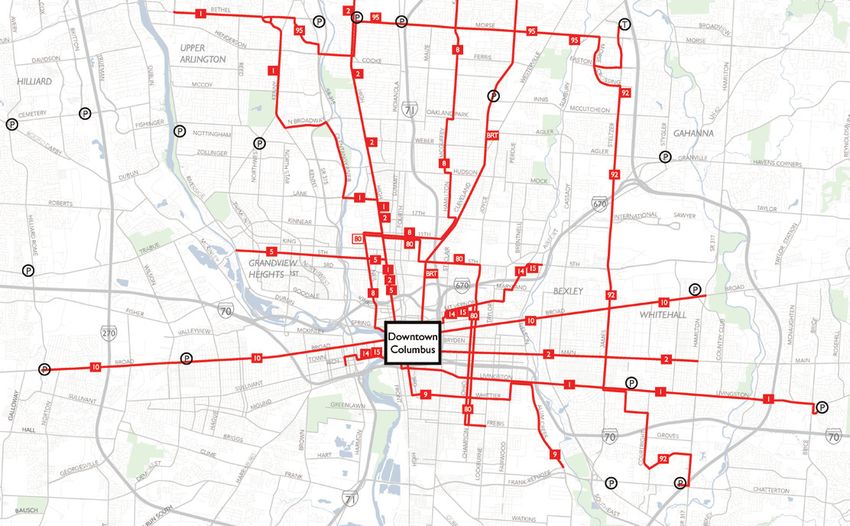
limited-stop MetroExtra and Metroway bus routes, and the            The Capital Region’s bus systems are already working hard,
Washington Metropolitan Area Transit Authority (WMATA)              providing more than 900,000 trips each weekday.8 But the
is moving forward on implementation of its Priority                 region has been slow to adopt best practices for bus service
Corridor Network and also launching study, with regional            across the entire system. The entire Capital Region has just
stakeholders, to better define the role of bus in the region.       12.5 miles of dedicated bus lanes. There are just over 300
                                                                    intersections enabled with transit signal priority (TSP) out of
Still, there is more that can be done, as other regions have        the thousands of intersections used by buses in the region.
shown. Seattle has used a combination of dedicated bus              Richmond’s new Pulse BRT is the only bus service in the
lanes, priority movement for buses at key intersections,            region that allows off-board fare payment to speed boarding.
higher frequency on its most popular routes, and faster
fare payment to make its buses faster, more reliable, more          Creating a high-performing bus network is a shared
accessible, and easier to use. Seattle’s bus ridership has          responsibility. Transit agencies, local and state officials,
continued to grow—up 16 percent since 20104—while most              employers and employees, and the community must work
other bus systems are shedding riders.                              together to fully leverage the region’s bus systems and lay the
                                                                    groundwork for future success. That strategy must address
Houston recently completed a comprehensive set of route             five key actions, which can be undertaken immediately and at
changes to provide high-frequency bus service to thousands          a far lower cost than most major road or rail projects:
more residents, with limited impact on its annual budget.
Since the change took effect, Houston’s bus ridership has           •    Optimize routes
been steady while other Texas cities have lost riders.5             •    Make space for the bus
                                                                    •    Make boarding faster
Over a decade ago, Seoul’s leaders responded to increasing          •    Make buses easy to use
traffic congestion and declining bus ridership with a series        •    Measure and report on performance
of reforms, including route redesigns, fare payment changes,
and bus priority treatments. Bus speeds during peak periods         This brief offers recommendations specific to each metro
increased 30 percent following the reforms, and ridership           area, to help them build upon the progress that has already
increased by more than 10 percent.6 Seoul’s bus system is           been made while encouraging the region to continue to
now recognized as one of the fastest, most convenient, and          rethink the bus.
most reliable in the world.7

                                 While the three regional transit providers—MTA, WMATA, and GRTC—are the focus of this
                                 report, at least thirty different agencies provide some form of public transportation in the Capital
     CAPITAL                     Region. Some of these are significant bus systems in their own right; Montgomery County and
                                 Fairfax County each have bus fleets comparable in size to regions such as Orlando and Buffalo.
     REGION                      Many of these transit providers—such as the RTA which serves Howard, Anne Arundel, and other
     TRANSIT                     locations in Central Maryland, and FRED, which serves the Fredericksburg area—find themselves
                                 with a dual mission: to address mobility needs within their borders while also helping their
     PROVIDERS                   residents connect with opportunities in the rest of the region. The Partnership encourages all
                                 transit providers in the region to adopt the best practices called out in this brief.

                                                                                                                                        5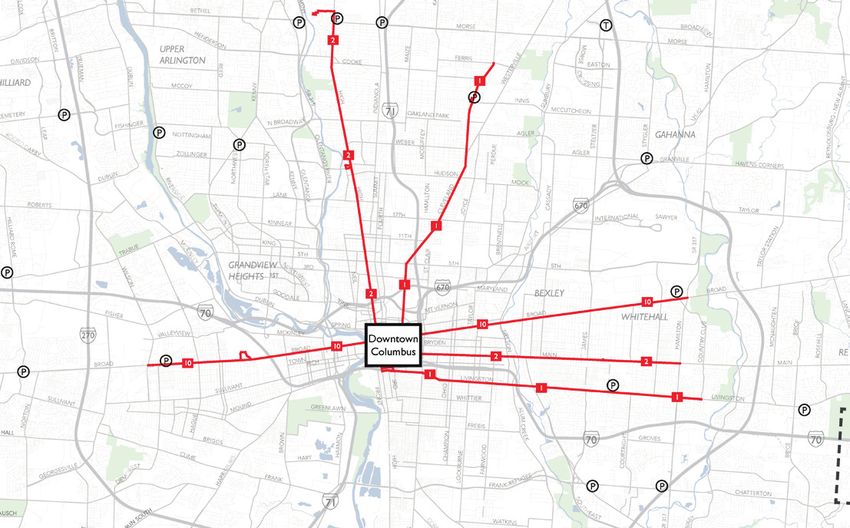
NEXT MOVES TO RETHINK THE CAPITAL REGION’S BUSES

     METRO AREA                       PRIORITY ACTIONS                                                     LEAD ACTOR

                  Improve bus speed and reliability with dedicated lanes and signal
                                                                                        Baltimore City and county DOTs and MTA
                  priority on high ridership, congested corridors

                  Transform North Avenue with continuous bus lanes and bike and
                                                                                        Baltimore City DOT and MTA
                  pedestrian infrastructure

                  Connect more people and jobs by adding frequency and service
                  hours to key routes, including routes serving low-income areas        MTA, Baltimore Mayor, and County Executives
                  with high non-vehicle ownership rates
     BALTIMORE
                  Deliver a bold transit vision through the Central Maryland
                                                                                        Appointing entities, MTA, BMC
                  Regional Transit Plan Commission

                  Pilot innovative transit services to fill mobility gaps in suburban
                                                                                        MTA, local transit providers, employers
                  areas

                  Increase transparency and public reporting of bus performance         MTA

                                                                                        WMATA, including its Board and its bus drivers;
                  Make buses more reliable and efficient through a coordinated
                                                                                        local transit providers and their bus drivers; local
                  regionwide effort to optimize bus service
                                                                                        governments
                  Develop a regionwide strategy for implementing dedicated lanes,
                  signal priority, and other bus priority treatments to improve         District, state, county, and city DOTs
                  reliability and speed of buses on congested corridors

                  Complete ready-to-go bus improvement projects such as 16th
WASHINGTON        St., Downtown West and US-29
                                                                                        District, state, county, and city DOTs

                  Establish mobile fare payments to speed boarding and coordinate
                                                                                        WMATA and local transit providers
                  with other services

                  Amend formula for allocating Metrobus costs to include
                                                                                        WMATA
                  incentives for prioritizing buses

                  Further expand bus service in Henrico and Chesterfield counties
                  building on the expanded service that launched in September           Henrico and Chesterfield Boards of Supervisors
                  2018 on three major Henrico routes
                  Expand service and stop locations along Jefferson Davis Highway
                  to Chester and U.S. 1 to Ashland to lay the groundwork for the        City and county elected officials, GRTC
                  next BRT line

                  Consolidate Richmond transportation staff into a single City
     RICHMOND     department
                                                                                        City of Richmond Chief Administrative Officer

                  Implement and regularly update the Richmond Connects
                                                                                        City of Richmond Mayor and CAO
                  Strategic Multimodal Transportation Plan

                  Monitor and report on bus on-time performance by route                GRTC

66                                                                                                                                             6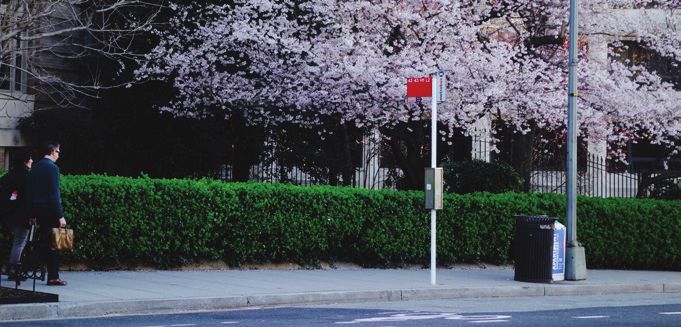
INTRODUCTION

With population growing, traffic congestion increasing,     According to the National Capital Region Transportation
and job access challenges continuing for many residents     Planning Board, on average 50–60 percent of a bus’
and employers, the Capital Region needs to rethink its      running time is spent in motion, 20 percent is at bus stops,
buses. While some major advances have already been          and 20–30 percent is at traffic signals or in congestion-
made—such as Richmond’s and Baltimore’s recent              related delay.9 There is no simple fix to address all of these
redesigns and Washington’s growing Priority Corridor        aspects of bus service. Creating a system that prioritizes
Network—the region as a whole lacks a forward-thinking      bus movement can effectively serve the region’s mobility
strategy to make buses a truly competitive transportation   needs, but it will require a new approach for planning
option. With a new commitment to rethink the bus, the       and delivering service, and an overhaul of the way
region could become a national transportation leader with   buses interact with other mobility options in the region,
buses that are fast, frequent, reliable, and easy to use.   including existing roadways.

Rethinking the bus does not require years of planning;
it can start today. Better bus service will attract more
riders and improve travel for those already riding. More
fare revenue coupled with more efficient service will
give taxpayers more value for their public transportation
spending.

                   IMAGINE IF…
     …you could beat traffic by taking a fast, modern bus.

                                                                                                                             7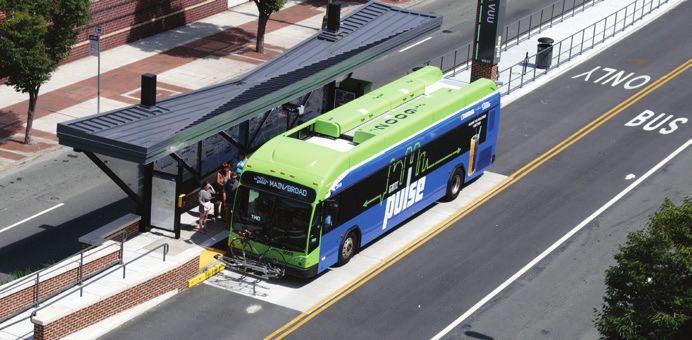
FIVE ACTIONS TO
RETHINK THE BUS

Bus service is not an end in itself, but rather a means       A new regional commitment to the following five actions
toward making the Capital Region one of the world’s best      will enable our bus systems to improve the transportation
places to live, work and build a business. To that end, the   system’s performance and advance those goals11:
Region’s bus systems (along with all other components of
the region’s transportation network) should be designed       •   Optimize routes
to deliver (and should report progress toward) four           •   Make space for the bus
key mobility priorities: connecting the super-region,         •   Make boarding faster
improving the consumer experience, ensuring equitable         •   Make buses easy to use
access, and integrating innovation.10                         •   Show how buses are performing

The Capital Region has already begun to take on these
actions and has achieved some notable successes. This
momentum must continue until buses throughout
the region achieve the values we expect and perform
at a high level. While not every action or tool will be
applicable in all circumstances, all bus systems in the
region could benefit from adopting more of these tools
to optimize their service.

 8
1            Optimize routes to improve service
             and better match demand

In the Capital Region, as in many parts of the country, one can still find bus routes that are not well-matched
with riders’ needs. Some stop short of major employment centers. Others, designed to serve 9-to-5 commuters,
are ineffective for those who work less traditional schedules. Land use policies that encourage development in
far-flung suburbs have forced transit agencies to stretch some routes past the point of being cost-effective. Years
of one-off tweaks and adjustments have led to routes that serve stops off the main road, slowing travel for
everyone aboard.

While transit agencies regularly tweak bus routes, several regions (including both Baltimore and Richmond) have
taken a more comprehensive approach: a complete overhaul of their bus networks. This process starts with a
simple premise: ask the community what they value in bus service, and develop routes and schedules that serve
these goals. In some cases, existing routes may already effectively serve those needs, while in others, new or
modified routes must be created. There will always be trade-offs involved: buses that arrive frequently mean
people spend less time waiting, but they cost more to operate. Providing service to the neighborhood on the
outskirts of town increases access for those residents, but could mean less service in denser areas where more
people would ride. The following tools are some of the ways that routes can be optimized to help communities
serve more riders within existing resources.

                      IMAGINE IF…
       …no matter when you got to the bus stop, a bus would never be
         more than a few minutes away.

                                                                                                                      9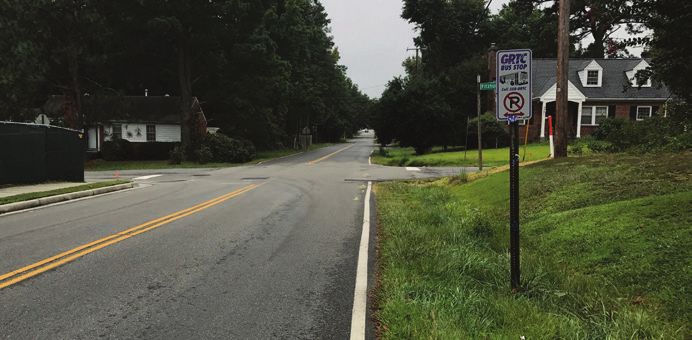
1. OPTIMIZE ROUTES TO IMPROVE SERVICE AND BETTER MATCH DEMAND

         TOOLS
     CONNECT MAJOR DESTINATIONS                                     REDESIGN INDIRECT ROUTES

Analyze where people need to go and when, and design bus
                                                                  Straighten out routes that divert or branch.
routes to serve those destinations at those times.

Major activity centers are no longer limited to the central       Over the years, many bus routes become less direct as the
core, but bus networks have not always kept up. Suburban          result of political or community pressure to add stops off
college campuses or employment centers might have the             the main corridor. The amount of time lost through these
potential to generate just as many public transportation          diversions can be significant and costly to the region. Some
trips as their downtown counterparts, but often receive           routes branch into different sub-routes, providing direct
less service in systems that were designed for suburb-to-         service to more stops but at lower frequency (and with
downtown commuting. Connecting these locations to the             greater confusion for riders). While not every route that
public transportation network increases access to jobs and        branches or diverts must be changed and the impact to riders,
educational opportunities for residents throughout the            particularly older riders and those with disabilities, should be
region; moreover, when the buses connect the places people        considered, straightening out or consolidating routes where
want to go at the times they need to access them, ridership       it makes sense can improve speed and reliability, and may
will increase.                                                    also allow for more frequent service on the resulting route.
                                                                  While the result may be routes that are farther from people’s
                                                                  homes or jobs, the overall trip may be shorter once the faster
                                                                  speed or higher frequency is factored in.

     MATCH FREQUENCIES WITH RIDERSHIP
                                                                    BREAK UP LONG ROUTES
     DEMAND

Create a network of high-frequency routes serving
                                                                  Improve performance by converting long routes into
corridors with the greatest potential for public
                                                                  shorter ones.
transportation use.
High-frequency routes have multiple advantages. They can          When a single route runs from one side of a region to
alleviate overcrowding on high-demand corridors. Since they       another, it almost invariably is delayed due to the many issues
come often, consumers don’t need to consult a schedule; they      it encounters along the way. Transit agencies have found that
know that if they show up at the stop, a bus will soon arrive.    when long routes are broken up into shorter ones, buses on
Waiting time, which can be one of the most frustrating parts      the resulting routes are able to follow their schedules more
of the public transportation trip, is reduced. Such routes can    closely. Since time spent waiting for a delayed bus is among
improve travel times for existing riders (since they will spend   the biggest deterrents for riders, keeping buses on schedule
less time waiting for the bus) and attract new riders as well.    helps to retain and attract riders.

10
1. OPTIMIZE ROUTES TO IMPROVE SERVICE AND BETTER MATCH DEMAND
OPTIMIZE THE DISTANCE BETWEEN BUS STOPS UTILIZE NON-TRADITIONAL BUSES AND ROUTES
Provide on-demand, deviated fixed-route, or other
Speed service by locating stops at an appropriate distance
nontraditional service in areas that would not generate
from each other.
enough riders to warrant regular fixed-route service.
Frequent stops require buses to pull in and out of traffic more In some parts of every region, development is too sparse to make
often, adding time to bus trips. In a survey of transit agencies, regular fixed-route service cost-effective. Yet people in these
consolidating stops was found to be the most effective areas also need access to jobs, healthcare, and other services.
strategy they had employed for increasing bus speeds.12 Stop Transit agencies can supplement their fixed-route service with
consolidation programs generally consider not just bus speeds, “microtransit,” which refers to a variety of mobility options that
but also topography, land use, and other characteristics such as utilize smaller vehicles on routes that are customizable to meet
concentration of elderly riders that may dictate stop placement. demand. Models already exist in transit agencies’ paratransit
Though opposition to eliminating stops can be expected in operations and other specialized transportation services. These
some areas (particularly if it impacts older riders or people services can help fill gaps, whether they are provided by the
with disabilities), the benefit of a faster, more reliable trip may transit agency directly or through a contract with a private
make the trade-off of a slightly longer journey to a bus stop mobility provider (in which case, customer service, labor, and
worthwhile for many riders. maintenance standards should be developed to ensure high
quality service). However, they can also be costly on a per-
passenger basis and should be undertaken only to meet priority
needs that cannot be addressed with more cost-effective fixed-
route service.
111. OPTIMIZE ROUTES TO IMPROVE SERVICE AND BETTER MATCH DEMAND
CAPITAL REGION SNAPSHOT
How well are buses connecting people with destinations
in the Capital Region?
Only a small percentage of jobs in the Capital Region are ACCESS TO JOBS VIA PUBLIC TRANSPORTATION
accessible to the average resident within 45 minutes by
AVERAGE NUMBER OF JOBS
all transit options (i.e., bus, light rail, streetcar, subway,
ACCESSIBLE BY TRANSIT
etc.). A majority of low-income households in the Capital METRO AREA WITHIN 45 MINUTES % OF TOTAL JOBS
Region live within a quarter-mile of a bus stop offering
weekday and weekend service, a higher percentage than Capital Region 112,401 2.4%
that of households of all incomes. However, access to Baltimore 68,000 5.6%
Richmond’s bus service is noticeably lower for both low-
income households and the entire population than access Washington 153,200 5.3%
in the Baltimore and Washington metro areas. For those
who work weekends, bus service remains much harder to Richmond 20,982 3.4%
access than during the week.
Note: MWCOG conducted an accessibility analysis for the Washington Metro Urbanized
Area, a smaller geographic footprint than this study, which found transit providing 397,000
jobs within 45 minutes on average.
Source: Citilabs Data and LEHD Origin-Destination Employment Statistics.
HOUSEHOLDS NEAR WEEKDAY HOUSEHOLDS NEAR WEEKEND
BUS SERVICE (AM PEAK) BUS SERVICE (SUNDAY AM)
% OF LOW-INCOME % OF LOW-INCOME
% OF HOUSEHOLDS WITHIN HOUSEHOLDS % OF HOUSEHOLDS WITHIN HOUSEHOLDS
METRO AREA METRO AREA
¼ MILE OF A BUS STOP WITHIN ¼ MILE OF ¼ MILE OF A BUS STOP WITHIN ¼ MILE OF
A BUS STOP A BUS STOP
Capital Region 59% 75% Capital Region 42% 61%
Baltimore 67% 85% Baltimore 52% 76%
Washington 82% 91% Washington 56% 72%
Richmond 28% 53% Richmond 16% 35%
Note: Low-income household figures are based on ACS 5-year threshold levels that compare Note: Low-income household figures are based on ACS 5-year threshold levels that compare
income and number of people or families. income and number of people or families.
Source: Citilabs Data and LEHD Origin-Destination Employment Statistics. Source: Citilabs Data and LEHD Origin-Destination Employment Statistics.
12NATIONAL SNAPSHOT
Like many U.S. cities, Columbus, Ohio has seen thousands of jobs move to the suburbs over the last 40 years,
yet its buses still traveled a hub-and-spoke pattern designed to bring workers downtown. Leaders at COTA, the
region’s transit agency, realized that a change was needed. After four years of study and public engagement,
COTA launched a completely redesigned bus network in May 2017. The new routes focused on areas of high
demand, and many high-frequency routes did not venture into downtown at all, instead serving suburban
shopping centers, a casino, the airport, and other job centers throughout the region. COTA also added
additional weekend service, which is important to bring workers to weekend jobs. Though meeting demand
in the region’s suburban areas is still a challenge, following the redesign, the number of people living within a
quarter mile of a frequent bus line increased by 89 percent, and the number of jobs within a quarter mile of a
frequent bus line increased by 71 percent.13 By creating more efficient routes, the agency was able to increase
frequencies without requiring an increase in its operating budget.
BEFORE AFTER
Credit: Jarrett Walker + Associates.
Columbus’ high-frequency bus routes before and after the redesign.
132 Make space for the bus on the
region’s roads
Buses use the same roads as many other vehicles: cars, trucks, bicycles, and motorcycles. In some places, there is
enough space on the roads to easily accommodate everyone. In others, road space is in high demand, leading to
traffic congestion and slower travel. For buses, these capacity constraints not only reduce speed, but also reduce
reliability and increase operating costs.
Improving bus service in these conditions requires local and state governments to make sure buses have the
space they need to move quickly on the region’s roads. There are a number of ways to give priority to buses
in order to move the greatest number of people as quickly as possible through an area with limited capacity.
By increasing the speed of bus travel, total trip times are reduced. Research has shown that when travel times
decline by 10 percent, bus ridership tends to increase 4-6 percent.14 The tools to help buses move faster on
shared roads are generally low-cost and flexible, in that they can be targeted to specific locations and removed if
conditions change. Jurisdictions that implement these changes must be committed to enforcing them if they are
to have the desired effect.
IMAGINE IF…
… the first words that came to mind when you thought
about your city’s buses were “convenient” and “reliable.”
142. MAKE SPACE FOR THE BUS ON THE REGION’S ROADS
TOOLS
DEDICATE LANES TO BUSES OPTIMIZE TRAFFIC SIGNALS
Use all day or peak period bus-only lanes to reduce travel
Give buses priority at traffic lights.
time for bus riders in congested areas.
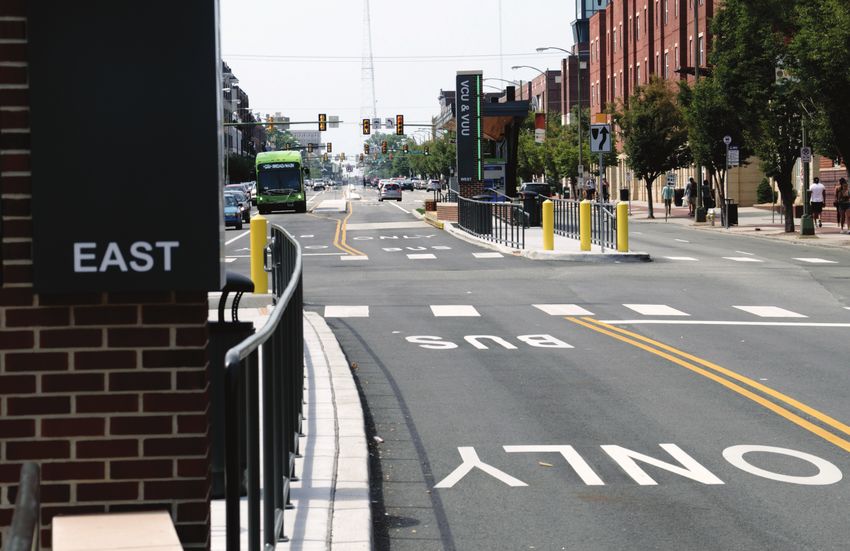
When buses have a dedicated lane, they can bypass areas With modern vehicle location technology, a bus can send
of significant traffic congestion, improving both speed and a signal as it approaches an intersection to tell the traffic
A DEDICATED LANE
ability to stay on schedule. Bus lanes can run the length light to stay green long enough for the bus to get through or
of a corridor or just a few blocks; their location should be provide a special signal to the bus to start its journey through
dictated by balancing the benefits for the bus with the needs the intersection before other vehicles, a feature known as
of the drivers in adjacent lanes. Often, bus lanes can be transit signal priority (“TSP”). By avoiding the wait at red
accommodated without reducing capacity for other drivers lights, buses can serve their routes more quickly, with little
by rededicating parking lanes to buses. To be effective, bus- impact to drivers.
only lanes must be enforced or cars and trucks (parked or
moving) will reduce the benefits for bus riders.15
INSTALL BUS BULBS AND BOARDING ISLANDS
Allow the bus to pick up and drop off riders without having
to pull out of travel lanes.
Where stops require buses to pull out of travel lanes, re-entering
those lanes can be one of the most time-consuming and potentially
unsafe parts of the trip. One solution is to build sidewalk
extensions (bulbs) or islands that allow waiting passengers to
reach buses without requiring the bus to leave the travel lane,
Bus boarding island, Seattle
thereby speeding up the bus trip.
Credit: Adam Coppola Photography
152. MAKE SPACE FOR THE BUS ON THE REGION’S ROADS
Credit: Dan Malouff/CC BY-NC 2.0
USE QUEUE-JUMPS ALLOW BUS-ON-SHOULDER
Allow buses to bypass traffic at intersections. Let buses use the shoulder lane when conditions warrant.
At busy intersections, buses are often caught in long lines of Shoulder lanes that are wide enough and strong enough to
traffic as cars wait to turn left or right. Providing buses with carry buses can give buses an alternative to creeping along
a separate lane at such intersections (known as a “queue- in heavy traffic. This can be particularly useful on major
jump”) sends them to the front of the line, making it easier highways or arterials, which tend to have larger shoulders
for them to stay on schedule. Queue jumps are often used in than urban streets.
conjunction with TSP.
162. MAKE SPACE FOR THE BUS ON THE REGION’S ROADS
CAPITAL REGION SNAPSHOT
How fast do buses travel in the Capital Region?
In the Washington and Richmond areas, bus speeds have fallen since 2010, while in Baltimore, speeds
have remained fairly flat. As buses take longer to finish their routes, more buses must be added to
maintain the same frequency of service, costing transit agencies and the public more.
2016 AVERAGE BUS SPEED (MPH)
GRTC 10.89
WMATA 10.15
MTA 11.33
20 largest U.S. bus systems 10.24
19 largest U.S. bus systems after NY MTA 10.98
Source: National Transit Database, vehicle revenue miles divided by vehicle revenue hours (excludes commuter buses).
Note: This data predates BaltimoreLink and Richmond’s redesign. New York MTA’s bus system provides more trips than the next three systems (Los Angeles, Chicago, and
Philadelphia) combined, and its average bus speed is the slowest of the large agencies at 7.08 mph. However, certain MTA routes have been prioritized for faster service:
the Select Bus Service (SBS) routes, which feature limited stops, bus-only lanes, and off-board fare collection, have seen travel time improvements up to 23% and ridership
increases between 10%-31%. Source: Transit Center
PERCENT CHANGE IN AVERAGE BUS SPEED, 2010-2016
0
-5
-10
-15
MTA WMATA GRTC
Note: This data predates BaltimoreLink and Richmond’s redesign. Source: National Transit Database, vehicle revenue miles divided by vehicle revenue hours (excludes commuter buses).
17 172. MAKE SPACE FOR THE BUS ON THE REGION’S ROADS
CAPITAL REGION SNAPSHOTS
How often do Capital Region buses show up on time?
Most transit agencies in the United States (including GRTC) consider a bus on time if arrives between
1 minute early and 5 minutes late, but both WMATA and MTA use a wider window: arrivals between 2
minutes early and 7 minutes late are considered “on time.”16
ON-TIME
PERFORMANCE GOAL CURRENT PERFORMANCE
MTA 80% on time 66.4% on time (high frequency routes are 76% on
time; local routes are 66% on time)
WMATA 79% on time 79% on time (July 2017-March 2018)
GRTC 80% on time Not yet available for newly redesigned system
(average over past 3 years was 75% on time)
Source: Maryland Department of Transportation, WMATA, GRTC email messages to author.
How often are buses given priority treatment on Capital Region roads?
All the Capital Region’s metro areas have some roadways on which buses get priority treatment (e.g.
dedicated lanes or TSP). However, these locations represent a small fraction of the total road network.
METRO AREA DEDICATED BUS LANES INTERSECTIONS WITH TSP
Baltimore 5.9 miles, all on one-way streets in 26 (along CityLink Red and Green lines)
downtown (North Avenue Rising (North Avenue Rising project would
project would add 7 additional lane add 28 more)
miles, 3.5 miles in each direction)
Washington 3.2 miles (1.6 miles in each direction) 227 (195 in D.C. and 32 in northern
Virginia)
Richmond 3.4 miles (for the Pulse BRT) 55 are planned for the Pulse BRT
Source: MTA, WMATA, GRTC email messages to author.
1818King County Metro buses serve the Seattle region
Credit: Oran Viriyincy
NATIONAL SNAPSHOT
The city of Seattle and King County Metro have together created an environment in which buses can thrive. Part of
the city’s success stems from its conscious decision to prioritize buses on congested city streets. Bus-only lanes—and
in some places, bus-only roads—allow many more people to travel through high-demand, congested areas than could
be accommodated in cars. In other areas, queue jumps allow buses to move to the head of the line at intersections,
and bus bulbs and boarding islands allow buses to reach riders without having to pull out of traffic. The ORCA
farecard allows consumers to board quickly, not just on King County buses, but on other local buses and trains as
well. The region’s land use laws have focused employment growth into concentrated areas, making them more cost-
effective to serve with public transportation. Seattle voters approved a package of new taxes to help support public
transportation, allowing the transit agency to increase service and frequencies on a number of routes. As a result of
those changes, the percent of households in the city within a 10-minute walk of a bus route that comes at least every
10 minutes grew from 25 percent in 2015 to 64 percent in 2017.17 It is not surprising, given the commitment to buses
shown by both high-level officials and the general public, that Seattle—in a minority of U.S. regions—is seeing bus
ridership grow.
19 193 Make boarding faster
Those who regularly ride the bus would not be surprised to learn that from one-fifth to one-third of buses’ travel
time is spent waiting for people to board and pay.18 On most bus routes, people must line up at the front door, walk
up several steps, and then either show a pass to the driver, tap a card on a reader, or feed dollars and change into
a farebox. A person paying with cash will take about three times as long to pay as someone paying with a mobile
phone19, so the more cash consumers a bus has, the more time will be spent on boarding. Transit agencies are
beginning to address this issue with both physical and technological changes to the boarding process.
TOOLS
USE OFF-BOARD OR TAP-AND-GO
ALLOW ALL-DOOR BOARDING
FARE PAYMENT
Encourage riders to use options other than paying cash at Use all available doors to allow more passengers to board
the farebox. at the same time.
Using cash on board the bus is the slowest and most costly way to Most buses have doors at the front and in the middle, but the
pay a fare. Other options include having people pay fares before
20
middle doors are used only by exiting passengers because the
they get on the bus, for example at ticketing machines at major only farebox is located at the front. If off-board or tap-and-go
stops or local stores, or issuing fare media such as smartcards payments are allowed, a reader can be installed at the middle
or mobile payment that require the consumer to simply tap a doors, allowing more passengers to board the bus in a shorter
reader. To be effective in reducing boarding times, these options time, increasing bus speeds by up to ten percent.21
must be easy to use, easy to acquire, and available to all, even
those who do not have a credit card or smartphone. Transit
agencies allowing off-board fare payment generally enforce
compliance with random fare inspections.
203. MAKE BOARDING FASTER
CAPITAL REGION SNAPSHOTS
Do bus systems in the Capital Region allow riders to pay for trips by phone?
Currently, about 80 percent of riders on MTA buses, 12 percent of riders on WMATA buses, and 25 percent of riders
on GRTC buses use cash payment. Public transportation providers in the Capital Region have been slow to adopt
mobile payment technology compared to peer agencies, and are now working to catch up. MTA, WMATA, and GRTC
have separate plans in place to adopt mobile payments within the next 12 months.
REGIONAL TRANSIT
AGENCY STATUS OF MOBILE PAYMENTS
MTA Expected to launch in 2018
WMATA “Mobile ready” by 2019, mobile payment providers will set their own schedules for
launching the service
GRTC Already available for unlimited ride passes. Additional passes will be added by the
end of 2018. (Also working to add RVABikeShare to its fare payment cards.)
Sources: Greater Washington Partnership report.
Do bus systems in the Capital Region allow all-door boarding?
All-door boarding is limited in the Capital Region. MTA and WMATA do not offer all-door boarding or off-board fare
payment on any of their buses. GRTC’s new Pulse BRT line offers both all-door boarding and off-board fare payment
options. However, these features are not provided on any of its other routes.
INTERNATIONAL SNAPSHOT
Since 2014, buses in London no longer accept cash, saving the transit agency nearly £26 million annually. The Oyster
smart card had been available since 2003 and had penetrated so deeply among riders that by 2012 only 1 percent
were still using cash. In 2012, London’s buses were equipped to accept credit and debit cards as well as the Oyster
card. Riders can buy and re-load Oyster cards online or at 4,000 vendors around the city.22
21 214 Make buses easy to use
The harder it is for consumers to get information about a particular transportation option, the less likely it is
that they will choose that option. Buses are susceptible to a host of challenges in this area, including, among
other things, hard-to-read maps and confusing fare policies. Buses also face physical issues that can make them
difficult to use, such as bus stops that are hard to get to due to lack of sidewalks or crosswalks. Addressing these
issues, particularly when coupled with service improvements to increase speed and reliability, can improve the
experience of existing riders and attract new ones.
TOOLS
PROVIDE REAL-TIME INFORMATION SIMPLIFY SCHEDULES
Use clockface schedules to make it easier for people to
Let people know when their bus will actually arrive.
remember when the bus is coming.
Real-time bus location technology lets transit agencies know Buses that come at irregular intervals make it nearly
where their buses are at all times. Coupled with other traffic impossible for anyone but a daily rider to remember their
information, this technology can be used to project when a schedule. Having to look up complicated timetables to figure
bus will reach a particular stop. Sharing this information with out when to get to the bus stop is an inconvenience that can
riders can significantly reduce the frustration associated drive consumers to other options. Creating high-frequency
with waiting for the bus. A 2011 study found just having this routes can help address this, as consumers know that
information reduces the perceived wait times for the bus— whenever they arrive at the stop, the bus will come within a
the amount of time people think they are waiting—by as much few minutes. For lower frequency routes, transit agencies can
as two minutes (30 percent). 23
establish “clockface schedules,” i.e. buses that arrive every
20, 30, or 60 minutes. In that way, consumers know that a bus
will come, say, at :27 minutes and :57 minutes past each hour,
making it easier for them to access the bus system without
having to check a timetable for each trip.
224. MAKE BUSES EASY TO USE
IMPROVE WAYFINDING ESTABLISH BUS-FRIENDLY FARE POLICIES
Use intuitive route names, clear maps, and informative Adopt fares and transfer policies that incentivize
signage. consumers to use buses regularly.
Many transit agencies rework wayfinding approaches to Bus fares are typically among the most affordable when
be more useful and clearer when routes and schedules are it comes to paying for transportation. Still, it is worth
being changed. Do bus stop signs clearly indicate where considering whether fare policies overall encourage people
buses serving that stop are headed? Do route names make to use buses on a regular basis. Consider whether the cost of
it easy to tell where the bus is going? Do bus shelters have weekly or monthly passes provides savings to bus riders, and
real-time arrival information and clear maps of the route? whether bus riders can get free or low-cost transfers to other
These are some of the elements that can improve consumers’ bus or rail services.
perception of buses as a convenient mobility option.
CONNECT BUSES WITH AN INTEGRATED
MOBILITY PLATFORM
Integrate payments, trip-planning, and location of mobility
options.
MTA improved bus stop signs as
part of BaltimoreLink to provide Versatile as they are, buses cannot be door-to-door for every
more useful information for riders trip. Consumers typically use multiple options—including
walking, bicycling, or transfers between buses—to make
their trips. Making these connections as easy as possible
reduces barriers to taking the bus. An integrated mobility
Credit: MTA.
platform that provides one-stop trip planning covering all
available options, coupled with the ability to pay for a trip
with the same fare media regardless of service provider,
would allow buses to compete on more even footing with
private app-based mobility options. Transit agencies in peer
regions around the world that have deployed integrated
ticketing systems have seen ridership increases from five to
20 percent.24
234. MAKE BUSES EASY TO USE
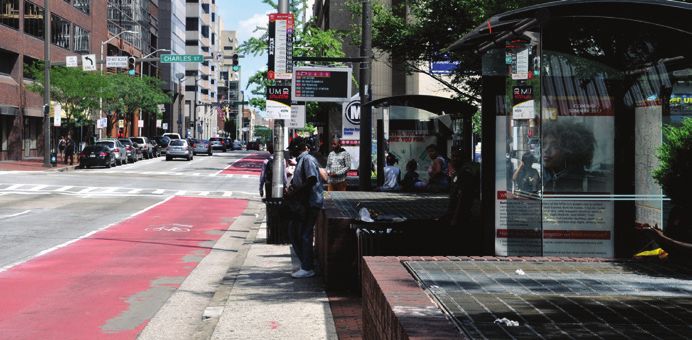
IMPROVE PHYSICAL ACCESS TO BUS STOPS PROVIDE A SAFE AND COMFORTABLE TRIP
Use physical and service improvements to ensure riders
Make sure riders can safely and conveniently reach the bus.
and drivers feel safe using the bus
Frequent buses and real-time information will mean little if Overall, buses are one of the safest ways to travel. The risk of
consumers find it too difficult to reach the place where the bus serious crime on transit is small; in 2010, there were fewer than
stops. In some areas bus stops might be located in the strip of 5,000 serious crimes25 on transit across the country, in a year
grass between a service road and the main arterial, or at the when more than 10 billion transit trips were taken.26 However,
edge of a parking lot, or in a host of other inhospitable spots. Safe arguments, harassment, property theft, and other incidents can
pathways may not be available for consumers to make their way disrupt and delay the bus and undermine safety—particularly
from the stop to their destination. A physical assessment of bus when the incident involves an assault on the driver—and
stops should be part of any effort to improve bus service, with contribute to the perception that public transportation is unsafe.
the recognition that many of the attributes that make a bus stop Physical improvements, such as protective shields between
safe, such as sidewalks and crosswalks, are under the jurisdiction the driver and riders, internal and external cameras, systems
of local governments rather than the transit agency. permitting drivers to alert law enforcement, and lighting at bus
stops, can increase safety, and can be added to existing vehicles
or stops, or incorporated into designs for new buses. Service
changes can also help, like increasing frequency to reduce
over-crowding or allowing drivers to drop off riders at any
safe location along their routes after dark, rather than only at
designated stops.
BALTIMORE WASHINGTON RICHMOND
photos for accessible/
inaccessible bus stops for
the 3 cities - pls provide
Customer amenities and accessibility vary among Capital Region bus stops.
Credits (clockwise from top left): Paul Sableman/CC BY-NC 2.0; Flickr/nevermindtheend; Ross Catrow; Dan Malouff/CC BY-NC 2.0; Dan Malouff/CC BY-NC 2.0; Dan Malouff/CC BY-NC 2.0.
244. MAKE BUSES EASY TO USE
CAPITAL REGION SNAPSHOTS
Do Capital Region bus systems make real-time arrival information available?
All of the principal public transportation providers in the Capital Region make real-time bus arrival information
available online, through text, and through mobile apps. WMATA was the first to offer real-time bus tracking in 2009,
followed by GRTC in 2013 and MTA in 2015. Riders can also sign up for automatic status updates via email or text.
WMATA has placed real-time arrival signs at more than 170 bus stops.
Which bus systems in the Capital Region offer free transfers to other
bus or rail systems?
The transfer policies of Capital Region transit agencies vary considerably, although they are all
designed to encourage riders to use faster payment methods than cash, such as passes and smartcards.
REGIONAL TRANSIT
AGENCY TRANSFER POLICIES
MTA No free or discounted transfers
WMATA Regular bus-to-bus transfers are free with a SmartTrip card; regular bus-to-
Express bus transfers with a SmartTrip card pay the full fare minus $2 (the fare
for regular bus); bus-to-rail and rail-to-bus transfers with a SmartTrip card pay full
fare minus $.50. (The majority of large rail systems in the United States provide a
free rail-to-bus transfer)
GRTC One Ride Plus Pass allows one transfer and costs $1.75 ($0.25 more than a single-
ride bus pass)
Sources: MTA, WMATA, and GRTC.
NATIONAL SNAPSHOT
In Pittsburgh, the public transportation system’s ConnectCard is linked with the HealthyRide bikeshare system to offer
consumers unlimited 15-minute bike rides. This partnership grew bikeshare usage in Pittsburgh by 10 percent.27
255 Measure and report on bus
performance
Publicly reporting performance data serves two goals. When performance is strong, data can help to counter
misperceptions about the bus system. When performance is lacking, data can help to identify particular issues
or bottlenecks, the first step in correcting them. Performance reporting should focus on how well the region’s
bus systems are contributing to the four mobility priorities: connecting the super-region (e.g., percent of jobs
accessible by transit within 45 minutes), improving the customer experience (e.g., how often buses and trains
arrive on-time), ensuring equitable access (e.g., percent of jobs and services accessible to low-income residents by
transit within 45 minutes), and integrating innovation (e.g., percent of riders paying with mobile phones).
TOOLS
PUBLISH REGULAR PERFORMANCE REPORTS INSTITUTE AN OPEN-DATA POLICY
Help consumers understand how buses are performing on Allow third parties to access real-time and historic
the issues they care about operations data to help meet consumer needs
Performance reporting should be clear and reflect the Making public transportation data open and accessible
consumer experience. In other words, rather than reporting enables third-party developers to create tools that help
on overall system averages, agencies should report on consumers make informed decisions about their mobility
individual routes, so consumers can find information on options. Allowing such tools to proliferate makes it more
the routes they actually use. Metrics such as on-time likely that consumers will find an app or a web-based tool
performance and person throughput (how many people buses that suits their particular needs, and avoids the transit
are moving on particular corridors) can be helpful for both agency having to dedicate staff to develop and update apps.
consumers and traffic engineers. A new metric being piloted The more real-time information consumers can get about
in some cities focuses on the minutes of delay experienced by actual service conditions, the easier it becomes for them
riders—a useful indicator for consumers of the reliability of to use all mobility options, and to choose the one that best
their bus or train. 28
meets their needs for that particular trip.
265. MEASURE AND REPORT ON BUS PERFORMANCE
CAPITAL REGION SNAPSHOT
Which Capital Region public transportation providers report on reliability
by route?
None of the regional public transportation providers in the Capital Region regularly report on-time
performance by bus route.
REGIONAL TRANSIT
AGENCY ON TIME PERFORMANCE REPORTING
MTA Reported monthly for CityLink routes as a group and for ExpressLink and
LocalLink buses as a group
WMATA Reported quarterly for all Metrobuses as a group
GRTC Not regularly reported
Sources: MTA, WMATA, and GRTC.
NATIONAL SNAPSHOT INTERNATIONAL SNAPSHOT
Transport for London (TfL), which runs all of
London’s public transportation as well as traffic
signals and major roads, adopted an open data
policy nearly ten years ago. Today, over 11,000 data
developers have registered to access the free data
feeds. TfL’s data is used in over 600 apps that help
guide more than 42 percent of Londoners in making
informed mobility decisions.29 A recent analysis of
TfL’s open data policy estimated that it saves the
region up to £130 million a year in reduced travel
time, increased public transportation ridership, job
creation, and other benefits.30
The Massachusetts Bay Transportation Authority’s performance dashboard
reports bus on-time performance by route, among other data.
Source: MBTA.
27 27WHAT ABOUT
FUNDING?
These tools are not a replacement for adequate benefits received from the dedicated space.) Installing
funding, but when strategically implemented, they can TSP equipment along four corridors and 760 buses
take pressure off transit agencies’ operating budgets. cost MTA about $8 million.31 Producing new bus stop
When buses are able to complete their routes faster, signs and posters for Richmond’s redesigned system
they can start their next route sooner, allowing the cost $983,000. The entire redesign process, including
same number of vehicles and drivers to provide more all related capital and operating expenses, totaled $5
service. Bus service that is faster and more reliable million.32
will attract more riders, which will lead to more fare
revenue and require less from other funding sources. Still, the benefits achieved through use of these tools
can be further enhanced by local and state leaders
Many of these tools require some capital investment, providing more funding for buses and drivers to handle
but most are relatively modest and should not require demand that cannot be accommodated within existing
a protracted discussion such as that surrounding major budget constraints. The specifics may differ—one area
rail or roadway investments. For example, MTA spent may need more frequent routes to serve high-demand
about $636,000 per mile installing dedicated bus lanes areas, while another may need extended hours to
as part of BaltimoreLink, including planning, design, better serve late-night riders—but in virtually all cases,
and construction costs. (This does not include costs to buses could become a competitive option for even
enforce the restricted lane, which has been recognized more people if operating funding were increased.
as a challenge for MTA and the city and limits the
“Bus service that is faster and more reliable will attract
more riders, which will lead to more fare revenue and
require less funding from other sources.”
28NEXT MOVES TO RETHINK
THE CAPITAL REGION’S BUSES
The Capital Region needs to rethink its bus systems. region needs for a competitive economic future. The
Although advances have been made in all three metro Greater Washington Partnership, Greater Baltimore
areas, overall, the region has not fully maximized the Committee, Central Maryland Transportation Alliance,
potential of its investments and offered service that Greater Washington Board of Trade, Coalition for
is desirable for many consumers. Travel preferences Smarter Growth, DC Sustainable Transportation,
are changing. The proliferation of on-call services has ChamberRVA, and RVA Rapid Transit are committed to
reduced tolerance for long waits or waits without working with the region’s leaders to get this done.
information, and parking apps have made it easier than
ever to find and pay for a parking space. Fortunately, It would be a mistake to believe that the responsibility
with a renewed commitment to improving service, for fixing these problems rests solely with the transit
buses can be competitive when it comes to modern agencies. In those regions that have truly transformed
mobility. their bus service, it took leadership from elected
officials—in city government or on the transit board—
Baltimore, Washington, and Richmond have already to make it happen. While incremental improvements
begun to implement some of the tools to improve in bus service may be possible without such leadership,
service, yet there is still much work to be done. Now is our goal must be bolder, and to achieve it, our leaders
the moment to leverage those past actions and launch must be bolder as well.
further improvements to create the bus system the
29Next Moves for
BALTIMORE
On June 18, 2017, the Maryland Transit high-frequency bus service went up from 13 percent
Administration launched BaltimoreLink, a to about 20 percent, access to some parts of the
comprehensive redesign of bus routes in the Baltimore region was reduced, leaving many suburban job sites
area. The redesign included a new high-frequency inaccessible to city residents.33
network with color-coded routes traversing the
city, additional service to several emerging job With light rail, subway, and commuter rail in addition
centers, a modest amount of dedicated bus lanes, to buses, the Baltimore area urgently needs a
and implementation of TSP at several key downtown deliberate, collaborative effort to provide a forward-
intersections. looking public transportation plan to improve all
modes. The recently enacted Maryland Metro/Transit
A year later, the results of BaltimoreLink are mixed. Funding Act presents the opportunity to do just that.
Reliability of some bus routes has improved, but But improvements to Baltimore’s bus system need
overall on-time performance is still below MTA’s not wait. BaltimoreLink is already in effect, and can
goal of 80 percent. A recent report by the Central serve as the foundation for additional, near-term
Maryland Transportation Alliance found that while the improvements to better address consumers’ mobility
number of Baltimore residents with access to full-day needs.
IMAGINE IF…
…you could take a job across town knowing that the bus would
get you there on time every day.
30NEXT MOVES TO RETHINK
BALTIMORE’S BUSES
program (now known as BUILD), and the detailed
1. he city of Baltimore and state of Maryland should
T
develop and implement a plan to make space
for buses on the roads each entity owns in the
design is underway. While current plans would
provide some improvement, gaps remain in the
planned bus lanes that would limit the project’s
Baltimore metro area. BaltimoreLink called for benefits. City and state officials should maximize
dedicated lanes and TSP to improve travel times the potential benefits of this project by developing
through the congested downtown core. Those a strategic plan to deliver dedicated bus lanes and
treatments appear to be working in the locations safe biking and walking pathways along the entire
in which they have been implemented and corridor.
enforced,34 but targeted expansion is needed to Lead actor: Baltimore City Department of
fully realize the potential of BaltimoreLink’s high- Transportation and MTA
frequency routes. City and county transportation
Key tools: Dedicate lanes to buses, optimize
departments are largely responsible for
traffic signals, improve physical access to bus
implementing changes to roads and traffic signals
stops
and further deployment of these cost-effective
improvements will speed up and improve bus Outcome: Faster, more reliable bus travel
service. A Memorandum of Understanding
3.
should also be executed with relevant police he Maryland Transit Administration (MTA)
T
departments to make enforcement expectations should engage with city and county leaders, the
and responsibilities clear. business community, and the public to develop
Lead actors: Baltimore City and county the next phase of bus service improvements
Departments of Transportation and MTA (essentially, a BaltimoreLink phase 2), including
additional high-frequency routes and extended
Key tools: Dedicate lanes to buses, optimize
service to key destinations such as suburban job
traffic signals
centers.
Outcome: Faster, more reliable bus travel
Lead actors: MTA, Mayor of Baltimore,
County Executives of adjacent counties
2. he North Avenue Rising project promises to
T
significantly improve the speed and reliability
of bus travel along a historically and culturally
Key tools: Connect major destinations, match
frequencies with ridership demand
important corridor within the city of Baltimore. Outcome: Increased access to jobs and
The project received funding from the federal economic opportunity
government through the former TIGER grant
314. he region should seize the opportunity presented
T
by creation of the Central Maryland Regional Transit
Plan Commission by the Maryland Metro/Transit
for example, is the focus of a new pilot by MTA to
improve access for workers to jobs using shuttles or
other microtransit options to complement the fixed-
Funding Act to ensure the Commission is properly route buses that serve the area. More efforts like
resourced to address the Baltimore region’s public these are needed to help workers reach jobs in other
transportation needs. As MTA is a statewide agency, suburban job centers, and should be a focus of MTA’s
with the potential for a change in direction every new Job Access and Reverse Commute Program
four-year election cycle, the Commission should (HB1468, enacted in 2018).
focus its attention on establishing a plan that Lead actors: MTA, local public transportation
enhances the reliability and state of good repair providers, employers
for the existing system and prioritizes capital
Key tool: utilize nontraditional buses and routes
investments to expand and connect the system
to improve economic development and access Outcome: increased access to jobs and
to essential destinations for all consumers in the economic opportunity
region. The Commission should remain in existence
6.
permanently to maintain continuity across political altimoreLink was a major transformation of the
B
cycles. Baltimore area’s bus routes, yet it has been difficult
Lead actor: Appointing entities (Anne Arundel for the public to assess how well the redesign has
County, City of Baltimore, Baltimore County, achieved its goals. MTA does not regularly report
Harford County, Howard County, President on important metrics such as on-time performance,
of the Senate, Speaker of the House, and the cut runs, or end-to-end running time. MTA should
Governor , MTA, Baltimore Metropolitan provide monthly reports clearly describing the
Council) metrics used (e.g., the definition of “on time”), and
Outcome: Strategic plan for high-performing performance of the system and each route at various
times of day. MTA should also make its real-time bus
transit system
data available in an easily accessible portal.
5.
Lead actor: MTA
I n addition to providing more fixed-route service
where it is warranted, MTA, county public Key tool: publish regular performance reports
transportation systems, and the region’s employers Outcome: higher-performing buses due to
should develop pilot programs that can leverage improved trouble-shooting
non-traditional bus options to better connect city
residents with suburban job centers. While denser
corridors require regular fixed-route service, some
areas may be more efficiently served by more
flexible on-demand or deviated route service using
smaller vehicles. The BWI/Arundel Mills area,
32You can also read