2021 Regional Plan Social Equity Working Group - SANDAG
←
→
Page content transcription
If your browser does not render page correctly, please read the page content below
2021 Regional Plan
Social Equity Working Group
Thursday, April 1, 2021
10:30 a.m. to 12 p.m.
**Teleconference Meeting**
MEETING ANNOUNCEMENT AMIDST COVID-19 PANDEMIC:
The 2021 Regional Plan Social Equity Working Group (Working Group) meeting
scheduled for Thursday, April 1, 2021, will be conducted virtually in accordance with
Governor Newsom’s State of Emergency declaration regarding the COVID-19
outbreak, Executive Order N-29-20, and the Guidance for Gatherings issued by the
California Department of Public Health. Working Group members will primarily
participate in the meeting virtually, while practicing social distancing, from
individual remote locations.
There are a few options for public participation:
- Participate via Zoom webinar by clicking the link to join: zoom.us/j/93624473007
- The Webinar ID is: 936 2447 3007
- To participate via Telephone, dial a number based on your current location:
(US: +1 669 900 6833 or +1 346 248 7799 or +1 253 215 8782 or +1 929 205 6099 or
+1 301 715 8592 or +1 312 626 6799)
International numbers available: zoom.us/u/adbNfuDsGr
SANDAG is relying on commercial technology to broadcast the meeting via Zoom.
With the recent increase of virtual meetings, platforms such as Microsoft Teams,
WebEx, GoToMeeting, and Zoom are working to scale their systems to meet the
new demand. If we experience technical difficulty or you are unexpectedly
disconnected from the broadcast, please close and reopen your browser and click
the link to rejoin the meeting. SANDAG staff will take all possible measures to
ensure a publicly accessible experience.
Public Comments: Persons who wish to address the members on an item to be
considered at this meeting or on non-agendized issues may email comments to the
Clerk at clerk@sandag.org (please reference: “April 1 Social Equity Working Group
Meeting” in your subject line and identify the item number[s] to which your
comments pertain). Comments received by 4 p.m. on Wednesday, March 31, will be
provided to members prior to the meeting.
If you desire to provide a live verbal comment during the meeting, please join the
Zoom meeting either by computer or phone. At the time for public comments,
members of the public will be advised to “Raise Hand” if they wish to provide
comments. The “Raise Hand” feature can be found on the Zoom toolbar for those
who are joining via computer or by entering *9 for those who joining via telephone
only. The Chair will call on members of the public by name for those joining via a
computer and by the last three digits of your telephone number for those joining
via telephone. All comments received prior to the close of the meeting will be made
part of the meeting record.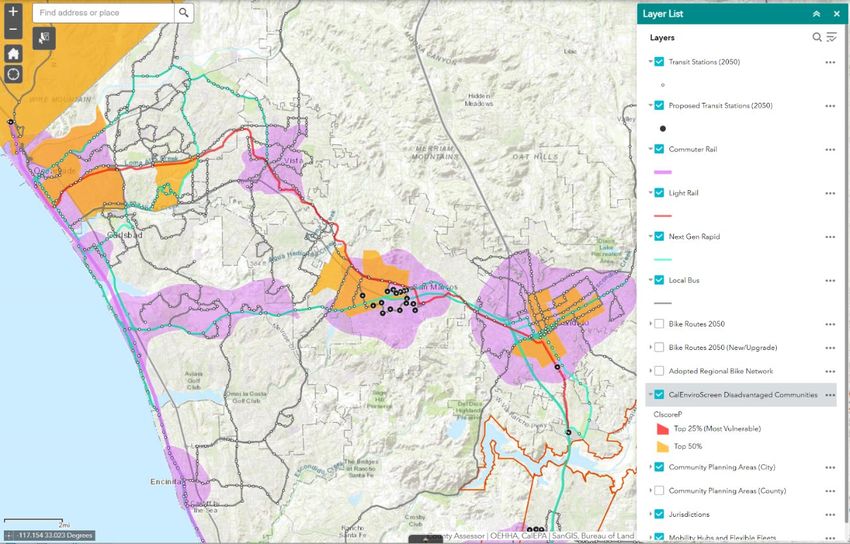
Welcome to SANDAG. Members of the public may speak to the 2021 Regional Plan Social Equity Working Group
on any item at the time the Working Group is considering the item. Public speakers are limited to three minutes or
less per person. The Working Group may only take action on any item appearing on the agenda.
In order to keep the public informed in an efficient manner and facilitate public participation, SANDAG also
provides access to all agenda and meeting materials online at sandag.org/meetings. Additionally, interested
persons can sign up for email notifications at sandag.org/subscribe.
SANDAG operates its programs without regard to race, color, and national origin in compliance with Title VI of
the Civil Rights Act. SANDAG has developed procedures for investigating and tracking Title VI complaints, and
the procedures for filing a complaint are available to the public upon request. Questions concerning SANDAG
nondiscrimination obligations or complaint procedures should be directed to the SANDAG General Counsel,
John Kirk, at (619) 699-1997 or john.kirk@sandag.org. Any person who believes himself or herself or any specific
class of persons to be subjected to discrimination prohibited by Title VI also may file a written complaint with
the Federal Transit Administration.
In compliance with the Americans with Disabilities Act (ADA), SANDAG will accommodate persons who require
assistance in order to participate in SANDAG meetings. If such assistance is required, please contact the SANDAG
ADA Coordinator, the Director of Diversity and Equity, at (619) 699-1900, at least 72 hours in advance of the
meeting. To request this document or related reports in an alternative format, please call (619) 699-1900 or
(619) 699-1904 (TTY), or fax (619) 699-1905.
SANDAG agenda materials can be made available in alternative languages. To make a request, call
(619) 699-1900 at least 72 hours in advance of the meeting.
Los materiales de la agenda de SANDAG están disponibles en otros idiomas. Para hacer una solicitud, llame al
(619) 699-1900 al menos 72 horas antes de la reunión.

如有需要, 我们可以把SANDAG议程材料翻译成其他語言.

请在会议前至少 72 小时打电话 (619) 699-1900 提出请求.

                                              Mission Statement
 The 18 cities and county government are SANDAG serving as the forum for regional decision-making. SANDAG
   builds consensus; makes strategic plans; obtains and allocates resources; plans, engineers, and builds public
      transit; and provides information on a broad range of topics pertinent to the region’s quality of life.
                                          Our Commitment to Equity
   We hold ourselves accountable to the communities we serve. We acknowledge we have much to learn and
    much to change; and we firmly uphold equity and inclusion for every person in the San Diego region. This
includes historically underserved, systemically marginalized groups impacted by actions and inactions at all levels
                                         of our government and society.
     We have an obligation to eliminate disparities and ensure that safe, healthy, accessible, and inclusive
 opportunities are available to everyone. In 2021, SANDAG will develop an equity action plan that will inform
  how we plan, prioritize, fund, and build projects and programs; frame how we work with our communities;
define how we recruit and develop our employees; guide our efforts to conduct unbiased research and interpret
                data; and set expectations for companies and stakeholders that work with us.
 We are committed to creating a San Diego region where every person who visits, works, and lives can thrive.

           San Diego Association of Governments ⋅ 401 B Street, Suite 800, San Diego, CA 92101-4231
                               (619) 699-1900 ⋅ Fax (619) 699-1905 ⋅ sandag.org

                                                                                                            June 2020
2021 Regional Plan Social Equity Working Group
                                           Thursday, April 1, 2021

Item No.                                                                                     Action
   1.      Welcome and Introductions

  +2.      Approval of Meeting Minutes                                                      Approve
           The 2021 Regional Plan Social Equity Working Group (Working Group) is
           asked to review and approve the minutes from its March 4, 2021, meeting.

   3.      Public Comments/Communications/Member Comments
           Members of the public shall have the opportunity to address the Working
           Group on any issue within the jurisdiction of Working Group that is not on
           this agenda.

                                        Chair’s Report

   4.      Chair’s Report                                                                  Information
           Councilmember Vivian Moreno, Working Group Chair
           An update on key programs, projects, and agency initiatives will be provided.

                                            Consent

  +5.      Social Equity Working Group Fares Recommendation                                Information
           Brian Lane, SANDAG
           At its March 4, 2021 meeting, the Working Group directed staff to write in
           support for the new PRONTO Fare System and for a reduction in Youth
           one-way fares from $2.50 to $1.25. A signed copy of the letter that was
           sent to the SANDAG Transportation Committee and Board of Directors is
           included.

                                            Reports

  +6.      Community Mobility Needs Assessment Survey                                      Information
           Krystal Ayala, SANDAG
           In partnership with SANDAG and our Community Outreach Network, a
           transportation needs assessment survey was conducted to provide input on
           current and future transportation options in underserved communities. Staff
           will present an overview of the community mobility needs assessment survey
           results.

                                                          3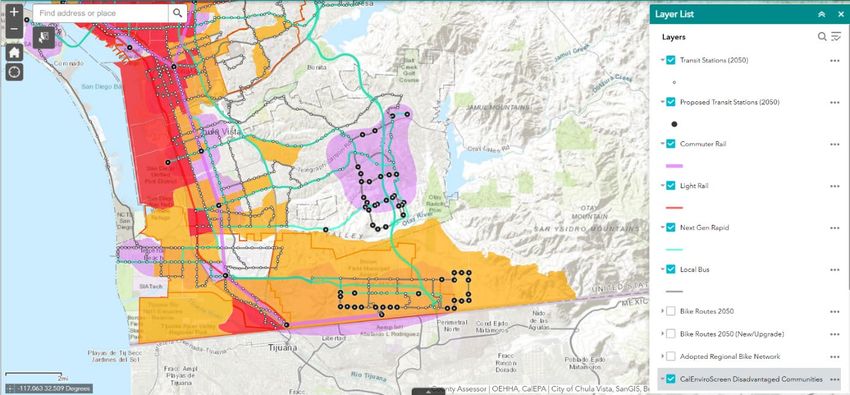
+7.      2021 Regional Plan – California Assembly Bill 805                                       Discussion
             Pollution-Reduction Strategy
             Anna Van, SANDAG
             California Assembly Bill 805 (Gonzalez Fletcher, 2017) (Chapter 658,
             Statutes of 2017) requires, among other things, that San Diego Forward: The
             2021 Regional Plan (2021 Regional Plan) include strategies that provide for
             mode shift to public transportation, identify disadvantaged communities,
             and include transportation strategies to reduce pollution exposure in these
             communities. Staff will present an update of the initial draft analysis of the
             projects, programs, and policies in the 2021 Regional Plan that would reduce
             pollution emissions for disadvantaged communities.

     8.      Possible Topics for Next Meeting                                                 Discussion/Possible Action
             Working Group Members
             The Working Group is asked to discuss possible topics for the next meeting.

     9.      Upcoming Meetings                                                                      Information
             The next Working Group meeting is scheduled for Thursday, May 6, 2021, at
             10:30 a.m.

    10.      Adjournment

+ next to an item indicates an attachment

                                                            4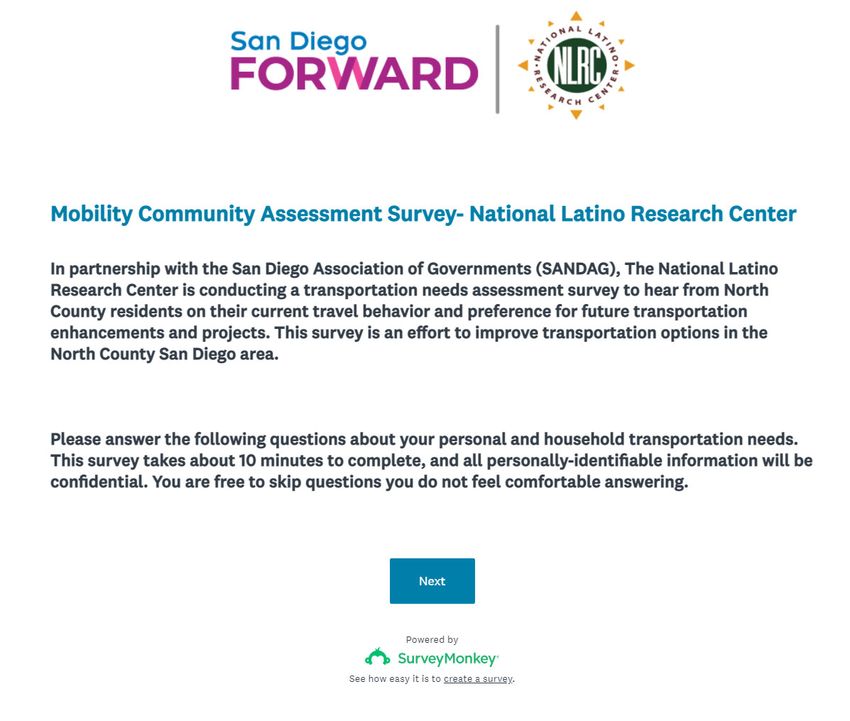
2021 Regional Plan Social Equity Working Group

                                                                                                       Item:    2
April 1, 2021                                                                                 Action: Approve

March 4, 2021, Meeting Minutes
Councilmember Vivian Moreno (SANDAG Board Alternate) called the meeting of the 2021 Regional Plan
Social Equity Working Group (Working Group) to order at 10:34 a.m.

1. Welcome and Introductions

2. Approval of Meeting Minutes (Approve)
Action: Upon a motion by Brian “Barry” Pollard (Urban Collaborative Project) and a second by Craig Jones
(Alliance for Regional Solutions), the Working Group approved the minutes from its February 4, 2021, meeting.
The motion passed.
Yes: Craig Jones, Rose Ceballos (Bayside Community Clinic), Kim Heinle (Bayside Community Clinic),
Monica Hernandez (Casa Familiar), Goyo Ortiz (Casa Familiar), Brendaly Rodriguez (Chula Vista Community
Collaborative), Randy Torres-Van Vleck (City Heights CDC), Carol Lewis (El Cajon Collaborative), Elizabeth Lou
(Nile Sisters Development Initiative, Breanne Lash (Nile Sisters Development Initiative), Mohammed Tuama
(Nile Sisters Development Initiative), Claire Groebner (Olivewood Gardens), Rocina Lizarraga (Olivewood
Gardens), Lorna Delossantos (Samahan Health Centers), Brian “Barry” Pollard, and Erica Leary
(Vista Community Clinic).
No: None.
Abstain: None.
Absent: None.

3. Public Comments/Communications/Member Comments
None.
                                              Chair’s Report

4. Chair’s Report (Information)
Chair Moreno provided an overview that was presented earlier in February by Planning Director
Coleen Clementson on how SANDAG will transform the Vision into the 2021 Regional Plan for a faster,
fairer, and cleaner transportation system across the region. She spoke about an excellent presentation from
SANDAG’s Office of Diversity and Equity regarding best practices in supporting disadvantage businesses. This
recording can be found on the SANDAGregion YouTube channel for the February 26, 2021, Board meeting.
Chair Moreno reminded everyone that now that SANDAG is recording all Board, Committee, and Working
Group meetings, it is possible to listen to key reports and stay updated for issues that are important to all
participants.
Last week, SANDAG Executive Director Hasan Ikhrata testified at the California Strategic Growth Council
meeting and expressed support for updates to the Affordable Housing and Sustainable Communities grant
program draft guidelines, which would include a distribution goal for each geographic area. This means that
at least one project in the San Diego geographic area will be awarded in the next grant cycle.
Finally, the Mid-Coast Trolley project which is scheduled to open later this year has had some major milestones
including the lighting of the Gilman Bridge, completion of construction on Friars Road portions of which had
been closed since 2016 as part of the Mid-Coast Trolley and San Diego River Double Track projects.
Action: Information only.

                                                   Reports

5. Proposed Fare Changes (Discussion/Possible Action)
Senior Transit Planner Brian Lane presented an update to the Fare Policy being considered by SANDAG and
transit agencies in relation to the new system coming online, PRONTO.
Action: Upon a motion by Randy Torres-Van Vleck and a second by Craig Jones, the Working Group is
writing to express our support for the new PRONTO Fare System and for a reduction in Youth one-way fares
from $2.50 to $1.25. The Working Group appreciates that the PRONTO Fare System will automatically give
riders the best allowable fare while also enabling “fare capping” so that riders never pay more than the cost
of a regional day pass. We also support the free two hours of transfers with a one-way fare purchase on the
PRONTO card. We support the free transfer proposal but are concerned that this addition calls for a one-way
fare increase in FY 2025. As noted in the Board of Director’s approved motion, this potential FY 2025 fare
increase will be subject to a Board of Directors vote in the future. We support PRONTO, we support a
reduction in Youth one-way fares and two hours of transfers at no cost, but oppose a future fare increase.
We urge SANDAG to include no-cost fare scenarios, especially for youth and low-income riders, as part of the
2021 Regional Plan.
The motion passed.
Yes: Craig Jones, Rose Ceballos, Monica Hernandez, Goyo Ortiz, Brendaly Rodriguez, Randy Torres-Van
Vleck, Carol Lewis, Elizabeth Lou, Breanne Lash, Mohammed Tuama, Claire Groebner, Rocina Lizarraga,
Lorna Delossantos, Brian “Barry” Pollard, and Erica Leary.
No: None.
Abstain: None.
Absent: None.

6.   Social Equity Nomenclature (Discussion/Possible Action)
Senior Regional Planner Jane Clough (SANDAG) provided an overview of the preliminary social equity analysis.
Action: Discussion only.

7. Possible Topics for Next Meeting (Discussion/Possible Action)
Councilmember Moreno, Working Group Chair, asked the Working Group to discuss possible topics for the
next meeting.

8. Upcoming Meetings (Information
The next Social Equity Working Group meeting is scheduled for April 1, 2021, at 10:30 a.m.

9. Adjournment
Chair Moreno adjourned the meeting at 12:01 p.m.

                                                       2
Meeting Start Time: 10:34 a.m.
                                                                              Meeting Adjourned Time: 12:01 p.m.

Confirmed Attendance at SANDAG 2021 Regional Plan Social Equity
Working Group Meeting
March 4, 2021

             Jurisdiction.                              Name                     Attended          Comments

SANDAG Board Alternate                Councilmember Vivian Moreno, Chair            Yes
                                      Craig Jones                                   Yes
Alliance for Regional Solutions
                                      MaryLynn McCorkle, Alternate                   No
                                      Kim Heinle                                    Yes
Bayside Community Clinic
                                      Rose Ceballos, Alternate                      Yes
                                      Lisa Cuestas                                   No
Casa Familiar                         Monica Hernandez, Alternate                   Yes
                                      Goyo Ortiz, Alternate                         Yes
                                      Brendaly Rodriguez                            Yes
Chula Vista Community Collaborative Azucena Lopez De Nava, Alternate                Yes
                                      Angela Tomlinson, Alternate                    No
                                      Randy Torres-Van Vleck                        Yes
City Heights CDC
                                      Stephanie Hernandez, Alternate                Yes
                                      Carol Lewis                                   Yes
El Cajon Collaborative
                                      Dana Stevens, Alternate                        No
                                      Michelle Ramos, Alternate                     Yes
National Latino Research Center       Ana Ardón, Alternate                          Yes
                                      Konane Martinez, Member                       Yes
                                      Elizabeth Lou                                 Yes
Nile Sisters Development Initiative
                                      Breanne Lash, Alternate                       Yes
                                      Claire Groebner                               Yes
Olivewood Gardens                     Jen Nation, Alternate                          No
                                      Rocina Lizarraga, Alternate                   Yes
                                      Fe Seligman                                    No
Samahan Health Centers
                                      Lorna Delossantos, Alternate                  Yes
Urban Collaborative Project           Brian “Barry” Pollard                         Yes
                                      Erica Leary                                   Yes
Vista Community Clinic
                                      Carmela Muñoz, Alternate                      Yes
Other Attendees
Anna Van
Emma Brody
Haneen Mohamed
Jacqueline Reynoso
Noa Harris
SANDAG Staff
Brian Lane                                                    Jane Clough
Catherine Matel                                               John Kirk
Chris Velasco                                                 Phil Trom
Coleen Clementson                                             Tuere Fa’aola
Evelia Castellanos

                                                              3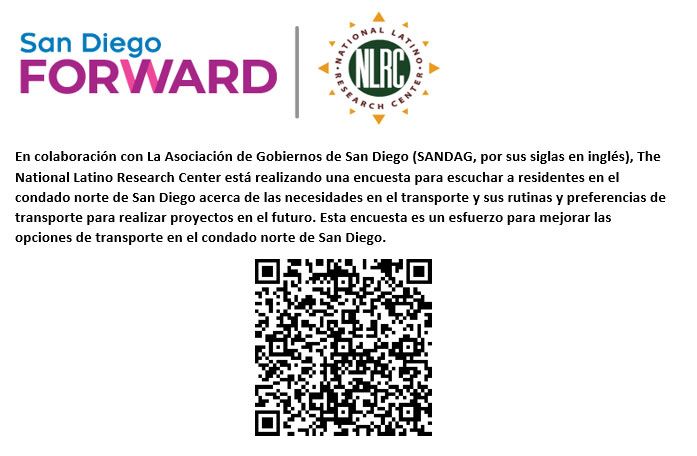
Agenda Item No. 5
                                                          2021 Regional Plan Social Equity Working Group

SANDAG
                                                                                             April 1, 2021

    401 B Street, Suite 800      March 16, 2021                                                   OWP 3102005
San Diego, CA 92701-4231
              (619) 699-1900
         Fax (619) 699-1905      Dear SANDAG Transportation Committee and Board:
                  sandag.org
                                 Subject: Social Equity Working Group Fares Recommendation

                                 On behalf of the 2021 Regional Plan Social Equity Working Group is writing to
                                 express our support for the new PRONTO Fare System and for a reduction in
        MEMBER AGENCIES          Youth one-way fares from $ 2.50to $1.25.
                   Cities of
                   Carlsbad      The Working Group appreciates that the PRONTO Fare System will
                 Chula Vista     automatically give riders the best allowable fare while also enabling "fare
                  Coronado       capping" so that riders never pay more than the cost of a regional day pass.
                    De/Mar       We also support the free 2-hours of transfers with a one-way fare purchase on
                   El Cajon      the PRONTO card.
                  Encinitas
                 Escondido       We support the free transfer proposal but are concerned that this addition
             Imperial Beach      calls for a one-way fare increase in FY 2025. As noted in the Board of Directors'
                   La Mesa       approved motion, this potential FY 2025 fare increase will be subject to a
               Lemon Grove       Board of Directors vote in the future. We support PRONTO, a reduction in
               National City
                                 Youth one-way fares, and 2-hours of transfers at no-cost but oppose a future
                 Oceanside
                                 fare increase. We urge SANDAG to include no-cost fare scenarios, especially for
                     Poway
                                 youth and low-income riders, as part of the SANDAG 2021 Regional Plan.
                  San Diego
                 San Marcos
                     Santee
               Solana Beach
                                 Sincerely,
                        Vista
                         and
        County of San Diego
                                 VIVIAN MORENO, CHAIR
       ADVISORY MEMBERS
                                 2021 Regional Plan Social Equity Working Group
             Imperial County
                                 VMO/ECA/ais
      California Department
           of Transportation

               Metropolitan
              Transit System

               North County
              Transit District

             United States
     Department of Defense

                  San Diego
         Unified Port District

           San Diego County
             Water Authority

          Southern California
Tribal Chairmen's Association

                      Mexico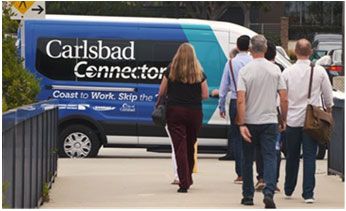
2021 Regional Plan Social Equity Working Group

                                                                                                         Item:   6
April 1, 2021                                                                               Action: Information

Community Mobility Needs Assessment Survey
Introduction
SANDAG is currently preparing San Diego Forward: The 2021 Regional Plan (2021 Regional Plan), which uses
a framework of the 5 Big Moves to deliver a fully integrated, world-class transportation system. This
transformative vision leverages technology to create a safe, adaptable, and socially equitable transportation
system that responds to the unique needs of the wonderfully diverse communities throughout our region. To
help inform the development of the 2021 Regional Plan, SANDAG worked closely with the regional network
of community-based organizations to conduct a community mobility needs assessment to evaluate the needs
and opportunities for 2021 Regional Plan projects in historically underserved communities. The purpose of
the needs assessment is to evaluate existing transportation services and identify opportunities for new
transportation solutions that address the unique needs of San Diego’s diverse communities.

Discussion
The mobility needs assessment is employing a quantitative and qualitative analysis approach. A survey was
developed jointly with the community-based organization outreach team to solicit feedback from community
members on their transportation experience. The survey was an opportunity to gain deeper insight into
existing transportation options in the region, identify barriers to transportation access, and evaluate impacts
of the COVID-19 pandemic on travel behaviors. Survey instruments were available in English, Spanish, Arabic,
Tagalog, and Vietnamese. The regional network of community-based organizations used various methods to
distribute the survey including social media, newsletters, email distribution lists, food distribution events, and
phone banks.

The majority of responses were collected between November and December 2020. The survey collected over
2,900 responses from a diverse group of community members. Over 73% of respondents identified as female
and almost 70% of respondents identify as people of color. Approximately 87% of respondents reported an
annual household income that is less than the region’s median household income of about $82,000 based on
2019 SANDAG Population and Housing estimates. The mobility needs survey highlighted several
opportunities that may inform future design and implementation of 2021 Regional Plan projects and pilots in
historically underserved communities. More information on the results of the community-based mobility
needs assessment survey can be found in Attachment 1.

Next Steps
Survey datasets are being made available the regional network of community-based organizations to support
additional analyses. Results from this effort are being used to support the social equity analysis for the Draft
2021 Regional Plan, which is anticipated to be released for public review in Spring 2021. Survey results will
also be used to inform future pilots and studies such as the Flexible Fleet Implementation Strategic Plan,
Comprehensive Multimodal Corridor Plans, and Regional Digital Equity Strategy and Action Plan.

Key Staff Contact:    Krystal Ayala, (619) 699-1998, krystal.ayala@sandag.org
Attachment(s):        1. Community Mobility Needs Assessment Survey Summary
                      2. Community Mobility Needs Assessment Presentation
Attachment 1

Community Mobility Needs
Assessment Survey Summary

Overview
SANDAG worked closely with the network of community-based organizations to conduct a
community mobility needs assessment. The purpose of the needs assessment is to evaluate
needs, priorities, and opportunities for 2021 Regional Plan projects in historically underserved
communities through a meaningful and representative community engagement process. The
needs assessment is intended to provide a comprehensive evaluation of existing
transportation services and assess opportunities for new transportation solutions that address
the unique needs and diverse backgrounds of communities within the region.

The mobility needs assessment is taking a quantitative and qualitative analysis approach
to better understand community demographics, existing transportation infrastructure,
and services. A survey was developed jointly with the network of community-based
organizations to solicit feedback from community members on their transportation
experience. The survey was an opportunity to gain deeper insight into existing
transportation options in the region, identify barriers to transportation access, and
evaluate impacts of COVID-19 on use and willingness to use a variety of transportation
services. The survey was developed and distributed via SurveyMonkey. Instruments were
available in multiple languages, including English, Spanish, Arabic, Tagalog, and
Vietnamese. The network of organizations used various methods to distribute the survey,
including social media, newsletters, email distribution lists, food distribution events, and
phone banks. The community mobility needs assessment survey was a sample of
convenience. The results of the survey reflected in this summary are not weighted or
statistically representative of the entire San Diego region. The majority of responses were
collected between November and December 2020.

Survey Respondent Demographics
The survey collected over 2,900 responses from a diverse group of community members.
The majority of respondents identified as female (73%) and black, indigenous, or people of
color (BIPOC) (69%). Approximately 87% of respondents reported an annual household
income that is less than the region’s median household income of about $82,000 based
on 2019 SANDAG Population and Housing estimates. More than 45% of respondents
reported being full- or part-time employed, 5% reported being students, and 40%
reported being either unemployed, retired, or not working.

                                               2
Table H2.1: Demographics of Survey Respondents
Demographics of Survey Respondents
Number of respondents Percentage of Respondents
Gender
Male 488 23.80%
Female 1,512 73.80%
Non-binary 4 0.20%
Prefer not to answer 41 2.00%
Other 4 0.20%
Ethnicity
American Indian or Alaska Native 45 2.10%
Asian 127 5.80%
Black or African American 143 6.60%
White 643 29.50%
Latinx/Latino/Latina/Hispanic 1,044 47.90%
Middle Eastern 35 1.60%
Native Hawaiian or
19 0.90%
other Pacific Islander
South Asian 13 0.60%
Other 109 5.00%
Income
Less than $24,999 952 50.10%
$25,000 - $34,999 313 16.50%
$35,000 - $49,999 172 9.00%
$50,000 - $64,999 131 6.90%
$65,000 - $79,999 96 5.00%
$80,000 or more 237 12.50%
Employment
Full-time employed 687 30.80%
Part-time employed 353 15.80%
Full-time student 78 3.50%
Part-time student 50 2.20%
Unemployed and not seeking
93 4.20%
employment
Unemployed and seeking
258 11.60%
employment
Retired 163 7.30%
Not working 372 16.70%
Other 175 7.90%
3Travel Experiences and Access to Transportation
When asked to indicate their ease of traveling throughout the region, more than 63% of
respondents indicated that it is generally easy for them to get to where they need to go
(Figure H2.1). While it is certainly notable that the majority of respondents indicated that
they could travel to their destinations with ease, approximately one-third of respondents
indicated that they do not agree or are neutral. This shows that there are opportunities to
improve the transportation experience for many respondents.
Figure H2.1: Ease of Travel
It is generally easy for me to get to where I need to go:
Disagree
13%
Neutral
24%
Agree
63%
More than 80% of respondents indicated having access to a personal vehicle, although
just over half of the respondents reported having access to a personal micromobility
device such as a bike, scooter, or skateboard (Table H2.2). This highlights the
opportunities for Flexible Fleets to provide an affordable option for those who do not own
a vehicle and help reduce the reliance on owning a personal vehicle to move around.
Shared micromobility services such as bikeshare, scootershare, and other rideables may
also provide a healthy and sustainable transportation option for respondents who do not
currently have access to bike or scooter.
Table H2.2: Access to Transportation Vehicles
Access to Transportation Vehicles
Yes No
Access to personal vehicles 2,473 (84%) 454 (16%)
Access to one or more bikes, scooters, or
1,159 (58%) 1,146 (42%)
skateboards
4Transportation Planning Considerations
There are many factors that may influence access to transportations beyond ownership of
a personal vehicle or micromobility device. This might could include physical or
developmental impairments that may make it difficult for someone to travel or use a
service, difficulties accessing technologies that many new mobility services rely on,
challenges with payment, or concerns about safety.
Forty-five percent (45%) of respondents indicated that they have a medical condition that
makes it difficult to travel. This is mostly reflected in respondent’s difficulties to walk, take
transit, and bike. Transportation solutions should be designed using a community-
focused approach to ensure vehicles and services address user needs and are accessible
for all to use.
Figure H2.2: Medical Conditions May Impact Travel
Please let us know if you have a medical condition that makes it more
difficult to:
Other
10%
Walk
Public Transit 32%
18%
Drive
15% Roll
Bike
8%
17%
Transportation technology has evolved rapidly in the past decade and enabled the rise of
app-enabled mobility services that can be reserved on demand using a smartphone
application. Many of these new mobility services, however, require users to own a
smartphone and have an active bank account and driver’s license to access the service.
These service models may exacerbate existing disparities regarding access to technology
and information. Of the technologies listed in Table H2.3, respondents indicated that they
most regularly use a smartphone, followed by home internet. With regard to access to
traditional payment options, the majority of respondents indicated that they most
regularly use credit and/or debit cards and cash (Table H2.4). Food vouchers and/or food
stamps and prepaid cash cards are also regularly used by hundreds of respondents. This
highlights the need for mobility services and programs to provide alternative payment
options to ensure affordable and equitable access.
5Table H2.3: Technologies Used Regularly
Technologies used regularly
Number of Percentage of
respondents respondents
Smartphone 2,026 77.3%
Home internet 1,651 63.0%
Phone data plan 897 34.2%
Cell phone (not a smartphone) 583 22.2%
I do not use any of these
52 2.0%
technologies regularly
Table H2.4: Payment Options Used Regularly
Payment options used regularly
Number of Percentage of
respondents respondents
Cash 1,719 66.7%
Credit and/or debit card 1,804 70.0%
Prepaid cash card 142 5.5%
Food voucher and/or food stamps 560 21.7%
Access to New Mobility Solutions
New mobility services provided by Flexible Fleets can provide new, alternative ways of
traveling that reduce the reliance on owning a car to move around. The vast majority of
respondents are not familiar with new mobility options like electric vehicles, carshare,
bikeshare, and scootershare. The transportation options that survey respondents were
most familiar with were on-demand ride hailing services and electric vehicles. This is
likely due to their widespread adoption and use throughout the entire region, whereas
services like bikeshare, scootershare, and on-demand shuttles have been piloted and
deployed a few areas of the region. Developing local ordinances, permit programs, and
partnerships with mobility providers can help ensure services are deployed equitably
throughout the region in support of mobility and social equity goals.
6Table H2.5: Familiarity with New Mobility Services
Familiarity with new mobility services
Somewhat
Not familiar Very familiar
familiar
Electric cars 46.9% 35.8% 16.0%
Carshare (e.g., Zipcar) 69.0% 21.2% 7.7%
Bikeshare 77.9% 13.7% 5.9%
Scootershare (e.g., Bird, Lime) 72.6% 16.4% 8.9%
E-bikes 73.1% 17.9% 6.2%
On-demand ridehailing (e.g.,
38.0% 32.0% 28.1%
Uber, Lyft)
Neighborhood Shuttles
73.5% 18.8% 5.6%
(microtransit)
Automated vehicles 66.9% 17.5% 12.0%
As discussed earlier, there are many barriers that may impact the ability to adopt or use
these technology-based mobility services. Of the respondents that had used the above-
named mobility services, many faced challenges using the mobility services due to a lack
of a smartphone, driver’s license, and/or credit card. Other challenges faced by
respondents included difficulties hailing a vehicle, difficulties finding a micromobility
device in their community, or feeling unsafe using these services.
Figure H2.3: Challenges with new mobility services
Have you experienced any challenges while trying to use any of the
services above?
Didn't feel safe when using service 9
Didn’t know where to park or leave vehicle when done 73
Road conditions felt unsafe 82
Drivers license required 95
Didn’t have a smartphone to book a ride 117
No access to a credit card 240
Did not feel safe when using service 407
Other 502
0 100 200 300 400 500 600
n=1,525
7Finally, it is important to note the impact that COVID-19 has had on respondent travel
preferences and opinions. While the long-term impact of the COVID-19 pandemic on our
travel remains unknown, the survey revealed respondent hesitations with readily using
shared mobility services including transit and on-demand rideshare. Concerns with using
shared mobility services are mostly related to passenger safety, comfort, and cleanliness
of vehicles. Future mobility services will need to integrate amenities and features to
ensure riders feel safe and comfortable when traveling.
Figure H2.4: Traveling Post–COVID-19
Once social distancing measures are lifted, do you have any of the
following concerns with using public transportation or rideshare?
(check all that apply) Other
3%
Prefer own
22%
Not concerned
14%
Facial covering Cleanliness
regulation 17%
21%
Sharing
Comfortable
with
near others
others
14%
9%
Key Takeaways
The mobility needs survey highlighted several opportunities that may inform future
development or design of 2021 Regional Plan projects and pilots in historically
underserved communities. Although the majority of respondents indicated that they
have access to a working vehicle or a personal micromobility device, several respondents
indicated that they are not able to easily move around the region. This survey highlights
opportunities to improve transportation options in these communities and provide a
compelling mobility option that works for community members of all backgrounds. Many
barriers to new mobility options exist. For future services to be successful, new mobility
solutions should consider options for those that do not have access to a smartphone,
debit or credit card, or driver’s license. Additionally, public outreach and marketing will be
critical to ensure community members are aware and familiar with these services.
Collaboration among public agencies, private sectors, and community-based
organizations is critical to ensure that new mobility options are designed to address and
respond to community needs.
8Attachment 2
Community Mobility Needs
Assessment Survey
Social Equity Working Group | April 1, 2021
1
Community Identify needs, challenges, and
Mobility preferences through community-based
Needs outreach
Assessment
Goals Evaluate gaps and opportunities for the
Regional Plan in historically underserved
communities
Inform future planning and
implementation of pilots and projects
| 2
2
9Attachment 2
• Online survey; in-person and telephone
interviews also conducted
• Convenience-based sample
Needs • Data collected November – December
2020; February – March 2021
Assessment
Survey
| 3
3
Survey available in multiple languages
| 4
4
10Attachment 2
Almost 3,000
responses
collected in
partnership
with 13
community-
based
organizations
| 5
5
Survey respondents represent diverse community members
Gender South Asian Ethnicity Income
1%
Native
Non-binary Hawaiian or American
Prefer not to 0.2% Indian or
Other (please other Pacific
answer Alaska Native
Islander
2% specify) 2%
1% Black or
0.2%
Middle African $65,000 -
Other American
Eastern 5% Asian $79,999
2% 6% 6% 5% $80,000 or
more
13%
Male
24%
$50,000 -
$64,999
7%
Less than
$35,000 - $24,999
$49,999 50%
White 9%
Latinx/Latino/Latina 29%
/Hispanic
48%
Female
74% $25,000 -
$34,999
16%
n=2,049 n=1,901
n=2,178
| 6
6
11Attachment 2
Access to • More than 80% of respondents
have access to a personal
Transportation vehicle
Vehicles • Over 50% of respondents have
access to a personal
micromobility device like a bike,
scooter, or other rideable (e.g.,
skateboard)
• 13% of respondents that it is not easy for them to
travel where they need to go
| 7
7
Travel Behavior
• Majority of respondents rely on driving or
riding with others for their everyday travel
• 1 out of 4 respondents indicated that they
used transit weekly prior to the COVID-
19 pandemic.
• As a result of the COVID-19 pandemic,
majority of respondents experienced a:
• Decrease in driving, carpool, transit, and on-
demand ridehailing services
• Increase in walking and teleworking
| 8
8
12Attachment 2
Technologies used regularly
Alternative None 2%
payment
methods and Phone Data Plan 22%
internet Home Internet 34%
access Smartphone 77%
options n=2,621
Payment methods used regularly
Prepaid cash card 6%
Food voucher and/or food stamps 22%
Cash 67%
Credit and/or debit card 70%
n=2,578
| 9
9
Familiarity with New Mobility Services
• The majority of respondents are
unfamiliar with new mobility
options like autonomous vehicles,
scootershare, and carshare.
• Most familiar with on-demand
ride hailing services and
electric vehicles.
| 10
10
13Attachment 2
Mobility • Almost half of respondents have a medical condition
that makes it difficult to travel.
Challenges
• Many new mobility users faced challenges using
these services due to a lack of a smartphone,
driver’s license, and/or credit card.
• Unsafe riding conditions also a major concern for
respondents
• Respondents expressed concerns related to
COVID-19 such as safety, comfort, and
cleanliness of vehicles
| 11
11
• Employ a community-focused approach to
Several design Flexible Fleet services:
opportunities - Accessible vehicles
exist - Options for users without internet, smartphones, or
driver’s licenses
- Alternative payment methods
• Implement supportive Complete Corridor
infrastructure and Mobility Hub amenities
• Integrate representative public outreach and
education
• Collaborate with public agencies, private sectors,
and community-based organizations, and other
stakeholders
| 12
12
142021 Regional Plan Social Equity Working Group
Item: 7
April 1, 2021 Action: Discussion
2021 Regional Plan – Assembly Bill 805 Pollution-Reduction
Strategy
Introduction
The Vision for San Diego Forward: The 2021 Regional Plan (2021 Regional Plan) is fundamentally shaped by
five inter-reliant strategies for mobility, collectively known as the 5 Big Moves – Complete Corridors, Transit
Leap, Mobility Hubs, Flexible Fleets, and the Next OS. With the intent to uplift people who have been
historically faced with social injustice, the 2021 Regional Plan integrates the 5 Big Moves to provide a system
that is faster, fairer, and cleaner. Through a data-driven and informed process, SANDAG designed the
network to offer a variety of transportation options people can choose from to get where they want to go
and, more importantly, to meet the transportation needs of disadvantaged communities.
In accordance with California Assembly Bill 805 (Gonzalez Fletcher, 2017) (AB 805), SANDAG has identified
the location of disadvantaged communities using the California Communities Environmental Health
Screening Tool, or CalEnviroScreen 3.0. This statewide tool evaluates multiple pollutants and stressors at the
census tract level. SANDAG uses the data to identify the projects, strategies, and programs included in the
Regional Plan that reduce pollution exposure for those affected communities.
The transportation and active transportation networks coupled together will alleviate air pollution burden on
vulnerable communities by reducing pollution emissions and exposure in these communities and the region
as a whole. Local jurisdictions are aligning with 2021 Regional Plan strategies to fund neighborhood-level
projects. For example, the City of San Diego’s Climate Equity Index uses 35 indicators, ranging from air
pollution to street conditions, to measure inequity on the Census tract level. The City of San Diego will utilize
this index to prioritize and allocate funding for projects, such as sidewalk and public transit improvements, for
communities that scored below average.
SANDAG focuses the identification of pollution reduction strategies for the most vulnerable 25% of
communities as well as an additional tier of communities to 51% of the environmental/socioeconomic
vulnerability scale. During the December 2020 Working Group meeting, SANDAG introduced the
methodology for identifying disadvantaged communities and analyzing pollution reduction strategies to
Working Group members. This report shares the initial draft analysis of the projects, programs, and policies
(implementation strategies) in the 2021 Regional Plan that would reduce pollution emissions and exposure
for disadvantaged communities (Attachment 1).
Key Staff Contact: Anna Van, (619) 699-7341, anna.van@sandag.org
Attachment: 1. California Assembly Bill 805 Pollution-Reduction Strategy AnalysisAttachment 1
Draft California Assembly Bill 805 Pollution-Reduction Strategy
Analysis
Overview
The Vision for the 2021 Regional Plan reimagines the transportation system using a data-driven planning
process and the 5 Big Moves—inter-reliant strategies that provide a regional system of Complete
Corridors that are managed in real time by the Next Operating System (Next OS) to create capacity and
keep the transportation system operating smoothly and safely for all modes. Transit Leap and Flexible
Fleet services connect a network of Mobility Hubs that covers the region’s population centers, major
employment centers, and other key activity centers across the region.
The 2021 Regional Plan integrates the 5 Big Moves to meet regulatory requirements, address traffic
congestion, and create equal access to jobs, education, healthcare, and other community resources. In
addition, the 2021 Regional Plan specifically identifies pollution reduction strategies in disadvantaged
communities.
California Assembly Bill 805 (Gonzalez Fletcher, 2017) (AB 805) (Chapter 658, Statutes of 2017) requires,
among other things, that the 2021 Regional Plan include strategies that provide for mode shift to public
transportation, identification of disadvantaged communities, and transportation strategies to reduce pollution
exposure in disadvantaged communities.
Defining Disadvantaged Communities
In accordance with AB 805, SANDAG has identified the location of disadvantaged communities as
designated pursuant to Section 39711 of the Health and Safety Code. The California Office of
Environmental Health Hazard Assessment has developed a screening tool—the California Communities
Environmental Health Screening Tool, or CalEnviroScreen 3.0—for designating these communities. This
statewide tool evaluates multiple pollutants and stressors at the Census tract level. CalEnviroScreen
provides a snapshot of existing condition based on historical data; it does not forecast future conditions
for disadvantaged communities. SANDAG uses the data to identify the projects, strategies, and
programs included in the 2021 Regional Plan that reduce pollution exposure for those impacted
communities.
Using CalEnviroScreen, SANDAG has mapped the communities in the region that meet the pollution
exposure and demographic characteristics of disadvantaged communities. Figure 1 shows the
disadvantaged communities in the San Diego region. For purposes of the 2021 Regional Plan, SANDAG
focuses the identification of pollution reduction strategies for the most vulnerable 25% as well as a
second tier of communities to 51% of the environmental/socioeconomic vulnerability scale.
2Figure 1: AB 805 Pollution-Reduction Strategies
3The 2021 Regional Plan Social Equity Working Group (Working Group) provided input on the
development of the 2021 Regional Plan from a social equity perspective. The Working Group provided
input on various steps in the development of the 2021 Regional Plan, including gathering input on the
mobility needs of each community, defining the performance measures used for the social equity
analysis, and providing input about how the AB 805 analysis was conducted for the 2021 Regional Plan.
Working Group members suggested alternatives for SANDAG to consider, which include modifying the
methodology for defining disadvantaged communities and considering which version of CalEnviroScreen
to use. At the time the plan was drafted, CalEnviroScreen 3.0 was the adopted version of the tool. A
draft of CalEnviroScreen version 4.0 was released in late February 2021, so this analysis relies on the
currently adopted version of the tool to identify disadvantaged communities.
Pollution-Reduction Measures
Pollution-reduction measures in the 2021 Regional Plan include projects, policies (implementation
strategies), and programs that all work together to implement the transportation network. For purposes
of AB 805, SANDAG identifies all three categories that are included in, or provide benefit to,
disadvantaged communities.
Critical to implementing all of these pieces of the plan is the SANDAG Regional Social Equity Planning
Framework. The 2021 Regional Plan establishes a framework for how SANDAG approaches,
incorporates, and prioritizes social equity in all SANDAG plans, programs, and projects. SANDAG will
partner to advance investments in communities that have been historically underserved and
underrepresented – those who have been systemically marginalized and impacted by actions and
inactions at all levels of our government and society. This includes people with low incomes, people of
color, people with disabilities, and people with limited English proficiency. While the projects listed
below are specific to the disadvantaged communities, the policies and programs apply more generally
and do not specifically allocated or applied to any particular community. It is therefore important to
understand how SANDAG will distribute funding in the future and to fully integrate the Social Equity
Planning Framework into any methodology or formula for distributing funds or implementing programs.
While it should be noted that the 2021 Regional Plan includes network improvements for all modes of
transportation, and all of the projects are intended to work as a system to benefit mobility, congestion,
and equity, some of the projects – on their own – would not necessarily reduce pollution. Therefore,
those transportation projects that either alone, or as they function within the transportation system,
reduce pollution are listed in Table 1. Following the transportation project list is a description of the
Regional Plan policies (implementation measures) and how they could be implemented to reduce
pollution, and finally the programs (grants) that could be applied in disadvantaged communities to
reduce pollution.
Transportation Projects
Table 1 is arranged in two columns showing projects benefitting communities in the 25% areas of
CalEnviroScreen and 51%, respectively. They are ordered by type and alphabetical by jurisdiction. In
addition to the project list, the transportation and active transportation networks will benefit from
service enhancements to transit that are not identified on the list of projects. Specifically, the Transit
Leap category of projects create a complete network of fast, high-capacity, high-frequency transit
4services that connect communities to employment centers, healthcare facilities, and other important
destinations throughout the San Diego region. Some of these projects build upon the existing transit
services with upgrades to transit stations and increased frequencies. The light rail lines currently in
operation will receive major enhancements in service through grade separation and double- or triple-
tracking for higher-frequency operations. Seeing that many of the light rail routes operate in
disadvantaged communities, grade separation will reduce the communities’ pollution exposure by
alleviating traffic congestion while allowing rail service to operate more frequently without having to
stop for local traffic.
Following Table 1, the projects are shown in Figures 2–4.
5Table 1: Transit and Bike Projects Located in Disadvantaged Communities
Transit and Bike Projects Located in Disadvantaged Communities
Top 25% Top 51% (expanded communities)
Chula Vista
New Transit Stations and Mobility Hub
• Downtown Chula Vista Mobility Hub • Tier 1 Transit Station (H Street/4th)
• Southwest Chula Vista Mobility Hub o Commuter Rail 582
• Tier 3 Transit Station (H/Marina) o Commuter Rail 583
o Rapid 709 o Rapid 709
• Tier 1 Transit Station (Palomar/4th)
o Commuter Rail 582
o Commuter Rail 583
o Rapid 625
o Rapid 635
o Rapid 293
Bike Projects
• Bayshore Bikeway Upgrades • Bay to Ranch Bikeway
• Chula Vista (J Street) • I-805 Connector – Bonita Road to Floyd Avenue
• Chula Vista Greenbelt
City of San Diego
Balboa Park
Bike Projects
• Pershing Drive Bikeway
• North Park to Downtown
• El Prado Cross Park
Barrio Logan
New Transit Stations and Mobility Hub
• Urban Core Mobility Hub*
New Transit Lines
• Rapid 12
• Rapid 910
City Heights
New Mobility Hub
• Urban Core Mobility Hub*
New Transit Lines
• Rapid 10
Bike Projects
• City Heights/Fairmount Corridor
• North Park/Mid-City Bikeways: Orange Bikeway
Downtown
New Transit Stations and Mobility Hub
6Transit and Bike Projects Located in Disadvantaged Communities
Top 25% Top 51% (expanded communities)
• Urban Core Mobility Hub* • Tier 1 Transit Station (Santa Fe Station)
• Tier 1 Transit Station (Centre City) o Commuter Rail 581
o Commuter Rail 581 o Commuter Rail 583
o Commuter Rail 583 • COASTER Station (Gaslamp Quarter)
• Tier 1 Transit Station (12th/Imperial) o Commuter Rail 398
o Commuter Rail 581
o Commuter Rail 583
New Transit Lines
• Tram 555
• Rapid 12
• Rapid 630
• Rapid 640
• Rapid 910
Bike Projects
• North Park to Downtown • Bayshore Bikeway Upgrades
• Centre City – La Mesa Corridor
• Downtown San Diego to Encanto
• Downtown to Southeast
Eastern Area
New Transit Lines
• Rapid 10
• Rapid 625
Encanto
New Transit Stations and Mobility Hub
• Southeast San Diego Mobility Hub*
• Tier 1 Transit Station (Euclid Station)
o Commuter Rail 582
New Transit Lines
• Rapid 12
• Rapid 625
Bike Projects
• Centre City – La Mesa Corridor via Lincoln • Encanto, Lincoln Heights to Lemon Grove
Heights/Encanto/Lemon Grove
• City Heights/Fairmount Corridor
• Encanto to Chula Vista National City connections
Greater Golden Hill
New Transit Stations and Mobility Hub
• Urban Core Mobility Hub*
• Tier 3 Transit Station (28th/SR94)
o Rapid 637
• Tier 3 Transit Station (SR94/Golden Hill Transit)
o Rapid 225
o Rapid 235
New Transit Lines
7Transit and Bike Projects Located in Disadvantaged Communities
Top 25% Top 51% (expanded communities)
• Tram 555
Bike Projects
• Pershing Drive Bikeway
Kearny Mesa
New Transit Stations and Mobility Hub
• Kearny Mesa Mobility Hub
• Tier 1 Transit Station (Kearny Mesa)
o Commuter Rail 582
New Transit Lines
• Rapid 28
• Rapid 120
• Rapid 292
• Rapid 295
• Rapid 630
• Rapid 890
• Local Bus Route 668 (through Murphy Canyon with 8
new stops)
• Local Bus Route 649 (between Ruffner Street and
Overland Avenue with 17 new stops)
Bike Projects
• Kearny Mesa to Beaches Corridor – Linda Vista Road to
I-15 Bikeway
• I-15 Bikeway – Murphy Canyon to Affinity Court
• SR 52 Bikeway – I-5 to Santo Road
Linda Vista
New Transit Stations and Mobility Hub
• Mission Valley Mobility Hub*
New Transit Lines
• Rapid Route 28
• Rapid Route 41
• Rapid Route 120
Bike Projects
• Clairemont – Centre City Corridor
Midway–Pacific Highway
New Transit Stations and Mobility Hub
8Transit and Bike Projects Located in Disadvantaged Communities
Top 25% Top 51% (expanded communities)
• Urban Core Mobility Hub*
o Commuter Rail 581
o Commuter Rail 581b
o Commuter Rail 583
o Commuter Rail 398
o Light Rail 510
o Light Rail 530
o Rapid 10
o Rapid 28
o Rapid 640
Bike Projects
• Central Mobility Bikeway
Mission Valley
New Transit Stations and Mobility Hub
• Mission Valley Mobility Hub*
Old Town
Bike Projects
• Uptown 4: Mission Hills and Old Town Bikeways
• Coastal Rail Trail San Diego – Pac Hwy (Fiesta Island Rd
to Taylor St)
Otay Mesa
New Transit Stations and Mobility Hub
• San Ysidro Mobility Hub*
• Tier 1 Transit Station (Rodriguez/Border)
o Commuter Rail 582
o Commuter Rail 583
• Tier 3 Transit Station (Cactus/Airway)
o Rapid 638
• Tier 3 Transit Station (Airway/Airway)
o Rapid 638
• Tier 3 Transit Station (Heritage/Airway)
o Rapid 638
New Transit Lines
• Rapid 292
• Rapid 950
• Local Bus Route 661 (between Heritage Road and Alta
Road with 13 new stops)
Bike Projects
• SR 905 Corridor
• SR 125 Connector – Bonita Road to U.S.–Mexico Border
Otay Mesa–Nestor
New Transit Stations and Mobility Hub
• Imperial Beach Mobility Hub*
9Transit and Bike Projects Located in Disadvantaged Communities
Top 25% Top 51% (expanded communities)
New Transit Lines
• Rapid 293
• Rapid 630
• Rapid 950
Bike Projects
• Bayshore Bikeway: Segment 8B Main Street to Ada
Street
San Ysidro
New Transit Stations and Mobility Hub
• San Ysidro Mobility Hub* • Tier 3 Transit Station (Frost/Frost)
o Rapid 28
o Rapid 120
• Tier 1 Transit Station (Hospitals)
o Commuter Rail 582
New Transit Lines
• Rapid Route 630
Bike Projects
• Border Access Corridor
• SR 905 Corridor
Skyline-Paradise Hills
New Transit Lines
• Rapid 12
Southeastern San Diego
New Transit Stations and Mobility Hub
• Urban Core Mobility Hub*
• Southeast San Diego Mobility Hub*
• Tier 3 Transit Station (32nd/Commercial)
o Rapid 637
New Transit Lines
• Tram 555
• Rapid 12
Bike Projects
• Downtown San Diego to Encanto
Uptown
New Transit Stations and Mobility Hub
10Transit and Bike Projects Located in Disadvantaged Communities
Top 25% Top 51% (expanded communities)
• Urban Core Mobility Hub* • Tier 3 Transit Station (5th/Hawthorn)
o Rapid 120
o Tram 555
• Tier 3 Transit Station (5th/Brookes)
o Rapid 120
• Tier 1 Station (Hillcrest)
o Commuter Rail 581
o Commuter Rail 581b
New Transit Lines
• Rapid 10
• Rapid 630
Bike Projects
• City Heights – Old Town Corridor
• El Prado Cross Park
El Cajon
New Transit Stations and Mobility Hub
• El Cajon Mobility Hub • Tier 1 Transit Station (Downtown El Cajon)
• Tier 3 Transit Station (Marshall/Weld) o Commuter Rail 581
o Rapid 292 o Rapid 292
o Rapid 870
o Rapid 890
Bike Projects
• Santee – El Cajon Corridor
• East County Northern Loop
Escondido
New Transit Stations and Mobility Hub
• Escondido Mobility Hub
New Transit Lines
• Rapid 471
Bike Projects
• I-15 Bikeway – Citracado Parkway to Country Club Lane
Imperial Beach
New Transit Stations and Mobility Hub
• Imperial Beach Mobility Hub*
La Mesa
New Transit Stations and Mobility Hub
• La Mesa Mobility Hub
Bike Projects
• Hillcrest – El Cajon Corridor
Lakeside (SD County)
Bike Projects
11Transit and Bike Projects Located in Disadvantaged Communities
Top 25% Top 51% (expanded communities)
• I-8 Corridor – San Diego River Trail to Olde Highway 80
Lemon Grove
New Transit Stations and Mobility Hub
• Lemon Grove Mobility Hub
Bike Projects
• Centre City – La Mesa Corridor via Lemon Grove
• Centre City – La Mesa Corridor via Lincoln
Heights/Encanto/Lemon Grove
• Encanto, Lincoln Heights to Lemon Grove
National City
New Transit Stations and Mobility Hub
• National City Mobility Hub
• Tier 1 Transit Station (Plaza/Highland)
o Commuter Rail 582
o Commuter Rail 583
New Transit Lines
• Rapid 625
Bike Projects
• Encanto to Chula Vista National City Connections
Oceanside
New Transit Stations and Mobility Hub
• Oceanside Mobility Hub
New Transit Lines
• Rapid 473
• Rapid 474
• Rapid 477
Bike Projects
• Inland Rail Trail: Oceanside
• El Camino Real
San Marcos
New Transit Stations and Mobility Hub
• San Marcos Mobility Hub
New Transit Lines
• Rapid Route 440
• Rapid Route 450
• Local Bus Route 448 (between Palomar College and
CSU San Marcos with 3 new stops)
• Local Bus Route 449 (5 new stops)
12Transit and Bike Projects Located in Disadvantaged Communities
Top 25% Top 51% (expanded communities)
Bike Projects
• Carlsbad – San Marcos Corridor
• Encinitas to San Marcos Corridor – Double Peak Dr to
San Marcos Blvd
Camp Pendleton
New Transit Stations and Mobility Hub
• Tier 1 Transit Station (Camp Pendleton)
o Commuter Rail 398
Bike Projects
• Camp Pendleton Trail
* Indicates Mobility Hub overlaps more than one jurisdiction
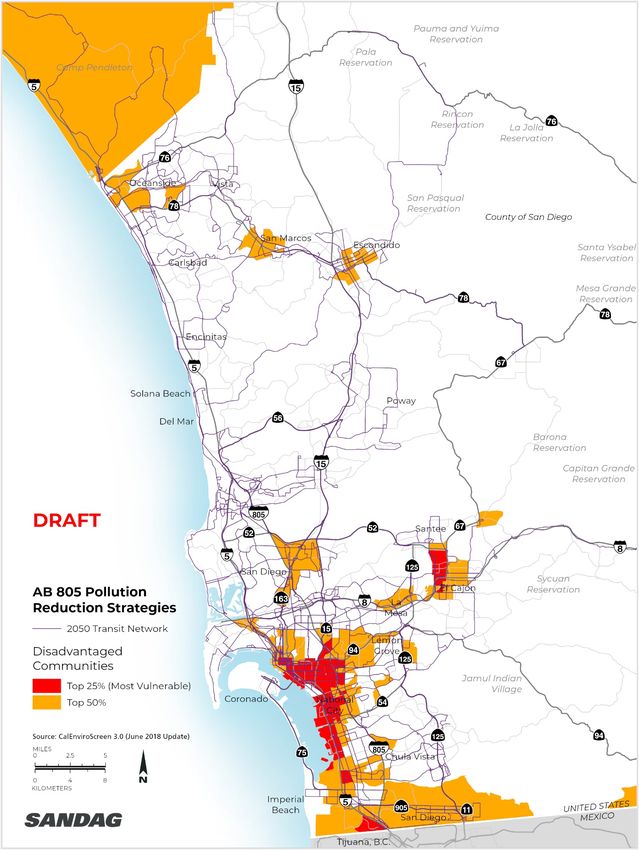
13Figure 2: Transit projects located in North County disadvantaged communities
Figure 3: Transit projects located in Central San Diego region disadvantaged communities
14Figure 4: Transit projects located in South San Diego region disadvantaged communities
At the center of this network are new commuter rail services that will provide faster, more frequent
services for longer regional trips, while faster and more frequent light rail, Rapid, and local bus routes
provide viable alternatives to driving for local trips. Commuter rail uses higher-speed trains (more than
100 miles per hour) in tunnels or on bridges with trains arriving every 8–10 minutes all day. More than
30 new Rapid bus routes operating at 10-minute frequency will serve disadvantaged communities in
addition to local bus routes running at the same frequency. Ultimately, these transit lines connect with
the 31 Mobility Hubs that serve as communities with a high concentration of people, destinations, and
travel choices spanning one, two, or a few miles based on the community characteristics and tailored
specifically to the needs of the community.
Mobility Hubs offer on-demand travel options and supporting infrastructure that enhance connections to
high-quality Transit Leap services while helping people make short trips around the community on
Flexible Fleets. SANDAG recognizes that new transit services and stations alone will not address the air
pollution burden disadvantaged communities face, but when coupled with electrification, they can help
reduce air pollution emission and exposure. This is why one key feature of the Mobility Hubs will be the
availability of electric shared vehicle fleets and charging stations.
In conjunction with the transportation network, projects within the Regional Bike Network will also
provide pollution reduction benefits for disadvantaged communities and the entire region. The 2021
Regional Plan provides almost 400 miles of bike facility upgrades and new construction to establish a
safe network, 1 making it easier to get around and providing a significant contribution to social equity
efforts along with the environmental benefits.
1
Center for Neighborhood Technology. (2021). Annual Auto Ownership Cost. Retrieved from Housing +
Transportation Affordability Index: htaindex.cnt.org/map/
15You can also read