Mineral formation induced by cable bacteria performing long-distance electron transport in marine sediments - Biogeosciences
←
→
Page content transcription
If your browser does not render page correctly, please read the page content below
Biogeosciences, 16, 811–829, 2019
https://doi.org/10.5194/bg-16-811-2019
© Author(s) 2019. This work is distributed under
the Creative Commons Attribution 4.0 License.

Mineral formation induced by cable bacteria performing
long-distance electron transport in marine sediments
Nicole M. J. Geerlings1 , Eva-Maria Zetsche2,3 , Silvia Hidalgo-Martinez4 , Jack J. Middelburg1 , and
Filip J. R. Meysman4,5
1 Department of Earth Sciences, Utrecht University, Princetonplein 8a, 3584 CB Utrecht, the Netherlands
2 Department of Marine Sciences, University of Gothenburg, Carl Skottsberg gata 22B, 41319 Gothenburg, Sweden
3 Department of Estuarine and Delta Systems, Royal Netherlands Institute for Sea Research, Utrecht University,

Korringaweg 7, 4401 NT Yerseke, the Netherlands
4 Department of Biology, Ecosystem Management Research Group, Universiteit Antwerpen, Universiteitsplein 1,

2160 Antwerp, Belgium
5 Department of Biotechnology, Delft University of Technology, Van der Maasweg 9, 2629 HZ Delft, the Netherlands

Correspondence: Nicole M. J. Geerlings (n.m.j.geerlings@uu.nl)

Received: 10 October 2018 – Discussion started: 22 October 2018
Revised: 10 January 2019 – Accepted: 26 January 2019 – Published: 13 February 2019

Abstract. Cable bacteria are multicellular, filamentous mi-        esize that the complete encrustation of filaments might create
croorganisms that are capable of transporting electrons over       a diffusion barrier and negatively impact the metabolism of
centimeter-scale distances. Although recently discovered,          the cable bacteria.
these bacteria appear to be widely present in the seafloor,
and when active they exert a strong imprint on the local
geochemistry. In particular, their electrogenic metabolism in-     1     Introduction
duces unusually strong pH excursions in aquatic sediments,
which induces considerable mineral dissolution, and subse-         1.1    Cable bacteria
quent mineral reprecipitation. However, at present, it is un-
known whether and how cable bacteria play an active or di-         In 2012, long, multicellular microorganisms were reported
rect role in the mineral reprecipitation process. To this end      from in marine sediments that are capable of generating and
we present an explorative study of the formation of sedi-          mediating electrical currents over centimeter-scale distances
mentary minerals in and near filamentous cable bacteria us-        (Pfeffer et al., 2012). These so-called “cable bacteria” have
ing a combined approach of electron microscopy and spec-           evolved a unique energy metabolism, in which electrons are
troscopic techniques. Our observations reveal the formation        passed on from cell to cell, thus establishing an electrical cur-
of polyphosphate granules within the cells and two different       rent from one end to the other of their centimeter-long fila-
types of biomineral formation directly associated with mul-        mentous bodies. This biological innovation equips cable bac-
ticellular filaments of these cable bacteria: (i) the attachment   teria with a competitive advantage for survival within the re-
and incorporation of clay particles in a coating surround-         dox gradients that exist within the seafloor (Meysman, 2017).
ing the bacteria and (ii) encrustation of the cell envelope by     The electrical connection allows electron donors and elec-
iron minerals. These findings suggest a complex interaction        tron acceptors to be harvested in widely separated locations
between cable bacteria and the surrounding sediment ma-            (Nielsen et al., 2010), and in this way the energy yield from
trix, and a substantial imprint of the electrogenic metabolism     natural redox gradients can be favorably optimized.
on mineral diagenesis and sedimentary biogeochemical cy-              The currently known cable bacteria strains belong to two
cling. In particular, the encrustation process leaves many         candidate genera within the Desulfobulbaceae family of
open questions for further research. For example, we hypoth-       Deltaproteobacteria: the marine “Candidatus Electrothrix”
                                                                   and the freshwater “Candidatus Electronema” (Trojan et

Published by Copernicus Publications on behalf of the European Geosciences Union.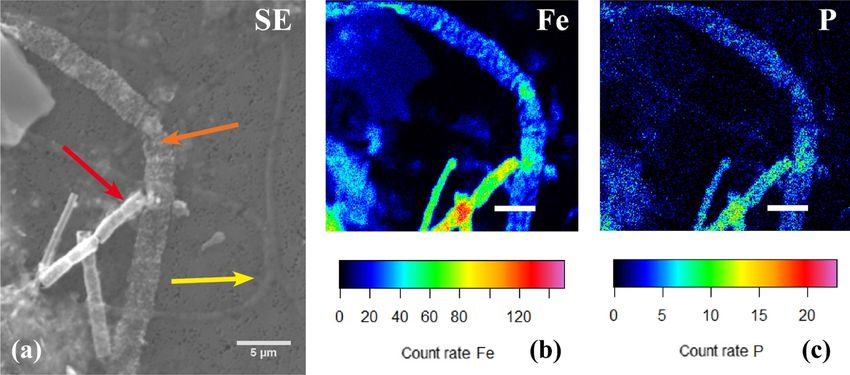
812                                                       N. M. J. Geerlings et al.: Mineral formation induced by cable bacteria

Figure 1. Microbially and chemically mediated reactions involved in the iron, sulfur and calcium cycle in electrogenic sediments. The
electrogenic sulfur oxidation executed by cable bacteria spatially separates the redox half-reactions; the oxidation of sulfide takes place in
the suboxic zone and generates electrons (e− ). These electrons are then transported through the cable bacteria and used via oxygen reduction.
The sulfide oxidation reaction results in proton release and a decrease in pH while the oxygen reduction requires protons, which increases
the pH of the porewater in the oxic zone. The decreased pH in the suboxic zone promotes dissolution of iron monosulfides (FeS) and calcium
carbonates (CaCO3 ). The hydrogen sulfide (H2 S) produced by iron monosulfide dissolution is used by the cable bacteria. The Fe2+ diffuses
both upward and downward. When Fe2+ encounters hydrogen sulfide in the sulfidic zone it precipitates again as iron(II) sulfide. In the oxic
zone, Fe2+ is reoxidized to Fe3+ , which will then precipitate as amorphous iron oxide. The calcium ions released by carbonate dissolution
diffuse upward and precipitate again as carbonates in the oxic zone where the pH is higher.

al., 2016). Cable bacteria perform electrogenic sulfur oxi-              imprint suggests that they could be important in the cycling
dation (e-SOx) via long-distance electron transport (LDET).              of carbon, sulfur, iron and other elements in various natural
Thereby, they engender an electrical coupling of the oxida-              environments (Nielsen and Risgaard-Petersen, 2015).
tion of sulfide within deeper sediments with the reduction
of oxygen near the sediment surface (Fig. 1). The anodic                 1.2    Acidification and mineral cycling
half-reaction in the anoxic zone (half-reaction: 1/2H2 S +
2H2 O → 1/2SO2−            −      +
                  4 +4e +5H ) generates electrons, which                 A remarkable aspect of the metabolism of cable bacteria is
are then transported along the longitudinal axis of the fila-
                                                                         that they induce unusually strong pH excursions in aquatic
ment to cells located in the oxic zone (Pfeffer et al., 2012). In
                                                                         sediments (Nielsen et al., 2010; Meysman et al., 2015). These
this thin oxic zone, cathodic cells consume the electrons via
                                                                         large pH excursions are a direct consequence of the spatial
oxygen reduction (half-reaction: O2 +4H+ +4e− → 2H2 O).
                                                                         segregation of redox half-reactions made possible by LDET
Field investigations have shown that this separation of redox
                                                                         (Fig. 1). Considerable amounts of protons are released by
half-reactions can span a distance up to 7 cm (van de Velde et
                                                                         anodic sulfur oxidation in deeper sediment horizons, thus
al., 2016), thus illustrating the wide spatial scale over which
                                                                         strongly acidifying the porewater (down to pH 6 and below).
LDET can be active.
                                                                         Conversely, large quantities of protons are consumed by ca-
   LDET has recently been documented to be active in a
                                                                         thodic oxygen consumption, leading to a characteristic pH
wide range of marine environments (Malkin et al., 2014; Bur-
                                                                         maximum in the oxic zone (with pH values up to 9). Due to
dorf et al., 2017), including salt marshes, mangroves, sea-
                                                                         these pH excursions in the porewater, the solid-phase chem-
grasses and seasonally hypoxic basins, as well as in fresh-
                                                                         istry is also affected by the metabolic activity of the cable
water streambeds (Risgaard-Petersen et al., 2015) and pos-
                                                                         bacteria.
sibly in aquifer sediments (Müller et al., 2016). LDET has
                                                                            The acidification of the suboxic zone results in the dissolu-
furthermore proven to exert a dominant influence on bio-
                                                                         tion of iron(II) sulfide (FeS) and calcium carbonate (CaCO3 ),
geochemical transformation and fluxes in the seafloor. This
                                                                         which causes accumulation of ferrous iron (Fe2+ ), calcium
impact can even extend beyond the sediment and can con-
                                                                         (Ca2+ ) and manganese (Mn2+ ) in the porewater (Risgaard-
trol the overall cycling of iron, sulfur and phosphorus within
                                                                         Petersen et al., 2012; Rao et al., 2016; Sulu-Gambari et al.,
the sediment and water column of coastal systems (Seitaj et
                                                                         2016; van de Velde et al., 2016). Upon release, these cations
al., 2015; Sulu-Gambari et al., 2016). The widespread oc-
                                                                         diffuse both upward and downward in the sediment column
currence of cable bacteria and their strong local geochemical
                                                                         (Fig. 1). The downward diffusion of Fe2+ results in the pre-

Biogeosciences, 16, 811–829, 2019                                                                www.biogeosciences.net/16/811/2019/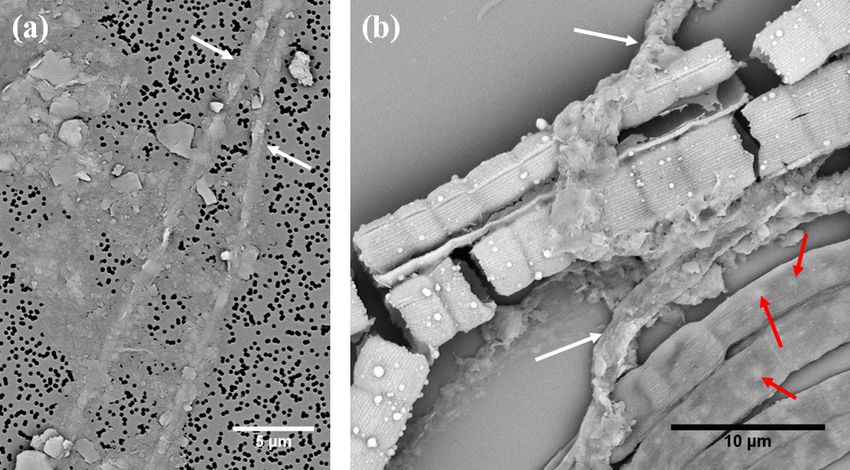
N. M. J. Geerlings et al.: Mineral formation induced by cable bacteria                                                          813

cipitation of FeS once the ferrous iron encounters the sul-         able. Minerals formed by BCM show a high degree of crys-
fide appearance depth. The upward diffusion of Fe2+ results         tallinity and have a specific crystal morphology (Konhauser
in the formation of iron (hydr)oxides (FeOOH) once Fe2+             and Riding, 2012).
reaches the oxic zone (Risgaard-Petersen et al., 2012; Rao et          Understanding bacterially mediated mineralization is cru-
al., 2016). In a similar manner, Ca2+ can diffuse upwards and       cial to understanding the complex interactions of biolog-
downwards into sediment layers with a higher pH (and car-           ical, chemical and physical processes (Konhauser, 1998a;
bonate ion concentrations) and reprecipitate as CaCO3 , likely      Gonzalez-Munoz et al., 2010) since it affects the geochem-
in the form of high-magnesium calcite (Risgaard-Petersen et         ical cycling of mineral-forming elements (e.g., C, Fe, S,
al., 2012). This sometimes gives rise to a hard CaCO3 -rich         Ca and O) from a short-term timescale up to geological
crust that rests on top of the sediment (Risgaard-Petersen et       timescales (Konhauser and Riding, 2012). Moreover, little is
al., 2012; Rao et al., 2016).                                       known about how the cable bacteria themselves are affected
   Clearly, the presence and activity of cable bacteria has a       by the biogeochemistry of their surroundings and how they
large impact on the mineralogy of aquatic sediments and re-         maintain their population in an environment that is rapidly
sults in the de novo formation of solid phases in the sur-          changing as a result of their own metabolic activity. Here,
face layer, like FeOOH, FeS and CaCO3 . Mineral forma-              we present and discuss the results of an explorative study
tion can occur over a relative short time span. For example,        on cable bacteria using a combined approach of electron mi-
Seitaj et al. (2015) showed that over the course of a few           croscopy and spectroscopic techniques to characterize the
weeks to months about 1 mol of FeS per m2 is converted              different cell–mineral interactions.
to FeOOH under the influence of cable bacteria. The exact
mineralogy of these newly reprecipitated iron and carbonate
phases is presently not known. It is also unknown to which          2     Methods
degree the cable bacteria are responsible for the precipitation
of these newly formed minerals. The processes in which mi-          2.1    Sediment collection and incubation
crobes mediate mineral precipitation can be grouped into two
modes: (1) biologically induced mineralization (BIM) and            Enrichment cultures were initiated in which natural marine
(2) biologically controlled mineralization (BCM) (Lowen-            sediments where homogenized and incubated in the labo-
stam and Weiner, 1989). Minerals that form by BIM gen-              ratory under conditions that stimulate the growth of cable
erally nucleate and grow extracellularly as a result of the         bacteria (pure cultures of cable bacteria are not yet avail-
metabolic activity of the organism and subsequent chem-             able). To this end, sediment was collected at four differ-
ical reactions involving metabolic by-products. BIM is an           ent locations, three of which are located in the Netherlands,
uncontrolled consequence of metabolic activity. The formed          and are referred to as Rattekaai salt marsh (RSM), Mok-
minerals are generally characterized by poor crystallinity,         baai (MB) and marine Lake Grevelingen (MLG), while the
broad particle-size distributions and lack of specific crys-        fourth site is located in the Black Sea (BS). The RSM site
tal morphology (Lowenstam and Weiner, 1989; Frankel and             (51.4391◦ N, 4.1697◦ E) is located within the creek bed of
Bazylinsky, 2003). Both abiotic precipitation and BIM may           an intertidal salt marsh within the Eastern Scheldt tidal inlet.
result in minerals that are chemically and morphologically          The MB site (53.00◦ N, 4.7667◦ E) is located at an intertidal
similar, though in other cases there may be morphological           flat near the island of Texel (Wadden Sea). Samples from
differences. This is because the bacterial surface provides nu-     MLG (51.4624◦ N, 3.5616◦ E) were taken at a depth of 34 m.
cleation templates for mineral precipitation, which act as a        MLG is a seasonal hypoxic marine lake in the Dutch delta
template for growth and organization of the precipitated par-       area which experiences bottom water hypoxia and anoxia
ticles, thus leading to specific mineral textures (Mirvaux et       in the summer in its deep basins. The BS sediment sam-
al., 2016), or bacteria may initiate mineral precipitation un-      ples were taken at a water depth of 27 m on the continental
der conditions where abiotic precipitation is kinetically hin-      shelf of the Black Sea (44.5917◦ N; 29.1897◦ E). Sediments
dered, which may also steer mineral morphology. BIM is              from RSM, MB and MLG were used because abundant cable
particularly significant for bacteria that respire sulfate and/or   bacteria populations have been previously documented under
metal (hydr)oxides where the metabolic products are reduced         field conditions at the sites and cable bacteria enrichments
metal ions and sulfide, which are reactive and participate          were successfully obtained in previous experiments (Malkin
in subsequent mineral formation (Lowenstam and Weiner,              et al., 2014; Burdorf et al., 2017). Surface sediments from
1989; Frankel and Bazylinski, 2003). BCM is a much more             RSM and MB were collected during low tide by collecting
tightly regulated mineral formation process and the precipi-        the first 5 cm of sediment with a shovel. For the collection of
tated minerals have a physiological and structural role. The        MLG and BS sediments, a gravity corer was used on board
precipitation is regulated by the microbes in such a way that       the ship. In all cases, the thin upper layer of oxidized sed-
appropriate mineral saturation states are achieved and min-         iment was discarded and the reduced sulfidic sediment was
erals can be formed within the organism even when condi-            homogenized and sieved to remove fauna (0.5 mm mesh size
tions in the bulk solution are thermodynamically unfavor-           for RSM, MB and MLG, 4 mm mesh size for BS) before

www.biogeosciences.net/16/811/2019/                                                           Biogeosciences, 16, 811–829, 2019
814                                                   N. M. J. Geerlings et al.: Mineral formation induced by cable bacteria

being repacked in plastic cores as described in Burdorf et         2.3     Microscopy and spectroscopy
al. (2017). Sediment cores were incubated in a temperature-
controlled room (RSM and BS at 20 ◦ C; MB and MLG at               Different microscopy and spectroscopy techniques were used
15 ◦ C) in the dark, submerged in artificial seawater at in situ   to obtain structural as well as compositional information on
salinity (RSM and MB 35; MLG 32; BS 17.9) and constantly           the minerals that were formed. An overview of the imaging
aerated through air bubbling.                                      modes used for the different samples is provided in Table S1.

                                                                   2.3.1    Epifluorescence microscopy
2.2   Filament extraction procedure
                                                                   Epifluorescence microscopy provides information on the
                                                                   location and size of intracellular granules. Filaments ex-
Individual cable bacterium filaments were retrieved from the
                                                                   tracted from the sediment were stained with the general DNA
incubated sediment enrichments for subsequent microscopy
                                                                   stain 40 ,6-diamidino-2-phenylindole (DAPI) and were im-
inspection. A number of different filament extraction proto-
                                                                   aged using a Zeiss Axiovert 200M epifluorescence micro-
cols (FEPs) were used depending on the sediment and type
                                                                   scope (Carl Zeiss, Göttingen, Germany) equipped with the
of microscopy that was implemented. An overview of which
                                                                   Zeiss filter set 02 (excitation G365, BS395; emission LP420).
preparation method was used for which sample is given in
                                                                   An excitation wavelength of 358 nm was used and emission
Table S1 in the Supplement.
                                                                   was detected at 463 nm.
   FEP1. Filaments were picked from the incubated sedi-
ment cores under a stereomicroscope using custom-made
                                                                   2.3.2    Digital holographic microscopy (DHM)
fine glass hooks. Retrieved filaments or clumps of filaments
were subjected to sequential washes by transferring them be-       Digital holographic microscopy is a technique which not
tween separate droplet solutions on a microscope slide as de-      only allows the light intensity information of the investigated
scribed in Vasquez-Cardenas et al. (2015). Filaments were          object, but also the so-called phase information, to be cap-
first washed three times in artificial seawater to remove sedi-    tured in a quantitative way (Dubois et al., 2004). This al-
ment particles; this was followed by several washes (> 3) in       lows for the imaging of transparent substances such as mu-
Milli-Q (Millipore, the Netherlands). Milli-Q washes were          coids, biofilms and other types of extracellular polymeric
implemented to prevent precipitation of salt crystals during       substances (EPS) that are typically not visible in the light
sample drying. Isolated filaments were subsequently pipetted       intensity image (Zetsche et al., 2016a, b) or with SEM imag-
onto polycarbonate filters (pore size 0.2 µm, Isopore, Milli-      ing.
pore, the Netherlands) that were mounted on aluminum scan-            Specimens for DHM were obtained by inserting glass
ning electron microscopy (SEM) stubs (1 cm diameter) fitted        slides into an enrichment culture from MLG and leaving the
with conductive carbon tape and allowed to air-dry in a des-       glass slide in the sediment for a period of days. Afterwards
iccator. After drying, samples were coated with a ∼ 15 nm          the slide was retrieved and washed with Milli-Q. Some fil-
gold layer for SEM analysis or coated with a ∼ 5 nm carbon         aments remained attached to the slide. Holograms of cable
layer for electron probe microanalysis (EPMA).                     bacteria were captured with an oLine D3 HM digital holo-
   FEP2. A small amount of sediment was taken from the             graphic microscope (Ovizio Imaging Systems NV/SA, Bel-
oxic top layer of the sediment core and transferred to a 15 mL     gium) and subsequently the respective light intensity and
Greiner tube which was then filled up to a volume of 10 mL         phase images were derived as explained in more detail in
with Milli-Q water. The Greiner tubes were centrifuged at          Zetsche et al. (2016a).
2100 g for 2 min. This washing step was repeated three times.
Samples were then transferred onto an SEM stub. This sedi-         2.3.3    Scanning electron microscopy (SEM) coupled to
ment was air-dried overnight before gold coating.                           electron dispersive X-ray spectroscopy (EDS)
   FEP3. Sediment containing cable bacteria was retrieved
from the oxic top layer with a scalpel and directly transferred    SEM imaging was used to obtain high-resolution images of
onto an SEM stub. This sediment was air-dried overnight be-        the cable bacterium filaments and their associated miner-
fore gold coating.                                                 alogical structures. SEM imaging was combined with EDS
   FEP4. Individual filaments were hand-picked from the            to obtain the elemental composition of the cable bacteria
sediment with custom-made glass hooks as in FEP1 and               and of the related mineral structures at specific locations
then washed three times with artificial seawater followed by       (called “spots”). EDS analysis was also used to determine
several (> 3 washes) in Milli-Q. To enable long-term stor-         which elements should be further analyzed by X-ray element
age, these samples were subsequently transferred to a 50 %         mapping. SEM-EDS analysis was performed on a Phenom
ethanol solution and stored in the freezer at −20 ◦ C. Upon        ProX desktop SEM (Phenom-World B.V., the Netherlands).
analysis, they were defrosted and pipetted onto a SEM stub         SEM images were obtained under a 0.1–0.3 mbar vacuum
with conductive carbon tape and air-dried before gold coat-        and a high accelerating voltage (10 or 15 kV). Because of
ing.                                                               the small size of the cable bacteria, the interaction volume of

Biogeosciences, 16, 811–829, 2019                                                        www.biogeosciences.net/16/811/2019/
N. M. J. Geerlings et al.: Mineral formation induced by cable bacteria                                                        815

the EDS analysis was assessed by Monte Carlo simulations          40 min at RT. This was immediately followed by a second
with Casino 2.48 software (Drouin et al., 2007) to check if       incubation in OsO4 (1 % OsO4 in double-distilled (dd)H2 O)
the measured X-rays are representative of the chosen spot.        for 40 min at RT. After washing in ddH2 O for 5×3 min, sam-
                                                                  ples were incubated overnight at 4 ◦ C in 1 % uranyl acetate
2.3.4   Electron probe microanalysis (EPMA)                       (UA, EMS). The next day, UA was removed by washing five
                                                                  times in ddH2 O for 3 min. After the final washing steps, the
EPMA imaging was combined with X-ray element map-                 samples were dehydrated using ice-cold solutions of increas-
ping using wavelength dispersive X-ray spectroscopy (WDS)         ing EtOH concentration (30 %, 50 %, 70 %, 90 %, 2×100 %)
as well as EDS. EPMA coupled to WDS provides a much               for 3 min each. Subsequent infiltration with resin (Durcupan,
higher spectral (2–15 eV) resolution than EDS, which has          EMS) was done by first incubating 50 % resin in EtOH for
a spectral resolution between 70 and 180 eV. Therefore,           2 h, followed by at least three changes of fresh 100 % resin
WDS X-ray mapping allows for more accurate element maps           (including one overnight incubation). Next, samples were
(Goldstein et al., 2003). The main advantage of EDS map-          embedded in fresh resin and cured in the oven at 65 ◦ C for
ping is the capacity to collect data in parallel for the entire   72 h. Before FIB-SEM imaging, ACLAR was removed from
range of photon energies excited by the primary beam. This        the polymerized resin, leaving the filaments embedded di-
allows all elements to be mapped in a single scan. In con-        rectly at the surface, the resin block was mounted on alu-
trast, WDS is restricted to a more narrow energy window           minum SEM stubs and samples were coated with ∼ 6 nm of
and therefore only one element can be mapped in a single          platinum (Quorum Q150T ES). FIB-SEM imaging was per-
scan (Goldstein et al., 2003).                                    formed using a Zeiss Auriga Crossbeam system. The focused
   EPMA imaging and the associated X-ray element mapping          ion beam (FIB) was set to remove 10 nm sections by pro-
(WDS and EDS) were performed on a JXA-8530F Hyper-                pelling gallium ions at the surface. In between the milling of
probe Field Emission Electron probe microanalyzer outfitted       the sections, samples were imaged at 1.5 kV using an ESB
with five automated wavelength dispersive X-ray spectrome-        (energy selective backscatter) detector.
ters (JEOL, Japan). This electron microprobe was equipped
with five WDS units that allowed for the simultaneous col-
lection of five element maps during a single run. EPMA anal-      3     Results
ysis and element mapping was performed under high vacuum
(10−5 –10−6 mbar), high voltage (15 kV) and a probe current       A wide number of samples (> 50 samples, > 500 images)
of 10 nA. X-ray element maps of phosphorus, calcium, mag-         from enrichment cultures with cable bacteria activity were
nesium, iron and sulfur were obtained using WDS. X-ray el-        microscopically screened for minerals that were directly as-
ement maps of silicon and aluminum were collected using           sociated with the cable bacterium filaments; i.e., they oc-
EDS. Pixel sizes were 0.30 µm and dwell times at each pixel       curred inside or on the outer surface of the filaments. SEM
were 50 or 240 ms. Longer dwell times resulted in beam-           imaging revealed the intracellular formation of polyphos-
damaged sample erosion. SEM images prepared from the              phate granules and two types of mineral transformation
backscattered electron signal in the JEOL electron probe mi-      closely associated with cable bacteria (Fig. 2): (1) the coat-
croanalyzer were collected under high vacuum and high ac-         ing of filaments with existing mineral particles, in particular
celerating voltage (15 kV).                                       of clay particles, and (2) the encrustation of the cable bacteria
                                                                  filaments with newly deposited minerals, which is observed
2.3.5   Focused ion beam scanning electron microscopy             as an electron dense layer surrounding the surface of the fil-
        (FIB-SEM)                                                 aments.
                                                                     In several samples from MB and RSM, cable bacteria
Specimens for FIB-SEM were obtained by inserting ACLAR            without of any form of precipitation, as well as cable bacte-
7.8 Mil slides (Electron Microscopy Services) into an en-         ria with polyphosphate (poly-P) granules, coating or encrus-
richment culture and leaving the ACLAR in the sediment            tation, were all present in the same sample, thus suggesting
for a period of days. Afterwards the ACLAR slide was re-          heterogeneous precipitation patterns (Figs. 5b and 10).
trieved and washed with Milli-Q. Some filaments retained
were firmly attached (cemented) to the ACLAR slide. These         3.1    Intracellular polyphosphate granules
ACLAR slides with filaments were incubated in freshly pre-
pared fixative (2 % paraformaldehyde (PFA, Applichem),            Naked filaments are defined as filaments with no visible ex-
2.5 % glutaraldehyde (GA, EMS) in 0.15 M sodium cacody-           tracellular attachment of mineral particles and no visible en-
late (Sigma-Aldrich) buffer, pH 7.4) at room temperature          crustation. These naked filaments comprised the majority of
(RT) for 30 min. Fixative was removed by washing five times       filaments encountered in the sediment samples and were fre-
for 3 min in 0.15 M cacodylate buffer and samples were incu-      quently observed to contain circular to ellipsoidal granules
bated in 1 % osmium (OsO4 , EMS) and 1.5 % potassium fer-         when imaged with SEM or when using fluorescence mi-
rocyanide (Sigma-Aldrich) in 0.15 M cacodylate buffer for         croscopy with DAPI staining. Note that coated or encrusted

www.biogeosciences.net/16/811/2019/                                                         Biogeosciences, 16, 811–829, 2019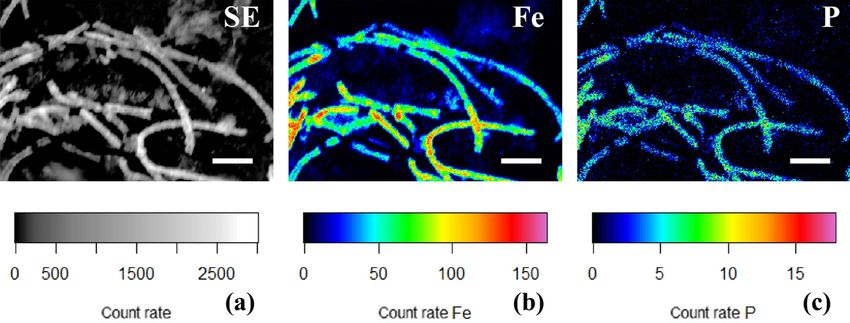
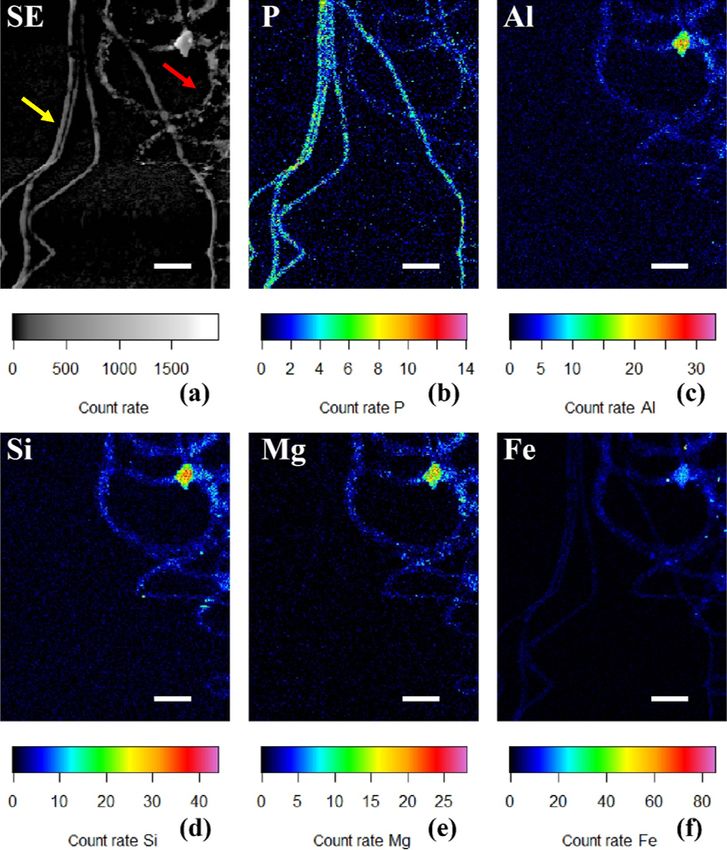
816                                                       N. M. J. Geerlings et al.: Mineral formation induced by cable bacteria

Figure 2. SEM images of air-dried cable bacteria and the corresponding conceptual representation exemplifying the different types of
mineralization observed in cable bacteria: (a) cable bacterium filament from the oxic zone of sediment from Rattekaai salt marsh containing
polyphosphate granules, (b) cable bacterium filament from the oxic zone of Mokbaai sediment with clay particles attached to it, (c) completely
encrusted cable bacterium filament from the oxic zone of Mokbaai sediment that has been broken off at a cell junction. Scale bars represent
5 µm (a, b) and 2 µm (c). (d) The poly-P granules are found within the cells. (e) Clay particles are attached to the cable bacteria, most
likely due to the presence of extracellular polymeric substances (EPS). (f) Cell encrustation happens along the length of the cable bacterium
filament thereby preserving the fiber structure.

filaments may also contain these granules, but this could not            cell. There was also variation in poly-P patterns between
be verified, as the presence of the intracellular granules is            cells of the same filament though typically the granule pat-
obscured by the surrounding sheath or encrustation. DAPI                 tern remained similar between neighboring cells of the same
showed the granules as bright blue spots in the cells of naked           filament (Fig. 3c).
filaments (Fig. 3a), thus suggesting they are poly-P inclu-                 SEM-EDS spot analysis on the inclusions indicated large
sions. DAPI is a fluorescent dye usually used for DNA stain-             peaks of phosphorus (P) and oxygen (O) in the resultant spec-
ing, but when DAPI is used at a high concentration it also               trum, accompanied by smaller but prominent peaks of cal-
stains polyphosphate granules (Streichan et al., 1990).                  cium (Ca), magnesium (Mg) and also sulfur (S) (Fig. 3d).
   SEM imaging provided higher-resolution images, which                  Qualitative chemical analysis using EPMA-WDS confirmed
depicted the granules as electron-dense, bright, white spots             that the poly-P granules within non-encrusted filaments con-
(Fig. 3b–c). There was considerable variation in the size                tained P, Ca and Mg, and that P was correlated with both Ca
and amount of granules present between filaments; some                   and Mg (Fig. 4). The spatial co-localization of P with Ca,
filaments contained no granules, others contained a single               Mg, S and Fe was evaluated using Pearson’s correlation co-
granule or a few large ones, while still other filaments con-            efficient for two different WDS X-ray element maps of naked
tained multiple smaller granules dispersed throughout the                filaments (Figs. 4 and S1 in the Supplement). The respective

Biogeosciences, 16, 811–829, 2019                                                                www.biogeosciences.net/16/811/2019/
N. M. J. Geerlings et al.: Mineral formation induced by cable bacteria 817
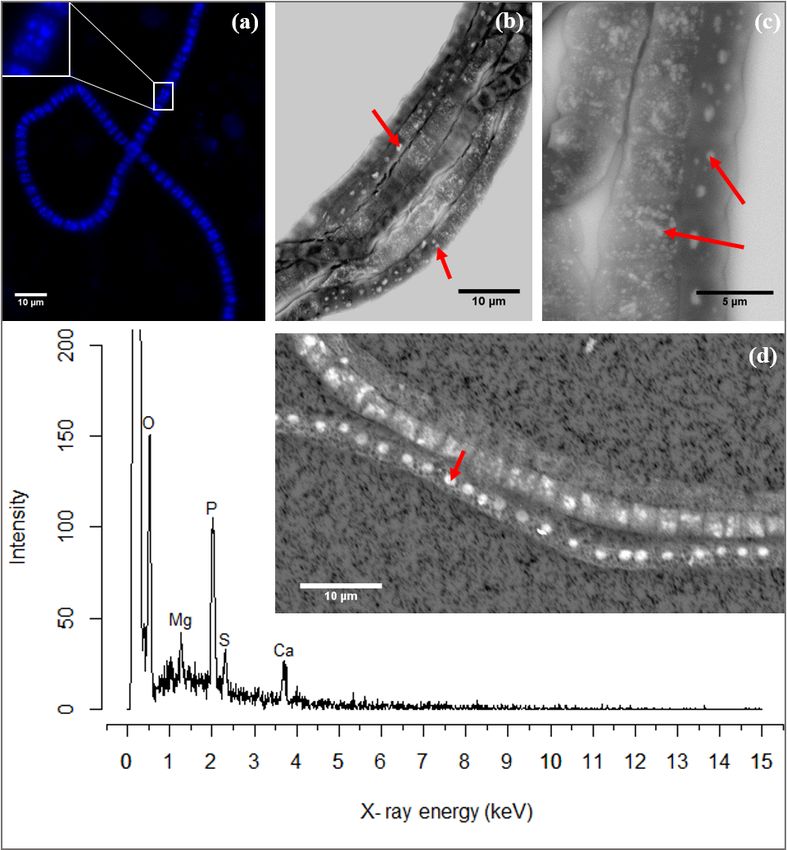
Figure 3. (a) Fluorescence image of a cable bacterium filament stained with DAPI. The bright blue dots in the cytoplasm are poly-P
granules. The inset shows a close-up of a single cell where the poly-P granules are distinguishably visible. (b) Scanning electron microscope
(SEM) image of a bundle of cable bacteria filaments showing variability in patterns of poly-P granules in filaments extracted from the same
environment. The poly-P granules are the bright white spots indicated by the arrows. (c) SEM image of three adjoint cable bacteria filaments
showing different sizes and patterns of poly-P granules. Inclusions in panels (b) and (c) are marked with a red arrow. (d) A representative
example of an EDS spot analysis of a poly-P granule, where the resultant spectrum shows a high abundance of the elements O, Mg, P, Ca and
S. The point of the red arrow on the SEM image indicates the location of the spot analysis. Scale bars represent 10 µm (a, b, d) and 5 µm (c).
All filaments were extracted from the suboxic zone of sediment incubations from Rattekaai salt marsh.
correlation coefficients varied from 0.76 to 0.94 for Ca, be- 3.2 External coating of filament
tween 0.64 and 0.83 for Mg, 0.55 and 0.59 for S, and 0.12 and
0.2 for Fe. Accordingly, there is a significantly high correla- Sporadically, SEM imaging revealed that parts of a cable
tion between P and Ca and between P and Mg, and a moder- bacterium filament were covered by a heterogeneous coat-
ate correlation between P and S throughout the filament. The ing of mineral particles that appeared to be attached to the
low correlation between P and Fe suggests that the observed surface of the filaments (Figs. 2b, 5). The shape and size of
correlations between P and Ca and P and Mg are not because the incorporated minerals varied, which provides the coat-
of a confounding factor (e.g., dilution by a common element ing with a rough and rugged texture. DHM imaging showed
or the structure of the cell) because then there would be a the presence of living cable bacteria coated with these parti-
higher correlation between the P and Fe as well. cles (Fig. 7a–b), as well as a remaining sheath of extracellu-
lar polymeric substances (EPS) (Fig. 7c). Filaments covered
with a particle coating were generally extracted together with
naked filaments that had poly-P granules from the same sed-
iment batch (Fig. 6a). WDS and EDS element mapping re-
www.biogeosciences.net/16/811/2019/ Biogeosciences, 16, 811–829, 2019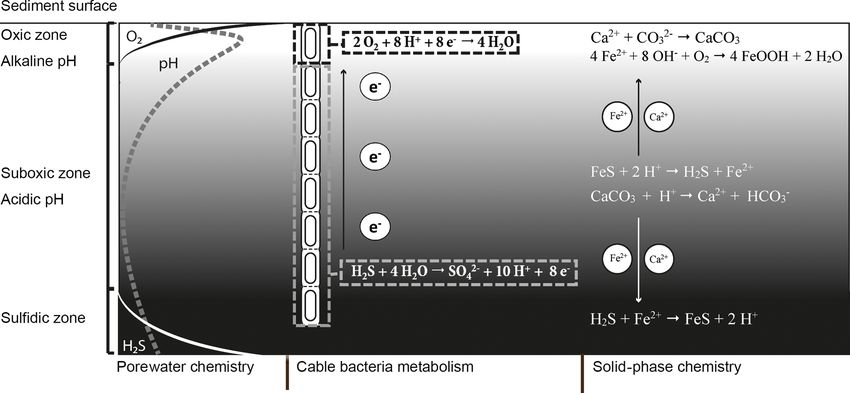
818                                                     N. M. J. Geerlings et al.: Mineral formation induced by cable bacteria

Figure 4. False-colored WDS element maps of (a) secondary electrons, (b) phosphorus, (c) calcium, (d) magnesium, (e) sulfur and (f) iron.
Scale bars represent 10 µm. To assess the correlation between the elements, scatterplots of (g) P and Ca, (h) P and Mg, (i) P and S and
(j) P and Fe are shown. All scatterplots were produced from a pixel-by-pixel analysis from the WDS X-ray element maps collected with the
EPMA. The Pearson’s correlation coefficient (R) values are depicted on top of the scatterplots. Filaments were extracted from the suboxic
zone of sediment incubations from Rattekaai salt marsh.

vealed that the attached mineral particles predominantly con-          3.3   Filament encrustation
sisted of Si, Al, Mg and Fe (Fig. 6c–f), and therefore they
are most likely ambient clay-like particles. Coated filaments          Filament encrustation involved the deposition of a solid min-
showed a clearly different signature in the WDS and EDS el-            eral phase along the external surface of cable bacterium fila-
ement mapping compared to naked filaments. The latter were             ments, and this solid mineral crust was tens or even hundreds
clearly identifiable in the P map (Fig. 6b) but did not show           of nanometers thick (Fig. 8). Filament encrustation was ob-
any signature for Si, Al, Mg and Fe (Fig. 6c–f). Both coated           served quite regularly in sediment samples, but, importantly,
filaments and naked filaments contain P throughout the fila-           it was only present in filaments that were retrieved from the
ment, although the presence of P was less prominent in the             oxic zone of the sediment enrichments.
coated filaments (Fig. 6b), suggesting a higher concentration             Encrusted filaments showed a distinct morphology when
of P in naked filaments and an inverse relationship between            compared to the naked or coated filaments. Based on the
external clay coating and poly-P formation. However, most              morphology, different degrees of encrustation were distin-
of the X-ray counts measured came from the sample surface              guished. If a filament was weakly encrusted it closely fol-
and therefore WDS element maps reflect the composition of              lowed the topography of the outer cell surface of the cable
cable bacteria living in the oxic zone of surface sediments.           bacterium filaments, as if a homogeneous layer of mineral
Since the surface of the coated filaments contains minerals,           had precipitated on the outer surface (Fig. 8). Cable bac-
the P content of the filaments from different fields of view           teria have a characteristic outer surface morphology, which
cannot be compared using WDS element maps.                             consists of a pattern of parallel ridges that run all along the
                                                                       length of a filament (Pfeffer et al., 2012). This longitudinal
                                                                       ridge pattern was often still clearly visible in the encrusted
                                                                       filaments, even if filaments showed a high degree of encrus-
                                                                       tation (Fig. 8a–f). Filaments that were broken at cell junc-

Biogeosciences, 16, 811–829, 2019                                                             www.biogeosciences.net/16/811/2019/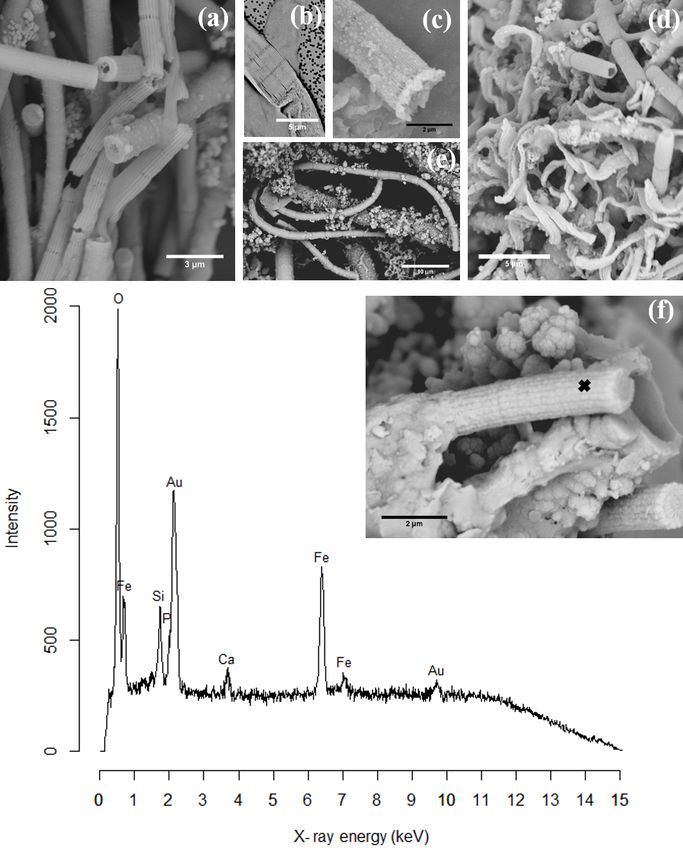
N. M. J. Geerlings et al.: Mineral formation induced by cable bacteria                                                                819

Figure 5. (a) SEM micrograph of two cable bacteria (white arrows) that have clay particles attached to their surface. (b) SEM micrograph
showing that three types of mineralization patterns occur within the same environment: cable bacteria that are not encrusted and contain
poly-P inclusions (lower right of image, several inclusions are marked with a red arrow), cable bacteria that show extracellular attachment
of clay particles (white arrows) and two encrusted cable bacteria that have broken up during the SEM imaging process. Scale bars represent
5 µm (a) and 10 µm (b). Filaments were extracted from the oxic zone of Mokbaai sediment.

tions provided a cross-sectional view of the encrustation, and          ple, and hence this confirms that cable bacteria within the
this allowed for the estimation of the thickness of the en-             same environment are highly variable with respect to their
crusted layer, which may reach up to 430 nm (Fig. 8a). In               number of ridges (Cornelissen et al., 2018). We estimated
filaments that were only lightly encrusted, the individual en-          that on average 180 nm of mineral was deposited on top of
crusted ridges were separately visible (Fig. 8b) and the cell           the weakly encrusted filaments. In contrast, the crust of the
junction was clearly identifiable as a ring containing apparent         strongly encrusted filaments was much thicker and amounted
voids in encrustation (Fig. 8a–b). The presence of these voids          to 500 nm. These latter filaments were so highly encrusted
at the cell junctions fully aligns with the model for the inter-        that crusts from different filaments were cemented together
nal structure of the cable bacteria (Cornelissen et al., 2018;          by the mineral precipitation and the thickness along a fila-
Pfeffer et al., 2012). This model proposes that the outer cell          ment was more heterogeneous when compared to the weakly
membrane shows invaginations around fibers that run from                encrusted filament (Video S2).
cell to cell, thus creating a ring of regularly spaced voids               EDS spot analysis (Fig. 8f) and WDS analysis (Figs. 10
at the cell junctions. When the encrustation becomes thicker            and 11) revealed that the encrustations were mainly com-
(Fig. 8c–f), the ridge pattern and the voids at the cell junc-          posed of O, Fe and P. Minor amounts of Ca and Si were
tions become less apparent as these features are gradually              sometimes also observed, but these did not consistently show
obscured by the deposition of new layers of mineral.                    up among samples, indicating that the Ca and Si content of
   FIB-SEM analysis was done on filaments that were weakly              the crusts was variable. This EDS spot analysis was repeated
encrusted (Video S1, see Sect. “Video supplements”) as well             on multiple filaments (∼ 50) of different samples and consis-
as on filaments that were strongly encrusted (Video S2). The            tently showed the same elemental composition (presence of
mineral that formed the crust was strongly stained with the             O, Fe, P and sometimes Si, Ca and S) in the mineral encrus-
uranyl acetate and/or osmium tetroxide stains that were used            tation (data not shown).
in sample preparation for FIB-SEM, thus providing a dark                   A second type of encrustation morphology shows
seal around the filaments in the FIB-SEM images (Fig. 9).               nanometer-sized globules present on the surface of cable
In contrast, the ridge compartments themselves were left un-            bacteria filaments (Fig. 8a and c). WDS analysis showed
stained and hence appeared white in the FIB-SEM images.                 that these globules also contained Fe and P (Fig. 11). Some
This allowed us to estimate the thickness of the crust by               filaments covered in these globules were less mineralized
measuring the distance from the top of the ridge compart-               than the completely encrusted cable bacteria suggesting that
ment to the top of the crust. The weakly encrusted filaments            the growth of these iron phosphate minerals predates the
all had 16 ridge compartments in the cell envelope, while               more advanced crust formation (Fig. 11). Some filaments
the strongly encrusted filaments had 11 ridge compartments.             were completely encrusted and were also covered in glob-
Both sets of filaments were obtained from the same sam-

www.biogeosciences.net/16/811/2019/                                                                Biogeosciences, 16, 811–829, 2019
820                                                     N. M. J. Geerlings et al.: Mineral formation induced by cable bacteria

Figure 6. (a) SEM image in which the yellow arrow points towards cable bacteria without any external attachment of particles, while the red
arrow points towards cable bacteria that have extracellular attachment of clay particles. False-colored WDS element maps of (b) phosphorus,
(e) magnesium and (f) iron and EDS element maps of (c) aluminum and (d) silicon. Scale bars represent 5 µm. Filaments were extracted
from the suboxic zone of sediment from Rattekaai salt marsh.

ules showing that they continued growing after the cell is              4.1   Polyphosphate (poly-P) granules
encrusted (Fig. 8a and d).
                                                                        In the laboratory sediment enrichments from all field sites ex-
4   Discussion                                                          amined in this study, naked cable bacterium filaments were
                                                                        observed that contained poly-P granules. It was not possible
In the present study, we examined enrichment cultures of                to discern if these poly-P granules were also present in en-
cable bacteria through different types of microscopy and                crusted or coated cable bacteria. Both the size and number of
spectroscopy and observed the formation of poly-P granules              poly-P granules varied widely between filaments present in
within the cells and two different types of mineral formation           the same sediment sample (Fig. 3a–c). Some filaments con-
directly associated with multicellular filaments of these cable         tained no poly-P granules, other filaments had one large poly-
bacteria: the attachment of clay particles into a coating sur-          P granule in each cell, while still other filaments contained
rounding the bacteria and encrustation of the cell envelope             multiple smaller poly-P granules in each cell. Differences in
by iron minerals.                                                       size and number of poly-P granules could even be observed
                                                                        within a single bacterium (Figs. 3b, d, 4). Yet, in general, the
                                                                        differences in size and number of the poly-P granules were

Biogeosciences, 16, 811–829, 2019                                                              www.biogeosciences.net/16/811/2019/
N. M. J. Geerlings et al.: Mineral formation induced by cable bacteria 821
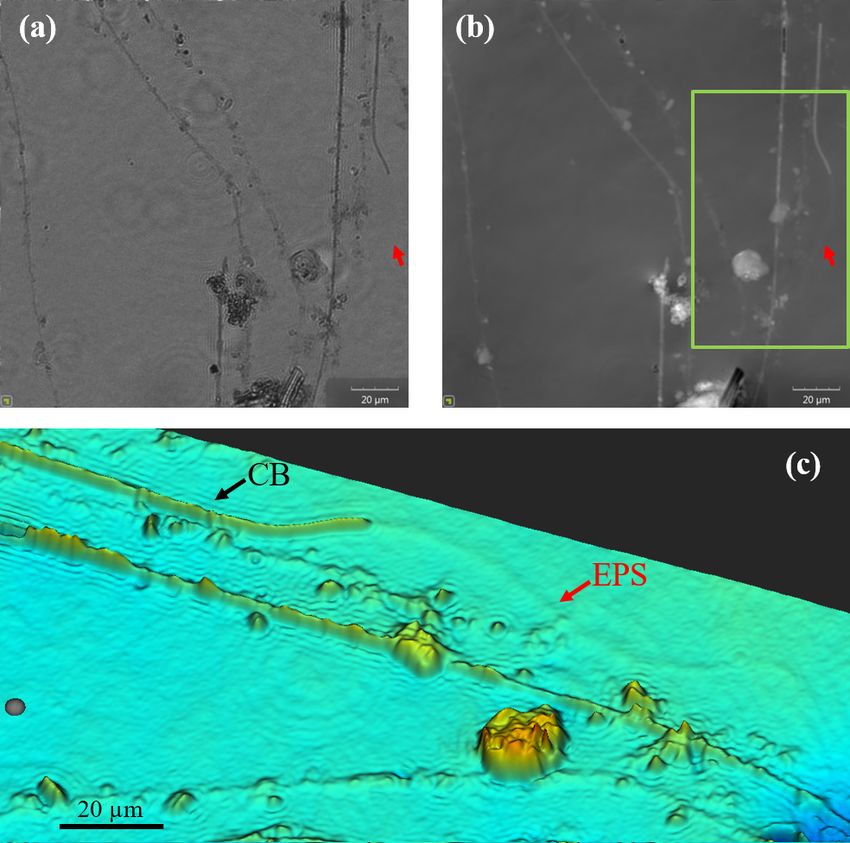
Figure 7. Images of cable bacteria grown on glass slides in sediment
from the Dutch marine Lake Grevelingen were captured with a dig-
ital holographic microscope. (a) The light intensity image, (b) the
phase image and (c) a false-color view of a detailed subarea (green
box) of the phase panel (b). In the images, the presence of living
cable bacteria (CB), as well as the remnants of filaments which had Figure 8. SEM images of cell encrustation in cable bacteria: (a) sed-
been coated with particles and where most likely only a sheath of iment from an incubated core from Mokbaai after 38 days showing
extracellular polymeric substances (EPS) remains, can be observed. different degrees of encrustation on the cable bacteria. (b) Cells of a
cable bacteria filament showing encrustation of the filament ridges.
(c) Mineralized stalk that has been broken at a cell–cell junction
larger between filaments than within cells belonging to the showing that iron(oxyhydr)oxide has precipitated at the cell–cell
same filament. junction. It also shows the presence of nanometer-sized globules.
The EDS and WDS spectra showed that granules mainly (d) Sediment from the oxic layer from Mokbaai after 24 days show-
contained P and O, which suggested they consist of poly- ing encrusted cable bacteria as well as the twisted stalks from the
P granules, which are long-chain polymers consisting of Fe(II)-oxidizing Gallionella spp. (e) Sediment from an incubated
core from the Black Sea showing a large part of a looping encrusted
2–1000 orthophosphate residues linked together by a high-
cable bacteria filament with attached minerals. (f) Broken miner-
energy phosphoanhydride bond that is similar to the bond in
alized remains of a cable bacterium showing the presence of the
adenosine triphosphate (ATP) (Kornberg, 1995; Seufferheld ridges of the cell and the presence of nanometer-sized globules.
et al., 2008; Rao et al., 2009). Poly-P appears to have distinc- (g) A representative example of a composition spectrum from an
tive biological functions in microbial cells, and this function EDS spot analysis of encrustation observed on a cable bacterium.
depends on abundance, chain length, origin and subcellular The spectrum shows the presence of O, Fe, Si and Ca in the en-
location of the granules. Poly-P granules have been thought crustation. The sample was gold-coated prior to analysis, hence the
to act as an ATP substitute and energy storage, although gold (Au) peak. The spot location is indicated by the black cross
the metabolic turnover of ATP is considerably higher than in the inset. Scale bars represent 10 µm (e), 5 µm (b, d), 3 µm (a)
that of poly-P (Kornberg, 1995). They can also be a reser- and 2 µm (c, f). Filaments were extracted from the oxic zones of
voir for orthophosphate (Pi ), a chelator of metal ions, and a sediments from Mokbaai (a, d), Rattekaai salt marsh (b, c) and the
Black Sea (e, f, g).
buffer against alkali ions. Finally, poly-P granules have been
claimed to aid the channeling of DNA and to regulate the re-
sponses to stresses and adjustments for survival, especially in
the stationary phase of culture growth and development (Ko- mapping, which revealed a high spatial correlation between
rnberg, 1995 and references therein). Due to their anionic na- P on the one hand and Ca and Mg on the other hand. More-
ture, poly-P granules typically form complexes with cations over, this correlation pattern was consistent across filaments
(Kornberg, 1995; Rao et al., 2009; Seufferheld et al., 2008). with different numbers and sizes of granules (Figs. 4, S1).
This is fully confirmed by our EDS measurements, which Our EDS data also showed the presence of S in the poly-P
show prominent peaks of Ca and Mg, as well as by the X-ray granules (Fig. 3d). However, X-ray mapping illustrated that S
www.biogeosciences.net/16/811/2019/ Biogeosciences, 16, 811–829, 2019822 N. M. J. Geerlings et al.: Mineral formation induced by cable bacteria Figure 9. SEM images (a, d), FIB-SEM images (b, e) and conceptual representations (c, f) of horizontal cross sections from cell junctions (a– c) and cells (d–f) of cable bacteria filaments. (a) A mineralized cell junction from a cable bacterium. (b) FIB-SEM image of a cell junction showing the connection of ridges at the junctions between cells. (c) Conceptual representation of a mineralized cell junction, showing that the encrustation is on the outside of the shared outer membrane. (d) Two broken cable bacteria filaments, where the upper filament shows the inside of a cell, while the lower filament shows the (mineralized) inside at a cell–cell junction. (e) FIB-SEM image of a cross section of a cell and (f) the conceptual representation showing that the encrustation is on the outside of the plasma membrane. Scale bars represent 0.5 µm (a) and 1 µm (d). The filaments were taken from the oxic zones from incubated sediments from the Black Sea (a), Mokbaai (d) and marine Lake Grevelingen (b, c, e, f). Figure 10. (a) SEM image and false-colored WDS element maps of the same area for (b) phosphorus and (c) iron for a consortium of encrusted cable bacteria. Scale bars represent 5 µm. Filaments were extracted from the oxic zone from incubated sediments from Rattekaai salt marsh. showed a poor spatial correlation with P (Figs. 4, S1). Hence, giatoa (Schulz and Schulz, 2005), as well as in cable bacte- sulfur appeared not restricted to the poly-P granule but was ria under in situ conditions in a coastal hypoxic basin (Sulu- evenly distributed throughout the entire filament (Figs. 4, Gambari et al., 2016). Both the size and number of poly-P S1). Given this homogeneous distribution, we hypothesize granules are thought to greatly depend on the environmen- that sulfur is not linked to poly-P granules but is an abundant tal conditions these large sulfur-oxidizing bacteria are ex- element in the thick cell envelope that surrounds the cable posed to, such as the sulfide and oxygen regime (Brock and bacterium filaments (Cornelissen et al., 2018; Jiang et al., Schulz-Vogt, 2011). Under oxic conditions, Thiomargarita 2018). namibiensis and Beggiatoa gain energy from aerobic oxi- Poly-P granules have been observed in other large sulfur- dation of elemental sulfur that is intracellularly stored in S oxidizing bacteria, like Thiomargarita, Thioploca and Beg- globules. The excess energy gained through sulfur oxidation Biogeosciences, 16, 811–829, 2019 www.biogeosciences.net/16/811/2019/
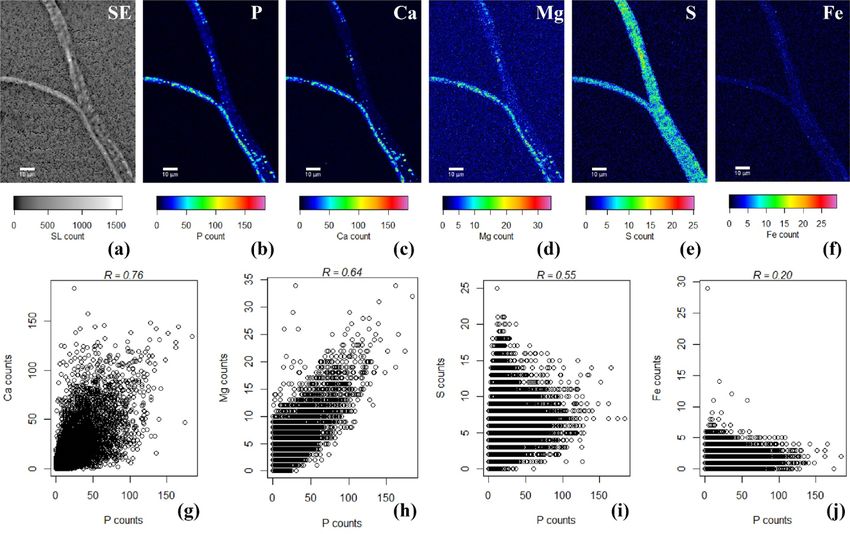
N. M. J. Geerlings et al.: Mineral formation induced by cable bacteria                                                                823

Figure 11. (a) SEM image with several cable bacteria showing varying degrees of encrustation and the correlated false-colored WDS images
of the same area showing the presence of phosphorus (b) and iron (c). The yellow arrow indicates a thin cable bacteria showing no signs
of encrustation, the orange arrow indicates a large cable bacteria covered in nanometer-sized globules that contained Fe and P, and the red
arrow indicates an encrusted cable bacteria where the crust was mainly composed of Fe and P. Scale bars represent 10 µm (a) and 5 µm (b,
c). The filaments were taken from the oxic zone of Rattekaai salt marsh sediment.

(i.e., the energy that does not need to be invested in over-            Ca2+ /H+ antiporters facilitated by the proton pumps in other
all metabolism and cell growth) then initiates luxury uptake            organisms (Docampo and Moreno, 2012). Recently, poly-P
of P, which is stored in poly-P granules. Under anoxic con-             granules that are similar to acidocalcisomes have also been
ditions, T. namibiensis and Beggiatoa gain energy from the              observed in the sulfide-oxidizing marine Beggiatoa strain
oxidation of free sulfide (H2 S) to elemental sulfur using in-          35Flor (Brock et al., 2012). These poly-P granules showed a
ternally stored nitrate as an electron acceptor. This oxidation         similar association between P, Ca and Mg and were enclosed
does not yield as much energy and so the breakdown of poly-             by a lipid layer which is hypothesized to be a membrane.
P then forms an auxiliary mechanism to gain energy (Brock               However, in contrast to acidocalcisomes, the poly-P granules
and Schulz-Vogt, 2011; Schulz and Schulz, 2005).                        found in strain 35Flor are not acidic (Brock et al., 2012).
   Acidocalcisomes are subcellular organelles in eukaryotes                Given the correlation between P, Ca and Mg, as seen in the
that are homologous to poly-P granules in prokaryotes (Seuf-            WDS mapping (Fig. 4) and EDS analysis (Fig. 3d), we hy-
ferheld et al., 2008). Acidocalcisomes are an electron-dense,           pothesize that the poly-P granules seen in the cable bacteria
acidic compartment containing a matrix of pyrophosphate                 could be membrane-bound vacuoles that have a function in
and polyphosphates with bound calcium and other cations,                the Ca2+ /H+ homeostasis. This could allow cable bacteria to
mainly magnesium and potassium. The formation of acido-                 maintain optimum intracellular pH levels in an environment
calcisomes hence allows increased uptake of both phospho-               with strong pH gradients, specifically in the alkaline oxic
rus compounds and cations (Docampo and Moreno, 2012).                   zone. Another possibility is that the poly-P granules func-
Acidocalcisomes possess an enclosing membrane that has a                tion as a kind of “energy safety system” that enables survival
function in the calcium and pH homeostasis (Seufferheld et              under conditions of low redox potential, similar to the func-
al., 2003), as well as the osmotic homeostasis (Docampo et              tion of the poly-P granules in other sulfur-oxidizing bacteria
al., 2005). It has been found that poly-P granules in the bacte-        such as Beggiatoa, Thioploca and Thiomargarita (Brock and
ria Agrobacterium tumefaciens (Seufferheld et al., 2003) and            Schulz-Vogt, 2011). One option could be that cable bacteria
Rhodospirillum rubrum (Seufferheld et al., 2004) are simi-              use the poly-P granules as an internal energy reservoir that
lar to the acidocalcisomes found in eukaryotic species; they            drives their motility (Bjerg et al., 2016) under energy-starved
are rich in orthophosphate (Pi ), pyrophosphate (PPi ), poly-           conditions (e.g., when a filament is no longer in contact with
P, Ca, Mg and potassium (K), and are acidic and enclosed                the oxic zone, and hence cannot perform long-distance elec-
by a membrane. In addition, Seufferheld et al. (2003, 2004)             tron transport due to a lack of electron acceptor). To inves-
discovered that the acidocalcisomes in eukaryotic species               tigate if the poly-P granules within cable bacteria are sep-
as well as the poly-P granules in A. tumefaciens and R.                 arate organelles within the cells and if they function as an
rubrum both contained the enzyme proton-pyrophosphatase                 “energy safety system” similar to poly-P granules in other
(H+ -PPase), which suggests a common origin for these or-               sulfur-oxidizing bacteria, the presence of a membrane around
ganelles. The Ca in the acidocalcisome is bound to a polyan-            the poly-P granules needs to be confirmed, as does the up-
ionic matrix of poly-P and can be released after alkalinization         take of phosphate during oxic conditions and the release of
of the organelle. Ca2+ uptake into acidocalcisomes is driven            phosphate during anoxic and sulfidic conditions (Brock et
by Ca2+ ATPases in several protists and probably through                al., 2012). To analyze the acidity of the polyphosphate gran-

www.biogeosciences.net/16/811/2019/                                                                Biogeosciences, 16, 811–829, 2019
824                                                    N. M. J. Geerlings et al.: Mineral formation induced by cable bacteria

ules they can be analyzed by fluorescence microscopy using          fect on the metabolism of the cable bacteria is unknown and
pH sensitive dyes (e.g., Acridine orange) (Brock et al., 2012;      open for investigation.
Hegler et al., 2010).
   This would provide insight into the ways cable bacteria          4.3   Cell encrustation
maintain their function in an environment that is variable
on both spatial and temporal scales as a result of their own        The combination of SEM, EDS, EPMA, WDS and FIB-
metabolism.                                                         SEM analysis showed the presence of cable bacteria cells
                                                                    that were encrusted with a mineral layer containing mainly
4.2   External coating of mineral particles                         Fe and P and minor amounts of Mg, Ca and Si (Figs. 7–
                                                                    10). The encrustation was only observed in (parts of) cable
In a number of cases the filaments of cable bacteria are sur-       bacteria that were present in the oxic zone. We propose that
rounded by a heterogeneous coating in which mineral parti-          the encrustation consists of amorphous or poorly crystalline
cles of different sizes and geometries are embedded. One op-        iron(oxyhydr)oxides that precipitated onto the outer mem-
tion is that the attached minerals are formed de novo; another      brane, thereby either incorporating or adsorbing phosphate.
– and more likely option – is that existing minerals are glued         The external surface of a cable bacterium filament shows
together via extracellular polymeric substances (EPS). Cable        a unique structure with uniform ridges running along the en-
bacteria show a gliding motility where filaments follow the         tire length of the filament (Cornelissen et al., 2018; Pfeffer et
receding sulfide front and stay connected with the oxygen           al., 2012). The ridges run inside the continuous periplasmic
whilst the gap between the oxygen and sulfide is widening           space, with the collective outer membrane serving as elec-
as a consequence of the growth and metabolism of the cable          trical insulation from the external medium (Cornelissen et
bacteria (Bjerg et al., 2016). Once in contact with oxygen, the     al., 2018; Pfeffer et al., 2012). Adjacent cells within the fila-
cable bacteria were observed to stop gliding. This behavior         ments are separated by cell junctions that are bridged by the
is suggestive of oxygen chemotaxis. As long as the oxygen           periplasmic filling and enclosed by the collective outer mem-
front is changing, cable bacteria will glide through the sedi-      brane (Jiang et al., 2018; Cornelissen et al., 2018). These
ment (Bjerg et al., 2016), most likely by excreting EPS. Dig-       ridge structures were also observed in the mineralized fil-
ital holographic microscopy confirms the formation of EPS           aments (Figs. 7 and 8). Therefore, we refer to the forma-
in relation to the gliding movement (Fig. 7). The DHM im-           tion of this mineral layer as “cell encrustation”, which is
ages show a sheath of optically thick EPS that tightly sur-         a term borrowed from Miot et al. (2009), who found that
rounds the filament. Moreover, trails of EPS are left behind        the morphology of the periplasm was preserved upon min-
on ACLAR slides embedded in the sediment, which suggests            eralization of nitrate-reducing Fe2+ -oxidizing bacteria strain
that EPS is produced by the filaments as an aid in motility         BoFeN1 (Miot et al., 2009, 2011a). Even though the encrus-
(Fig. 7). EPS excretion to aid motility has been found in other     tation is not found within the periplasmic space (Fig. 8), it
filamentous bacteria like cyanobacteria and Beggiatoa spp.          preserves the ridge structure that is associated with the fibers
(Larkin and Henk, 1996; Risser and Meeks, 2013). In Beg-            in the periplasm. To further investigate the interaction be-
giatoa spp. pores in the cell wall have been observed, and the      tween the outer cell surface, EPS and the mineral layer, cryo-
hypothesis is that EPS is excreted through these pores to sus-      genic methods appear to be promising since they would pre-
tain gliding motility (Larkin and Henk, 1996). In cyanobac-         serve the native structure (Bassim et al., 2012; Dohnalkova
teria, similar evidence for gliding motility by EPS excretion       et al., 2011; Miot et al., 2011b).
(like the presence of excretion pores and the staining of trails)      Cable bacteria belong to the gram-negative bacteria and
is supported by the recent discovery of an essential EPS ex-        there have been multiple reports on the encrustation of other
cretion gene (Risser and Meeks, 2013).                              gram-negative bacteria (Benzerara et al., 2004, 2008, 2011;
   Thioploca spp. cells form filaments that cling to each other     Goulhen et al., 2006; Miot et al., 2009, 2011a; Schädler et
and secrete a sheath of mucous that surrounds several fil-          al., 2009), which suggests that this might be a widespread
aments. This sheath allows the filaments to tunnel through          and common process. These are all bacteria that apparently
the sediment up to the overlying water (Larkin and Strohl,          have no mechanism to avoid cellular encrustation. Several
1983). These Thioploca sheaths are often covered with de-           Fe2+ -oxidizing bacteria have evolved mechanisms to avoid
tritus (Rickard, 2012). We propose that the gliding move-           cellular encrustation by Fe3+ minerals; some species create
ment of cable bacteria might “trap” already present clay            more acidic microenvironments resulting in a higher solubil-
(nano)particles in the EPS matrix resulting in the extracel-        ity of Fe3+ ions (Hegler et al., 2010; Schädler et al., 2009);
lular attachment of clay particles without the formation of         Gallionella spp. and Leptothrix spp. produce extracellular or-
new clay minerals (Fig. 2e). The interaction between partic-        ganic polymers that nucleate Fe3+ precipitates, leading to
ulate minerals and microbial cells may arise because of the         the formation of spirally twisted stalks and sheaths, respec-
binding of preformed, finely dispersed minerals, such as col-       tively (Hallberg and Ferris, 2004). Mariprofundus ferrooxy-
loidal silica, metal oxides and clays (Phoenix et al., 2005).       dans strain PV-1 has hydrophilic cell surfaces and a near-
Whether the extracellular attachment has any (negative) ef-         neutral charge to prevent encrustation (Melton et al., 2014).

Biogeosciences, 16, 811–829, 2019                                                         www.biogeosciences.net/16/811/2019/
You can also read