Expression of RUNX1-JAK2 in Human Induced Pluripotent Stem Cell-Derived Hematopoietic Cells Activates the JAK-STAT and MYC Pathways
←
→
Page content transcription
If your browser does not render page correctly, please read the page content below
International Journal of
               Molecular Sciences

Article
Expression of RUNX1-JAK2 in Human Induced Pluripotent
Stem Cell-Derived Hematopoietic Cells Activates the
JAK-STAT and MYC Pathways
Klaus Fortschegger * , Anna-Maria Husa † , Dagmar Schinnerl † , Karin Nebral and Sabine Strehl

                                          St. Anna Children’s Cancer Research Institute (CCRI), 1090 Vienna, Austria; anna-maria.husa@ccri.at (A.-M.H.);
                                          dagmar.schinnerl@ccri.at (D.S.); karin.nebral@labdia.at (K.N.); sabine.strehl@ccri.at (S.S.)
                                          * Correspondence: klaus.fortschegger@ccri.at; Tel.: +43-1-40470-4023
                                          † A.-M.H. and D.S. contributed equally as second authors to this study.

                                          Abstract: A heterogeneous genetic subtype of B-cell precursor acute lymphoblastic leukemia is
                                          driven by constitutive kinase-activation, including patients with JAK2 fusions. In our study, we
                                          model the impact of a novel JAK2 fusion protein on hematopoietic development in human induced
                                          pluripotent stem cells (hiPSCs). We insert the RUNX1-JAK2 fusion into one endogenous RUNX1
                                          allele through employing in trans paired nicking genome editing. Tagging of the fusion with a degron
                                          facilitates protein depletion using the heterobifunctional compound dTAG-13. Throughout in vitro
                                          hematopoietic differentiation, the expression of RUNX1-JAK2 is driven by endogenous RUNX1
                                          regulatory elements at physiological levels. Functional analysis reveals that RUNX1-JAK2 knock-in

                                   cell lines yield fewer hematopoietic progenitors, due to RUNX1 haploinsufficiency. Nevertheless,
                                          these progenitors further differentiate toward myeloid lineages to a similar extent as wild-type
Citation: Fortschegger, K.; Husa,
                                          cells. The expression of the RUNX1-JAK2 fusion protein only elicits subtle effects on myeloid
A.-M.; Schinnerl, D.; Nebral, K.;
                                          differentiation, and is unable to transform early hematopoietic progenitors. However, phosphoprotein
Strehl, S. Expression of RUNX1-JAK2
in Human Induced Pluripotent Stem
                                          and transcriptome analyses reveal that RUNX1-JAK2 constitutively activates JAK-STAT signaling in
Cell-Derived Hematopoietic Cells          differentiating hiPSCs and at the same time upregulates MYC targets—confirming the interaction
Activates the JAK-STAT and MYC            between these pathways. This proof-of-principle study indicates that conditional expression of
Pathways. Int. J. Mol. Sci. 2021, 22,     oncogenic fusion proteins in combination with hematopoietic differentiation of hiPSCs may be
7576. https://doi.org/10.3390/            applicable to leukemia-relevant disease modeling.
ijms22147576
                                          Keywords: leukemia; oncogenic fusion; CRISPR/Cas9; hematopoiesis; hiPSC; JAK-STAT signaling;
Academic Editor: Hyuk-Jin Cha             MYC pathway

Received: 18 June 2021
Accepted: 7 July 2021
Published: 15 July 2021
                                          1. Introduction
                                               B-cell precursor acute lymphoblastic leukemia (B-ALL) is the most frequent pediatric
Publisher’s Note: MDPI stays neutral
with regard to jurisdictional claims in
                                          malignancy and a clinically and genetically heterogeneous disease [1–5]. A genetically
published maps and institutional affil-
                                          diverse B-ALL subgroup comprises cases with rearrangements affecting genes involved in
iations.                                  cytokine-receptor or kinase signaling, such as ABL1, ABL2, PDGFRB, CSF1R, JAK2, EPOR,
                                          and CRLF2 [6,7]. These alterations elicit similar gene expression signatures and often confer
                                          failure to standard multidrug treatment [1]. Theoretically, at least some of these fusion
                                          proteins may constitute a dual-hit oncogenic mutation. On the one hand, constitutive
                                          kinase-activation induces proliferative and/or antiapoptotic signaling pathways. On the
Copyright: © 2021 by the authors.
                                          other hand, interference with the function of the other fusion partner—for example, a
Licensee MDPI, Basel, Switzerland.
This article is an open access article
                                          developmental transcription factor—blocks differentiation, as is the case for EBF1-PDGFRB
distributed under the terms and
                                          and PAX5-JAK2 [8–10].
conditions of the Creative Commons
                                               Here, we employed in vitro differentiation of genetically engineered hiPSCs toward
Attribution (CC BY) license (https://     hematopoietic progenitors as a cellular model system to study the function of JAK2 fu-
creativecommons.org/licenses/by/          sion proteins. Since in vitro differentiation of hiPSCs toward B-lymphoid cells remains a
4.0/).                                    challenging task, we aimed to investigate a JAK2 fusion, which occurs in leukemia of the

Int. J. Mol. Sci. 2021, 22, 7576. https://doi.org/10.3390/ijms22147576                                           https://www.mdpi.com/journal/ijms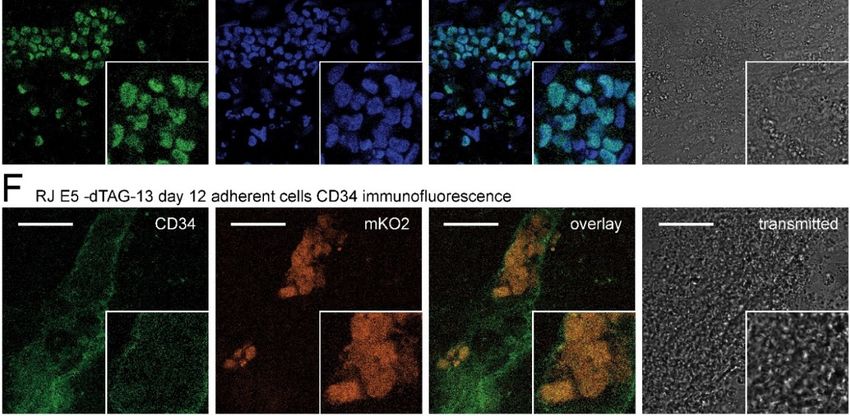
Int. J. Mol. Sci. 2021, 22, 7576                                                                                          2 of 18

                                   myeloid and lymphoid lineages, and whose expression is driven by an N-terminal partner
                                   at the onset of hematopoietic development. When routine diagnostics identified a pediatric
                                   B-ALL patient with an in-frame RUNX1-JAK2 fusion, which has also been proposed to
                                   be present in a case of myeloproliferative neoplasm (MPN) [11], we opted to investigate
                                   its impact on hematopoietic differentiation. Similar fusion proteins, such as PCM1-JAK2,
                                   were found in myeloid and lymphoid malignancies [12].
                                         Both fusion partners, RUNX1 and JAK2, are prominent leukemia-associated genes
                                   that are often affected by genomic rearrangements or mutations [12–16]. Cooperation
                                   of RUNX1 and JAK-STAT alterations has already been suggested to play a role in acute
                                   myeloid leukemia (AML) development [17,18].
                                         The N-terminal fusion partner RUNX1 is a transcription factor, which is essential
                                   for early hematopoiesis [19]. RUNX1 is especially crucial for hematopoietic specification
                                   during endothelial to hematopoietic transformation (EHT) [20]. At later stages of develop-
                                   ment, it is involved in the differentiation, and survival of, for example, the megakaryocytic
                                   lineage [21–23]. In leukemia-associated genomic rearrangements, RUNX1 may either repre-
                                   sent a C-terminal fusion partner—for example, in ETV6-RUNX1-positive B-ALL—or it may
                                   be N-terminally fused to proteins, such as eight-twenty-one family members (RUNX1T1,
                                   CBFA2T2, CBFA2T3) in AML [24–26]. RUNX1 fusions [13], as well as germline or somatic
                                   mutations [14], are associated with several different myeloid or lymphoid dysplastic or
                                   neoplastic hematological diseases.
                                         The C-terminal fusion partner, the non-receptor tyrosine kinase JAK2, plays crucial
                                   roles in hematopoiesis, proliferation, differentiation, and survival [27]. It is involved in
                                   the signaling cascade from various cytokine receptors to downstream targets, including
                                   the signal transducers and activators of transcription (STATs). Upon binding of cytokine
                                   ligands to their respective receptors, conformational changes lead to auto-phosphorylation
                                   and activation of bound JAK2, which subsequently phosphorylates cytoplasmic STATs.
                                   Phosphorylated STATs then dimerize and shuttle to the nucleus, acting as sequence-specific
                                   transcription factors [28,29]. An important canonical JAK2 phosphorylation target protein,
                                   STAT5, is essential for the survival of normal, as well as leukemic stem and progenitor
                                   cells [29–31]. Aberrations of JAK2, either point-mutations or C-terminal fusions to PCM1,
                                   ETV6, PAX5, EBF1, or others [12], are recurrently associated with different hematopoietic
                                   malignancies and result in constitutive activation of JAK-STAT signaling [15,32]. No-
                                   tably, while some JAK2 fusion proteins contain self-interaction domains that cause auto-
                                   phosphorylation and canonical downstream target phosphorylation in the cytoplasm,
                                   others lack oligomerization motifs and/or localize to the nucleus, suggesting distinct
                                   functional modes [9,33,34].
                                         Several JAK2 fusion proteins have been demonstrated to result in constitutive ac-
                                   tivation of JAK-STAT signaling [15,32]. To prove activation of this pathway, generally,
                                   murine lymphoid Ba/F3 cells are used, which upon kinase activation acquire cytokine-
                                   independent growth and display enhanced phosphorylation of STAT1, STAT3, and STAT5
                                   (pSTAT1/3/5) [9,35,36]. Increased pSTAT5 levels were also detected in many primary
                                   human leukemia samples [37,38]. However, neither in cell lines nor in primary leukemia
                                   cells, the impact of a fusion protein on the dynamics of hematopoietic development can
                                   be analyzed.
                                         In contrast, directed in vitro hematopoietic differentiation of hiPSCs facilitates the
                                   modeling of blood diseases throughout development. For this purpose, differentiation
                                   phenotypes of either genetically engineered or patient-derived hiPSCs are compared to
                                   normal isogenic controls. Intriguingly, most types of leukemia appear to be refractory to
                                   reprogramming toward pluripotency [39,40]. However, a few hiPSC lines were derived
                                   from AML patients and were used to model important aspects of disease development
                                   in vitro [41,42].
                                         Here, we have established a new well-controlled in vitro model system using geneti-
                                   cally modified hiPSCs to determine the impact of the RUNX1-JAK2 fusion on hematopoietic
                                   differentiation and downstream pathways in an otherwise normal genomic background.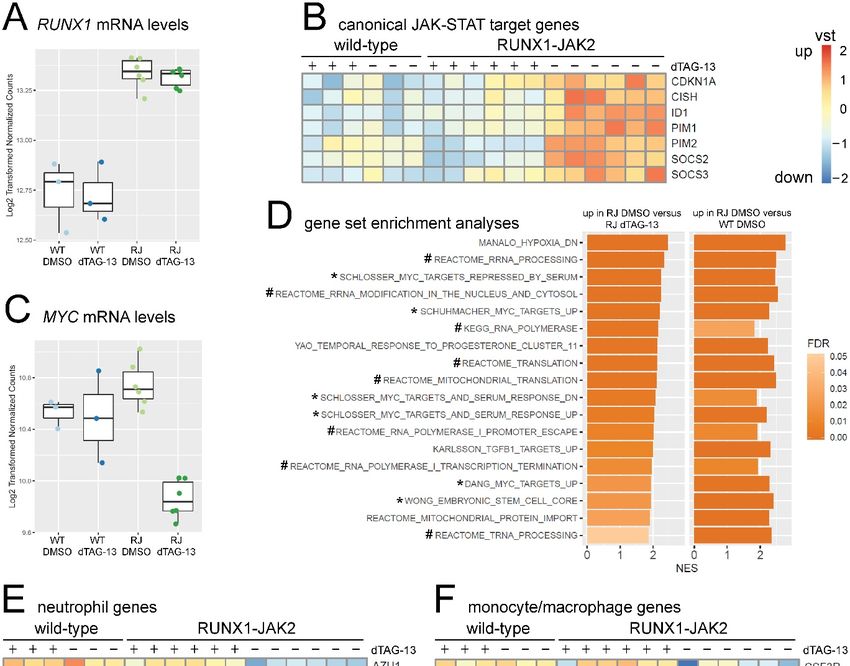
Int. J. Mol. Sci. 2021, 22, 7576 3 of 18
Our data provide strong evidence that in differentiating hiPSCs RUNX1-JAK2 constitutively
activates JAK-STAT and stimulates the MYC pathway.
2. Results and Discussion
2.1. Establishment of Knock-in hiPSC Lines Harboring a RUNX1-JAK2 Fusion
In this study, we investigated the impact of the fusion protein RUNX1-JAK2 on
hematopoietic development. The chimeric transcript detected in a B-ALL patient consists
of the first eight exons of RUNX1 fused to JAK2 exons 19–25 (Figure 1A), consequently
Int. J. Mol. Sci. 2021, 22, x FOR PEER REVIEW 4 of 19
encoding a protein that consists mainly of the RUNX1 Runt DNA-binding and JAK2 JH1
tyrosine kinase domains (Figure 1B).
Figure 1. RUNX1-JAK2
Figure 1. RUNX1-JAK2 fusion fusion gene
gene identification
identification and and establishment
establishment of of corresponding
corresponding knock-in
knock-in hiPSC
hiPSC lines.
lines. (A)
(A) Reverse
Reverse
transcription polymerase chain
transcription chain reaction
reaction (RT-PCR)
(RT-PCR) withwithRUNX1
RUNX1forward
forwardand andJAK2
JAK2reverse
reverseprimers
primers showed
showed expression
expression of
two in-frame fusion transcripts (the canonical full-length and a splice variant lacking RUNX1
of two in-frame fusion transcripts (the canonical full-length and a splice variant lacking RUNX1 exon 7) in patient P1. exon 7) in patient P1. The
ETV6-RUNX1-positive
The ETV6-RUNX1-positive cell line AT-1AT-1
cell line and and
a noa template
no templatecontrol (NTC)
control (NTC)served as negative
served controls
as negative (bp,(bp,
controls basebase
pair). (B)
pair).
Putative RUNX1-JAK2 protein structure depicted with the Runt homology domain and the
(B) Putative RUNX1-JAK2 protein structure depicted with the Runt homology domain and the nuclear localization signal nuclear localization signal
(NLS) of RUNX1 and the JH1 tyrosine kinase domain of JAK2, the breakpoint (X), the amino acid positions, and the
(NLS) of RUNX1 and the JH1 tyrosine kinase domain of JAK2, the breakpoint (X), the amino acid positions, and the expected
expected molecular weight (kda, kilodalton). (C) Knock-in strategy: The JAK2 encoded part fused to a dTAG, and an IRES-
molecular weight (kda, kilodalton). (C) Knock-in strategy: The JAK2 encoded part fused to a dTAG, and an IRES-mKO2
mKO2 cassette were inserted into RUNX1 exon 9. Locations of CRISPR/Cas9 target site (yellow bolt), homology arms
cassette
(5′HA and were inserted
3′HA), PCR into RUNX1
amplicons (5′exon
and 3′ 9.PCR
Locations of CRISPR/Cas9
detecting targetand
the knock-in flanks, siteWT
(yellow
PCR bolt), homology
the wild-type arms
allele) (50stop
and HA
and 0
3 HA), PCR amplicons 0
(5 shown. 0
and 3 PCR detecting thetriangle)
knock-in flanks, after
and WT PCR the wild-type
codons (black vertical bars) are A loxP site (black persisted Cre-mediated excision ofallele) and stop
the puromycin
codons (black
resistance vertical
cassette (notbars) are shown.
shown). (D) Three A loxP site PCR
primer (black
oftriangle)
a knock-inpersisted after Cre-mediated
clone example (G10) and aexcision
cell bulkofyielded
the puromycin
WT and
3′ PCR products
resistance cassette(WT,
(notparental
shown). cell
(D) line;
Three NTC, no template
primer PCR of a control).
knock-inDeduced genotypes
clone example (G10)are
and indicated
a cell bulk(+, yielded
wild-type WTallele;
and
0 PCR
3KI, knock-in allele;
products (WT, mix, +/KI mixed
parental with
cell line; NTC,+/+no
ortemplate
+/floxed).control).
(E) Expression
Deducedofgenotypes
the four indicated pluripotency
are indicated (+, wild-type factors in
allele;
KI, knock-in allele; mix, +/KI mixed with +/+ or +/floxed). (E) Expression of the four indicated pluripotency factors in8
RUNX1-JAK2 hiPSCs was determined by quantitative RT-PCR and normalized to GUSB and ABL1. Fold expression of
different knock-in
RUNX1-JAK2 hiPSCslines
was(RJ,determined
n = 8; meanby ± standard deviation)
quantitative RT-PCR compared to wild-type
and normalized (WT)and
to GUSB hiPSCs
ABL1. is shown.
Fold expression of
8 different knock-in lines (RJ, n = 8; mean ± standard deviation) compared to wild-type (WT) hiPSCs is shown.
2.2. RUNX1-JAK2 Fusion Protein Expression upon Hematopoietic Differentiation
While inactive in the pluripotent state, after four days of directed hematopoietic
differentiation [48], a fraction of the cells started to express the mKO2 reporter from the
RUNX1 locus. From day 8 onwards, numerous mKO2-expressing cells performed EHT
similar to wild-type lines and remained mKO2-positive as suspension cells (Figure 2A).
Comparable to patient P1 (Figure 1A), the RUNX1-JAK2 fusion gene was transcribed from
Int. J. Mol. Sci. 2021, 22, 7576                                                                                               4 of 18

                                               We used genome editing to establish hiPSC lines carrying this so far uncharacterized,
                                         putatively leukemogenic fusion. Since we intended to express RUNX1-JAK2 at physio-
                                         logical levels via relevant regulatory elements, we inserted the JAK2 encoding fusion part
                                         into one endogenous RUNX1 allele in such a way that a hybrid splice site, consisting of
                                         RUNX1 intronic and JAK2 exonic sequences, was created (Figure 1C). Thus, the resulting
                                         RUNX1-JAK2 knock-in allele mimics the fusion gene present in the patient. We also added a
                                         C-terminal dTAG degron and a tandem hemagglutinin (HA) epitope tag to facilitate fusion
                                         protein depletion [43] and detection, respectively. Furthermore, a downstream internal ribo-
                                         some entry site monomeric Kusabira Orange 2 (IRES-mKO2) reporter cassette was included
                                         to monitor RUNX1 expression in live cells. Finally, a floxed puromycin resistance cassette
                                         was temporarily inserted to allow for the selection of successfully genome-edited cells, but
                                         was later excised by Cre-mediated recombination to prevent unintended interferences.
                                               To avoid the formation of insertions or deletions in the second RUNX1 allele, as
                                         well as at off-target sites, due to error-prone DNA double-strand break repair, we em-
                                         ployed an in trans paired nicking approach [44,45] rather than conventional Clustered
                                         Regularly Interspaced Short Palindromic Repeats (CRISPR) mediated knock-in. We used a
                                         CRISPR/Cas9-D10A ribonucleoprotein complex targeting RUNX1 and a donor template
                                         vector with the same RUNX1 nuclease target site flanking both homology arms. Eight
                                         hiPSC clones with transgene insertion in one RUNX1 locus and one unaltered wild-type
                                         allele were established (Figure 1D, Supplementary Figures S1A and S2). According to
                                         the informative heterozygous single nucleotide polymorphism (SNP) rs13051066, the in-
                                         sertion took place to the same extent on both RUNX1 alleles (4 clones each), but none of
                                         the clones harbored a rarely occurring biallelic insertion. Based on SNP array analysis,
                                         no copy number alterations were detectable (data not shown), suggesting that no other
                                         gross genomic rearrangements had occurred. Single cell cloning during reprogramming
                                         or genetic engineering often goes along with unintended selection for TP53 mutations,
                                         because these confer growth and survival advantage [46,47]. Such confounding alterations
                                         were excluded by RNA-seq data analysis (Section 2.6). All hiPSC knock-in cell lines, when
                                         cultured under hypoxia in TeSR media (supplemented with ROCK inhibitor Y-27632 during
                                         splitting, transfecting, freezing, and thawing) on Matrigel coating, expressed high levels of
                                         pluripotency marker mRNA (Figure 1E) and protein (Supplementary Figure S1B), while 5 of 19
Int. J. Mol. Sci. 2021, 22, x FOR PEER REVIEW
                                         neither wild-type RUNX1 nor RUNX1-JAK2 nor mKO2 protein were yet expressed (data
                                         not shown).
                                            2.2. RUNX1-JAK2
                                         RUNX1-JAK2             Fusionalleles
                                                          knock-in      Proteinprimarily
                                                                                Expression in
                                                                                            upon  Hematopoietic
                                                                                               CD34+      CD43+ Differentiation
                                                                                                                  and CD34+ CD144+ hemato-
                                                 Whileprogenitors
                                         endothelial     inactive in (Supplementary
                                                                      the pluripotent state,    afterS4
                                                                                           Figures     four
                                                                                                         anddays
                                                                                                              S5).of directed
                                                                                                                   Upon         hematopoietic
                                                                                                                           treatment   with 100 nM
                                            differentiation [48], a fraction  of the cells started  to  express
                                         dTAG-13 compound throughout differentiation, the RUNX1-JAK2 protein    the mKO2     reporter from the was
                                            RUNX1    locus. From    day  8 onwards,   numerous     mKO2-expressing       cells
                                         continuously degraded, and its expression level was substantially reduced (Figure 2C).performed  EHT
                                            similar to wild-type lines and remained mKO2-positive as suspension cells (Figure 2A).
                                         Consequently, our well-controlled, conditional expression approach enabled us to
                                            Comparable to patient P1 (Figure 1A), the RUNX1-JAK2 fusion gene was transcribed from
                                         investigate
                                            the distal the
                                                       andimpact
                                                           proximal ofpromoters
                                                                       RUNX1-JAK2        on hematopoietic
                                                                                   and correctly                differentiation.
                                                                                                  spliced (Figure   2B).

                                                                    Figure 2. Cont.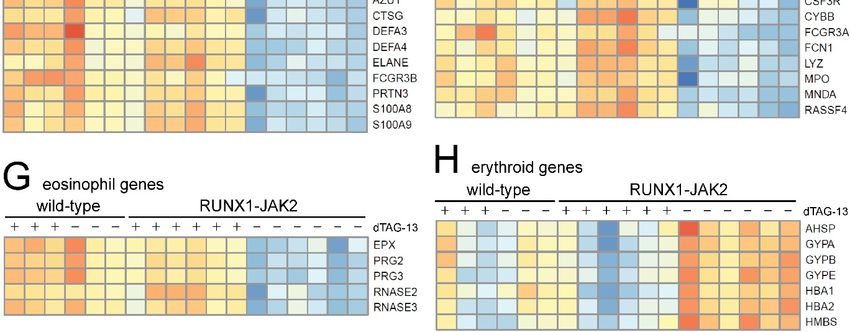
Int. J. Mol. Sci. 2021, 22, 7576 5 of 18
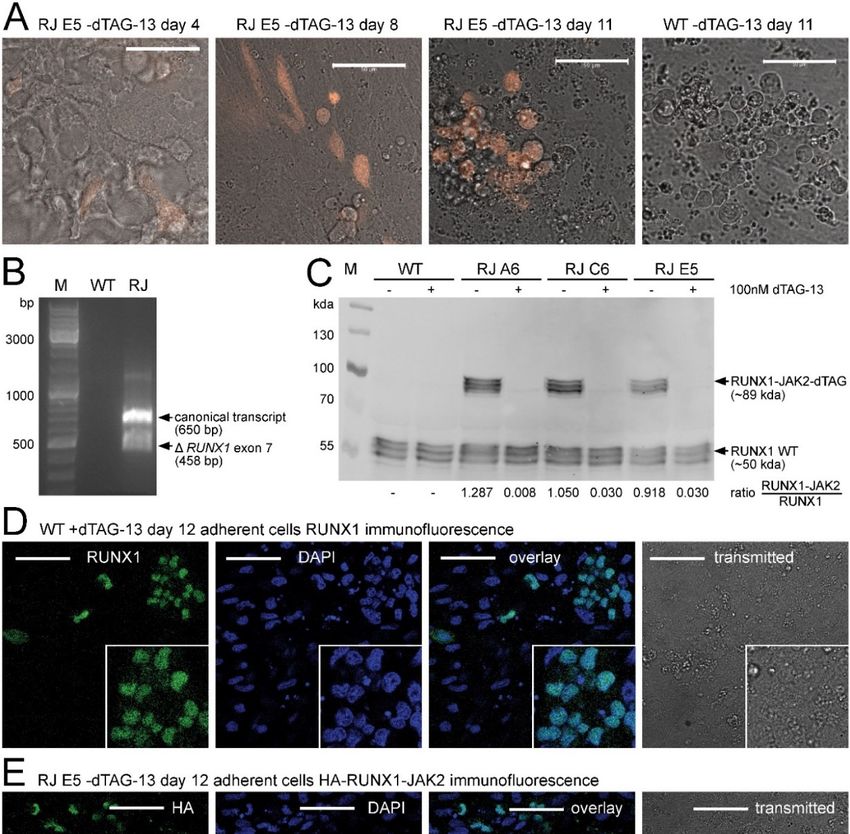
Figure 2. RUNX1-JAK2 expression during hematopoietic differentiation. (A) Representative live cell images (orange mKO2
fluorescence and grey transmitted light overlay) during hematopoietic differentiation. RUNX1-JAK2 knock-in (RJ) and wild-
type (WT) cells at indicated timepoint are shown. (B) RT-PCR revealed correct expression of two RUNX1-JAK2 transcript
variants in differentiated RJ, but not in WT cells. (C) RUNX1 and RUNX1-JAK2 fusion protein expression in differentiated
dTAG-13-treated or untreated WT and three RJ lines (unstarved adherent cell lysates) was analyzed by Western blot with
an RUNX1-specific antibody. Protein variants of slightly different molecular weights are expressed due to usage of the
proximal and distal promoters, alternative splicing (e.g., RUNX1 exon 7 skipping), and posttranslational modifications.
Signal ratios of RUNX1-JAK2 fusion to wild-type RUNX1 proteins are indicated below. (D–F) Immunofluorescence stainings
were performed with unstarved adherent cells fixed after 12 days of differentiation. (D) RUNX1 protein localization (green)
in wild-type cells was determined by indirect immunofluorescence; DAPI counterstain (blue), overlay, and transmitted light
(grey) pictures are also shown. (E) Untreated RJ clone E5 cells were stained for HA-tagged RUNX1-JAK2 protein (green) as
in D. (F) Concomitant expression of CD34 (APC fluorescence in green) and mKO2 (orange) was detected in untreated RJ E5
cells by direct immunofluorescence. White bars correspond to 50 µm; M, molecular weight markers; bp, base pair; kda,
kilodalton; close-ups (twofold magnification) are shown on the bottom right of immunofluorescence pictures.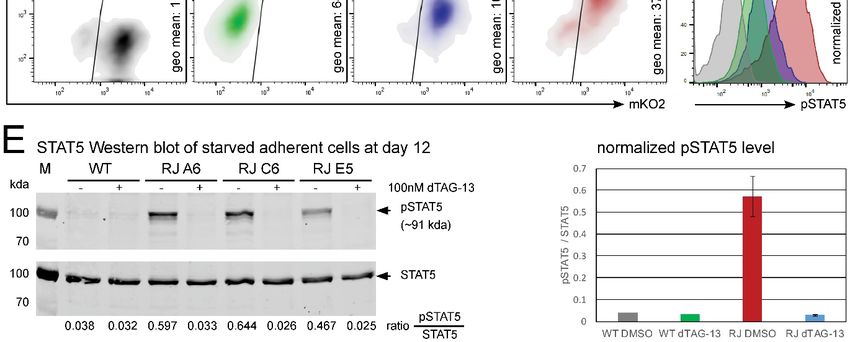
Int. J. Mol. Sci. 2021, 22, 7576                                                                                            6 of 18

                                        The fusion protein of expected size was translated at a level very similar to that of
                                   RUNX1 (Figure 2C). Like the wild-type protein (Figure 2D, Supplementary Figure S3A–C),
                                   also RUNX1-JAK2 localized to the cell nucleus as demonstrated by HA-tag immunofluo-
                                   rescence (Figure 2E, Supplementary Figure S3D,E).
                                        Moreover, at this stage of differentiation, the mKO2-positive cells exhibited CD34
                                   surface expression (Figure 2F), suggesting activation of the RUNX1 wild-type and RUNX1-
                                   JAK2 knock-in alleles primarily in CD34+ CD43+ and CD34+ CD144+ hemato-endothelial
                                   progenitors (Supplementary Figures S4 and S5). Upon treatment with 100 nM dTAG-13
                                   compound throughout differentiation, the RUNX1-JAK2 protein was continuously de-
                                   graded, and its expression level was substantially reduced (Figure 2C). Consequently, our
                                   well-controlled, conditional expression approach enabled us to investigate the impact of
                                   RUNX1-JAK2 on hematopoietic differentiation.
                                   2.3. RUNX1 Haploinsufficiency of RUNX1-JAK2 Knock-In Cell Lines
                                             To analyze the effects of RUNX1-JAK2 expression on early hematopoiesis, we first
                                        harvested and counted live hematopoietic cells floating in the supernatant after 12 days of
                                        hiPSC differentiation [48]. This cell population was highly enriched in hematopoietic pro-
                                        genitors (on average 90% CD34+ CD43+ double positive cells; Figure 3A, Supplementary
                                        Figure S6; [49]). While the percentage of progenitors was slightly increased in RUNX1-
                                        JAK2-expressing lines, a monocytic commitment was decreased about twofold (Figure 3A,
                                        Supplementary Figure S7). Notably, the observed suspension cell yield was significantly
                                        diminished (about threefold) in the knock-in cell lines compared to wild-type controls
                                        (Figure 3B). Since this observation remained valid regardless of whether the fusion was
                                        expressed or degraded (i.e., without or upon dTAG-13 treatment, respectively; Figure 3B),
                                        this defect is most probably due to RUNX1 wild-type haploinsufficiency resulting from
                                        the insertion of the fusion partner into one allele. Hematopoietic deficits arising from
                                        impaired EHT have already been described for RUNX1 knock-out mice [19,20], while
                                        RUNX1 overexpression has been shown to enhance hematopoietic output in vitro [50].
 Int. J. Mol. Sci. 2021, 22, x FOR PEER REVIEW                                                                              7 of 19
                                        Together, these findings align with the current understanding that RUNX1 gene dosage
                                        plays a critical role in developmental hematopoiesis [21,22].

                                                          Figure 3. Cont.
Int. J. Mol. Sci. 2021, 22, 7576 7 of 18
Figure
Figure 3.3. Functional
Functional analyses
analyses ofof RUNX1-JAK2
RUNX1-JAK2 and and wild-type
wild-type hematopoietic
hematopoietic progenitor
progenitor cells.
cells. (A)
(A) Supernatant
Supernatant cells
cells were
were
harvested
harvested from
fromdayday1212differentiation
differentiationcultures,
cultures,and
andflow cytometry
flow cytometryforfor
surface markers
surface CD34,
markers CD43,
CD34, CD43,CD14, and and
CD14, CD16CD16
was
performed. Mean percentages for CD34+ CD43+ hematopoietic progenitors (left) and CD14+ CD16+ monocytes (left) are
was performed. Mean percentages for CD34+ CD43+ hematopoietic progenitors (left) and CD14+ CD16+ monocytes
shown (wild-type, WT, n = 1; RUNX1-JAK2, RJ, n = 3; dTAG-13 or DMSO-treated cells; error bars represent standard
(left) are shown (wild-type, WT, n = 1; RUNX1-JAK2, RJ, n = 3; dTAG-13 or DMSO-treated cells; error bars represent
deviations). (B) Total live suspension cells were harvested and counted (wild-type, WT, n = 5; RUNX1-JAK2, RJ, n = 13; 8
standardclones;
different deviations). (B) Total live
dTAG-13-treated or suspension cells were
DMSO controls). Meanharvested and±counted
cell numbers standard(wild-type,
deviation per WT,well
n =of5; aRUNX1-JAK2,
12-well plate
RJ, n = 13; 8 different clones; dTAG-13-treated or DMSO controls). Mean cell numbers ± standard deviation
and adjusted p-values of the indicated comparisons are shown (analysis of variance, ANOVA; ***, very high significance). per well of
a 12-well plate and adjusted p-values of the indicated comparisons are shown (analysis of variance,
(C) MethoCult assays: 2000 supernatant cells were seeded per well of a 6-well plate in methylcellulose medium containingANOVA; ***, very
high significance).
cytokines, and after(C)
14MethoCult assays:
days of culture, the2000 supernatant
numbers cellsof
and types were seeded
colonies per enumerated
were well of a 6-well
(left;plate
WT,inn methylcellulose
= 3; RJ, n = 7, 7
different
medium clones; BFU,cytokines,
containing burst forming unit;14CFU,
and after dayscolony forming
of culture, unit; E, erythrocyte;
the numbers and types ofG,colonies
granulocyte; M, macrophage;
were enumerated (left;GM,
WT,
granulocyte
n = 3; RJ, n =and macrophage;
7, 7 different GEMM,
clones; granulocyte,
BFU, burst formingerythrocyte, macrophage,
unit; CFU, colony formingandunit;megakaryocyte;
E, erythrocyte; means ± standard
G, granulocyte; M,
deviation).
macrophage; Representative
GM, granulocyte pictures of different GEMM,
and macrophage; CFU types are also shown
granulocyte, (right;macrophage,
erythrocyte, white bars and correspond to 1 mm).
megakaryocyte; (D)
means
± standard deviation). Representative pictures of different CFU types are also shown (right; white bars correspond to
1 mm). (D) Supernatant cells were starved, fixed, permeabilized, stained with an antibody specific for phosphorylated
STAT5, and analyzed by flow cytometry. Density and histogram plots of intact single cells (gated according to forward and
sideward scatter), pSTAT5 geometrical means, and percentages of mKO2 positivity are depicted for untreated RJ clone E5
cells (RJ DMSO, red) and controls (RJ dTAG-13, blue; WT dTAG-13, green; isotype IgG, grey). One representative result of
four independent experiments is shown. (E) Western blot analysis of dTAG-13-treated or untreated WT and three clonal
RJ lines (lysates of differentiated adherent cells starved for 5 h in unsupplemented IMDM) was performed for pSTAT5
and total STAT5 protein (left; kda, kilodalton). Signal ratios of phosphorylated to total STAT5 protein are presented below
and summarized in a bar chart (right; means ± standard deviation). Percentages of the obtained RUNX1-JAK2-positive
hemato-endothelial cells in the differentiation cultures and consequently pSTAT5 signal levels were variable.
Our current model correctly accounts for the loss of one wild-type RUNX1 allele
present in leukemia, but not for the concomitant JAK2 hemizygosity. However, since JAK2
activity is primarily controlled by phosphorylation and inhibition of the protein [27,28],
and since no significantly altered phenotype was observed in heterozygous Jak2 knock-out
mice [51], we assume that the effects of its haploinsufficiency are negligible.
2.4. Clonogenic Potential of RUNX1-JAK2-Expressing Hematopoietic Progenitors
Next, we performed cytokine-enriched methylcellulose assays to investigate the clono-
genic potential of hematopoietic stem and progenitor cells (HSPCs) present in the supernatants
of day 12 differentiation cultures. We did not observe significant differences in colony form-
ing unit (CFU) numbers, types, or sizes between parental and isogenic RUNX1-JAK2 lines
(Figure 3C). Despite the previously observed reduced hematopoietic cell yield from RUNX1-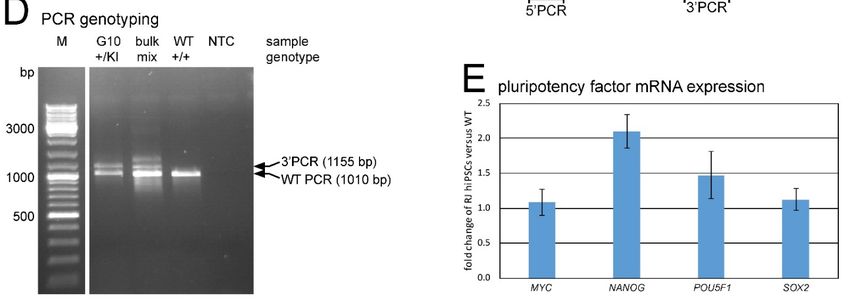
Int. J. Mol. Sci. 2021, 22, 7576                                                                                            8 of 18

                                   JAK2 hiPSC lines (Figure 3B), the composition (Figure 3A, Supplementary Figures S6 and
                                   S7) and clonogenic quality of the HSPCs (Figure 3C) was not evidently altered, indicating
                                   that RUNX1 haploinsufficiency affects mainly EHT, but not subsequent hematopoietic lineage
                                   differentiation surveyed in the cytokine-enriched methylcellulose assay [20].
                                         Notably, at least in our experimental setting, the expression of RUNX1-JAK2 fu-
                                   sion protein did not cause any obvious differences regarding clonogenicity (Figure 3C).
                                   Like parental wild-type and dTAG-13-treated knock-in progenitors, also RUNX1-JAK2-
                                   expressing cells formed only a few very small CFU-G or CFU-M colonies in methylcellulose
                                   without cytokines (data not shown), suggesting that cytokine-dependency still prevailed.
                                   Moreover, differentiated cells harvested from primary methylcellulose cultures were in gen-
                                   eral unable to form secondary colonies (data not shown). In contrast, transposon-mediated
                                   expression of RUNX1-JAK2 protein resulted in IL3-independent growth of Ba/F3 cells in
                                   liquid culture (Supplementary Figure S8A).
                                         These results imply that RUNX1-JAK2 expression per se does not lead to oncogenic
                                   transformation of early hematopoietic progenitors derived from hiPSCs under the ex-
                                   perimental conditions used. However, we cannot rule out that cells at other stages of
                                   development, such as early B-cell progenitors, whose efficient generation by directed
                                   in vitro differentiation of hiPSCs remains highly challenging [52,53], are susceptible to
                                   transformation by RUNX1-JAK2 [31]. Noteworthy, compared to native in vivo generated
                                   hematopoietic stem cells, HSPCs derived from hiPSCs have distinct properties and are, so
                                   far, incapable of long-term engraftment in mice, unless an adequate set of multiple tran-
                                   scription factors with oncogenic properties is ectopically expressed [54–56]. Hence, it is still
                                   possible that native HSPCs are more permissive to RUNX1-JAK2-mediated transformation.
                                   2.5. RUNX1-JAK2 Constitutively Activates STAT5 in Differentiated hiPSCs
                                         In the next step, we addressed the question of whether the expression of RUNX1-JAK2
                                   leads to constitutive activation of the JAK-STAT pathway in hiPSC-derived progenitors
                                   as it does in Ba/F3 cells (Supplementary Figure S8B,C). For this purpose, we harvested
                                   hematopoietic cells from differentiation culture supernatants and performed short-term
                                   starvation in a medium without supplements to reduce steady state signaling to basal levels.
                                   Then, we conducted phosphoflow cytometric analysis [57] of pSTAT5, which is activated
                                   by JAK2-mediated phosphorylation. As shown in Figure 3D, despite prior starvation,
                                   RUNX1-JAK2-expressing suspension cells displayed high pSTAT5 levels, whereas those of
                                   wild-type cells were much lower. STAT5 phosphorylation was only slightly higher in dTAG-
                                   13-treated RUNX1-JAK2 than in wild-type cells, supposedly due to the presence of residual,
                                   not yet degraded fusion protein. Western blot analysis also showed an approximately
                                   18-fold increase of STAT5 phosphorylation in starved differentiated adherent RUNX1-
                                   JAK2-expressing cells (Figure 3E), of which, in fact, only a variable fraction expressed the
                                   fusion protein.
                                         Furthermore, we investigated the phosphorylation of STAT1 and STAT3. In Ba/F3
                                   cells, pSTAT1 and pSTAT3 levels were highly increased by RUNX1-JAK2 (Supplementary
                                   Figure S9A,B). In contrast, in the adherent fraction of hiPSCs differentiated for 12 days,
                                   despite several hours of starvation, pSTAT1 and pSTAT3 levels remained high, and no obvi-
                                   ous further induction by RUNX1-JAK2 was detectable (Supplementary Figure S9C,D). This
                                   finding is supposedly due to the self-stimulation of endothelial and mesenchymal cells via
                                   pathways, such as PDGF, FGF, and VEGF. Thus, the differences in RUNX1-JAK2-mediated
                                   STAT1 and STAT3 phosphorylation between Ba/F3 and adherent differentiated hiPSCs may
                                   well be cellular context-dependent. However, in both instances, exogenous stimulation by
                                   cytokines appears to be required for STAT5 phosphorylation unless complemented by a
                                   kinase-activating fusion protein. These data imply that the lack of transforming capacity
                                   of RUNX1-JAK2 in hiPSC-derived progenitors is not due to its general failure to activate
                                   JAK-STAT signaling.
Int. J. Mol. Sci. 2021, 22, 7576 9 of 18
2.6. Impact of RUNX1-JAK2 on the Hematopoietic Transcriptional Landscape
Finally, to explore the impact of the RUNX1-JAK2 fusion protein on genome-wide
transcription, we performed RNA-seq of hematopoietic cell bulks after 12 days of differ-
entiation and 4 h of starvation. Three independent experiments were conducted with
altogether three wild-type controls (WT) and six RUNX1-JAK2 clones (RJ) as biological
replicates, each either dTAG-13-treated or not.
Based on the rs13051066 SNP frequencies in the RNA-seq reads, the RUNX1 and
RUNX1-JAK2 knock-in alleles were transcribed at similar rates in the differentiated trans-
genic lines. Remarkably, according to differential gene expression analysis, the combined
mRNA level of RUNX1 and RUNX1-JAK2 was elevated by roughly 50% (Figure 4A). Con-
sequently, wild-type RUNX1 mRNA reached on average three quarters of the parental
cell level. We assume that about a third of the heterozygous progenitors stochastically
expressed RUNX1 at levels sufficient for EHT, thus these cells were able to transit into the
supernatant and were subsequently harvested from the cultures (Figure 3A,B).
Nonetheless, the reduced expression of megakaryocyte/thrombocyte associated tran-
scripts in untreated, as well as dTAG-13-treated RUNX1-JAK2 cells (Supplementary
Figure S10A), indicates a mild impairment of megakaryocytic differentiation due to
RUNX1 haploinsufficiency [23].
Furthermore, two unrelated coding (CLIC6, RCAN1; Supplementary Figure S10B,C)
and two non-coding loci (LINC01426, LINC00160) immediately downstream of RUNX1
were slightly upregulated, supposedly due to weak in cis activation by the insert. As
expected, JAK2 and FKBP1A, because of the additionally inserted and expressed 30 fu-
sion partner and dTAG sequences, also exhibited slightly increased total transcript levels
(Supplementary Figure S10D,E).
Next, we performed differential gene expression and gene set enrichment analysis
(GSEA) using pre-ranked shrunken log2 -fold change lists. Four-hundred-and-seventeen
genes were differentially regulated by RUNX1-JAK2 expression (83 up- and 334 down-
regulated genes in untreated RJ versus dTAG-13-treated RJ; change ≥ 2-fold and adjusted
p-value ≤ 0.01). In contrast, dTAG-13 treatment had no significant influence on gene ex-
pression of WT cells (Supplementary Table S1). RUNX1-JAK2-expressing cells, as expected
for constitutive JAK-STAT signaling, significantly upregulated canonical pSTAT5 target
genes (Figure 4B), confirming cytokine-independent transcriptional activation of signaling
mediators further downstream. In this context, it is important to note that several of these
targets are involved in negative feedback circuits by either attenuating JAK-STAT signaling
(e.g., SOCS2, [27]) or curtailing excessive proliferation (e.g., CDKN1A, [58]). This might
explain why GSEA did not reach high significance levels for larger JAK-STAT-related gene
sets (Supplementary Table S1).
Intriguingly, although transcript levels of the proto-oncogenes MYC (Figure 4C) and
MYCN (Supplementary Figure S10F) were only marginally elevated, and MYC protein was
not considerably altered by RUNX1-JAK2 expression (Supplementary Figure S10G), various
MYC transcriptional target gene sets were significantly upregulated (Figure 4D). This
suggests high MYC activity, which may occur at the level of posttranslational modifications
and co-activating or repressing interaction partners [59,60]. Although the exact underlying
mechanism remains elusive, our observation affirms the crosstalk between the JAK-STAT
and MYC pathways as already described for NK-cell leukemia [61] and B-ALL [37,62]. This
finding also offers an explanation for the concomitant upregulation of genes involved in
RNA transcription, processing and translation (Figure 4D), which is consistent with MYC-
mediated transcriptional amplification [63]. In addition, RUNX1-JAK2 appears to inversely
regulate hypoxia-related gene sets (Figure 4D, Supplementary Table S1), which is again in
line with downregulation of MYC targets mediated by HIF1A at low oxygen tension [64].Int. J. Mol. Sci. 2021, 22, 7576 10 of 18
Int. J. Mol. Sci. 2021, 22, x FOR PEER REVIEW 11 of 19
Figure 4.
Figure 4. Gene
Geneexpression
expressionanalyses
analysesofofstarved
starved RUNX1-JAK2-expressing
RUNX1-JAK2-expressing hematopoietic
hematopoieticcells. RNA-seq
cells. was was
RNA-seq conducted with
conducted
wild-type (WT, n = 3) and RUNX1-JAK2 (RJ, n = 6) cells differentiated for 12 days either with (+, dTAG-13) or without (−,
with wild-type (WT, n = 3) and RUNX1-JAK2 (RJ, n = 6) cells differentiated for 12 days either with (+, dTAG-13) or
DMSO) degrader treatment. (A) Boxplot showing normalized log2-transformed RUNX1 mRNA expression levels. (B)
without (−, DMSO) degrader treatment. (A) Boxplot showing normalized log2 -transformed RUNX1 mRNA expression
Expression profiles of canonical pSTAT5 targets. Heat-maps show batch-corrected and variance-stabilization-transformed
levels. (B)
(vst) log Expression profiles of canonical pSTAT5 targets. Heat-maps show batch-corrected and variance-stabilization-
2-fold changes from low (blue) to high expression (orange). (C) Boxplot displaying normalized log2-transformed
transformed
MYC mRNA (vst) log2 -fold
expression changes
levels. fromsets
(D) Gene lowsignificantly
(blue) to high expression
upregulated (orange).
with (C) Boxplot
false discovery displaying
rate (FDR) normalized
q-values ≤ 0.05 in
log 2 -transformed
both MYC mRNA
enrichment analyses, expression
untreated levels.
RJ versus (D) Gene sets significantly
dTAG-13-treated upregulated
RJ and untreated RJ versuswith false discovery
untreated WT, are rate (FDR)
listed. The
q-values ≤ 0.05 innormalized
x-axis represents both enrichment analyses,
enrichment untreated
scores RJ versus
(NES), the dTAG-13-treated
brightness of the bar FDR RJ values,
and untreated
gene setsRJdirectly
versus untreated
related to
MYC
WT, areand RNA
listed. Thebiology are marked
x-axis represents with asterisks
normalized (*) and
enrichment hashes
scores (#),the
(NES), respectively.
brightness ofExpression
the bar FDRprofiles
values,ofgene
selected
sets
significantly
directly regulated
related to MYCgenes related
and RNA to neutrophils
biology (E), with
are marked monocytes and(*)
asterisks macrophages (F), respectively.
and hashes (#), eosinophils (G), and erythrocytes
Expression profiles
(H)
of are depicted.
selected significantly regulated genes related to neutrophils (E), monocytes and macrophages (F), eosinophils (G), and
erythrocytes (H) are depicted.Int. J. Mol. Sci. 2021, 22, 7576 11 of 18
Moreover, while RUNX1-JAK2-expressing cells showed significantly decreased lev-
els of monocyte and granulocyte-related myeloid markers (Figure 4E–G; consistent with
Figure 3A and Supplementary Figure S7), they displayed increased transcription of ery-
throid genes, such as the α-globin and glycophorin loci (Figure 4H). This suggests that the
fusion protein promotes at least a minor differentiation bias toward the erythroid at the
expense of other myeloid cell lineages as already described for other STAT5 hyperactivation
models [65,66]. Consequently, multiple gene sets related to macrophages or granulocytes
were underrepresented in RUNX1-JAK2-expressing cells, such as targets of interferon beta
1 inflammatory signaling (Supplementary Figure S11A).
However, in cytokine-enriched methylcellulose assays, these lineage-specific transcrip-
tional changes are supposedly too subtle to elicit significant changes in CFU development
(Figure 3C), or, as outlined above, they might be due to inherent differences in the properties
of hematopoietic progenitors derived from hiPSCs.
We also did not observe increased clonogenicity or enhanced hematopoietic differenti-
ation upon RUNX1-JAK2 expression, as described by others for STAT5A-hyperactivated
human cord blood HSPCs or murine embryonic stem cells, respectively [66,67]. Possible
explanations for these divergences are differences in cell type, culture conditions, the
intensity of STAT5 activation [65], or the concomitant RUNX1 haploinsufficiency. Likewise,
in the corresponding human leukemia RUNX1 is hemizygous, however, the RUNX1-JAK2-
causing translocation supposedly took place at a more advanced developmental stage.
Furthermore, the lack of significantly deregulated gene sets related to RUNX transcription
factors (GSEA of dTAG-13-treated RJ versus WT, Supplementary Table S1) suggests that
RUNX1 function is largely intact also because it may be partially compensated by selection
for cells with increased mRNA levels (Figure 4A). Hence, the observed transcriptional
changes appear to be governed primarily by RUNX1-JAK2-mediated JAK-STAT signaling
and subsequent activation of the MYC pathway. Although other studies proposed direct
MYC upregulation on the mRNA or protein level by JAK-STAT signaling, our data hint
at an alternative positive interaction between the two pathways either by protein activity
regulation or by co-activation of target loci. The exact mechanisms underlying this synergy
remain to be addressed in future research.
3. Materials and Methods
3.1. Reverse Transcription, PCR, and RNA-seq
Patient P1 was enrolled in the ALL-BFM 2009 (NCT01117441) clinical trial. Total RNA
from diagnostic bone marrow was extracted using the QIAamp RNA Blood Mini kit (Qia-
gen, Hilden, Germany). The B-ALL cell line AT-1 was used as a negative control [68]. The
expression of the RUNX1-JAK2 fusion gene was confirmed by RT-PCR with High Capacity
cDNA Reverse Transcription Kit (Thermo Scientific), HotStarTaq (Qiagen), and 500 nM
primers RUNX1-ex5-F3 and JAK2-ex20-R1, followed by Sanger-sequencing. Sequence
analysis was performed with CLC Workbench 7.9.1 (Qiagen). The fusion transcript con-
sisted of RUNX1 exons 1–8 (Ensembl transcript ENST00000437180.5) and JAK2 exons 19–25
(ENST00000381652.4). For RUNX1, an alternatively spliced in-frame transcript variant
lacking exon 7 has been described (ENST00000399240.5).
Total RNA of hiPSCs and differentiated derivative cells was extracted using TRIzol
reagent (Thermo Fisher Scientific) following the manufacturer’s protocol with glycogen
as co-precipitant. Complementary DNA (cDNA) was synthesized from 2 µg total RNA
using 500 ng of each random and oligo-dT18 primers and M-MLV reverse transcriptase
(Promega). Correct splicing of the knock-in fusion transcript was verified by RT-PCR
with HotStarTaq (Qiagen), and 500 nM primers RUNX1-ex5-F3 and JAK2-ex20-R1, and
Sanger-sequencing. RT-qPCRs for POU5F1, MYC, SOX2, NANOG, GUSB, and ABL1 were
conducted in triplicates on a 7500-Fast cycler (Applied Biosystems, Waltham, MA, USA)
with cDNA corresponding to 40 ng total RNA per 20 µL reaction using 200 nM forward
and reverse primers and iTaq Universal SYBR-green Supermix (Bio-Rad). PCR efficiencies
of 90–100% were verified by standard dilution series and specificity by melt curve analyses.
Relative quantification was performed by normalization to ROX reference dye, GUSB andInt. J. Mol. Sci. 2021, 22, 7576 12 of 18
ABL1 housekeeping gene expression, and parental hiPSCs using the 2−∆∆Ct method. All
primers are listed in Supplementary Table S2.
Library preparation and RNA-seq were conducted at the Next Generation Sequencing
Facility of the Vienna BioCenter Core Facilities Austria (VBCF; https://www.viennabiocenter.
org/vbcf/next-generation-sequencing/, accessed on 8 July 2021). In brief, 500 ng total RNA
was enriched for polyA-containing mRNAs and converted to barcoded libraries using the
NEBNext Ultra II kit (New England Biolabs). Eighteen samples were multiplexed and single
end 100 bp reads sequenced on a NovaSeq 6000 SP XP flow cell. Demultiplexed reads were
mapped to human genome GRCh38 without alt loci (ftp://ftp.ncbi.nlm.nih.gov/genomes/
all/GCA/000/001/405/GCA_000001405.15_GRCh38/seqs_for_alignment_pipelines.ucsc_
ids/GCA_000001405.15_GRCh38_no_alt_analysis_set.fna.gz, accessed on 26 June 2018) us-
ing STAR 2.7.0b [69]. Further analysis was performed in R (version 3.4.4) statistical environ-
ment using Bioconductor packages [70]. Count statistics for Refseq genes were obtained
by the “featureCounts” function (package Rsubread_1.28.1) using Ensembl annotation
Homo_sapiens.GRCh38.100 [71]. Gene expression was normalized, batch-corrected, and
analyzed using DESeq2 version 1.18.1 [72], including independent filtering with alpha = 0.05.
Gene set enrichment analysis (GSEA) was performed with pre-ranked lists according to
shrunken log2 -fold changes [73] using GSEA 2.2.4 and MSigDB 7.1 subset c2 [74]. To avoid
the effects of potentially confounding RUNX1 haploinsufficiency, we only considered gene
sets relevant if they were regulated significantly and equally in both comparisons, un-
treated RUNX1-JAK2 (RJ) versus untreated wild-type (WT), as well as untreated RJ versus
dTAG-13-treated RJ. Detailed RNA-seq results are summarized in Supplementary Table S1.
3.2. HiPSC Culture and Differentiation
The parental episomally reprogrammed hiPSC line was purchased from Thermo
Fisher Scientific (Gibco A18945; https://hpscreg.eu/cell-line/TMOi001-A, accessed on 10
December 2020). hiPSCs were routinely cultured under hypoxic conditions (37 ◦ C, 3% O2 ,
5% CO2 ) on plates coated with hESC-qualified Matrigel (Corning) in mTeSR1, mTeSR-
Plus or TeSR-E8 medium (all from STEMCELL Technologies). Cells were passaged every
3–4 days at a split ratio of about 1:6 using StemPro Accutase (Thermo Fisher Scientific,
Waltham, MA, USA); 10 µM Rho-associated coiled-coil-containing protein kinase inhibitor
Y-27632 (ROCK inhibitor; STEMCELL Technologies, Vancouver, BC, Canada) was added
for splitting, transfecting, freezing, and thawing. Mycoplasm contamination was excluded
by regular testing using a luminescent detection kit (Lonza MycoAlert).
The STEMdiff Hematopoietic Kit (STEMCELL Technologies) was used for differen-
tiation according to the manufacturer’s protocol (Document #29768 v1_2_0), albeit with
minor changes [48,54]. Briefly, 2000 hiPSCs were seeded as clumps per well of a Matrigel-
coated 12-well plate. Differentiation was started 4 days later by normoxic cell culture with
STEMdiff hematopoietic differentiation medium and supplement A (containing BMP4,
FGF2, VEGFA) for the first day with 3 µM CHIR99021 glycogen synthase kinase 3 inhibitor
(Sigma-Aldrich, St. Louis, MO, USA) and another 2 days without. Next, cells were cultured
for another 9 days in a differentiation medium with supplement B (containing BMP4,
FGF2, VEGFA, SCF, FLT3L, TPO) with half media changes every 2–3 days. DMSO vehicle
control (140 µM) only or 100 nM dTAG-13 compound (kindly provided by Nathanael Gray,
Dana-Farber Cancer Institute, Boston, MA, USA) was also present from differentiation day
2 onwards. Suspended and loosely attached cells were harvested on day 12 for clonogenic-
ity assays, flow cytometry, and RNA-seq, while the remaining adherent cell fraction was
used for RT-PCR, Western blotting, and immunofluorescence.
3.3. Genetic Engineering and Generation of Single Cell Clones
In trans paired nicking [44] was employed to genetically modify one, but not the
other RUNX1 allele at the intron 8 to exon 9 junction and to insert the respective JAK2
exons. The pUC57-simple backbone donor vector contained, flanked by RUNX1 CRISPR
target sites and homology arms of 626 bp for the 50 (50 HA) and 475 bp for the 30 end
(30 HA), an insert consisting of the JAK2 coding fusion part (spanning exons 19–25) in frameInt. J. Mol. Sci. 2021, 22, 7576 13 of 18
with a (GGGGS)3 linker, an FKBP1A-F36V-degron (dTAG; mutated ENST00000400137.9)
and a tandem HA-tag. Further downstream, it contained an IRES-mKO2 and a floxed
puromycin resistance expression cassette with the promoter and 30 untranslated region
(UTR) from murine Pgk1 (PuroR). The co-transfected CRISPR/Cas9 ribonucleoprotein
complex (RNP) consisted of Alt-R crRNA, tracrRNA, and Cas9/D10A nickase V3 re-
combinant protein (all from IDT). The selected guide RNA targeting the protospacer
sequence 50 -TCAGGTCGGGTGCCGCTGCA-30 exhibited at least three mismatches to puta-
tive off-targets in hg38 (https://wge.stemcell.sanger.ac.uk/crispr/1178695897, accessed
on 10 April 2017, [75]), and high on-target efficiency was predicted by two different algo-
rithms [76,77].
One million hiPSCs were electroporated using an Amaxa Nucleofector 2b with pro-
gram A-023 and Human Stem Cell Nucleofector Kit 2 (Lonza), 5 µg circular donor plasmid
and 250 pmol RNP, or, after two phases of 1-day 0.5 µg/mL puromycin (Sigma-Aldrich)
selection and 2-day recovery, 5 µg pCaGGS-Cre excision vector. Following the expansion
of the surviving cells, 2000 singularized cells were seeded into TESR-E8 containing 10%
CloneR supplement (STEMCELL technologies) on a 10-cm dish coated with Synthemax
II-SC (0.025 mg/ml in 12 mL water; Corning, Corning, NY, USA). Ninety-six of the emerged
colonies were picked manually, expanded, and genotyped. The recombined delta knock-in
allele (sequence in Supplementary Figure S2) was not detectable in 60 clones, 23 were
positive, but mixed with wild-type or floxed (still PuroR containing) knock-in cells, and
5 did not grow on the replicate plate. The remaining 8 clones were expandable and purely
heterozygous for the correct insertion in one without any signs of alteration of the second
RUNX1 allele and served as biological replicates in further experiments. Cre recombi-
nase [78], dTAG [79], and Sleeping beauty transposon [80] vectors were kind gifts from
Meinrad Busslinger (IMP, Vienna, Austria), Georg Winter (CeMM, Vienna, Austria), and
Rolf Marschalek (Goethe University, Frankfurt, Germany), respectively.
3.4. Genotyping
Genotyping PCRs for individual clones were performed using 500 nM specific primers,
approximately 100 ng genomic DNA, and HotStarTaq DNA polymerase (Qiagen). DNA
was isolated first by crude cell lysis in genotyping buffer (10 mM Tris-HCl pH 8.5, 50 mM
KCl, 2 mM MgCl2 , 0.45% Tween 20, 0.45% Nonidet P40 substitute, 1 mg/mL Proteinase
K; all from Sigma-Aldrich) and later after clone expansion with the QIAamp DNA Blood
Mini Kit (Qiagen). For the 50 flanking PCR, primers RUNX1-in8-F5 and JAK2-ex19-R1,
for the 3-primer PCR at the 30 flanking region, primers mKO2-mid-F1, RUNX1-in8-F3,
and RUNX1-ex9-R3, and for the 30 floxed PCR primers PuroRmidF2 and RUNX1-ex9-R3
were used (oligonucleotide sequences are listed in Supplementary Table S2). PCR products
(965 bp for the 50 , 1155 bp for the 30 flanking region of the recombined, 1535 bp for the floxed
knock-in allele, and 1010 bp for the wild-type allele) were purified using the Monarch kit
(New England Biolabs, Ipswich, MA, USA) and sequenced with the respective forward
primer (Microsynth, Switzerland). Sanger-sequences were aligned to the knock-in and
wild-type alleles, respectively. The heterozygous single nucleotide polymorphism (SNP)
rs13051066 slightly downstream of the 30 HA allowed the assessment of the knock-in and
wild-type haplotypes, respectively.
3.5. Magnetic Cell Separation and Colony Forming Unit Assays
Supernatants of hematopoietic differentiation cultures were harvested on day 12,
filtered through a 70 µm strainer, and live cells were purified using the MACS dead cell
removal kit (Miltenyi). After Trypanblue exclusion cell counting in a Bürker-Türk chamber,
2000 cells were seeded per well of a 6-well plate into 300 µL Iscove’s Modified Dulbecco’s
Medium (IMDM) containing 2% fetal bovine serum (both from Thermo Scientific) and
3 mL MethoCult semisolid medium either containing an enriched cytokine cocktail or none
at all (STEMCELL Technologies H4435 or H4230, respectively). Colonies were enumerated
12 to 14 days later in a 3D microscope under dark field illumination. Live cell yields per
well of 12-well plates were compared using unpaired one-way ANOVA with Tukey post hocInt. J. Mol. Sci. 2021, 22, 7576 14 of 18
test assuming Gaussian distribution and equality of variances (GraphPad Prism 8). Colony
pictures were acquired with an EVOS XL core microscope and 4× phase contrast objective
(Thermo Scientific).
3.6. Western Blotting
Adherent cells were washed with DPBS (Dulbecco’s phosphate buffer saline) and
lyzed in high salt buffer (20mM Tris-HCl pH 7.5, 400 mM NaCl, 0.5% NP-40, 0.3% Triton
X-100, 0.2 mM phenylmethylsulfonyl fluoride, 1 µg/mL each of Aprotinin, Leupeptin
and Pepstatin A). Cleared lysates and PageRuler prestained ladder (Thermo Scientific)
were subjected to SDS-PAGE (8% acrylamide) using Tris/Glycine buffer. Tank-blotted
membranes (GE Amersham Protran 0.45µm NC) were stained with Ponceau S (Sigma-
Aldrich) to check equal loading (Supplementary Figures S10G, S11B and S12), incubated
with blocking reagent (Roche), primary and secondary antibodies labeled with DyLight
800 or 650, and scanned on a Licor Odyssey. Local background subtracted band signal
intensities were quantified using Image Studio Lite 5.2.5 (Licor). Antibodies are listed in
Supplementary Table S2.
3.7. Microscopy and Immunofluorescence
For immunofluorescence, differentiation was performed in Matrigel coated 24-well
µ-plates (Ibidi). Cells were fixed with 1% methanol-free formaldehyde in DPBS for 10 min
at room temperature (RT), and for intracellular staining, cells were permeabilized with 0.2%
Triton X-100 in DPBS and sequentially incubated with HA or RUNX1 (1:500), or NANOG,
OCT4, or SOX2 antibody (1:50) in 2% bovine serum albumin (BSA; Sigma-Aldrich) and
0.2% Triton X-100 in DPBS, goat antimouse-IgG-AlexaFluor-488 antibody (1:2000) and
2 µg/mL 40 ,6-Diamidin-2-phenylindol (DAPI; Sigma-Aldrich). One drop of mounting
solution containing 10% Mowiol 4-88, 25% glycerol, and 2.5% 1,4-Diazabicyclo(2.2.2)octane
(all from Sigma-Aldrich) was added per well and covered with glass coverslips. Direct
immunofluorescence of fixed cells was performed either with TRA-1-60-AF488 (1:10), or
CD144-FITC (1:100) and CD34-APC (1:500), or CD43-FITC (1:100) and CD34-APC (1:500)
diluted in 2% BSA, 0.2% Triton X-100 in DPBS. CD34-APC alone was also employed 1:500
in 0.1% BSA in DPBS, omitting permeabilization to prevent loss of mKO2 fluorescence.
Pictures were acquired by sequential scan on a Leica TCS SP8X confocal microscope
equipped with a 405 nm diode for DAPI and a white light laser (490 nm excitation for AF488
or FITC, 550 nm for mKO2 and 650 nm for APC) and an HC PL APO CS2 40x/1.10 water
immersion objective. For live cell imaging, microphotographs were acquired at 35 ◦ C.
Antibodies are listed in Supplementary Table S2.
3.8. Flow Cytometry
For surface staining, live supernatant cells were incubated with an antibody cocktail
(CD14-APC-Cy7, CD16-BV605, CD34-APC, and CD43-BV510) and analyzed on an LSR-
Fortessa cytometer (Becton Dickinson; 405 nm excitation, 525 ± 50 nm and 605 ± 12 nm
emission; 561 nm excitation and 581 ± 15 nm emission; 640 nm excitation, 670 ± 14 nm
and 780 ± 60 nm emission).
For phosphoflow staining cells were starved for 4 h at 37 ◦ C in RPMI-1640 medium
without any supplements and fixed with 2% methanol-free formaldehyde for 15 min at RT.
After centrifugation, cells were permeabilized with methanol for 30 min at −20 ◦ C, incu-
bated with pSTAT5 or isotype control antibody (1:50 in 0.1% BSA/DPBS), and fluorescence
was measured for mKO2 (561 nm excitation and 581 ± 15 nm emission) and AlexaFluor647
(640 nm excitation and 670 ± 14 nm emission). In starved Ba/F3 cells, pSTAT5 was de-
tected as described above, while V5-tagged RUNX1-JAK2 was detected separately with
primary anti-V5 (1:1000) and secondary antimouse-IgG-AlexaFluor-488 antibodies (1:2000;
488 nm excitation and 530 ± 30 nm emission). Intact single cells were gated according to
forward and sideward scatter and analyzed using FlowJo 10.5.2. Antibodies are listed in
Supplementary Table S2.Int. J. Mol. Sci. 2021, 22, 7576 15 of 18
4. Conclusions
We have established an in vitro model system, which allows interrogation of the
impact of leukemia-associated fusions on hematopoietic differentiation and in a proof-
of-principle study investigated RUNX1-JAK2. Following insertion of the fusion into one
endogenous RUNX1 allele of hiPSCs, we observed a decrease in hematopoietic progenitor
output, which is most likely attributable to RUNX1 haploinsufficiency. Expression of
the RUNX1-JAK2 fusion protein led to constitutive STAT5 phosphorylation, but did not
elicit significant effects on clonogenicity. However, RNA-seq analyses of RUNX1-JAK2-
expressing hematopoietic cells revealed significant upregulation of genes related to the
JAK-STAT and MYC pathways. In summary, the described combination of precise knock-in,
hematopoietic differentiation of isogenic hiPSC lines, and targeted fusion protein degra-
dation represents a versatile well-controlled approach to study oncogenic mechanisms in
leukemia development.
Supplementary Materials: The following Supplementary data are available online at https://www.
mdpi.com/article/10.3390/ijms22147576/s1.
Author Contributions: K.F. and S.S. conceived, designed, and supervised the project. K.F. and
A.-M.H. performed the experiments. K.F. and D.S. analyzed and interpreted the data. K.N. provided
the genetic data of the patient. K.F., A.-M.H., D.S., K.N. and S.S. wrote and approved the manuscript.
All authors have read and agreed to the published version of the manuscript.
Funding: This project was funded by the Austrian Research Promotion Agency (FFG grant #843456
to K.F.), the Austrian Society for Pediatrics and Adolescent Medicine (ÖGKJ scientific prize 2016 to
D.S.) and the St. Anna Kinderkrebsforschung GmbH.
Institutional Review Board Statement: Ethical review and approval were waived for this study
since human patient material was solely subjected to the routine diagnostics procedure.
Informed Consent Statement: Patient consent was waived since material was solely subjected to the
routine diagnostic procedure and neither identity nor personal data of patient P1 were disclosed.
Data Availability Statement: Gene expression profiling data have been deposited into the NCBI
Gene Expression Omnibus database (accession number GSE159261).
Acknowledgments: We thank all people who are conducting the routine diagnostic work-up of
leukemia samples, in particular, Margit König, Sabrina Haslinger and Andrea Inthal; and Oskar A.
Haas as head of the entire team. Furthermore, we thank Georg Winter, Nathanael Gray, Meinrad
Busslinger, Eric Kowarz, Rolf Marschalek and Herbert Strobl for providing reagents, Martin Distel,
Dieter Printz and Julia Stemberger for technical assistance with confocal microscopy and flow
cytometry, and the Vienna BioCenter Core Facilities (VBCF) Next Generation Sequencing Unit
for RNA-seq.
Conflicts of Interest: The authors declare no conflict of interest.
References
1. Roberts, K.G.; Mullighan, C.G. The Biology of B-Progenitor Acute Lymphoblastic Leukemia. Cold Spring Harb. Perspect. Med.
2020, 10, a034835. [CrossRef]
2. Tasian, S.K.; Hunger, S.P. Genomic characterization of paediatric acute lymphoblastic leukaemia: An opportunity for precision
medicine therapeutics. Br. J. Haematol. 2017, 176, 867–882. [CrossRef]
3. Schwab, C.; Harrison, C.J. Advances in B-cell Precursor Acute Lymphoblastic Leukemia Genomics. Hemasphere 2018, 2, e53.
[CrossRef] [PubMed]
4. Moorman, A.V. New and emerging prognostic and predictive genetic biomarkers in B-cell precursor acute lymphoblastic leukemia.
Haematologica 2016, 101, 407–416. [CrossRef] [PubMed]
5. Barrington-Trimis, J.L.; Cockburn, M.; Metayer, C.; Gauderman, W.J.; Wiemels, J.; McKean-Cowdin, R. Trends in childhood
leukemia incidence over two decades from 1992 to 2013. Int. J. Cancer 2017, 140, 1000–1008. [CrossRef]
6. Roberts, K.G.; Li, Y.; Payne-Turner, D.; Harvey, R.C.; Yang, Y.L.; Pei, D.; McCastlain, K.; Ding, L.; Lu, C.; Song, G.; et al. Targetable
kinase-activating lesions in Ph-like acute lymphoblastic leukemia. N. Engl. J. Med. 2014, 371, 1005–1015. [CrossRef]
7. Roberts, K.G. The biology of Philadelphia chromosome-like ALL. Best Pract. Res. Clin. Haematol. 2017, 30, 212–221. [CrossRef]
[PubMed]You can also read