Multiplexed single-cell profiling of chromatin states at genomic loci by expansion microscopy
←
→
Page content transcription
If your browser does not render page correctly, please read the page content below
Nucleic Acids Research, 2021 1
                                                                                                                        doi: 10.1093/nar/gkab423

Multiplexed single-cell profiling of chromatin states at
genomic loci by expansion microscopy
Marcus A. Woodworth 1 , Kenneth K.H. Ng2 , Aaron R. Halpern1 , Nicholas A. Pease2 ,
Phuc H.B. Nguyen2 , Hao Yuan Kueh2,* and Joshua C. Vaughan1,3,*
1
 Department of Chemistry, University of Washington, Seattle, WA 98195, USA, 2 Department of Bioengineering,

                                                                                                                                                              Downloaded from https://academic.oup.com/nar/advance-article/doi/10.1093/nar/gkab423/6287849 by guest on 17 August 2021
University of Washington, Seattle, WA 98195, USA and 3 Department of Physiology and Biophysics, University of
Washington, Seattle, WA 98195, USA

Received November 28, 2020; Revised April 09, 2021; Editorial Decision April 30, 2021; Accepted May 07, 2021

ABSTRACT                                                                        GRAPHICAL ABSTRACT
Proper regulation of genome architecture and ac-
tivity is essential for the development and function
of multicellular organisms. Histone modifications,
acting in combination, specify these activity states
at individual genomic loci. However, the methods
used to study these modifications often require ei-
ther a large number of cells or are limited to tar-
geting one histone mark at a time. Here, we devel-
oped a new method called Single Cell Evaluation of
Post-TRanslational Epigenetic Encoding (SCEPTRE)
that uses Expansion Microscopy (ExM) to visualize
and quantify multiple histone modifications at non-                             INTRODUCTION
repetitive genomic regions in single cells at a spatial
resolution of ∼75 nm. Using SCEPTRE, we distin-                                 Proper regulation of genome activity and architecture is
guished multiple histone modifications at a single                              critical for development, growth, and function of a multi-
                                                                                cellular organism (1,2). Regulation occurs in large part at
housekeeping gene, quantified histone modification
                                                                                the nucleosome, where ∼147 bp of DNA wrap around an
levels at multiple developmentally-regulated genes                              octamer of 4 different histone pairs: H2A, H2B, H3 and
in individual cells, and evaluated the relationship be-                         H4 (3). Various residues found at the N and C-terminal
tween histone modifications and RNA polymerase                                  tails of these histones can acquire post-translational modi-
II loading at individual loci. We find extensive vari-                          fications, such as acetylation and methylation, which grant
ability in epigenetic states between individual gene                            nucleosomes the ability to either participate in organized
loci hidden from current population-averaged mea-                               compaction of chromatin or to recruit transcriptionally
surements. These findings establish SCEPTRE as a                                relevant protein complexes (4,5). Researchers have there-
new technique for multiplexed detection of combi-                               fore suggested that these modifications, also known as hi-
natorial chromatin states at single genomic loci in                             stone marks, act as a code for the epigenetic state of ge-
single cells.                                                                   nomic regions (6,7). Although several sequencing-based
                                                                                methods are available for studying distinct histone modifi-
                                                                                cations (i.e. ChIP-seq) (8,9), chromatin accessibility (10,11),
                                                                                genomic contact frequencies (12,13), and genomic nuclear
                                                                                locations (14), these methods are either unable to resolve
                                                                                cell-to-cell variations or are limited to studying one histone
                                                                                modification at a time. Therefore, the role these marks play

* To
   whom correspondence should be addressed. Tel: +1 206 543 4644; Email: jcv2@uw.edu
Correspondence may also be addressed to Hao Yuan Kueh. Tel: +1 206 543 5913; Email: kueh@uw.edu
Present addresses:
Joshua C. Vaughan, University of Washington, Department of Chemistry, Box 351700, Seattle, WA 98195-1700, USA.
Hao Yuan Kueh, Department of Bioengineering, 3720 15th Ave NE, Seattle, WA 98195, USA.


C The Author(s) 2021. Published by Oxford University Press on behalf of Nucleic Acids Research.
This is an Open Access article distributed under the terms of the Creative Commons Attribution License (http://creativecommons.org/licenses/by/4.0/), which
permits unrestricted reuse, distribution, and reproduction in any medium, provided the original work is properly cited.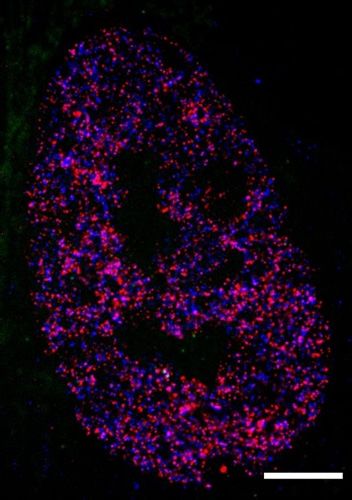
2 Nucleic Acids Research, 2021

in controlling chromatin structure and gene expression at         MATERIALS AND METHODS
the single cell and single locus level remains poorly under-
                                                                  Reagents
stood and vigorously debated.
   To tackle this problem, super-resolution fluorescence          The following primary antibodies were purchased and
microscopy techniques have been used to observe more              used for immunofluorescence: Human anti-centromeres
closely how histone marks impact chromatin organiza-              (Antibodies Incorporated, 15-235), Mouse anti-H3K4me3
tion within a cell’s nucleus. Using Stochastic Optical Re-        (EMD Millipore, 05-1339-S), Mouse anti-RNA polymerase
construction Microscopy (STORM) (15,16), researchers              II CTD repeat YSPTSPS phosphorylated at Serine 5 (Ab-
saw that nucleosomes form clusters that vary in size and          cam, ab5408). The following primary antibodies, which
nuclear distribution depending on a cell’s developmental          were ENCODE-validated (www.encodeproject.org) (27),

                                                                                                                               Downloaded from https://academic.oup.com/nar/advance-article/doi/10.1093/nar/gkab423/6287849 by guest on 17 August 2021
stage or what histone marks they present (17,18). Oth-            were purchased and used for immunofluorescence and/or
ers have combined STORM with DNA Fluorescence in                  CUT&RUN (28,29) followed by sequencing: Rabbit anti-
situ hybridization (FISH) to map spatial aspects of ge-           H3K4me3 (Active motif, 39159), Rabbit anti-H3K27me3
nomic loci with a spatial resolution comparable to the            (Active Motif, 39155), Rabbit anti-H3K27ac (Active Motif,
observed sizes of these nucleosomal clusters (19). Collec-        39133), Mouse anti-H3K27me3 (Active Motif, 61017). The
tively, these studies suggest that concurrent visualization       following unconjugated secondary antibodies were pur-
of DNA and histone modifications with super-resolution            chased from Jackson ImmunoResearch: Donkey anti-rabbit
microscopy could enable profiling chromatin states at the         (711-005-152) and Donkey anti-human (709-005-149). The
level of single loci. However, most studies to date have          following conjugated secondary antibodies were purchased
viewed histone marks and genes separately, because com-           from Jackson ImmunoResearch: Donkey anti-rabbit conju-
bining immunofluorescence and DNA FISH can be chal-               gated with Alexa Fluor 488 (711-545-152) and Donkey anti-
lenging due to the harsh solvents and/or high tempera-            mouse conjugated with Alexa Fluor 488 (715-545-150).
tures used in FISH protocols (20–23). Although researchers           The following enzymes were purchased: proteinase K
have visualized immunolabeled histone marks across whole          (Thermo Fisher Scientific, EO0491), RNase A (Thermo
chromosomes (21,22), or at repetitive and highly abundant         Fisher Scientific, EN0531), alcohol oxidase (Sigma-
ALU elements regions labeled with an alternative hybridiza-       Aldrich, A2404-1KU), catalase (Sigma-Aldrich, C100),
tion strategy (24), there are still no methods available to       Phusion Hot-start master mix (New England Biolabs,
study multiple histone marks at individual non-repetitive         M0536L), DNase I (New England Biolabs, M0303A)
genomic loci at the level of individual nucleosomal clus-         and Maxima H Minus RT Transcriptase (Thermo Fisher
ters. A better understanding of histone mark heterogene-          Scientific, EP0752).
ity at individual loci would require a new method capa-              The following chemical reagents were purchased: 10×
ble of further decoupling immunofluorescence and FISH             phosphate-buffered saline (PBS, Fisher Bioreagents,
labeling.                                                         BP399-1), 32% paraformaldehyde aqueous solution (PFA,
   We therefore developed a new method, called Single             Electron Microscopy Sciences, RT15714), 4-(1,1,3,3-
Cell Evaluation of Post-TRanslational Epigenetic Encod-           tetramethylbutyl)phenyl-polyethylene     glycol    (Triton
ing (SCEPTRE), which uses expansion microscopy (ExM)              X-100, Sigma-Aldrich, X100), Bovine serum albumin
(25,26) to combine DNA FISH with immunofluorescence               (BSA, Rockland Immunochemicals Inc., BSA-50), ATTO
and quantify histone mark fluorescence signals at individ-        488 NHS-ester (ATTO-TEC GmbH, AD 488-35), Alexa
ual loci within the nucleus. ExM preserves the signal of          Fluor 568 NHS-ester (Thermo Fisher Scientific, A-20003),
antibody labels on protein structures by covalently link-         methacrylic acid NHS-ester (MA-NHS, Sigma-Aldrich,
ing antibodies and proteins to a swellable hydrogel that is       730300), 40% acrylamide aqueous solution (Bio-Rad
grown within the sample (25,26). This signal preservation         Laboratories, 1610140), 2% bis-acrylamide aqueous so-
enables subsequent use of relatively harsh conditions, such       lution (Bio-Rad Laboratories, 1610142), 97% sodium
as high temperatures and organic solvents, for labeling of        acrylate powder (Sigma-Aldrich, 408220), ammonium
genomic DNA by FISH without loss of the antibody sig-             persulfate (APS, Thermo Fisher Scientific, 17874),
nal. At the same time, ExM enables the isotropic expan-           tetramethylethylenediamine (TEMED, Thermo Fisher
sion of specimens with low distortion so that these speci-        Scientific, 17919), 10× tris-acetate-EDTA (TAE, Fisher
mens may be examined with a high spatial resolution (here         Bioreagents, BP2434-4), guanidine hydrochloride powder
∼75 nm) in the expanded state even when using conven-             (Sigma-Aldrich, G3272), sodium azide (Sigma-Aldrich,
tional microscopes with a diffraction-limited resolution of       S2002), poly-L-lysine (Sigma-Aldrich, P8920), sodium
∼250 nm. We demonstrate the capabilities of SCEPTRE               bicarbonate (VWR, 470302), formamide (Fisher Chemical,
for a variety of systems: (i) we compared signals of multi-       F84-1), 20× saline sodium citrate (SSC, Sigma-Aldrich,
ple histone marks at a housekeeping gene locus; (ii) we dis-      S6639), 50% OmniPur Dextran Sulfate (EMD Millipore,
tinguished histone mark signals between developmentally-          3730), Tween 20 (Sigma-Aldrich, P9416), Hoechst 33258
regulated genes in a single cell; (iii) we demonstrate a corre-   (Sigma-Aldrich, B2883-25MG), Tris Base (Fisher scientific,
lation between histone marks and paused RNA polymerase            BP152-500), methyl viologen dichloride hydrate (Sigma-
II in a single region. Together, these experiments establish      Aldrich 856177), L-ascorbic acid (Fisher scientific, A61-
SCEPTRE as a powerful tool to study the role histone              25), digitonin (EMD Millipore, 300410), glycogen (VWR,
marks have at individual genes within the nuclei of single        97063-256), sodium chloride (NaCl, Thermo Fisher Scien-
cells.                                                            tific, S271500), Ethylenediaminetetraacetic acid disodium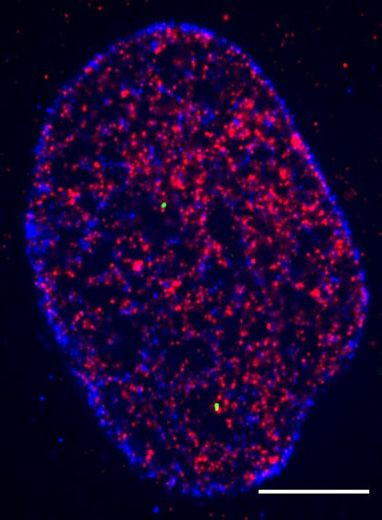
Nucleic Acids Research, 2021 3
salt dihydrate (EDTA, Sigma-Aldrich, E6635), Ethylene which had been originally fixed in EtOH:MeOH were post-
glycol-bis(2-aminoethylether)-N,N,N ,N -tetraacetic acid fixed in 4% PFA in 1× PBS for 10 min, then washed three
(EGTA, Sigma-Aldrich, E4378) and calcium chloride times with 1× PBS azide. Immunostained samples were ei-
dihydrate (VWR, 0556). ther immediately gelled or stored in 1× PBS azide at 4◦ C
Alpha-satellite, GAPDH set, adapter and conjugated re- for up to ∼1 week for later use (see Supplementary table S1
porter oligonucleotide probe sets were obtained from Inte- for more details).
grated DNA Technologies (IDT). A Precise Synthetic Oligo
Pool (SC1966-12) containing probes covering the MYL6, Cell gelation, digestion and expansion
HOXC and LINC-PINT regions was obtained from Gen-
Expansion microscopy was adapted from a previous pro-
Script (for a list of sequences, see supplementary spread-
Downloaded from https://academic.oup.com/nar/advance-article/doi/10.1093/nar/gkab423/6287849 by guest on 17 August 2021
tocol (26), and goes as follows: immunolabeled cells were
sheet).
treated with freshly prepared 5 mM MA-NHS in 1×
PBS for 10 min, then washed three times with 1× PBS.
Cell culture Cells were incubated in monomer solution (1× PBS with
2 M NaCl, 2.5% (w/w) acrylamide, 0.15% (w/w) N,N’-
h-TERT RPE1 cells were cultured and grown to ∼80% con-
methylenebisacrylamide and 8.625% (w/w) sodium acry-
fluency using Dulbecco’s modified eagle medium (Gibco,
late) for 10 min before gelation with 0.15–0.2% (w/v) APS
11995065) supplemented with 100 units/ml of penicillin and
and 0.2% TEMED (w/w) at room temperature for at least
streptomycin (Gibco, 15140122), 1% nonessential amino
30 min in a sealed container backfilled with nitrogen gas.
acids (Gibco, 11140050), and 10% fetal bovine serum
After polymerization, the cell-embedded hydrogel was gen-
(Gibco, 26140079). Cells were then trypsinized with 0.25%
tly removed from the 12 mm coverslip, then incubated in di-
trypsin–EDTA (Gibco, 25200056) and seeded at ∼75,000
gestion solution (1× TAE with 0.5% (v/v) Triton X-100, 0.8
cells per well on top of round coverslips (no. 1.5, ∼12 mm
M guanidine HCl and 8 units/ml proteinase K) overnight at
diameter) placed within 24-well culture plates. After grow-
37◦ C. The digested sample was both washed and expanded
ing overnight (∼18 h), the cells were briefly rinsed with 1×
by placing the sample in deionized water, which was re-
PBS then fixed with either 4–10% PFA in 1× PBS for 10 min
placed every 15–20 min for at least three times. Hydrogels
at room temperature (∼22◦ C), or in cold EtOH:MeOH (1:1)
were stored in 2× SSC at 4◦ C, typically up to ∼1 month.
for 6 min at –20◦ C. Fixed cells were washed three times with
1× PBS, then stored in 1× PBS azide (1× PBS with 3 mM
DNA fluorescence in situ hybridization
sodium azide) at 4◦ C before use (see Supplementary table
S1 for more details). The general DNA FISH procedure for non-repetitive ge-
nomic regions (GAPDH, MYL6, HOXC and LINC-PINT)
was adapted from previous protocols (30,31), and goes as
Secondary antibody fluorophore conjugation
follows: Briefly, a small (∼3.5 mm × 3 mm × 2 mm) piece
Conjugation was performed by mixing 40 l of a secondary of gel from each expanded cell sample was first incubated
antibody solution at a concentration of 1.3 mg/ml with 5 l in hybridization buffer (2× SSC with 50% (v/v) formamide
of a 1 M sodium bicarbonate solution, then adding 2–5 g and 0.1% (v/v) Tween 20) for 10 min at room tempera-
of an NHS ester functionalized fluorophore. The mixture ture. Samples were incubated in pre-heated hybridization
was left to react for 30 min protected from ambient light buffer for 30 min at 60◦ C. A hybridization mixture (2×
and the crude reaction mixture was passed through a NAP- SSC with 50% formamide (v/v), 10% dextran sulfate (w/v),
5 column (GE Healthcare Life Sciences, 17085301) for col- 0.1% (v/v) Tween 20, 3 mM sodium azide, ∼10-20 nM oligo
lection and purification of the fluorophore-conjugated sec- probe library per kb of targeted genomic region, and 1–
ondary antibody. Further characterization of the secondary 1.5× concentration of oligo reporters and adapters to oligo
antibody was done by ultraviolet/visible absorption spec- probe library) specific to each sample was preheated to 90◦ C
troscopy. for 5–10 min and then added to each sample at an ap-
proximate 2:1 volume ratio. Samples were denatured at 90–
92.5◦ C for 2.5–10 min and hybridized at 37–42◦ C overnight.
Immunostaining procedure
Samples were washed three times, 15 min each time: first
The immunostain procedure was adapted from previous with preheated 2× SSCT (2× SSC with 0.1% (v/v) Tween
protocols (17,18), and goes as follows: fixed RPE1 cells were 20) at 60◦ C, then with preheated 2× SSCT at 37◦ C, and
incubated first in permeabilization solution (1× PBS with lastly with 2× SSCT at room temperature. Samples were
0.1% (v/v) Triton X-100) for 10 min, then washed three stored at 4◦ C in 0.2× SSCT (0.2× SSC with 0.01% (v/v)
times with 1× PBS. After permeabilization, cells were incu- Tween 20) until needed (within a week). Samples were fully
bated in block solution (1× PBS with 10% (w/v) BSA and expanded to ∼4× the original size with deionized water at
3 mM sodium azide) for 1 h at room temperature, followed 4◦ C, replacing the water twice every 10 min (see Supplemen-
by incubation in primary solution (2–5 g/ml of primary tary table S1 for more details).
antibodies diluted in block) overnight at 4◦ C. The sample The DNA FISH procedure for the repetitive alpha-
was washed with block three times (10 min each time), then satellite region was done as follows: expanded RPE1 cells
incubated in secondary solution (2–3 g/ml of secondary were incubated for 1 h at room temperature in 1× PBS. The
fluorophore-conjugated antibodies in block) for 1–2 h at sample was then incubated in 1× PBS supplemented with
room temperature. The sample was washed once for 10 min 100 g/ml of RNase A for 1 h at 37◦ C. After RNA diges-
with block, then three times with 1× PBS azide. Samples tion, the sample was incubated in 2× SSCT for 30 min at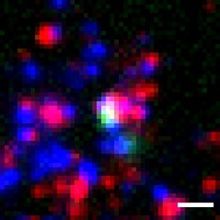
4 Nucleic Acids Research, 2021
room temperature. The samples were then incubated in hy- 89125-040) with the PCR amplification settings adjusted to
bridization buffer for 30 min at room temperature. The gel have simultaneous annealing and extension steps at 60◦ C
was transferred to a hybridization buffer containing 200 nM for 10 seconds. Library products between 200–300 base
of alpha-satellite oligonucleotide probe. The sample was de- pairs were selected using Agencourt AMPure XP beads
natured for 15 min at 95◦ C. Gels were washed once in 20× (Beckman Coulter, A63880) then sequenced with an Illu-
SSC for 15 min at 37◦ C, then in 2× SSC for 1 h at 37◦ C. mina MiSeq system at the University of Washington North-
The samples were incubated in 2× SSC with 200 nM alpha- west Genomics Center with paired-end 25 bp sequencing
satellite adapter probe and 600 nM of reporter probe A for read length and TruSeq primer standard for ∼6 million
30 min at 37◦ C. The sample was washed with 20× SSC for reads per condition.
20 min at 37◦ C and lastly with 2× SSC for 20 min at room Paired-end sequencing reads were aligned separately to
Downloaded from https://academic.oup.com/nar/advance-article/doi/10.1093/nar/gkab423/6287849 by guest on 17 August 2021
temperature. After this, the alpha-satellite sample was ex- human (GRCh38/hg38) and yeast genomes using Bowtie2
panded to ∼3× the original size by incubating the sample (32) with the previously suggested specifications for map-
in 0.2× SSC, then a second time in 0.2× SSC with 1 g/ml ping CUT&RUN sequencing data: (29) –local –very-
of Hoechst 33258 (see Supplementary table S1 for more de- sensitive-local –no-unal –no-mixed –no-discordant -I 10 -
tails). X 700. Alignment results were converted to BAM files with
SAMtools (33) and then to BED files with BEDTools (34).
Sample mounting and imaging Reads were sorted and filtered to remove random chromo-
somes, then, with BEDTools genomecov, histograms were
For expanded samples using Alexa Fluor 750 fluorophore-
generated for the mapped reads using spiked-in yeast reads
conjugated reporters, samples were incubated in imaging
and the number of cells for each condition as scaling factors.
buffer (10 mM Tris buffer (pH 8) with 1 mM Methyl vi-
The results were visualized using the WashU Epigenome
ologen, 1 mM ascorbic acid and 2% (v/v) MeOH) for 10
Browser (https://epigenomegateway.wustl.edu/) (35).
min. Before imaging, samples were first adhered to a poly-
L-lysine–coated rectangular no. 1.5 coverslip, then they were
supplemented with ∼30 units/ml alcohol oxidase and 0.2% Oligonucleotide probe design and amplification
(w/v) catalase. Samples that did not have Alexa Fluor 750
DNA FISH probes were designed using OligoMiner
were adhered to a poly-L-lysine–coated rectangular no. 1.5
(36), with standard buffer, length and melting tempera-
coverslip. All samples were imaged with either a Leica SP5
ture conditions, with the exception of the target MYL6,
inverted confocal point scanning microscope at the Univer-
which had the following adaptations: base length between
sity of Washington Biology Imaging Facility using a Plan
28–42 nucleotides and melting temperature between 38
Apo CS 63× 1.2 numerical aperture (NA) water-immersion
and 46◦ C. Orthogonal DNA sequences, which were previ-
objective, a homebuilt spinning disk confocal microscope
ously screened for DNA FISH purposes (19,37), were ap-
using a Nikon CFI60 Plan Apochromat 60× 1.27 NA
pended to each probe as adapter/reporter hybridizing re-
water-immersion objective, or a conventional wide-field epi-
gions specific to each gene, along with a primer set for
fluorescence inverted Nikon Ti-S microscope using a Nikon
amplification. Designed probes were purchased as part of
CFI Plan Apo VC 60× 1.2 NA water-immersion objective
an oligo pool from GenScript, and the probes were am-
(see Supplementary table S1 for more details).
plified using a T7/Reverse-Transcriptase amplification pro-
tocol previously published (31), in an RNase-free environ-
CUT&RUN H3K4me3, H3K27me3 and H3K27ac profiling
ment with the following adaptations: After PCR amplifi-
CUT&RUN was performed as previously described (29), cation with a Phusion Hot-start master mix and purifica-
with the following adaptations: 250 000 trypsinized RPE1 tion with a DNA Clean & Concentrator-5 kit (Zymo Re-
cells were used per antibody condition. Cells were bound search, D4013), probes were T7 amplified with a HiScribe
to Concanavalin A coated magnetic beads (Bangs Labo- T7 Quick High Yield RNA Synthesis Kit (New England
ratories, BP531), permeabilized with 0.025% (w/v) digi- BioLabs, E2050S) supplemented with 1.3 units/l RNase-
tonin, then incubated overnight with 5 g of either anti- OUT (ThermoFisher Scientific, 10777019) for 16 h at 37◦ C.
H3K4me3 (Active Motif, 39159), anti-H3K27me3 (Active DNA was digested with DNase I for 1 h at 37◦ C. RNA
Motif, 39155) or anti-H3K27ac (Active Motif, 39133) in was purified from the sample by first adding LiCl solution
500 l of solution at 4◦ C. Cells were washed then incu- from the HiScribe Kit at a 1:7 ratio to the RNA solution,
bated with protein A-MNase fusion protein (a gift from S. incubating the solution at −20◦ C for 30 min and pelleting
Henikoff, FHCRC) for 15 min at room temperature. After the precipitated RNA by centrifugation (∼17 000 g) for 15
another wash, cells were incubated with 2 mM calcium chlo- min at 4◦ C. The supernatant was removed from the tube
ride for 30 min at 0◦ C to induce MNase cleavage activity. and the pellet was washed with 70% EtOH. The RNA pel-
The reaction was stopped by adding 100 l of 2× STOP let was centrifuged (∼17 000 g) for 5 min at 4◦ C and, af-
buffer (200 mM NaCl, 20 mM EDTA, 4 mM EGTA, 50 ter carefully removing the supernatant, the pellet was left
g/ml RNase A, 50 g/ml glycogen and 2 pg/ml of yeast to dry for 3 min. The RNA was dissolved in water and
spike-in DNA) to each sample. Cleaved histone–DNA com- ∼50 g of RNA was added to Maxima H Minus RT buffer
plexes were isolated by centrifugation and DNA was ex- with 2.86 units/l Maxima H Minus RT Transcriptase, 2.3
tracted with a NucleoSpin PCR Clean-up kit (Macherey- units/l RNaseOUT, 1 mM dNTP and 14 M Forward
Nagel, 740609). project primer. The solution was incubated at 50◦ C for 2
Library preparation for each CUT&RUN antibody con- h, then samples were digested with 100 g/ml RNase A for
dition was done with a KAPA Hyper Prep Kit (VWR, 1 h at 37◦ C. After RNase digestion, oligonucleotide probes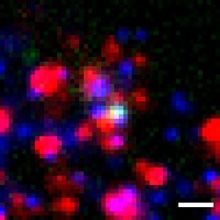
Nucleic Acids Research, 2021 5

were purified using a DNA Clean & Concentrator-25 kit            with a volume approximately equal to the mean volume
(Zymo Research, D4033) with Oligo binding buffer (Zymo           of the selected FISH clusters. Mean fluorescence intensities
Research, D4060-1-10). The final product was assumed to          of each immunofluorescence channel were determined for
have full yield (for a list of sequences, see supplementary      these random clusters (see Supplementary table S2 for more
spreadsheet).                                                    details). For the first image stack, each step was visually in-
                                                                 spected to confirm proper threshold levels.
                                                                   Data obtained from the segmented clusters were in-
Image processing and analysis for SCEPTRE profiling
                                                                 spected using contour and scatter plots with MATLAB
Image processing and analysis was performed using MAT-           built-in functions, or violin plots, using the MATLAB script
LAB. First, raw images obtained from immunofluorescence          violinplot (https://github.com/bastibe/Violinplot-Matlab).

                                                                                                                                   Downloaded from https://academic.oup.com/nar/advance-article/doi/10.1093/nar/gkab423/6287849 by guest on 17 August 2021
channels were smoothed with a gaussian filter using 1–2          Contours were smoothed with a gaussian filter using 1 stan-
standard deviations within a 3 × 3 × 3 matrix. Smoothed          dard deviation within a 5 × 5 matrix. Pearson correlation
images were contrast adjusted, where background pixel lev-       coefficients were determined using the MATLAB function
els were clipped at an adaptively determined threshold for       corrcoef.
each image set at 2–9 third quartiles away from the median
of each image stack histogram. The contrast adjusted im-
                                                                 Statistical analyses
ages were binarized, either by an Otsu method or a Laplace
filter with alpha = 0.2 followed by selection of all negative    Each figure, along with their related supplementary figures,
values. A nuclear mask (generated as described below) was        represents an individual experiment where all cells were la-
applied to the binarized immunofluorescence channel and,         beled, expanded, imaged and processed under the same con-
after small components (volume < 20 voxels) were removed,        ditions. Cell numbers for each experiment were: 1 (Figure
a watershed transformation was applied to the segmented          2), 50 (Figure 3, Supplementary Figure S6 and S8), 52 (Fig-
clusters. Features, including mean fluorescence intensity of     ure 4A, Supplementary Figures S9A and S10A), 38 (Fig-
every immunofluorescence channel and overlap with clus-          ure 4C, Supplementary Figures S9B and S10B), 54 (Figure
ters of other segmented immunofluorescence channels, were        5, Supplementary Figure S13−S14), 1 (Supplementary Fig-
identified for each segmented cluster (see Supplementary ta-     ure S3), 36 (Supplementary Figure S4A), 10 (Supplemen-
ble S2 for more details). For the first image stack, each step   tary Figure S4B), 48 (Supplementary Figure S5), 10 (Sup-
was visually inspected to confirm proper threshold levels.       plementary Figure S7), 10 (Supplementary Figure S11), 40
    The nuclear mask was generated by applying the same          (Supplementary Figures S15 and S16), 20 (Supplementary
segmentation process from above to either a Hoechst stain        Figures S17 and S18).
channel or the same immunolabeled channel with a contrast           Fluorescence signal, defined as the mean fluorescence in-
adjustment done with 1–3 third quartiles clipping. The seg-      tensity for a given immunolabeled channel within a cluster
mented channel was subject to morphological dilation with        of the same experiment, was used as the main measurement
a sphere of 3 pixel radius, to fuse clusters within the nu-      for comparing histone mark or paused RNA polymerase
cleus. The convex hull was computed for the largest compo-       II levels within the segmented clusters of immunolabeled,
nent (i.e. the nucleus) after all other clusters were removed.   FISH-labeled or randomly selected regions, or between the
The segmented nucleus was morphologically eroded with            distribution of fluorescence signals for each set of clus-
the same sphere that was used to morphologically dilate the      ters. Background fluorescence signal is defined as the mean
channel (see Supplementary table S2 for more details). For       fluorescence intensity for a given immunolabeled channel
the first image stack, each step was visually inspected to       within the randomly-selected groups of background voxels
confirm proper threshold levels.                                 for H3K4me3 marks in Figure 3, H3K27me3 marks in Fig-
    After segmentation of the nuclear channel and im-            ure 4C, or for both immunolabeled channels in Supplemen-
munofluorescence channels, the FISH raw channel was seg-         tary Figure S7 and S11. The groups of background voxels
mented in the same manner with the following exceptions:         were equal in size to the median size of segmented clusters
(i) the nuclear mask was applied after smoothing and be-         for each channel.
fore contrast adjustment; (ii) clipping during contrast ad-         An arbitrary ‘on’ threshold (equal to the 5th percentile
justment was performed with a threshold of 10–15 third           of the fluorescent signal found within a respective immuno-
quartiles away from the median; (iii) no watershed transfor-     labeled cluster set) is represented in all graphs excluding
mation was applied to FISH segmented regions; (iv) clus-         violin plots, as a qualitative determinant of high or low
ters intersecting the periphery of the nuclear mask (e.g.        fluorescence signal within each set of clusters. Correlation
highly fluorescent contaminant in FISH channel next to nu-       coefficients were determined for each comparison between
cleus) were removed. Features, including mean fluorescence       fluorescence signals within a set of clusters. A right-tailed
intensity of every immunofluorescence channel and over-          Wilcoxon rank sum test was used to determine if for a given
lap with each immunofluorescence segmented cluster, were         experiment the median fluorescence signal of a cluster set
identified for each segmented FISH cluster. Since the seg-       was significantly higher than the median signal in randomly
mented FISH channel can contain small and dim clusters           selected regions or a separate set. All numbers correspond-
that, by visual inspection, do not correspond to the FISH-       ing to fraction of overlap and distance are represented as
labeled genomic loci, small clusters (volume < 20–80 voxels)     mean ± standard deviation.
were filtered out before analyses. After segmentation of the        To better understand the detection limitations for im-
FISH channel, randomly selected cubic regions were gen-          munostaining a particular histone mark, cells were con-
erated throughout the nuclear region of each image stack         currently labeled with an antibody of interest and an al-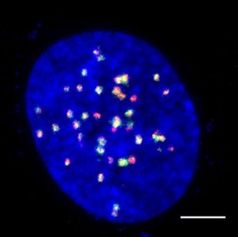
6 Nucleic Acids Research, 2021

ternative antibody, both targeting the same mark. The de-        proteins, as well as significant overlap between these two re-
tection efficiency based on colocalization is defined as the     gions. To quantify this degree of overlap, we created an au-
percent of voxels from the clusters of the alternative anti-     tomated image analysis software routine in MATLAB to
body that intersect with the clusters of the antibody of in-     segment individual regions corresponding to centromeres
terest. This colocalization is interpreted as a lower bound      and centromere-associated proteins, and then quantified
measurement of detection efficiency due to the challenges        their degree of co-localization (Supplementary Figure S2).
of targeting the same epitope with two competing antibod-        From this analysis, we found that DNA-labeled regions
ies. A fluorescence-based analysis was used instead to eval-     had almost complete fractional overlap with centromere-
uate the detection efficiency of the antibody of interest. In    associated proteins (0.97 ± 0.06). Furthermore, the dis-
this analysis, we determine the percent of clusters from the     tance between the nearest-neighbor centroids of the pro-

                                                                                                                                  Downloaded from https://academic.oup.com/nar/advance-article/doi/10.1093/nar/gkab423/6287849 by guest on 17 August 2021
alternative antibody distribution that are above the back-       tein and DNA labeled regions was small relative to the
ground (i.e. >99.9% of the background fluorescence signal        average radius for either region (77 ± 85 nm versus 234
distribution) for the fluorescence signal of the antibody of     ± 68 nm (anti-cen.) and 224 ± 65 nm (␣-cen.), respec-
interest.                                                        tively). We then quantified the fluorescence signal of labeled
                                                                 centromere-associated proteins at individual centromeric
RESULTS                                                          DNA clusters, along with randomly selected regions of
                                                                 comparable size to these FISH clusters (Figure 2B). While
SCEPTRE uses ExM to co-localize immunolabeled proteins
                                                                 immunofluorescence and FISH-labeled regions maintained
at DNA FISH labeled genomic regions
                                                                 similar anti-centromere fluorescence signals, these regions
The labeling of individual genomic loci by DNA fluores-          showed much higher signals compared to randomly selected
cence in situ hybridization (FISH) has provided a power-         regions. Therefore, due to the high overlap between the
ful tool for visualizing chromatin structure in single cells     FISH-labeled and immunolabeled regions, the high anti-
(30,38–40). While DNA FISH could be combined with im-            centromere signal in the FISH-labeled regions, and the fact
munofluorescence labeling to enable concurrent visualiza-        that the anti-centromere labeled structures did not shift
tion of chromatin modification states and associated pro-        much between pre- and post-expansion (Supplementary
teins, integration of these two techniques has been challeng-    Figure S3), we concluded that ExM can co-localize the sig-
ing, because the harsh conditions required to melt double-       nal of protein and DNA components of a genomic region
stranded genomic DNA during labeling (e.g., treatment            within a nucleus.
with hot formamide) may remove antibody labels applied
before FISH or may compromise the antigenicity of rele-
                                                                 SCEPTRE resolves multiple histone modifications at single
vant epitopes for post-FISH immunolabeling (Supplemen-
                                                                 gene loci in single cells
tary Figure S1) (20–23). To overcome this challenge, we
employed expansion microscopy (ExM) as a means to pre-           To determine whether SCEPTRE can distinguish between
serve the signal of immunolabeled protein structures during      multiple histone marks at a single, non-repetitive genomic
DNA FISH labeling. In ExM, immunolabeled structures              region, we concurrently visualized two histone marks,
are covalently linked to a swellable hydrogel polymer scaf-      H3K4me3 and H3K27me3, at the house-keeping gene
fold that is isotropically expanded in deionized water in or-    GAPDH (Figure 3). GAPDH encodes for glyceraldehyde-
der to reveal features closer than the ∼250 nm diffraction       3-phosphate dehydrogenase, which is highly expressed in
limit of light in the expanded state (25,26). ExM not only       many cell types (43) due to its essential role in metabolism;
provides a high spatial resolution (∼75 nm or better when        (44) therefore, histone H3K4me3, commonly found at ac-
using a standard confocal microscope with ∼4× expanding          tive gene promoters (45), is expected to be present at
gels), but also enables antibody labels to be covalently teth-   GAPDH, whereas histone H3K27me3, which is associated
ered to the hydrogel scaffold, such that DNA FISH can sub-       with repressed regions (46), is expected to be absent. Us-
sequently be performed without loss of antibody fluores-         ing SCEPTRE, we measured the fluorescence signals of
cence. ExM has previously been combined with DNA FISH            immunolabeled H3K4me3 and H3K27me3 marks at the
to either visualize the HER2 gene in tissue (41), or to visu-    FISH-labeled GAPDH locus, along with the fraction of
alize repetitive centromere regions in plants (42). However,     overlap between GAPDH and H3K4me3 or H3K27me3
this combination has not yet been used to determine the          clusters (Figure 3).
density of a protein structure, such as histone mark clusters,      From this analysis, we observed that GAPDH had
at specific genomic regions. We refer to this new methodol-      much higher H3K4me3 fluorescence signal compared to
ogy as Single Cell Evaluation of Post-TRanslational Epige-       H3K27me3 signal (Figure 3E and F). To our surprise, the
netic Encoding (SCEPTRE), as a tool to quantify the fluo-        H3K4me3 signal found at GAPDH varied greatly between
rescence signal of immunolabeled histone marks or proteins       loci, with some loci having high signals while others a more
structures at individual FISH-labeled genomic loci within        baseline level (Figure 3G). These results were the same when
individual cells (Figure 1).                                     only one of the two histone marks was labeled and imaged
   To test the ability of SCEPTRE to report on DNA-              with GAPDH (Supplementary Figure S4), or when a dif-
protein associations within the nucleus, we immunostained        ferent set of antibodies was used to label H3K4me3 and
centromere-associated proteins while using DNA FISH to           H3K27me3 in RPE1 cells (Supplementary Figure S5).
co-stain the repetitive alpha-satellite DNA of centromeres          Interestingly, histone mark signals were uncorrelated be-
(Figure 2A). ExM images revealed discrete regions corre-         tween GAPDH alleles in the same cell (Supplementary Fig-
sponding to alpha-centromeres and centromere-associated          ure S6A-B), suggesting histone mark levels at alleles from
Nucleic Acids Research, 2021 7
Downloaded from https://academic.oup.com/nar/advance-article/doi/10.1093/nar/gkab423/6287849 by guest on 17 August 2021
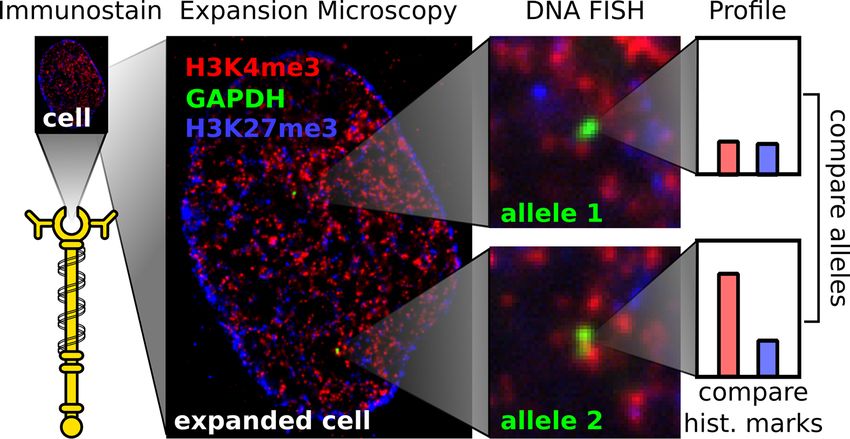
Figure 1. Workflow of SCEPTRE. (1) Histone marks or other protein structures are antibody-labeled in fixed cells. (2) The sample and antibodies are
linked to a swellable hydrogel grown within the sample. (3) The sample is digested by proteinase K. (4) The hydrogel is expanded in water. (5) DNA loci,
alleles from the same or different genes, are labeled by FISH. (6) The sample is imaged and relevant features are extracted for analysis. (7) An epigenetic
profile is constructed for each cell, comparing histone mark levels between alleles or genes.
the same gene are independently regulated. When compar- GAPDH loci was considerably lower, at 67% (Supplemen-
ing these fluorescence signals to those obtained from ran- tary Figure S7E); thus a substantial degree of heterogene-
domly selected regions across the nucleus, GAPDH showed ity in H3K4me3 levels at this locus likely reflects biological
lower H3K27me3 signals and much higher H3K4me3 sig- variability rather than limitations of antibody detection.
nals than those found at random regions. Similar to the H3K4me3 and H3K27me3 are generally thought to mark
fluorescence signal results, the mean fraction of over- distinct chromatin states, though they have been reported
lap of GAPDH with H3K4me3 clusters was higher than to colocalize to form ‘bivalent domains’ on genes primed
with H3K27me3 clusters (0.21 ± 0.21 versus 0.045 ± for transcription.(47,48) We therefore investigated the rela-
0.11, respectively). To corroborate these results, we mea- tionship between H3K4me3 and H3K27me3 clusters across
sured the density of H3K4me3 and H3K27me3 marks the nuclei of the RPE1 cells. As previously observed (18),
across the RPE1 genome for an ensemble of cells using H3K27me3 clusters preferentially inhabited the periphery
CUT&RUN followed by sequencing (28,29). Analysis of of the nucleus, whereas H3K4me3 clusters were more evenly
the CUT&RUN sequencing results revealed that a substan- distributed (Figure 3A). There was a low fraction of spatial
tial presence of H3K4me3 marks was found at the targeted overlap between H3K4me3 clusters and H3K27me3 clus-
GAPDH region and only background levels of H3K27me3 ters (0.079 ± 0.14 H3K4me3 with H3K27me3, 0.12 ± 0.16
marks were found for this same region (Figure 3H), with the H3K27me3 with H3K4me3). The H3K4me3 fluorescence
closest repressed region observed ∼500 kb away. These re- signal in H3K27me3 clusters, as well as the H3K27me3
sults demonstrate that SCEPTRE can distinguish between signal in H3K4me3 clusters, was substantially low, albeit
the abundance of two histone modifications at individual higher than the distribution of random regions (Supple-
non-repetitive genomic regions within a nucleus. mentary Figure S6C-D). We therefore plotted the frequency
To determine whether the heterogeneity of H3K4me3 of H3K4me3 and H3K27me3 signals within each of the
marks at GAPDH results from detection limitations of the other’s histone mark’s clusters, along with these signals
antibody used above (Rb × H3K4me3), we concurrently found in randomly selected regions (Supplementary Fig-
labeled H3K4me3 with Rb × H3K4me3 and an alterna- ure S8). These plots show that H3K4me3 and H3K27me3
tive antibody targeting the same mark but stained using form largely non-overlapping clusters, though there exists
a different fluorophore (Ms × H3K4me3, Supplementary a small fraction of clusters having high signal from both
Figure S7). As an initial estimate of detection efficiency, histone marks. These results suggest that H3K4me3 and
we calculated the percent of all voxels segmented for the H3K27me3 mostly form disjoint clusters, though a very
alternative antibody that also segmented for the antibody small fraction may colocalize, similar to what has been ob-
of interest. This analysis yielded a nominal detection effi- served in other differentiated cell types (49).
ciency of 26% for Rb × H3K4me3; however, this value likely
under-estimates the true detection efficiency, as the two an-
SCEPTRE quantifies histone modification levels at multiple
tibodies likely compete for the same epitope (i.e. the methy-
genomic loci in single cells
lated lysine moiety), reducing their ability to co-segment
within the same voxel, particularly at high spatial resolu- To test whether SCEPTRE can quantify histone mark sig-
tion. Therefore, as an alternative measurement of detec- nals at multiple genomic loci within the same cell, we de-
tion efficiency, we directly quantified the cumulative fluores- signed a library of FISH probes to simultaneously label
cence signal distribution for Rb × H3K4me3 within clusters three different genomic regions in RPE1 cells. The first re-
segmented with the alternate antibody (Ms × H3K4me3), gion contains MYL6, a gene on Chr12 encoding myosin
and we calculated the fraction of this signal above back- light chain-6 that is actively expressed in the eye; (50) the
ground. This analysis yielded a higher detection efficiency second contains the HOXC gene cluster, which is normally
of 88% (Supplementary Figure S7). In contrast, the proba- active in progenitors but repressed upon differentiation;
bility of detecting an antibody signal above background for (46,51) the third covers an internal region of long intergenic8 Nucleic Acids Research, 2021
passing the HOXC cluster, but were largely absent from
A MYL6 and LINC-PINT (Figure 4E).
In agreement with population-level results, H3K4me3
fluorescence signals measured using SCEPTRE were sig-
nificantly higher at MYL6 and LINC-PINT than at ran-
domly chosen clusters (Figure 4B, P < 10−5 , MYL6; PNucleic Acids Research, 2021 9
E
A
F
Downloaded from https://academic.oup.com/nar/advance-article/doi/10.1093/nar/gkab423/6287849 by guest on 17 August 2021
G
B
C
H
D
Figure 3. SCEPTRE distinguishes two histone marks at one genomic region. (A) An expanded RPE1 cell with immunolabeled H3K4me3 marks (K4me3,
red) and H3K27me3 marks (K27me3, blue), and FISH-labeled GAPDH (green). (B, C) Zoomed in views of the approximate center plane of an image
stack for each GAPDH allele in the cell seen in (A). (D) Outline of the segmented regions for H3K4me3, GAPDH, H3K27me3 and randomly selected
region clusters for the image plane seen in (C). (E) Distribution of H3K4me3 fluorescence signal (arb. = arbitrary units) within H3K4me3, randomly
selected regions (random) and GAPDH clusters. (F) Distribution of H3K27me3 fluorescence signal within H3K27me3, randomly selected regions and
GAPDH clusters. (G) H3K27me3 and H3K4me3 fluorescence signals within GAPDH clusters (green). Black lines represent the threshold ‘on’ level for
each fluorescence signal. The correlation coefficient (r) between fluorescence signals within GAPDH is shown in the top-right corner of the plot. (H)
CUT&RUN normalized counts for H3K4me3 (top) and H3K27me3 (bottom) marks in RPE1 cells for the FISH-targeted GAPDH region (highlighted).
Cluster numbers for (E). and (F). are K4me3 = 343334, K27me3 = 478825, random = 8322, GAPDH = 102. Significance determined by a right-tailed
Wilcoxon rank-sum test of histone mark fluorescence signals in GAPDH against random cluster distributions. All scale bars are in pre-expansion units.
transcriptional levels compared to MYL6 (Supplementary H3K4me3 modifications coincide with paused RNA poly-
table S3). These results suggest that, at the current spa- merase II at a transcriptionally active locus
tial resolution, adjacent genomic regions can influence each
H3K4me3 levels have been reported to correlate with active
other’s histone mark levels detected by SCEPTRE. That
transcription (27) and a model has been proposed where
being said, the SCEPTRE results broadly agree with the
H3K4me3 facilitates the loading of RNA polymerase II,
results obtained by CUT&RUN and can distinguish be-
which remains paused proximally to the gene’s promoter
tween the chromatin modification states of multiple genes
until a subsequent release step (55). However, this model
in the same cell (e.g. MYL6 and HOXC). As seen with the
was based on separate population-level measurements of
H3K4me3 marks at these genomic regions, we observed no
H3K4me3 and RNA polymerase II, and did not distinguish
relationship between the H3K27me3 levels for two alleles
whether both components coincide directly at the same time
of the same gene (Supplementary Figure S9B) or for alleles
at single loci in cells. To test whether both H3K4me3 and
from different genes (Supplementary Figure S10B) in the
paused RNA polymerase II were present simultaneously at
same cell.
GAPDH, we performed SCEPTRE with H3K4me3 and the10 Nucleic Acids Research, 2021
A B C D
Downloaded from https://academic.oup.com/nar/advance-article/doi/10.1093/nar/gkab423/6287849 by guest on 17 August 2021
E
Figure 4. SCEPTRE quantifies one of two histone marks at three genomic regions. (A) Example images of the approximate center plane for each image
stack of simultaneously FISH-labeled MYL6, HOXC or LINC-PINT loci (green) from the same expanded RPE1 cell immunolabeled for H3K4me3 marks
(K4me3, magenta). (B) Distribution of H3K4me3 fluorescence signals (arb. = arbitrary units) within H3K4me3, randomly selected regions (random),
MYL6, HOXC and LINC-PINT clusters (cluster numbers are K4me3 = 390331, random = 7421, MYL6 = 91, HOXC = 135, LINC-PINT = 46). (C)
Example images of the approximate center plane for each image stack of simultaneously FISH-labeled MYL6, HOXC or LINC-PINT loci (green) from
the same expanded RPE1 cell immunolabeled for H3K27me3 marks (K27me3, magenta). (D) Distribution of H3K27me3 fluorescence signals within
H3K27me3, randomly selected regions, MYL6, HOXC and LINC-PINT clusters (cluster numbers are K27me3 = 196 798, random = 6041, MYL6 = 87,
HOXC = 85, LINC-PINT = 72). (E) CUT&RUN normalized counts for H3K4me3 (top) or H3K27me3 (bottom) at the FISH-labeled MYL6, HOXC
and LINC-PINT regions (highlighted). Significance determined by a right-tailed Wilcoxon rank-sum test of fluorescence signals in each FISH-labeled set
against the random cluster distribution. All scale bars are in pre-expansion units.
post-translationally modified form of paused RNA poly- S17F), and r = 0.59 at random regions (Supplementary
merase II during transcription initiation, where the Serine Figure S18C). However, the fraction of GAPDH loci with
5 of the repeat C-terminal domain of RNA polymerase II is high H3K27ac signals was smaller compared to that with
phosphorylated (Figure 5) (56–58). high paused RNA polymerase II signals, suggesting that
We detected a large coincidence between H3K4me3 and H3K27ac and the phosphorylation indicative of paused
paused RNA polymerase II, both at the GAPDH locus and RNA polymerase II play distinct roles in the transcriptional
also more broadly in the nucleus. At individual GAPDH cycle. Together, these results are consistent with a close reg-
loci, there were high signals from both H3K4me3 and ulatory relationship between H3K4me3 modifications and
paused RNA polymerase II (Figure 5B-E), such that there the loading of paused RNA polymerase II, both at GAPDH
was also a strong correlation between these signals (Figure and more broadly across the nucleus.
5F, r = 0.70). Consistently, GAPDH overlapped with both
H3K4me3 and paused RNA polymerase II clusters (0.23 ±
DISCUSSION
0.21 and 0.21 ± 0.19, respectively). Similarly to H3K4me3,
paused RNA polymerase II signals were uncorrelated be- SCEPTRE is a new method capable of profiling chromatin
tween GAPDH loci in the same cell (Supplementary Figure states at multiple genomic loci within the 3D nuclear con-
S13). In the nucleus more broadly, there was also substan- text of a cell by combining immunofluorescence with DNA
tial colocalization between H3K4me3 clusters and paused in situ labeling by means of ExM. This combination en-
RNA polymerase II clusters (Figure 5B, fraction of over- ables efficient detection of histone mark fluorescence sig-
lap 0.19 ± 0.21), as well as a strong correlation between nals at a resolution of ∼75 nm, sufficient to quantify histone
these two signals in randomly selected region clusters (Sup- mark abundance at individual genomic loci. In contrast
plementary Figure S14C, r = 0.68). to sequencing-based methods, SCEPTRE provides quan-
In contrast, no correlation was seen at GAPDH between titative measurements of physical properties, such as over-
H3K4me3 and H3K27me3 signals (Figure 3G, r = 0.02), lap, density, and position within the nucleus for more than
or between H3K27me3 and paused RNA polymerase II one histone mark at multiple genomic regions. Such mea-
(Supplementary Figure S15F, r = 0.04). On a broader level, surements reveal a heterogeneity in chromatin states that
there was also little to no correlation in random regions be- has been previously masked in ensemble sequencing-based
tween H3K4me3 and H3K27me3 (Supplementary Figure methods.
S8C, r = 0.18), or between H3K27me3 and paused RNA There are limitations to SCEPTRE compared to other hi-
polymerase II (Supplementary Figure S16C, r = 0.17). In- stone mark profiling methods. Sequencing based methods
terestingly, when H3K27ac, another active histone mark can achieve nucleosome level resolution for histone mark
(59), was concurrently visualized with paused RNA poly- mapping across an entire genome, such as in the case of
merase II, some correlation was seen between these two CUT&RUN (28). Since SCEPTRE relies on DNA FISH,
signals, with r = 0.43 at GAPDH (Supplementary Figure detection of genes by in situ labeling often is limited to aNucleic Acids Research, 2021 11
A AD
E
Downloaded from https://academic.oup.com/nar/advance-article/doi/10.1093/nar/gkab423/6287849 by guest on 17 August 2021
F
B
C
Figure 5. SCEPTRE compares H3K4me3 and paused RNA polymerase II signals at a single genomic region. (A) An expanded RPE1 cell with immuno-
labeled H3K4me3 marks (K4me3, red) and paused RNA polymerase II (Pol2S5p, blue), and FISH-labeled GAPDH (green). (B, C) Zoomed in views of
the approximate center plane of an image stack for each GAPDH allele in the cell seen in (A). (D) Distributions of H3K4me3 fluorescence signal (arb. =
arbitrary units) within H3K4me3, randomly selected regions (random) and GAPDH clusters. (E) Distribution of paused RNA polymerase II fluorescence
signal within paused RNA polymerase II, randomly selected regions and GAPDH clusters. (F) H3K4me3 and paused RNA polymerase II fluorescence
signals within GAPDH clusters (green). Black lines represent the threshold ‘on’ level for each fluorescence signal, while the red line represents the linear
regression. The correlation coefficient (r) between fluorescence signals within GAPDH is shown in the top-right corner of the plot. Cluster numbers for
(D). and (E). are K4me3 = 440298, Pol2S5p = 542245, random = 8240, GAPDH = 88. Significance determined by a right-tailed Wilcoxon rank-sum test
of histone mark fluorescence signals in GAPDH against random cluster distributions. All scale bars are in pre-expansion units.
minimum labeling size of over 10 kb, since smaller regions technique in order to target larger genomic regions by us-
are detected with lower efficiency. However, genome orga- ing multiplex FISH methods, such as MERFISH (67), seq-
nization is thought to occur at a larger scale than that of FISH (68), ORCA (69) or OligoFISSEQ (70). These meth-
the single nucleosome. Nucleosomes are known to orga- ods would allow SCEPTRE to interrogate the relationships
nize as clusters throughout the nucleus, with spatial sizes between histone modifications and gene activity at a vari-
ranging around 50–100 nm (17), a size that corresponds to ety of developmentally-regulated genes, and at increasingly
∼10 kb of genomic DNA, depending on the region’s activ- larger scales of genome organization.
ity state (19). The scale increases further when observing SCEPTRE revealed heterogeneity in the levels of
Topologically Associating Domains (TADs), which are ge- H3K4me3 at active genomic regions such as GAPDH,
nomic regions of ∼200 kb to 1 Mb in size that maintain MYL6 and LINC-PINT beyond what would be expected
similar epigenetic and regulatory landscapes (60,61), or the from technical limitations of SCEPTRE. This variabil-
smaller sub-TADs that are ∼185 kb (62), with spatial sizes ity, which has been suggested in sequencing-based single-
of ∼160 nm (63). Even larger than 1 Mb are chromatin cell chromatin profiling studies (9,71), suggests that active
A and B compartments which are associated with broader gene loci can adopt different states with different levels of
open (active) and closed (repressed) states (64), with spa- H3K4me3 modification. Moreover, because SCEPTRE re-
tial sizes on the m scale (65,66). Since SCEPTRE has al- vealed a close correlation between H3K4me3 and paused
lowed us to profile multiple genes at the lower scale of this RNA polymerase II levels at individual loci, this hetero-
genomic organization, there is potential to build upon this geneity may reflect differences in the transcriptional state12 Nucleic Acids Research, 2021
of each gene. Given that genes are transcribed in bursts DATA AVAILABILITY
(72), where polymerase recruitment happens intermittently
CUT&RUN sequencing data for H3K4me3, H3K27me3
(73), it is plausible that H3K4me3 marks and polymerase II
and H3K27ac were submitted to the NCBI gene ex-
phosphorylation at Serine 5 are concurrently added during
pression omnibus (http://www.ncbi.nlm.nih.gov/geo/) and
a transcriptional burst, but removed at a later stage in the
are available under the accession number GSE160784.
transcriptional cycle. Moving forward, it would be useful to
These results, which were obtained using ENCODE-
utilize SCEPTRE to further visualize H3K4me3 and other
validated antibodies, can be viewed using the follow-
histone marks alongside different stages of transcription, to
ing UCSC genome browser session: https://genome.ucsc.
elucidate how histone marks participate in the regulation of
edu/s/marcwood/SCEPTRE RPE1 CnR hg38. For FISH-
gene transcription.
Downloaded from https://academic.oup.com/nar/advance-article/doi/10.1093/nar/gkab423/6287849 by guest on 17 August 2021
labeled regions, CUT&RUN results were confirmed by
Similar to H3K4me3, H3K27me3 also appeared to show
comparison to previously published ChIP-seq results
substantial heterogeneity in its levels at individual HOXC
(79,80).
loci, with a considerable fraction of loci having low or
MATLAB scripts for image processing and analysis
baseline levels of this modification. As the HOXC main-
are available at GitHub (https://github.com/marcwood13/
tains a transcriptionally silent state in these cells (Sup-
SCEPTRE pipeline). Additional data related to this paper
plementary table S3), our results suggest that the HOXC
will be made available by the corresponding authors upon
cluster is able to maintain a silent chromatin state even
reasonable request.
with low or baseline levels of H3K27me3 modification. In
line with these findings, our recent study has pointed to a
necessity for H3K27me3-independent mechanisms in the NOTE ADDED IN PROOF
maintenance of compacted, polymerase-inaccessible state
at repressed developmental gene loci (74). Gene repression A recently published paper combined immunofluorescence
at the Hox gene cluster requires PRC1, a protein com- and DNA FISH to visualize multiple histone modifications
plex that mediates chromatin compaction and gene silenc- across many genomic regions using sequential hybridization
ing (75). PRC1 binds to H3K27me3, an interaction that (81), though imaging was performed using conventional
explains the co-localization of these two factors in the light microscopy that limited their analysis to chromoso-
genome; however, PRC1 can also bind genomic loci inde- mal scale domains. This sequential hybridization approach
pendently of H3K27me3, and thus could conceivably main- developed can potentially be combined with SCEPTRE to
tain a repressed state at the HOXC locus in the absence of allow for finer-scale profiling of chromatin states across a
H3K27me3 (76). To further investigate these ideas, it will be large number of gene loci.
helpful to use SCEPTRE to interrogate polycomb domains
at other genomic loci. SUPPLEMENTARY DATA
Lastly, there are certain factors that influence the way
SCEPTRE profiles the epigenetic state of genes. As demon- Supplementary Data are available at NAR Online.
strated in the example of the LINC-PINT region (Figure
4 and Supplementary Figure S9), the 3D context of a re- ACKNOWLEDGEMENTS
gion can influence its epigenetic profile. This ‘crosstalk’
from neighboring regions is most-likely due to the fact that The authors would like to thank L. Wordeman (University
genes with different epigenetic states may be found closer of Washington) for providing the hTERT RPE1 cell line;
than the resolution of ExM provides at a 4× expansion S. Henikoff (Fred Hutchinson Cancer Research Center) for
factor (∼75 nm). If so, methods that achieve better reso- the generous gifts of pA-MNase and spike-in yeast DNA;
lution, such as iterative ExM (77) or the combination of B. Beliveau (University of Washington) for assistance with
ExM with structured illumination microscopy (78), would probe design; and the Biology Imaging Facility at the Uni-
provide a greater distinction between epigenetic states of versity of Washington for providing imaging assistance.
neighboring genes while using SCEPTRE. Another fac- Author contributions: M.A.W., K.K.H.N., H.Y.K. and
tor that may play a role in profiling are the genetic ele- J.C.V. designed the experiments. M.A.W., K.K.H.N.,
ments within a targeted region. The labeled LINC-PINT A.R.H., N.A.P. and P.H.B.N. contributed to the exper-
region was an internal sequence of a gene, which showed imental setup. M.A.W. and K.K.H.N. obtained the re-
a different distribution of H3K4me3 signals compared to sults. M.A.W., K.K.H.N., A.R.H., N.A.P. and P.H.B.N.
the MYL6 region, whose promoter was found at the cen- contributed to the results analysis. M.A.W., H.Y.K. and
ter of the labeled region. Therefore, considering the 3D- J.C.V. wrote the paper and all authors commented on the
context of chromatin within cells (seen by Hi-C from a manuscript. H.Y.K. and J.C.V. supervised the project.
previous study) (54) and the epigenetic landscape of a ge-
nomic sequence (seen by CUT&RUN in this study) can
FUNDING
help with either selecting each targeted region for SCEP-
TRE, or in determining the epigenetic state for each re- University of Washington (to H.Y.K. and J.C.V.); Chan
gion within a cell. Further improvements in multiplexing Zuckerberg Initiative (to H.Y.K and J.C.V.); National
and resolution would allow SCEPTRE to systematically Heart, Lung and Blood Institute of the National Insti-
profile chromatin states in the genome, providing new in- tutes of Health [F31HL142132 to M.A.W]; National Heart,
sights into our understanding of genome structure and Lung and Blood Institute of the National Institutes of
function. Health [R00HL119638, R01HL146478 to H.Y.K.]; a StemYou can also read