Summary Profile of the Rivière des Outaouais Watershed - May 2015 Direction générale des politiques de l'eau
←
→
Page content transcription
If your browser does not render page correctly, please read the page content below
Summary Profile of the
 Rivière des Outaouais
            Watershed

                                     May 2015

      Direction générale des politiques de l’eau
Credits page

Coordination and writing
This publication was produced by the Direction générale des politiques de l’eau in collaboration with the
Direction régionale de l’analyse et de l’expertise de l’Outaouais, the Direction du Suivi de l’état de
l’environnement of the Ministère du Développement durable, de l’Environnement et de la Lutte contre les
changements climatiques (MDDELCC), and the Direction du Centre d’expertise hydrique du Québec.

Information
For information, contact the Information Centre of the Ministère du Développement durable, de l’Environnement
et de la Lutte contre les changements climatiques.

Phone:           418 521-3830
                 1 800 561-1616 (toll free)
Fax:             418 646-5974
Email:           info@mddelcc.gouv.qc.ca
Web:             www.mddelcc.gouv.qc.ca

To obtain a copy of the document:
Direction générale des politiques de l’eau
Ministère du Développement durable, de l’Environnement
et de la Lutte contre les changements climatiques
675 René-Lévesque Boulevard East, 8th Floor, Box 42
Québec, Québec G1R 5V7
Phone: 418 521-3885

Or

Visit our website
http://www.mddelcc.gouv.qc.ca/eau/bassinversant/bassins/outaouais/portrait-sommaire-en.pdf

Reference to be cited
Ministère du Développement durable, de l’Environnement et de la Lutte contre les changements climatiques.
Summary Profile of the Rivière des Outaouais Watershed. 2015. 57 pages. [online].
http://www.mddelcc.gouv.qc.ca/eau/bassinversant/bassins/outaouais/portrait-sommaire-en.pdf (page consulted on
day/month/year).

Legal deposit – 2015
Bibliothèque et Archives nationales du Québec
ISBN 978-2-550-73028-6 (online)

All rights reserved for all countries.

© Gouvernement du Québec - 2015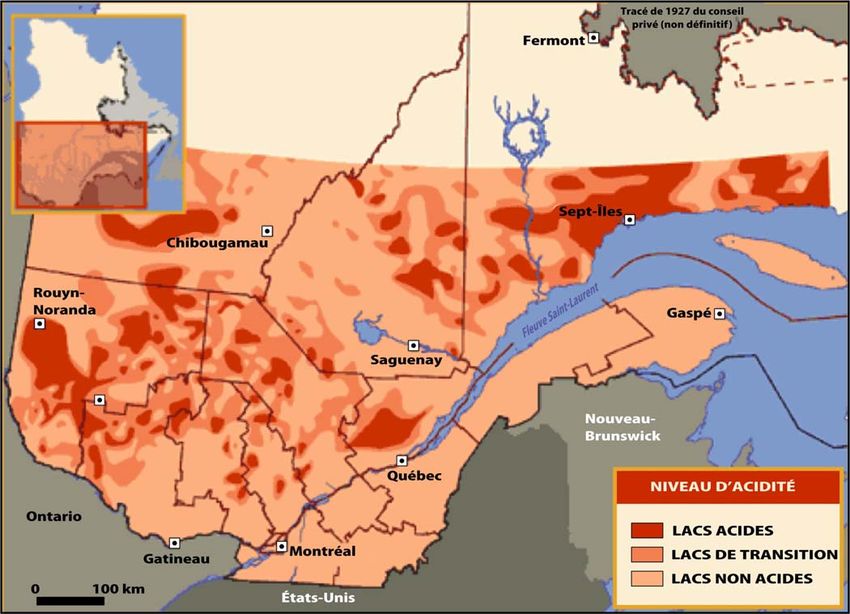
Contents

1     Background ........................................................................................................................................................8

2     General presentation of the watershed................................................................................................................9

    2.1      Location and description ............................................................................................................................9
    2.2      Socio-economic profile.............................................................................................................................11
    2.3      Biophysical environment..........................................................................................................................11
    2.4      Land use....................................................................................................................................................12
    2.5      Historical background ..............................................................................................................................13

3     Surface water ....................................................................................................................................................14

    3.1      Quantitative profile...................................................................................................................................14

      3.1.1          Hydrographic network......................................................................................................................14

      3.1.2          Lakes.................................................................................................................................................14

      3.1.3          Reservoirs and dams.........................................................................................................................15

    3.2      Qualitative profile.....................................................................................................................................17

      3.2.1          Water quality ....................................................................................................................................17

      3.2.2          Cyanobacteria ...................................................................................................................................19

      3.2.3          Lake acidity ......................................................................................................................................21

4     Groundwater .....................................................................................................................................................23

5     Biodiversity ......................................................................................................................................................23

    5.1      Special-status species ...............................................................................................................................23
    5.2      Forest wetlands.........................................................................................................................................24
    5.3      Designated protected areas .......................................................................................................................25

6     Uses of the watershed .......................................................................................................................................27

    6.1      Drinking water..........................................................................................................................................27

      6.1.1          Administrative region of Outaouais .................................................................................................27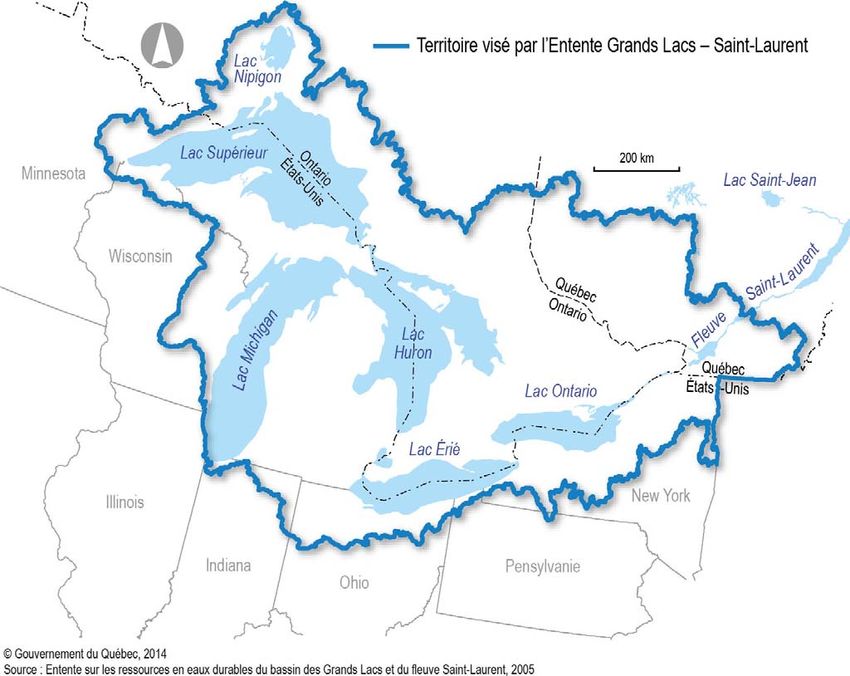
6.1.2         Administrative regions of Abitibi-Témiscamingue and Laurentides ...............................................28

    6.2       Municipal wastewater...............................................................................................................................28

       6.2.1         Rivière des Outaouais watershed......................................................................................................28

       6.2.2         Administrative region of Outaouais .................................................................................................28

    6.3       Industrial wastewater................................................................................................................................29

       6.3.1         Administrative region of Outaouais .................................................................................................29

    6.4       Water withdrawals....................................................................................................................................29
    6.5       Hydroelectricity........................................................................................................................................30
    6.6       Industry.....................................................................................................................................................30

       6.6.1         Primary sector...................................................................................................................................30

       6.6.2         Secondary sector...............................................................................................................................30

       6.6.3         Pulp and paper sector........................................................................................................................31

       6.6.4         Lumber and wood products sector....................................................................................................32

       6.6.5         Mines ................................................................................................................................................32

    6.7       Agriculture................................................................................................................................................34
    6.8       Recreational and vacation activities .........................................................................................................35
    6.9       Wildlife harvesting activities....................................................................................................................37

7      Government measures ......................................................................................................................................39

    7.1       Measures to reduce the discharge of untreated wastewater......................................................................39
    7.2       Measures to protect water supply sources and drinking water quality .....................................................39

8      Governance.......................................................................................................................................................40

    8.1       Intergovernmental.....................................................................................................................................40
    8.2       Regional....................................................................................................................................................41

9      Bibliography .....................................................................................................................................................44

Appendix I. Special-status species (threatened, vulnerable or likely to be so designated) in the Rivière des
Outaouais watershed.................................................................................................................................................47
Wildlife species ....................................................................................................................................................47
   Plant species .........................................................................................................................................................49

Appendix II. Characteristics of different types of wetlands .....................................................................................57
List of Figures

Figure 1. Administrative boundaries in the Rivière des Outaouais watershed………………………………..… 9

Figure 2. Bioclimatic domains in the Rivière des Outaouais watershed…………………………………..……. 12

Figure 3. Land use in the Rivière des Outaouais watershed………………………………………………..…… 13

Figure 4. Hydrographic network of the Rivière des Outaouais watershed……………………………….....….. 15

Figure 5. Bacteriological and physicochemical quality indices (BPQI6) at water quality sampling stations
          in the Rivière des Outaouais watershed………………………………………………………………. 18

Figure 6. Recurrence of cyanobacteria outbreaks in water bodies of the Rivière des Outaouais watershed….... 20

Figure 7. Number of water bodies affected by blue-green algae, by sub-watershed………………………..….. 21

Figure 8. Levels of lake acidity in southern Québec…………………………………………….……………… 22

Figure 9. Wetlands in the Rivière des Outaouais watershed………………………………………………….… 24

Figure 10. Relative numbers of wetland types in the Rivière des Outaouais watershed ….…..………………… 25

Figure 11. Relative area of wetland types in the Rivière des Outaouais watershed ……………..…………...…. 25

Figure 12. Protected areas listed in the Registre des aires protégées par désignation…………..……………… 27

Figure 13. Location and status of mining sites in the Rivière des Outaouais watershed………………………… 34

Figure 14. Recreational territories in the Rivière des Outaouais watershed…………………..…………………. 36

Figure 15. Number of fishing days per administrative region in 2012……………………………………..……. 37

Figure 16. Number of hunting days per administrative region in 2012………………………………..………… 38

Figure 17. Number of captures per administrative region in 2012………………………………..…………….. 38

Figure 18. Territory concerned by the Great Lakes–St. Lawrence River Basin Sustainable Water
          ResourcesAgreement…………………………………………………………………….…………… 41

Figure 19. Water management zones in the Rivière des Outaouais watershed……………………….…………. 42
List of Tables
Table 1. Demographic and territorial characteristics of administrative regions and regional county
municipalities in the Rivière des Outaouais watershed…...................................................................... 10
Table 2. Principal reservoirs of the Rivière des Outaouais watershed …………...…………………..……...… 16
Table 3. Number and types of dams in the Rivière des Outaouais watershed…………………………………. 17
Table 4. Categories of dam uses in the Rivière des Outaouais watershed………………………………...…… 17
Table 5. Protected areas in the Rivière des Outaouais watershed…………………………..………………….. 26
Table 6. Characteristics of the five pulp and paper mills in the Outaouais region……………….……………. 32
Table 7. Characteristics of mining projects in the Rivière des Outaouais watershed………...……………….. 33
Table 8. Recreational territories in the Rivière des Outaouais watershed………………………….…….…… 361 Background
Québec has common borders with Ontario, Labrador, New Brunswick and the American states of New York,
Vermont, New Hampshire and Maine, with all of which it shares, to different degrees, cross-border drainage
basins. Some of the latter are the subject of specific cooperation agreements between the governments concerned:
examples include Lac Memphrémagog (Québec-Vermont), Lac Champlain (Québec-Vermont-New York) and the
Great Lakes and St. Lawrence River Basin (Québec-Ontario-eight adjacent American states). For others, general
agreements for environmental cooperation, in which cross-border matters related to water are addressed, have
been signed between Québec and its neighbours (e.g. New Brunswick, Ontario). Additionally, Ontario and
Québec intend to intensify their cooperation regarding Rivière des Outaouais.
It is in that context that the Ministère du Développement durable, de l’Environnement et de la Lutte contre les
changements climatiques (MDDELCC) has prepared the present summary of the information available on the
Québec portion of the Rivière des Outaouais watershed. It briefly describes the characteristics of the watershed
that are of interest for integrated water management, while also outlining its physical, economic and social
environment.
As much as possible, information is presented from the perspective of integrated management by drainage basin.
However, certain data may be presented on a sectoral basis, by administrative boundaries or for the main section
of the river as opposed to the entire watershed.
82 General presentation of the watershed
2.1 Location and description
Rivière des Outaouais is the principal tributary of the St. Lawrence River. Its watershed extends upstream from
Lac des Deux Montagnes over an area of 146 334 km², of which 92 203 km² (65%) are in Québec, the rest (35%)
being in Ontario. Rivière des Outaouais arises from Lac Capimitchigama, north of the Outaouais region. From
there it flows for about 1130 km to its mouth at Carillon, where Hydro-Québec operates a hydroelectric plant.
Over most of its length, Rivière des Outaouais forms the natural border between Québec and Ontario
(MDDELCC, 2000).
The territory of the Rivière des Outaouais watershed covers six administrative regions, namely Outaouais,
Laurentides, Abitibi-Témiscamingue, Lanaudière, Montérégie and Mauricie (Figure 1). It wholly or partly
includes the territories of 20 regional county municipalities (MRCs). At the local level, there are
187 municipalities, 37 unorganized territories (6 of them aquatic) and 9 territories of Aboriginal communities.
Figure 1. Administrative boundaries in the Rivière des Outaouais watershed.
9The administrative regions of Outaouais and Laurentides lie completely (or 96% in the case of Laurentides)
within the Rivière des Outaouais watershed. Abitibi-Témiscamingue is 57% within the watershed, while the
remaining administrative regions overlap the basin only marginally. In Montérégie however, where 44% of the
MRC of Vaudreuil-Soulanges is in the watershed, that portion is fairly populous, with nearly 64 000 inhabitants
(Table 1).
Table 1. Demographic and territorial characteristics of administrative regions and regional county municipalities
(MRCs) in the Rivière des Outaouais watershed (ISQ, 2014).
Administrative Region Population
Population Area Proportion in the
density
(inhab.) (km²) Outaouais watershed
MRC (inhab./km²)
Outaouais 12.5 381 200 30 472 100%
Les Collines-de-Outaouais 24 48 717 2026 100%
Gatineau 802.2 274 367 342 100%
Papineau 7.9 22 781 2905 100%
Pontiac 1 14 331 12 827 100%
La Vallée-de-la-Gatineau 1.7 20 914 12 373 100%
Laurentides 28.3 580 966 25 544 96%
Antoine-Labelle 2.4 35 235 14 793 100%
Argenteuil 26.5 32 650 1231 100%
Deux-Montagnes 412.8 99 891 242 60%
La Rivière-du-Nord 273.3 122 436 448 54%
Les Laurentides 18.6 45 804 2462 100%
Les Pays-d’en-Haut 62.2 41 415 677 100%
Mirabel 94.8 45 888 484 36%
Lanaudière 39.7 488 927 12 309 7%
Matawinie 5.4 50 917 9433 9%
Abitibi-Témiscamingue 2.6 147 931 57 349 57%
Témiscamingue 1 16 346 16 329 100%
Rouyn-Noranda 7 41 904 5968 85%
Vallée-de-l’Or 1.8 43 813 24 108 39%
Abitibi 3.3 24 820 7620 15%
Montérégie 134.9 1 499 088 11 111 4%
Vaudreuil-Soulanges 170.4 145 514 854 44%
Mauricie 7.5 266 542 35 448 7%
La Tuque 0.6 15 195 25 965 9%
102.2 Socio-economic profile
The total permanent population of the Rivière des Outaouais watershed is approximately 1 138 200. Table 1
presents the population estimate for each administrative region and MRC that is wholly or partly in the basin. As
can be seen, Outaouais and Laurentides have the most inhabitants in the watershed, respectively 381 200 and
580 966. The highest concentration is in the urban agglomeration of Gatineau-Ottawa, with a total population of
approximately 1 282 500. On the Québec side, the city of Gatineau is the most heavily populated in the watershed,
with over 274 000 inhabitants. The demographic data shows that the population is not uniformly distributed in the
watershed.
2.3 Biophysical environment
The landscape of the Rivière des Outaouais watershed is defined primarily by the southern Laurentians, the
Abitibi lowlands in the upper portion, and the St. Lawrence lowlands further downstream.
Bioclimatic domains represent areas in which there is a particular type of vegetation due to specific climate
conditions. Figure 2 shows that 85% of the watershed is deciduous forest and mixed forest, while 15% is boreal
forest (balsam fir-white birch). From south to north, the basin is subdivided into five bioclimatic domains:
Sugar maple-bitternut hickory
This bioclimatic domain is characterized by a southern flora with highly diversified forests. The
characteristic species are bitternut hickory, black maple, swamp white oak, rock elm, pitch pine and
numerous shrubs and herbaceous plants. Sugar maple, balsam fir and spruce are also found.
Sugar maple-basswood
The flora of this bioclimatic domain is very diversified, including basswood, American ash, hop-hornbeam,
butternut and sugar maple.
Sugar maple-yellow birch
This bioclimatic domain lies further to the north. It is less diversified, with yellow birch and sugar maple in
abundance. American beech, red oak and Eastern hemlock also grow in this zone.
Balsam fir-yellow birch (mixed forest)
11This domain is characterized by mixed stands of yellow birch and softwoods, such as balsam fir, white
spruce and white cedar. Sugar maple are also found.
Balsam fir-white birch (boreal forest)
This domain occupies the most northern part of the territory. It is dominated by stands of balsam fir and
white spruce mixed with white birch. Also found are yellow birch and red maple in the southern portion.
Here as in the balsam fir-yellow birch domain, forest fires and outbreaks of spruce budworm ensure forest
regeneration.
Figure 2. Bioclimatic domains in the Rivière des Outaouais watershed.
2.4 Land use
Figure 3 presents the geographical distribution of land uses (MDDELCC, 2014k). As is clear from the map,
forests dominate, covering 73% of the territory. Areas of harvested and regenerating forest add 4% to that figure.
12The hydrographic network (rivers, lakes, wetlands) occupies 19% of the watershed. Agriculture is generally
conducted furthest downstream, occupying 3% of the territory. Urbanized areas are also downstream, accounting
for 1% of the territory. As mentioned earlier, the highest population density is in the Gatineau-Ottawa area. This
is where most problems with water quality occur.
Figure 3. Land use in the Rivière des Outaouais watershed (MDDELCC, 2014k).
2.5 Historical background
As a navigable waterway, Rivière des Outaouais has always served to provide access to the interior. The First
Nations and settlers used it extensively for travel and the fur trade.
In 1791, when the Constitutional Act came into force, Rivière des Outaouais became the dividing line defining the
border between Lower Canada and Upper Canada (Outaouais Tourism, 2014). In the early 1900s a period of
strong economic growth began as Philemon Wright developed the forest industry. Rivière des Outaouais and its
13main tributaries were used for timber floating, an activity that continued until 1994 when floating activities finally
stopped on Rivière du Lièvre.
The first industrialists quickly perceived the river’s hydroelectric potential. In 1902, E. B. Eddy built the first dam
on Rivière des Outaouais, at Chutes de la Chaudière in the heart of what is now Gatineau. From Témiscamingue
to the mouth of the Outaouais, the river and its tributaries still feature today a total of 43 dams. Construction of
the Carillon dam in the 1960s altered the landscape significantly, deepening inlets and flooding forests.
3 Surface water
3.1 Quantitative profile
3.1.1 Hydrographic network
The hydrographic network of Rivière des Outaouais includes 19 sub-watersheds over 2000 km2 in size (Figure 4).
On the Québec side, the main tributaries are the Gatineau, du Lièvre, Kipawa and Rouge rivers. Tributaries on the
Ontario side include the Madawaska, Montréal, Blanche and Petawawa rivers. The sub-watersheds of the Rideau,
Mississippi and South Nation rivers, though smaller, are important in socio-economic terms.
3.1.2 Lakes
The Rivière des Outaouais watershed contains over 90 000 lakes, of which fewer than 300 are more than 2 km² in
size (MDDEFP 1 , 2011). Among the largest are lakes Preissac, Dumoine, Opasatica and Trente et Un Milles, each
being over 50 km2 in size.
Most lakes in the watershed are on public lands. Some are on the territory of controlled zones (ZECs) or in the
wildlife reserves of La Vérendrye and Papineau-Labelle.
Besides the natural lakes, there are some sixty reservoirs over 300 km2 in size, including the Cabonga, Des
Quinze, Baskatong, Témiscamingue and Dozois reservoirs (Table 2).
1
The Ministère du Développement durable, de l’Environnement et de la Lutte contre les changements climatiques
(MDDELCC), formerly known as the Ministère du Développement durable, de l’Environnement et des Parcs (MDDEP) and
as the Ministère du Développement durable, de l’Environnement, de la Faune et des Parcs (MDDEFP).
14Figure 4. Hydrographic network of the Rivière des Outaouais watershed.
3.1.3 Reservoirs and dams
Reservoirs
The Rivière des Outaouais watershed contains 30 reservoirs that have a combined capacity of more than 14 billion
cubic metres, resulting in the flow of the river being highly regulated. These reservoirs help control flooding and
reduce the damage caused by it. However, more than 50% of the storage capacity is in the upper part of the
watershed, making flood management in the lower part (the downstream) harder to achieve. Table 2 lists the
13 reservoirs with the greatest storage capacity.
15Table 2. Principal reservoirs of the Rivière des Outaouais watershed (from: Ottawa River Regulation Planning
Board, 1984).
Capacity
River Reservoir
(millions of m³)
Outaouais Dozois 1863
Outaouais Rapide 7 371
Outaouais Quinze 1308
Outaouais Témiscamingue 1217
Outaouais Des Joachims 229
Montréal Lady Evelyn 308
Kipawa Kipawa 673
Madawaska Bark Lake 374
Gatineau Cabonga 1565
Gatineau Baskatong 2649
Lièvre Mitchinamecus 554
Lièvre Kiamika 379
Lièvre Poisson Blanc 625
In 1983, the Ottawa River Regulation Planning Board was established by the governments of Canada, Québec and
Ontario to ensure integrated flow management of the principal reservoirs of the Rivière des Outaouais watershed.
The goal was to provide protection from flooding along the Rivière des Outaouais and its tributaries, particularly
in the Montréal region, while maintaining the interests of the various users, particularly with regard to
hydroelectric energy production.
The Board is composed of seven members, each with an alternate, representing Canada (3), Ontario (2) and
Québec (2). The authority of the Board is defined in the Agreement Respecting Ottawa River Regulation. To learn
more about the Ottawa River Regulation Planning Board, go to http://ottawariver.ca.
Dams
The Répertoire des barrages du Québec (inventory of Québec dams) (CEHQ, 2014b) lists 1093 dams in the
Rivière des Outaouais watershed. Table 3 shows the number of dams in each category defined in the Dam Safety
Act (CQLR chapter S-3.1.01): small dams, low-capacity dams, high-capacity dams and ancillary dams. Ancillary
dams are those that are on the same reservoir as another that is a main dam. For more information, see
http://www.cehq.gouv.qc.ca/barrages/guides/guide_fiche_technique.pdf (French).
16Table 3. Number and types of dams in the Rivière des Outaouais watershed (CEHQ, 2014a)
Dam Types Number
Small dam 207
Low capacity 466
Low capacity (ancillary) 2
High capacity 398
High capacity (ancillary) 20
Total 1093
The dams of the Rivière des Outaouais watershed serve a variety of purposes. As is evident from Table 4, most
primarily serve recreational needs, followed by hydroelectric production and flow regulation.
Table 4. Categories of dam uses in the Rivière des Outaouais watershed (CEHQ, 2014b)
Use Category Number
Recreation 577
Hydroelectric production 125
Regulation 106
Wildlife 61
Other or unknown 61
Log rafting (formerly) 52
Water catchment 45
Flood protection 33
Fish farming 12
Fire fighting 10
Agriculture 8
Historical site 2
Total 1093
3.2 Qualitative profile
3.2.1 Water quality
Data collected over the 2011-2013 sampling period showed good overall quality in the main course of Rivière des
Outaouais, in terms of conventional physicochemical parameters. The data was collected in five stations along the
17main course of the river and nine tributaries on the Québec side. From upstream down, the sampling stations in
Rivière des Outaouais are at Notre-Dame-du-Nord, Témiscaming, Portage-du-Fort, the Masson ferry crossing
and Carillon. The main tributaries monitored, again from upstream down, are the À la Loutre, Coulonge,
Gatineau, Blanche (Templeton), Du Lièvre, Blanche (Thurso), De la Petite Nation, Saumon and Rouge rivers
(Figure 5). The stations named in bold entered service in the summer or fall of 2012, so the data from them
primarily reflects the physicochemical conditions of 2012-2013 (MDDELCC, 2014b).
Figure 5. Bacteriological and physicochemical quality indices (BPQI6) at water quality sampling stations in the
Rivière des Outaouais watershed (MDDELCC, 2014b).
Analysis of the data shows that water quality was good in six of the nine tributaries of Rivière des Outaouais. The
exceptions were the two Blanche rivers (at Templeton and Thurso respectively), where quality was satisfactory,
while quality was poor in Rivière à la Loutre, primarily due to concentrations of suspended matter.
In the watershed as a whole the bacteriological quality was generally good. There were no violations of the
quality criterion for indirect contact activities (1000 UFC/100 ml). Violations of the quality criterion for direct
18contact activities (200 UFC/100 ml) were only observed in five stations over the summer period (May to
October), and generally in fewer than 20% of the samples taken (MDDELCC, 2014b).
The generally good quality of water in Rivière des Outaouais and its tributaries is a reflection of the considerable
efforts devoted to improving urban sanitation (sewage treatment) over the last 35 years. In the tributary
watersheds there is limited pollution pressure from diffuse sources of agricultural pollution, so residual pollution
in these watercourses is relatively low, as shown by their low concentrations of nutrient elements.
It is important to note that a good deal of the improvement in the quality of the water in Rivière des Outaouais is
thanks to efforts on the Ontario side.
3.2.2 Cyanobacteria
In September 2007 the Government of Québec announced its Plan d’intervention sur les algues bleu-vert
(intervention plan on blue-green algae). The intervention plan is a response to public concerns about outbreaks of
blue-green algae (cyanobacteria) affecting a number of Québec water bodies. Since 2008, the MDDELCC has
defined a bloom of blue-green algae as a concentration of at least 20 000 cells/ml of water. Data from before 2008
has been updated in accordance with this threshold.
From 2004 to 2012, based on the new threshold, blue-green algae blooms occurred in 178 water bodies in 14 sub-
watersheds of the Outaouais (Figure 6; MDDEFP, 2014). The sub-watershed most affected is that of Rivière du
Nord (44 water bodies), followed closely by Rivière Rouge (43), while 26 water bodies were affected in the sub-
watershed of Rivière Gatineau (Figure 7).
19Figure 6. Recurrence of cyanobacteria outbreaks in water bodies of the Rivière des Outaouais watershed
(MDDEFP, 2014).
Recurrence refers to consecutive years in which cyanobacteria are observed in a given water body. Over the
period from 2004 to 2013, Lac Témiscamingue was affected every year from 2007 to 2013 (recurrence of seven
years). The three lakes with the next highest recurrence (six years) are in the Laurentians, in the sub-watersheds of
Rivière du Nord (Lac Johanne) and Rivière du Lièvre (Lac Ouellet and Lac des Îles) (MDDEFP, 2014).
20Nombre de plans d'eau touchés
50
45
40
35
30
25
20
15
10
5
0
ne
n
is
u
is
re
re
re
he
ge
on
d
au wa
on
io
ea
hê
or
ua
év
èv
riè
ut
ou
m
nc
at
uy
a
N
in
-C
oj
Lo
ao
nt Kip
Li
au
ar
N
la
R
Q
in
at
B
B
ut
ite
S
G
K
O
e-
et
P
oi
P
Bassin versant
Figure 7. Number of water bodies affected by blue-green algae, by watershed (MDDEFP, 2014).
3.2.3 Lake acidity
Lake acidity may be of natural or human origin. Human caused acidification mostly occurred over the last 40 to
100 years, while lakes that are naturally acidic have been that way for millennia. Due to the geological nature of
its soils, the Outaouais region is strongly affected by lake acidification. Out of 178 lakes tested, 14.5% were found
to be acidic (pH ≤ 5.5), the percentage rising to 38.8% when transition lakes are included (pH 5.5-6), the level at
which biological damage can occur (MDDELCC, 2000). Figure 8 illustrates the problem of acid lakes in the
Outaouais rgion in comparison with the situation across Québec as a whole. The Laurentian region is somewhat
less affected by acidification: there are only 9.4% acid lakes and 20.8% transition lakes, compared to 69.8% non-
acid lakes out of the 96 tested.
21Figure 8. Levels of lake acidity in southern Québec (from Dupont, 2004).
To address the problem of lake acidification at source, Québec has joined with other industrialized states,
including Canada and the United States, in launching extensive programs to reduce emissions of sulfur dioxide
(SO2) and nitrogen oxides (NOx) at source. These programs have succeeded in lowering SO2 emissions by 50% to
70%, and the intended effects have begun to appear. However, while water quality has improved in many acid
lakes over the last decade, the problem persists in a great number of very sensitive lakes. In Québec, the recovery
of acid lakes is held back by three main factors: acid deposition rates that continue to exceed the lakes’ capacity to
maintain sufficiently high pH; the greater sensitivity of forest soils; and the increasing impact of nitrate fertilizers
(Dupont, 2004).
224 Groundwater
Under the Programme d’acquisition de connaissances sur les eaux souterraines (PACES – knowledge acquisition
program on groundwater), the MDDELCC mandated Université Laval to conduct research on all municipalized
territories in the Outaouais region (13 488 km²), in order to get an accurate portrait of the groundwater resource in
these parts and to fill the lack of information on these groundwater resources.. The ultimate goal is for the
knowledge obtained to serve in the protection and sustainable use of groundwater resources.
The territory examined for the study had a total area of 13 762 km2 and a population of over 341 000 (Comeau
and collab., 2013). Total annual water consumption was estimated at 94.9 million cubic metres (mcm) per year, of
which 19.4 mcm came from groundwater (about 20.4%). In the MRC of Papineau and the city of Gatineau, most
water is drawn from the surface supply, while in the other MRCs groundwater meets about 80% of needs. Over
the territory as a whole, groundwater is primarily used for residential purposes (71%), coming from individual
wells (63%) and municipal water systems (8%).
The findings and recommendations of PACES Outaouais provide a solid basis for reflection on the issues of the
Rivière des Outaouais watershed, particularly the lower section where the population is concentrated. The project
also produced a number of maps that display, among other things, the region’s geological formations, the
principal aquifers, their recharge zones and zones of high vulnerability to contamination. The maps also provide
information about the quality of groundwater supplies. For more information about the conclusions of PACES
Outaouais, go to http://rqes-gries.ca/fr/archives-et-documents/rapports-memoires-et-cartes/282-paces-
outaouais.html (French).
5 Biodiversity
5.1 Special-status species
The Centre de données sur le patrimoine naturel du Québec (CDPNQ – data centre on Québec’s natural heritage)
collects, analyses and publishes data on the elements constituting biodiversity, especially plant and wildlife
species of particular value. The data reveals, for the Rivière des Outaouais watershed, that 55 wildlife species
(CDPNQ, 2014a) and 213 plant species (CDPNQ, 2014b) have a status defined under the Act respecting
threatened or vulnerable species (CQLR chapter E-12.01). To learn more about the biodiversity of the Rivière des
Outaouais watershed, see Appendix I of this document and the Atlas de la biodiversité du Québec: les espèces
menacées ou vulnérables, at http://www.cdpnq.gouv.qc.ca/pdf/Atlas-biodiversite.pdf (French)
235.2 Forest wetlands
Based on data from ecoforestry maps in the third ten-year inventory, Ducks Unlimited Canada has mapped
(1/2 000) the wetlands of the Rivière des Outaouais watershed (Canards Illimités Canada, 2009; Figure 9). They
cover a total area of approximatively 9164 km2, or 8% of the entire watershed. As shown by Figure 10, most of
the wetlands are ponds or pools (33%). However, 28% of the wetland area consists of herbaceous meadows
(Figure 11). For more information on types of wetlands, see Appendix II.
Figure 9. Wetlands in the Rivière des Outaouais watershed (Ducks Unlimited Canada, 2009)
24Marécage Étang / Marécage Étang /
inondé Mare inondé Mare Marécage
15 % 33 % 11 % 9% résineux
Marécage
arbustif très pauvre
10 % 17 %
Marécage Marécage
arbustif résineux
Marécage
8% très pauvre
résineux
10 %
Herbaçaie pauvre
Herbaçaie 6%
(bogs, fens, Marécage (bogs, fens,
marais non résineux marais non
pauvre différenciés) Marécage Marécage Marécage
différenciés)
Marécage Marécage 28 % mixte feuillu résineux
21 % Marécage 2%
feuillu riche résineux riche riche riche
mixte riche
0% riche 3% 1% 15 %
1%
10 %
Figure 10. Relative numbers of wetland types in the Figure 11. Relative area (km2) of wetland types in the
Rivière des Outaouais watershed. Rivière des Outaouais watershed.
5.3 Designated protected areas
In December 2002, the Government of Québec adopted the Natural Heritage Conservation Act (CQLR c C-
61.01) with the aim of contributing to the objective of safeguarding the character, diversity and integrity of
Québec’s natural heritage. Protected areas are designed primarily to ensure the conservation of species and their
genetic diversity as well as the maintenance of the natural processes and ecosystems that are required for their
survival. No activity carried out in all or part of the territory of a protected area may alter the essential biological
character of that area.
Additionally, section 5 of the Act provides for the keeping of a register of the various protected areas. The register
is available for public consultation on the MDDELCC’s website, with information as to the purpose and
characteristics of the different categories of protected areas (MDDELCC, 2014e).
The Rivière des Outaouais watershed contains, in whole or in part, a number of designated protected areas with
various vocations. The total area they protect is approximately 7650 km² (Table 5),that is approximately 5% of the
Rivière des Outaouais watershed. Dedicated to the conservation and enhancement of the natural heritage, they are
primarily on lands in the public domain (Figure 12).
25Table 5. Protected areas in the Rivière des Outaouais watershed (MDDELCC, 2014c)
Area 1
Protected Areas by Designation Number
(km²)
Exceptional forest ecosystem 72 75.75
Habitat of a threatened or vulnerable plant species 4 1.91
Wildlife habitat
Waterfowl gathering area 75 217.70
White-tailed deer yard 25 788.43
Island or peninsula inhabited by a colony of birds 15 0.03
2
Heronry 53 14.98
Muskrat habitat 55 30.35
National park of Canada (Parc de la Gatineau) 1 361.31
National parks of Québec 5 2082.70
Parc national de Plaisance
Parc national d’Oka
Parc national d’Aiguebelle (in part)
Parc national du Mont-Tremblant (in part)
Parc national d’Opémican
Biological sanctuary 692 836.50
Migratory bird sanctuary (Île de Carillon) 1 4.65
Proposed aquatic reserve 2 1587.03
Vallée-de-la-Haute-Rouge
Rivière-Dumoine
18
Biodiversity reserve 2867.74
(inc. 16 proposed)
19
Ecological reserve 136.61
(inc. 1 proposed)
Recognized nature reserve 19 18.85
1
Total official size of protected area (may include a portion outside the Outaouais watershed).
2
Protected area including buffer strips of 0 to 200 m.
26Figure 12. Protected areas listed in the Registre des aires protégées par désignation (MDDELCC, 2014c).
6 Uses of the watershed
6.1 Drinking water
6.1.1 Administrative region of Outaouais
The Outaouais region has eight municipalities that are supplied by surface water. Their population comes to
around 277 500 people, or 72.8% of the total for the region. Most of their water is drawn directly from the main
section of Rivière des Outaouais. Their drinking water treatment plants were modernized recently, with the help
of various government support programs.
276.1.2 Administrative regions of Abitibi-Témiscamingue and Laurentides
Upstream, in the Abitibi-Témiscamingue region, and downstream in the Laurentides region, no treatment plants
take their water from the main section of Rivière des Outaouais.
6.2 Municipal wastewater
6.2.1 Rivière des Outaouais watershed
Most municipalities in the watershed have a municipal sewer system. However, at present there are eight that
discharge their untreated wastewater into 12 outfall structures (MDDELCC, 2014a). The outfalls are in Abitibi-
Témiscamingue (8), Laurentides (1) and Mauricie (3). The sub-watersheds affected by the discharges are those of
the Kipawa, À la Loutre, Des Outaouais, Gatineau, Fraser, Blanche and Kinojévis rivers, along with Ruisseau
Bryson.
6.2.2 Administrative region of Outaouais
Due to its character as a metropolitan region and its proximity to Canada’s capital, the city of Gatineau contains
over two thirds of the population of the Outaouais region. Most of the industries present, including the agri-food
sector, are served by the city’s wastewater collection system.
Gatineau operates a wastewater treatment plant constructed in 1982 that has been upgraded over the years. The
plant’s purification performance is very good, with a score of 100% in 2013 for discharge requirements, noted in
the annual performance evaluation report from the Ministère des Affaires municipales et de l’Occupation du
territoire (MAMOT, 2014).
The report also notes another reality, however: the presence of 92 overflow structures upstream of the wastewater
treatment plant. These structures are found in older parts of the city, on combined sewers, which collect not only
domestic sewage but also rainwater and snowmelt.
The discharging of untreated wastewater from overflow structures directly into the river (by both Gatineau and
Ottawa), and the discharging of non-disinfected wastewater by Gatineau, are the main issues in the water quality
protection plan for Rivière des Outaouais. Note however that authorization has been given for the installation of
ultraviolet disinfection equipment in Gatineau’s treatment facility. It is expected to enter operation by December
2015.
286.3 Industrial wastewater
6.3.1 Administrative region of Outaouais
Forest harvesting and the associated processing industries, which are important components of the region’s
industrial infrastructure, are independent when it comes to wastewater treatment. Of all industries in the
administrative region, pulp and paper mills use the most water and generate the most effluent.
The four such mills in the region are subject to effluent standards set out in the Regulation respecting pulp and
paper mills (CQLR chapter Q-2, r. 12.1). Thus, their wastewater is only discharged into the environment after
treatment.
Additionally, pursuant to division IV.2 (Depollution Attestation) of the Environment Quality Act (CQLR
chapter Q-2) and the Regulation respecting industrial depollution attestations (CQLR chapter Q-2, r. 1.01), there
is an economic motivation for such companies to reduce the amount of pollution they release, thanks to the duties
charged under the Regulation
6.4 Water withdrawals
With the adoption of the Act to Affirm the Collective Nature of Water Resources and Provide for Increased Water
Resource Protection (CQLR chapter C-6.2), known as the Water Act, a new authorization regime was established
for water withdrawals. The regime recognizes that priority must be given to the needs of the population, followed
by balancing the needs of ecosystems and economic activities. Under the Act, water withdrawal authorizations are
valid for a period of 10 years, with certain exceptions.
The Water Withdrawal and Protection Regulation (WWPR) (CQLR chapter Q-2, r. 35.2) was adopted on July
16, 2014. It completed the coming into force of the Water Act by implementing the new authorization regime that
the Act had introduced into the Environment Quality Act (CQLR chapter Q-2). With the provisions in its
chapters V and VI, the Regulation strengthens the protection of drinking water supply sources (MDDELCC,
2014g).
Of all industrial sectors in the Rivière des Outaouais watershed as a whole, the mining industry figures amongst
the ones who withdraw the most water.
296.5 Hydroelectricity
The Rivière des Outaouais watershed has around 43 hydroelectric plants with a generating capacity of over
3500 megawatts. For comparison, the Robert-Bourassa generating station has an installed capacity of
5616 megawatts, and can supply 1.4 million people (Hydro-Québec, 2010). The industry is thus a significant
contributor to the economy of Québec and Ontario (Ottawa River Regulation Planning Board, 1984).
6.6 Industry
6.6.1 Primary sector
In the primary sector, mineral extraction is represented by numerous quarries and sandpits (325 according to data
from the MDDELCC, of which 25 are significant according to the Ministère de l’Énergie et des Ressources
naturelles – MERN). Generally speaking, quarry and sandpit operations have little impact on groundwater, except
the lowering of the phreatic level when the extraction occurs below this level. Wastewater produced in the
operation of a quarry or sandpit or by a crushing or screening process must respect the standards for contaminant
concentrations specified in the Regulation respecting pits and quarries (CQLR chapter Q-2, r. 7).
It should be noted that fairly close to Rivière des Outaouais, there is an abandoned mine that generates acid mine
drainage. This is the 16-hectare site of the former New Calumet lead and zinc mine. In 2013 the MERN
performed a site characterization, and it is currently working on a remediation plan (MERN, 2014).
The primary sector also includes forestry operations, including logging and the floating of timber down rivers.
Although timber floating has been abandoned, it degraded the banks and beds of many rivers, many of which have
not been properly cleaned. As well, certain forestry companies have abandoned logging camps, piers and docks
without restoring the banks they degraded.
6.6.2 Secondary sector
Since the 1970s, various steps have been taken by the Government toward cleaning up industrial wastewater.
These include: the requirement for authorization before setting up any industrial establishment; the adoption of
regulations governing the pulp and paper and oil refining sectors; and the creation of specific intervention
programs, notably the Programme d’assainissement des eaux du Québec (PAEQ – wastewater purification
program), the Plan d’action Saint-Laurent (PASL – St. Lawrence action plan) and the Programme de réduction
des rejets industriels (PRRI – industrial emissions reduction program). For any establishment that discharges
effluent directly into the environment, the MDDELCC determines the level of treatment required (based on the
30quality criteria for surface water), and sets environmental discharge objectives accordingly, with consideration
given to the technology available and economically acceptable. As for the municipal level, by-laws governing the
discharge of industrial effluent into sewer systems have paralleled the construction of treatment plants.
6.6.3 Pulp and paper sector
As mentioned earlier, of all the industries in the Outaouais administrative region, pulp and paper mills use the
most water and generate the most effluent. Each mill discharges 0.3 to 54 million cubic metres of water per year
(2012 report, publication forthcoming). There are also two landfill sites containing waste from the mills; they
discharge respectively 75 000 and 971 000 m3/year of leachate into the environment. Table 6 below presents the
five pulp and paper mills in the region 2 , indicating the location of their intake and discharge points, the average
discharge flow and the type of treatment applied to their wastewater. These companies are subject to industry
standards for effluents under the Regulation respecting pulp and paper mills (CQLR, chapter Q-2, r. 27). Their
process waters are only released into the environment after treatment, considerably reducing the impact on the
receiving environment. For more information, including the companies’ emissions and environmental compliance
performance, see the annual environmental compliance reports on the pulp and paper sector at
http://www.mddelcc.gouv.qc.ca/milieu_ind/bilans/pates.htm (French).
Further, pursuant to division IV.2 (Depollution Attestation) of the Environment Quality Act (CQLR, chapter Q-2)
and the Regulation respecting industrial depollution attestations (CQLR, chapter Q-2, r. 5), such companies must
prepare and implement gradually depollution plans to comply with supplementary standards based on the
receiving environment. Besides, it is to their economic advantage to reduce the amount of pollution they release,
thanks to the duties charged under the Regulation. Determined on the basis of the weight of contaminants emitted,
not the volumes of water withdrawn or discharged, the duties are payable each year after the first depollution
attestation is delivered.
Further still, since the coming into force of the Regulation respecting the charges payable for the use of water
(CQLR chapter Q-2, r. 42.1), all industries that withdraw or use 75 m3 or more of water per day, whether directly
from the resource or from a water distribution system, must pay a charge per cubic metre of water used
(MDDELCC, 2014f).
2
Though located in the municipality of Témiscamingue, Tembec’s pulp and paper mill is included in the table because it
withdraws and discharges its water upstream from Rivière des Outaouais.
31Table 6. Characteristics of the five pulp and paper mills in the Outaouais region (2012 report, publication
forthcoming)
Industrial Final effluent
establishment Intake Discharge (discharge) Treatment of process
point point Flow in m3/yr wastewater
MUNICIPALITY (2012)
Resolute Forest Products 0
Inc., Gatineau Division Settling and biological
Rivière des Rivière des (operation treatment (activated
GATINEAU Outaouais Outaouais suspended since sludge)
2010)
Fortress Specialty Cellulose Settling and biological
Inc. Rivière des Rivière des
27 513 178 treatment (activated
Outaouais Outaouais
THURSO sludge)
Whitebirch (Papier Masson Settling and biological
Ltée) Rivière du Rivière du
8 248 215 treatment (activated
Lièvre Lièvre
GATINEAU sludge)
Kruger Products L.P. Rivière des Rivière des
5 586 016 Settling
GATINEAU Outaouais Outaouais
Tembec, pulp and paper Rivière des
Settling and biological
mill Rivière des Outaouais and 53 575 132 and
treatment (activated
TÉMISCAMING Outaouais Ruisseau 8 248 215
sludge)
Gordon
6.6.4 Lumber and wood products sector
Another important industrial sector in the Outaouais region is that of harvesting and processing wood. In 2009,
according to data from the MERN, some twenty large companies discharged 2000 to 900 000 m3 of water into the
environment.
6.6.5 Mines
In 2012 there were 16 mining projects in the Rivière des Outaouais watershed, most being in the Abitibi-
Témiscamingue region (11), along with four in Laurentides and one in Outaouais (Table 7; MERN, 2012). Their
location and status are presented in Figure 13. A “development” status means that a project has reached the stage
during which mining facilities are built and production begins, while a “Pre-development” status means that a
project is at the stage during which extensive, detailed studies are carried out.
32You can also read