CLIMATE TRENDS AND IMPACTS IN CHINA - DISCUSSION PAPERS - World Bank Documents
←
→
Page content transcription
If your browser does not render page correctly, please read the page content below
Authorized                                  Disclosure Authorized
S U S T APublic
          I N Disclosure
                A B L Authorized
                         E D E V E LPublic
                                     O PDisclosure
                                           MEN        T - E A SPublic
                                                                T Disclosure
                                                                      A S I AAuthorized
                                                                                 A N D PPublic
                                                                                          AC      IFIC

 THE WORLD BANK
                                                                                                          D I S C U S S I O N
                                                                                                          P A P E R S

                  September 2013
                                   Chris Sall
                                                CLIMATE TRENDS AND IMPACTS IN CHINA
                                                                                                                                85055
THE WORLD BANK

Climate Trends and Impacts in China

China and Mongolia Sustainable Development
Sustainable Development Department
East Asia and Pacific Region
September 2013
This volume is a product of the staff of the International Bank for Reconstruction and Development / The
World Bank. The findings, interpretations, and conclusions expressed in this paper do not necessarily reflect
the views of the Executive Directors of The World Bank or the governments they represent. The World Bank
does not guarantee the accuracy of the data included in this work. The boundaries, colors, denominations,
and other information shown on maps in this work do not imply any judgment on the part of The World Bank
concerning the legal status of any territory or the endorsement or acceptance of denoted boundaries.

The material in this publication is copyrighted. Copying and/or transmitting portions or all of this work
without permission may be a violation of applicable law. The International Bank for Reconstruction and
Development / The World Bank encourages dissemination of its work and will normally promptly grant
permission to reproduce portions of the work.

For permission to photocopy or reprint any part of this work, please send a request with complete information
to the Copyright Clearance Center, Inc.,
222 Rosewood Drive, Danvers, MA 01923, USA
telephone 978-750-8400, fax 978-750-4470
www.copyright.com
All other queries on rights and licenses, including subsidiary rights,
should be addressed to the Office of the Publisher,
The World Bank, 1818 H Street NW, Washington, DC 20433, USA
fax 202-522-2422,
e-mail pubrights@worldbank.org.

Cover photo by Arne Hoel
Contents

Acknowledgments......................................................................................... v

Abstract........................................................................................................... vii

Abbreviations.................................................................................................. ix

Introduction..................................................................................................... 1

   1. Temperatures, Including Extreme Heat and Cold...................................... 4

   2. Precipitation and Water Resources............................................................. 8

   3. Drought........................................................................................................ 15

   4. Floods.......................................................................................................... 18

   5. Tropical Cyclones....................................................................................... 20

   6. Sea-level Rise.............................................................................................. 22

   7. Conclusions................................................................................................. 24

References...................................................................................................... 25
Acknowledgment s

This background paper was prepared              Staton-Geddes (Operations Analyst,
as an input to a series on Climate Risk         World Bank) coordinated the editing and
Management and Adaptation in China              publication process. Anne Himmelfarb
(CLIMA). Each of the papers in the CLIMA        edited the final draft. Huang Dafei (Climate
series outlines a framework for managing        Change Specialist, World Bank) and Zhang
risks posed by present-day climate              Lijun (Operations Assistant, World Bank)
variability, extreme weather events, and        reviewed and edited the Chinese translation.
future climate change to an individual sector
in China, including transportation, urban       About the East Asia and Pacific
water utilities, and forestry.                  Sustainable Development
                                                Discussion Paper Series
The paper was written by Chris Sall             Sustainable development issues are an integral
(Consultant, World Bank; Affiliated             part of the development challenge in the East
Researcher, Center for International            Asia and Pacific (EAP) region. The World
Environment and Resource Policy, the            Bank’s Sustainable Development Strategy for
Fletcher School, Tufts University) under        the region provides the conceptual framework
the guidance of team leaders Paul Procee        for setting priorities, strengthening the policy
(Lead Urban Specialist, World Bank)             and institutional frameworks for sustainable
and Carter Brandon (Lead Economist,             development, and addressing key environmental,
Sustainable Development, World Bank),           social, and rural development challenges through
with contributions by Yu Rong (Consultant,      projects, programs, policy dialogue, nonlending
World Bank). The paper benefited greatly        services, and partnerships. The EAP Sustainable
from critical review and comments by Rosina     Development Discussion Paper series provides a
Bierbaum (World Bank Fellow on Climate          forum for discussion of good practices and policy
Change Adaptation), Abed Khalil (Water          issues within the development community and
and Climate Risk Management Specialist,         with client countries.
World Bank), and Mike MacCracken (Chief
Scientist for Climate Change Programs,          EAP Sustainable Development Discussion Papers
Climate Institute). Vivian Argueta-Bernal       carry the names of the authors and should be cited
(Consultant, World Bank) and Zuzana             accordingly. The findings, interpretations, and

                                                                 Climate Trends and Impacts in China   v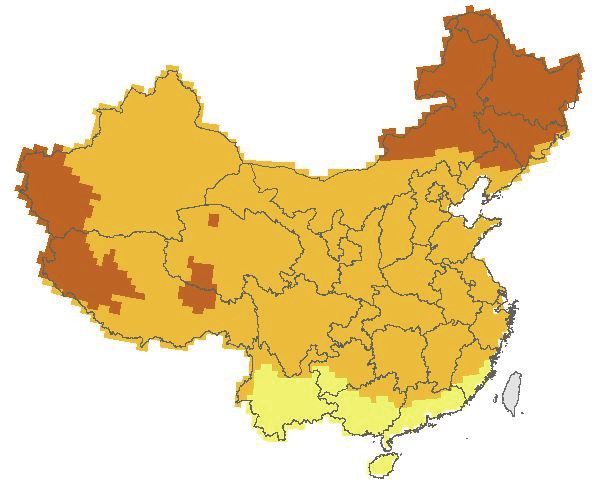
Acknowledgments

         conclusions expressed in this paper are entirely   does not guarantee the accuracy of the data
         those of the authors. They do not necessarily      included in this work. The boundaries, colors,
         represent the views of the International Bank      denominations, and other information shown on
         for Reconstruction and Development/World           any map in this work do not imply any judgment
         Bank and affiliated organizations, or those of     on the part of the World Bank concerning the
         the executive directors of the World Bank or the   legal status of any territory or the endorsement or
         governments they represent. The World Bank         acceptance of such boundaries.

   vi    Climate Trends and Impacts in China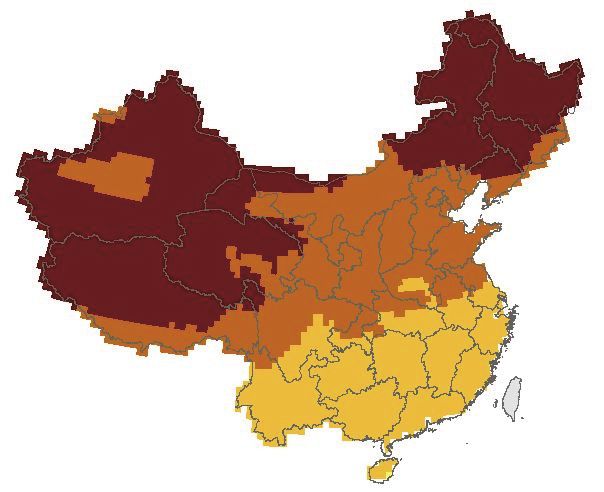
Abs tract

This discussion paper summarizes observed      and shifts have occurred in the distribution
and projected trends in extreme weather        of extreme weather events. The effects of
events, present-day climate variability, and   extreme weather events, present-day climate
future climate change and their impacts        variability, and future climate change cut
on China’s different regions. Findings are     across many different sectors of China’s
presented from China’s National Assessment     economy. China’s government estimates
Report on Climate Change (2007) and Second     that direct economic losses from extreme
National Assessment Report on Climate          weather events cost the country 1–3 percent
Change (2011) as well as other studies         of gross domestic product each year. As
by Chinese and international experts. In       China's economy continues to grow, its
addition to reviewing the physical climate     exposure to weather-related hazards is
science, the paper also looks at trends in     expected to heighten, especially without
economic damages in China from weather-        policies to limit building in hazardous areas
related hazards. The paper serves as           such as floodplains and alleviate non-climate
background for a series of discussion papers   pressures such as overuse of freshwater
on climate risk management and adaptation      resources. Effective risk management policies
in China.                                      and investments are crucial to reducing the
                                               sensitivity and increasing the resilience of
The growing body of scientific evidence        the country to extreme weather, climate
shows that China’s climate is indeed           variability, and long-term climate change.
changing, especially when climate is viewed
at the regional level. Temperatures are
rising, precipitation regimes are changing,

                                                              Climate Trends and Impacts in China   vii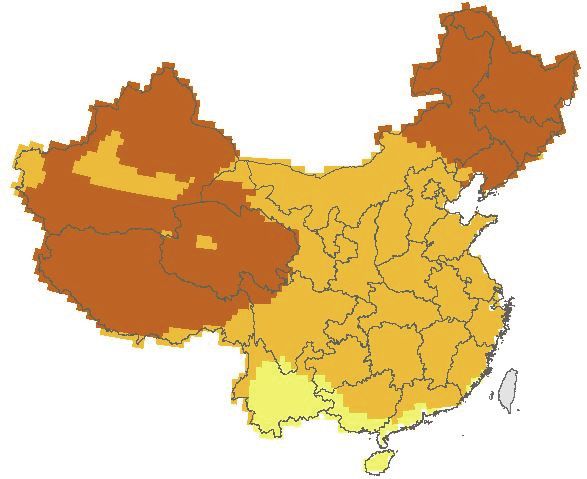
Abbre v iation s

CLIMA   Climate Risk Management and Adaptation in China

cm      centimeter

EAP     East Asia and Pacific

GCM     general circulation model or global climate model

GDP     gross domestic product

ha      hectare

IPCC    International Panel on Climate Change

km      kilometer

km2     square kilometer

m       meter

m3      cubic meter

mm      millimeter

OECD    Organisation for Economic Co-operation and Development

NARCC   National Assessment Report on Climate Change

                                                      Climate Trends and Impacts in China   ix
Introd uct ion
Introduction
Covering more than 9.6 million km2, China is a vast country with a diverse clima
Covering more than 9.6 million km2, China losses, damages from droughts and flooding
weather system is dominated by monsoons, which bring cold, dry air down from
is a vast country with a diverse climate. The have and
winters averaged 284
warm, moist airbillion yuan
up from the since
Indian 2006 and South China S
subcontinent
country’s weather system is dominated by (MWR
Parts 2006–2010;
of China Xinhua
along the southeastern 2012).
coast receive Since
around 2,000 mm of rainfal
the arid Northwest receives less than 25 mm. During the summers, temperature
monsoons, which bring cold, dry air down 1978, about one-quarter to one-third of the
reach more than 35C, while temperatures during the winters in Heilongjiang ca
from Siberia during the winters and warm, country’s farmland has experienced reduced
moist air up from the Indian subcontinent Asyields
a result each
of its large
yearterritory
due and
to diverse
floods, conditions,
droughts,China is exposed to a wid
related hazards, such as typhoons, heat waves, severe cold, floods, and drought
and South China Sea during the summers. wind, that
estimates hail, typhoons,
direct coldfrom
economic losses spells, freezes,
extreme weather events cost the co
Parts of China along the southeastern coast anddomestic
gross snow (figure 1).
product (GDP)each year (see Xinhua 2010).Among the reported
droughts and flooding have averaged284 billion yuansince 2006 (MWR 2006–20
receive around 2,000 mm of rainfall annually,
1978, about one‐quarter to one‐third of the country’s farmlandhas experiencer
while much of the arid Northwest receives due to floods, droughts, wind, hail, typhoons, cold spells, freezes, and snow (fig
less than 25 mm. During the summers, Figure 1: Percent of planted cropland in China
Figureaffected
1Percentby weather
of planted disasters,
cropland 1978-2008
in China affected by weather disasters, 19
temperatures in Chongqing routinely reach
more than 35˚C, while temperatures during 40%
the winters in Heilongjiang can dip below 35%
-40˚C. 30%
25%
As a result of its large territory and diverse
20%
conditions, China is exposed to a wide
15%
array of weather-related hazards, such as
typhoons, heat waves, severe cold, floods,
and drought. China’s government estimates Sources: NBS 1996a, 1996b-2009b, 2007c-2011c, 2009d,NBS
2010e;
Sources:NBS 1996a, 1996b‐2009b, 2007c‐2011c, 2009d, 2010e; and MEP 2005‐2011; MWR 2
that direct economic losses from extreme NBS and MEP 2005-2011;
Notes:“Affected” area refers toMWR 2006-2010;
the area of plantedXinhua 2012.
land were crop yields have declined by at leas
weather events cost the country 1–3 percent Notes: “Affected” area refers to the area of planted land were
crop yields have declined by at least 10 percent
of gross domestic product (GDP) each year The goal of China’s government is to cut direct economic losses from weather d
(see Xinhua 2010). Among the reported 2020,1yet this will be no easy feat. China is a rapidly urbanizing middle‐income c
economy and a quickly expanding stock of valuable assets such as buildings, roa
infrastructure. Without policies such as restrictive zoning codes and higher insu
discourage settlement and economic activities in the most hazardous areas, soc
will continue to drive up its levels of exposure. At the same time, projected chan
may also increase exposure. The current scientific research in China projects tha
drought will increase across the North, Northeast, and Northwest; flooding is ex
the middle and lower reaches of the Yangtze and Pearl River basins;a higher por
projected to come from shorter, intense storms in some regions; the melting of
1
The goal is stated in CMA Climate
(2010). Trends and Impacts in China 1
7 of 39Introduction
The goal of China’s government is to cut as greater evapotranspiration and water
direct economic losses from weather disasters demand from plants leads to more drying
in half by 2020,1 yet this will be no easy feat. and relative declines in vegetative growth.
China is a rapidly urbanizing middle-income In the southwest and northwest provinces,
country with a huge economy and a quickly high levels of warming by midcentury
expanding stock of valuable assets such as could also lead to shortages of freshwater
buildings, roads, and other infrastructure. from melting glaciers and mountain snows.
Without policies such as restrictive zoning Even in regions where annual precipitation
codes and higher insurance premiums is expected to increase, such as the North,
that discourage settlement and economic Northeast, and Northwest, it is unlikely that
activities in the most hazardous areas, social water stress will be alleviated, as absolute
and economic forces will continue to drive demand by industries, agriculture, and cities
up its levels of exposure. At the same time, continues to rise.
projected changes in China’s climate may
also increase exposure. The current scientific This discussion paper summarizes observed
research in China projects that evaporation and projected trends in extreme weather
and drought will increase across the North, events, present-day climate variability, and
Northeast, and Northwest; flooding is future climate change and their impacts on
expected to increase for the middle and China’s different regions. This summary
lower reaches of the Yangtze and Pearl is intended to serve as background for
River basins; a higher portion of rainfall a series of discussion papers on climate
is projected to come from shorter, intense risk management in adaptation in China.
storms in some regions; the melting of Research findings presented in the paper
glaciers in the Southwest and Northwest will are drawn from an extensive review of
affect river flows downstream; heat waves China’s National Assessment Report on
will become more common; and storm Climate Change (NARCC 2007) and Second
surges, tidal floods, and rising seas will National Assessment Report on Climate Change
threaten a larger area of coastal lands. (NARCC 2011) as well as other studies by
Chinese and international experts. Trends
Though less dramatic than extreme weather are summarized for average and extreme
events, long-term changes in average climate temperatures, precipitation, runoff and water
conditions also present risks. Available availability, droughts, floods, typhoons, and
research suggests that productivity gains sea-level rise. In addition to reviewing the
in agriculture and forestry from longer climate science, the paper also looks at trends
growing seasons, CO2 fertilization, and an in economic damages from weather-related
expanded area of potentially arable land hazards.
may be reversed at higher levels of warming
1
The goal is stated in CMA (2010).
2 Climate Trends and Impacts in ChinaIntroduction
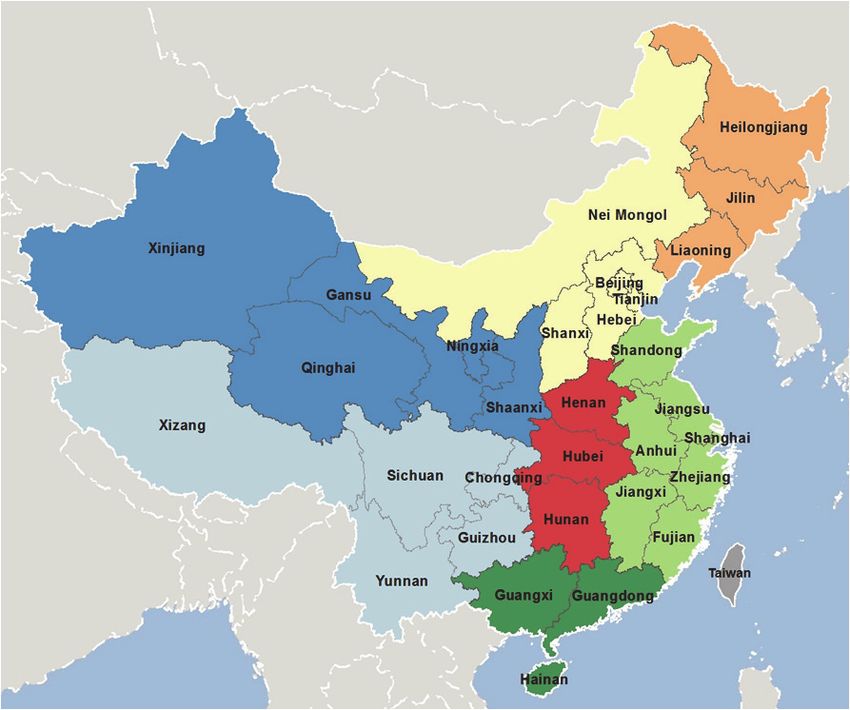
Unless otherwise indicated, the regions National Assessment Report (NARCC 2011),
referred to in this paper are defined illustrated below (map 1).
according to the groupings in China’s Second
Map
Map 1 1: Regions
Regions of China,
of China, as Defined
as Defined by theby the Second
Second National
National Climate Climate
Change Assessment Report
Change Assessment Report
Regions
of China
Central
North
Northwest Northeast
Southwest South
East No data
Source: Based on NARCC 2011
Source: Based on NARCC 2011
Notes: The regions
Notes: The regionscorrespond
correspondtotothose
thoseininChina’s
China’snational
nationalstatistical
statistical yearbooks
yearbooks
1 of 1
Climate Trends and Impacts in China 3Introduction
1. Temperatures, Including Extreme and Qian 2008). For the nation, the number
Heat and Cold of days each year with extremely high
Measurements from weather monitoring temperatures increased at a rate of about four
stations across China show that temperatures days per decade from 1965 to 2008 (Zhou and
increased an average of 1.4˚C between 1951 Ren 2010).3 Regionally, however, there were
and 2009 (NCCAR 2011). Winter days and pronounced differences. Parts of the interior
nights have warmed the fastest, especially Northwest experienced the largest increase
since the mid-1980s; the number of days with in the number of extremely hot days, while
temperatures below freezing has decreased; slight decreases in the number of hot days
and the coldest days are now milder (by were seen for parts of the South, Southwest,
about 2.5˚C compared to 1951). By contrast, and East (Zhang and Qian 2008; Zhou and
warming during the summers has been more Ren 2010). No clear trend was observed in the
gradual (NCCAR 2011; Zhou and Ren 2010). number or temperature of hot days for the
Yangtze River basin (Gong, Pan, and Wang
Changes in temperature have varied 2004; Zhang and Qian 2008). Furthermore,
markedly between regions. The most while there is no clear evidence that heat
pronounced warming has occurred in the waves (periods of more than six extremely
far North and high on the Tibetan Plateau, hot days in a row) have grown more frequent
where average temperatures in some areas on a national scale, the number of days each
have increased several times faster than year with record-breaking temperatures has
the rate for the nation overall (Liu and increased (Zhou and Ren 2010). Extremely
Chen 2000). Meanwhile, small parts of hot temperatures have been associated with
Yunnan, Guizhou, and Sichuan provinces increased public health problems in large
in the Southwest either saw no discernible Chinese cities. In July 2006, for example,
temperature change or became slightly a heat wave struck Chongqing. With
cooler over the past 60 years (NARCC temperatures in the city reaching as high
2011). 2 Urbanization has also played a as 44.5˚C, an additional 20,000 cases of heat
significant, though not fully understood, stroke were recorded (NARCC 2011). The
role in warming. The heat island effect from elderly are especially vulnerable to such
expanding cities may account for 40 percent extreme heat (Kan et al. 2007).
of the warming recorded by China’s network
of monitoring stations over the past 50 years Not surprisingly, while extremely hot days
(NARCC 2011). have become more frequent, the number of
extremely cold days has decreased (Zhang
The number of extremely hot days and Qian 2008; Zhou and Ren 2010; Qian
experienced each year has increased on the 2011; Gong et al. 2012). On the whole, the
whole for China (Zhou and Ren 2010; Zhang number of extremely cold days experienced
2
The reason for this lack of measurable warming in parts of the Southwest is not yet clear (Chen, Liu, and Ma 2002). Possible causes
suggested by previous research include reduced solar radiation due to backscatter and cloudiness from human-emitted aerosols in
the lower atmosphere. See Li et al. (1995), for example.
3
Days with extremely high temperatures are defined as days for which the highest temperature exceeds a relative threshold far
above what is considered normal. Zhou and Ren (2010), for example, define this threshold as 90 percent of the highest daily
temperature recorded between 1970 and 2000 for a given monitoring station.
4 Climate Trends and Impacts in ChinaIntroduction
each year decreased at a rate of seven days Furthermore, milder winters have also led
per decade for the nation between 1956 to worse outbreaks of pests (Piao et al. 2010),
and 2008. Over these 52 years, the lowest and while the number of heating days has
temperature of the coldest days rose by declined, energy savings from this decrease
about 3˚C (Zhou and Ren 2010; see also Qian have been offset by population growth,
2011).4 Similarly, the number of frost days housing construction, changes in heating
(with low temperatures below freezing) methods, and increased demand for air
has also decreased. On average, nationwide conditioning and other electrical appliances.
there were 10 fewer frost days annually in
1990 than in 1960 (Zhai and Pan 2003). The According to the Intergovernmental
decrease in the number of cold days was Panel on Climate Change (IPCC), average
most pronounced for parts of the North and surface temperatures are projected to rise
Northeast (Zhang and Qian 2008). another 1˚C to 5˚C globally by 2100 (Meehl
et al. 2007), depending on the sensitivity
The observed warming in recent decades of the climate to increased atmospheric
has benefited farmers in the northern concentrations of greenhouse gases, the
provinces by lengthening the growing ambitiousness of the world’s countries
season—allowing for earlier planting to reduce emissions, and other uncertain
and later harvesting—and by expanding factors. Drawing on results obtained from
the area in which crops such as rice can 22 global climate models used in the IPCC’s
grow. Warmer springs have contributed Fourth Assessment Report (Solomon et al.
to accelerated and more vigorous growth 2007), China’s Second National Climate
of forests and grasslands in the North and Change Assessment Report (2011) projects
Northwest (see Zhang forthcoming; Sall an increase in average annual temperatures
and Brandon forthcoming). Yet despite of 2.5˚C to 4.6˚C for the nation by the end
warmer temperatures and fewer days with of this century. Warming is projected to
freezing temperatures, the area of cropland continue to be the greatest for the North,
reportedly affected by cold snaps and Northwest, Northeast, and Tibetan Plateau.
freezing temperatures has actually increased In Xinjiang, for example, middle-of-the-
for every region except the Northeast road projections of annual temperatures
(where no statistically significant change show 2.5°C to 3.3°C of warming by the
was observed). This observed increase in 2050s and 3.3°C to 4.8°C of warming by the
exposure was driven almost entirely by the 2080s (see figure 2).6 Most of the additional
expanding area of crops being planted. 5 increase in average temperatures will come
4
An extremely cold day is defined by Zhou and Ren (2010) as a day for which the daily low temperature is within 10 percent of the
coldest daily temperature recorded for a given monitoring station between 1970 and 2000. As with extreme high temperatures, the
way “extremely cold days” are defined and calculated can influence results (see Zhang and Qian 2008).
5
The rates of increase in planted area by region are far greater than the rates for area affected by cold spells and freezing
temperatures, with the exception of the eastern provinces, where the planted area has actually decreased, while the area affected
by cold snaps and freezes has increased. Results are from author’s calculations using statistics for reported area of cropland
affected by cold spells and freezing temperatures by the provinces for 1978 to 2007 (NBS 2009). Note that the observed increase
could also be due to improved reporting over the years. Also note that the definitions of regions in the underlying statistical
yearbook differ from those used in the Second National Assessment Report on Climate Change.
6
The projections for average annual temperatures in Xinjiang reported here refer to the 20th and 80th percentiles of results from 16
GCMs reviewed in the IPCC Fourth Assessment Report. See figure 2 for data sources.
Climate Trends and Impacts in China 5Introduction
from warmer nights (higher lows) (NARCC productivity (biomass growth in plants) will
2011; Li and Zhou 2010), though the results decrease by more than 40 percent for much of
of some finer-scale regional models project the country (Wu et al. 2007). Such warming is
that summers could warm even faster than expected to have profound negative impacts
winters toward the end of this century (Gao, on the functioning of ecosystems—from
Shi, and Giorgi 2010, 2011; Yang et al. 2010). the alpine tundra of the Tibetan Plateau to
Hotter temperatures during the summer the wetlands of the central provinces to the
months could cause greater drying and coral reefs along the southern coast—and to
exacerbate water shortages (Piao et al. 2010). increase the risk of irreversible species loss (see
Fischlin et al. 2007; Wu and Lü 2009; Ramsar-
With additional warming, it is also “very CBD 2007; Xiao et al. 2011; NARCC 2011).
likely” (that is, there is a 9 in 10 chance) that Warming also affects people’s health. Health
the intensity, frequency, and length of heat effects associated with higher temperatures
waves will increase globally (Meehl et al. include higher bacterial and fungal content
2007; Seneviratne et al. 2012).7 In China, the in surface waters, higher survival rates
number of hot days per year with average for waterborne pathogens, greater disease
temperatures above 35˚C is expected to transmission, and host susceptibility (Harvell
increase from 4 to around 20 by the end of et al. 2002; Bates et al. 2008). Research shows
the century (NARCC 2011). The number that as winter weather continues to grow
of consecutive hot days is also projected to warmer, schistosomiasis could spread to
increase (Yang et al. 2010). Meanwhile, a provinces farther north (Zhou et al. 2010;
decrease in the number of cold nights and Zhou et al. 2008). Higher concentrations of
days over most of the world’s land areas is microbes and other temperature-dependent
“virtually certain” (Seneviratne et al. 2012). pollutants in rivers and reservoirs will in turn
require greater investment in water treatment
Available research shows that additional facilities and processes. There is also evidence
warming will have far-reaching and complex that warming is elevating ground-level
effects on the health of China’s agriculture, concentrations of ozone and smog in cities
ecosystems, and people (NARCC 2011). The (Murray et al. 2012). A rapidly urbanizing
area of arable land in northern China will and aging population will only amplify health
continue to grow; however, productivity problems related to extreme heat. A recent
gains from higher temperatures could be review commissioned by the World Bank
undone by the consequent increases in provides additional insight into the dangers
evaporation and demand for water (NARCC that high levels of warming are expected to
2011). Some studies indicate that at higher have for China and other countries (see box 1).
levels of warming (above 3˚C), net primary
7
Statements about the likelihood of changes presented in this paper follow the standard language set out in Mastrandrea et al.
(2010) for the characterization of uncertainty. Outcomes that are “virtually certain” are assigned a 99–100 percent probability
of occurring; “very likely” outcomes are assigned a 90–100 percent probability; “likely” outcomes a 66–100 percent probability;
“unlikely” outcomes a 0–33 percent probability; “very unlikely” outcomes a 0–10 percent probability; and “exceptionally unlikely”
outcomes a 0–1 percent probability. Outcomes that are “about as likely as not” are assigned a 33–66 percent probability. Where this
paper does not use the IPCC language set out by Mastrandrea et al. (2010), no statement of likelihood is intended. In these cases,
changes are said to be “projected” or “may” or “could” occur. This paper is meant to be a literature review. It does not set out to
make an independent scientific assessment of the potential likelihood of observed and projected events, trends, or other outcomes.
6 Climate Trends and Impacts in ChinaIntroduction
Box 1: Why a 4°C Warmer World Must Be Avoided
The current level of ambition to reduce greenhouse gas emissions reflected in the Copenhagen and Cancun pledges will put
the world on a path for warming of more than 3°C. If pledges are not met, then there is a 40 percent chance of more than
4°C warming by the end of this century. Turn Down the Heat (2012), a report for the World Bank by the Potsdam Institute
for Climate Research and Climate Analytics, finds that 4°C of warming is likely to take us into a world of wide-ranging and
dangerous risks.
One of the greatest dangers of a 4°C warmer world is the increased likelihood of crossing nonlinear tipping points, thus
bringing about abrupt changes in climatological, hydrological, and ecological systems. Examples of abrupt changes include
the breaking up of the West Antarctic ice sheet, the dieback of the Amazon rainforests, the disintegration of corals, and large-
scale crop failures.
Nonlinear changes in natural systems will likely have cascading impacts on human development at the national and regional
scale. Regional crop failures, for example, could cause spikes in food prices, cutting into wages for poorer households
especially, and putting a drag on GDP growth. As has been the case with warming observed so far, developing countries are
likely to be affected most by such impacts.
The ability of society to cope with large, abrupt changes is limited. As the Potsdam Institute study concludes, “given that
uncertainty remains about the full nature and scale of impacts, there is also no certainty that adaptation to a 4°C world is
possible. A 4°C world is likely to be one in which communities, cities, and countries would experience severe disruptions,
damage, and dislocation, with many of these risks spread unequally” (Potsdam Institute 2012, xviii).
Figure 2: Projected changes in average seasonal temperatures, 2050s and 2080s
2050s 2050s 2050s
Winter Summer Annual
2080s 2080s 2080s
Winter Summer Annual
Change relative to baseline (1961–1990)
1C 2C 3C 4C No data
Source: Author, using data from Climate Wizard, The Nature Conservancy (accessed July 2013), http://www.climatewizard.org/.
Note: The figure shows changes in average temperatures for 2041–2070 and 2061–2090 under a “middle-of-the-road” emissions
scenario (SRES A1B) compared to average temperatures in the 1961–1990 baseline climate. The temperature changes shown in
the figure are those projected by the “middle” model of an ensemble of 16 global climate models (GCMs). GCM results have been
downscaled to a spatial resolution of 0.5° x 0.5°.
Climate Trends and Impacts in China 7Introduction
2. Precipitation and Water Yellow River basin and most of northern
Resources China. These trends in spring and summer
Annual precipitation did not exhibit rainfall are especially important because
a significant change over the last half 50–70 percent of the country’s annual
of the 20th century for the nation as a precipitation usually comes during the
whole (NARCC 2011; Zhai et al. 2005; summer, and spring and summer are the
Ren et al. 2008; Piao et al. 2010). Yet these prime growing seasons (Zhai et al. 2005).
overall trends mask significant regional
and seasonal variation. Precipitation has Together with warmer temperatures,
declined for much of the northeastern part changes in precipitation observed in the
of the country (including the Yellow, Liao, northern river basins have affected water
and Hai River basins) and increased for resources (NARCC 2011; Wang and Zhang
the Yangtze River basin and northwestern 2011). In such dry regions, surface water
China (NARCC 2011; Zhai et al. 2005; Ren availability is particularly sensitive to
et al. 2008; Piao et al. 2010; Shen 2010). 8 changes in the volume, timing, and intensity
These changes may be associated with the of precipitation. Rainfall is concentrated
Pacific Decadal Oscillation or a shift in the during just a few months, and year-to-year
East Asian summer monsoon system, which variability tends to be greater (Kundzewicz
delivered less moisture to northeastern et al. 2007). Since 1950, annual flow volumes
China and brought more to the southern measured at gauging stations in mid to lower
part of the country (NARCC 2011; Ma and reaches of the Yellow River have declined by
Ren 2007; Zhai et al. 2005; Ren et al. 2008). 21–39 percent, while flows in the Hai River
The number of rainy days each year has basin have diminished by 24–65 percent
decreased everywhere except in parts of (NARCC 2011). By contrast, there were no
western China (Zhai, Wang, and Li 2007; significant long-term trends observed for
Zhai et al. 2005). This decrease has been runoff in the Huai, Yantgze, and Pearl Rivers
offset by a slight but statistically significant (Zhang et al. 2007).
increase in the frequency and intensity of
extreme precipitation events, especially in Water availability is also highly sensitive
south and southwest China (Wang and Qian to nonclimate pressures such as land use
2009; Zhai, Wang, and Li 2007; Zhai et al. patterns and the rising demand for water.
2005). Seasonally, winter precipitation has Nationwide, consumptive water use in
increased in Tibet and parts of south China, China has increased from 481 billion m3 in
but decreased over most of north China 1987 to 590 billion m 3 in 2011 (see box 2).
and the Sichuan basin. Spring precipitation Water use has increased most dramatically
has increased in the Southwest and South in regions such as the North China Plain,
and decreased over most of northern China where irrigated agriculture has expanded
and the mid to upper Yellow River basin. by nearly 8 million hectares over the past 30
Summer rainfall has increased for the years (Li 2010). In fact, there is evidence that
Yangtze River basin and decreased for the demand for water had an even larger effect
8
Piao Shilong and his coauthors argue that these regional trends “appear to fall within the bounds of normal decadal variability of
rainfall” (Piao. et al. 2010, 44).
8 Climate Trends and Impacts in ChinaIntroduction
than the climate in reducing river runoff by agriculture, industry, and cities accounted
in the northern basins during the late 20th for about 60 percent of the observed change
century. In the mid to lower section of the in flow volumes between 1970 and 2000
Yellow River basin, for example, water use (NARCC 2011).
Box 2: Water Demand and Scarcity in China
China is a water-scarce country. Nationwide, per capita freshwater resources are 2,310 m3 (NBS 2011c), which is about one-
quarter the world average. In the dry regions of the North and Northeast, freshwater resources are only 785 m3 per person,
about 200 m3 less than the international threshold for “severe” water stress, below which there is a high likelihood of frequent
shortages and supply disruptions (see UNDP 2006).
Agriculture continues to be the biggest user of water, followed by industry and households, as illustrated in figure B2.1. In
2010, the agricultural sector consumed 370 billion m3 of water; industry consumed 145 billion m3, and households in urban
areas used 77 billion m3.
Figure B2.1: Water Withdrawals in China by Sector, 1987-2010
450
400
350
Billion cubic meters
300
250
200
150
100
50
0
1987 1997 2000 2005 2010
Agriculture Industry Domestic
Source: World Bank data, http://data.worldbank.org (accessed September 2012); NBS 2012c
There is strong evidence that the continued growth of agriculture and industry, coupled with the lifestyles of an increasingly
affluent population, will increase demand for water in the coming decades (Rosegrant, Cai, and Cline 2002; Alcamo, Henrichs,
and Rösch 2000; Alcamo et al. 2003; Alcamo, Flörke, and Märker 2007; 2030 Water Resources Group 2009; Hubacekand
Sun 2005; Xionget al. 2010). In a reference case scenario, total withdrawals of surface water and groundwater could reach
nearly 820 billion m3 by 2030 (2030 Water Resources Group 2009),9 an increase of 35 percent over 2010 (NBS 2011c). In a
continuation of current trends, water use by industries and households in cities is projected to grow the fastest. Agricultural
water use is projected to decline as more efficient irrigation technologies are introduced and the composition of China’s
economic activity gradually shifts toward higher-value-added sectors, though it will continue to account for the largest bulk
of water withdrawals (Rosengrant, Cai, and Cline 2002).
These results indicate that the growth in demand for China’s scarce resources will continue to exacerbate water stress, even
in the absence of climate change. Even under a balanced growth scenario in which local governments give higher priority to
environmental protection, Xiong Wei et al. (2010) project that by 2050, all of the major basins currently experiencing severe
water stress will face even greater shortages. Baseline projections from the Organisation for Economic Co-operation and
Development (OECD) for global water stress by 2050 also show that stress for all major basins is expected to increase, with
the Yellow, Hai, and Liao basins remaining under the greatest pressure (OECD 2012).
9
This business-as-usual projection of China’s water resource requirements by the 2030 Water Resources Group (2009) assumes that
existing policy regimes remain in place and that current levels of efficiency hold. It is roughly consistent with earlier projections of
China’s water needs in 2025, based on more sophisticated global modeling of water supply and demand by Alcamo, Henrichs, and
Rösch (2000); Alcamo et al. (2003); Alcamo, Flörke, and Märker 2007; and Rosegrant, Cai, and Cline (2002).
Climate Trends and Impacts in China 9Introduction
How precipitation patterns in China will change temperatures, a northward tracking of mid-
over the next decades is not wellestablished latitude storms, and more moisture being
(NARCC 2011). Examining the results from 18 transported to these dry regions (Meehl et
global climate models included in the IPCC’s al. 2007). In contrast with the global models,
Fourth Assessment Report, Li and Zhou however, the regional models reflect a
(2010) found that by mid-century (2040–2059) decrease in summer rainfall of around
annual precipitation was generally expected to 4 percent nationwide in both a middle-
increase for most of China under a middle-of- and high-emissions scenario. The greatest
the-road emissions scenario (the A1B scenario), difference is in southwestern China; an
with the largest increases expected for parts of average decrease of 6–7 percent is expected
the Southwest and the mid to lower reaches during the summers for Tibet and Yunnan.
of the Yangtze River. However, the models
show little agreement, and the resulting trends Projected changes in precipitation will
are statistically weaker than the background continue to influence future water
variation or “noise” for all of China except parts availability. Overall, by late century, surface
of western Sichuan, Tibet, and the Northeast. runoff is projected to decrease in the North
The downscaled results from a subset of seven and Northeast, as the effects of drying
global models in the larger ensemble evaluated associated with warmer temperatures
by Li and Zhou (presented in figure 3) illustrate outweigh the effects of projected increases
this lack of agreement, particularly in the South in rainfall. Runoff in the central, southern,
and Southwest. and southwestern provinces, meanwhile,
is projected to increase along with heavier
By comparison with the coarse-resolution rains in the summers (NARCC 2011). Yet
global models, the finer-scale regional climate the size and even the direction of change
model (RegCM3) considered by the Second in surface water availability are still highly
National Assessment Report on Climate Change uncertain. Projections are highly sensitive to
is better at representing the effects of the future emissions scenarios and to biases in
country’s varied topography (NARCC 2011). the underlying results of the global climate
The results of the underlying study cited by models that are fed into the hydrological
the assessment report (Gao, Shi, and Giorgi models (Piao et al. 2010). One study, for
2010, 2011) and other studies using the same example, projected that by 2030, summer
model (Gao et al. 2012a, 2012b) are illustrated runoff in the Liao River basin could decrease
in figure 4. In this illustration, the RegCM3 by 7 percent in a low-emissions (B2) scenario
regional model is driven by two separate or increase by 21 percent in a middle-
global models (MIROC3.2 and FvGCM) emissions (A1B) scenario; runoff in the Hai
under two separate emissions scenarios (A1B River basin could decrease by 8 percent
and A2). Like the global models, the regional in a low-emissions scenario or increase by
models show an increase in precipitation 10 percent in a middle-emissions scenario
10
from winter snows and rain across the North (Wang et al. 2012).
and Northwest. This may be due to milder
10
Results are based on modeling done by Wang et al. (2012) using a VIC hydrological model and PRECIS climate model to analyze
trends from 2021 to 2050.
10 Climate Trends and Impacts in ChinaIntroduction
Even if annual precipitation increases in the These glaciers provide a crucial supply for
water-stressed parts of the North, Northeast, hundreds of millions of users in China and
and Northwest, it is unlikely that shortages downstream countries (Erikkson et al. 2009;
will be alleviated if upward trajectory in the Xu et al. 2009). For example, meltwater
demand for water is not curbed (NARCC accounts for 30–80 percent of water supply
2011). In a “normal” (wetter) climate in the Tarim basin in the Northwest (NARCC
scenario, water shortages in the Beijing- 2011). More than 80 percent of China’s
Tianjin-Tangshan region are still projected to glaciers have begun to retreat more quickly
reach 5 billion m3 per year by 2030, shortages in recent decades (Yao et al. 2004), which has
in the Hai-Luan basin could reach 57 billion increased water supply in the short term.
m3, shortages in the Yellow River basin could While higher temperatures are expected
reach 36 billion m 3, and shortages in the to increase the flow of glacial meltwater
Huai River basin could hit 19 billion m3. In in the near term (and cause flooding), by
this scenario, the effects of baseline growth mid to late century, the reduced size of
in population and economic activity account glaciers, and the water they store, could
for 71–83 percent of the shortfalls (Wang and cause shortages downstream (Eriksson et
Zhang 2011). al. 2009; Xu et al. 2009). China’s previous
National Climate Change Assessment Report
Along with rising demand for water, estimated that for a rise in average surface
interannual variability in rainfall and the temperatures of 1.9–2.3˚C, glacier coverage
proportion of rainfall from short, intense in the Northwest will shrink by 27 percent
storms is also projected to increase (Gao et al. (NARCC 2007); by 2100, it is projected that
2012a, 2012b; Shi et al. 2010; NARCC 2011). glacier ice volumes could be 45 percent
More than three-quarters of the additional smaller (cited in Ni 2011). The rapid melting
precipitation expected for the Northeast of glaciers and reduced snowmelt in alpine
and the Yellow and Huai River basins is areas of the Southwest and Northwest is
projected to come from days of heavy rain. also associated with landslides, debris flows,
As a result, the timing of flows would be flashfloods, and shifts in vegetation types
less predictable, and runoff would be more dependent on meltwater. Taken together,
difficult to capture and store. Such “lumpy” the altered water balance, the loss of alpine
hy d r ol o g y woul d a l s o l ea d t o h i gh e r wetlands, the destruction of permafrost, and
concentrations of nonpoint source pollutants the degradation of rangelands observed in
in surface waters, reducing the quality of parts of the Southwest and Northwest have
water at intake points for water utilities. profound implications for the agricultural
and pastoral livelihoods of rural people (Sall
In the Southwest and Northwest, the and Brandon forthcoming; Xu et al. 2009;
availability of freshwater will also be Erikkson et al. 2009).
influenced by the accelerated melting of
China’s glaciers. China has more than 46,000 Changes in seasonal precipitation
glaciers in the Himalaya, Nyainqêntanglha, along with temperature and potential
Kunlun, Karakoram, and Tianshan mountain evapotranspiration will play a pivotal role in
ranges (Wang and Liu 2001; Li et al. 2008). the advance or retreat of deserts in arid and
Climate Trends and Impacts in China 11Introduction
semi-arid parts of northern and northwestern (general circulation models, or GCMs)
China. Between the mid-1950s and the end driving these projections are themselves
of the 1990s, more desert area in China was driven by projected changes in precipitation,
revegetated than new desert was created they suffer from the same uncertainty as the
(Wang et al. 2008). While there is substantial models mentioned above. Results should be
debate as to whether climate change or local interpreted with caution, especially because
resource use has had a greater influence the models do not take into account changing
in reversing desertification (Wang et al. land use patterns, population growth, or
2008, 2009; Chen and Tang 2005; Su et al. government policies that can improve or
2006), it is clear that the climate has played degrade vegetative cover in areas susceptible
at least some role. Since the 1980s spring to desertification.
precipitation has increased, wind erosion has
lessened, and vegetation has anchored sand
dunes in Northern and Northwestern China
(Wang et al. 2008). Whether these trends will
continue in the immediate future is unclear.
In the longer term, researchers project that
deserts in western and eastern China may
begin to expand, while desertification in
central China may be reversed. 11 Because
the results of the global climate models
11
Results are for the 2040s, as modeled by the ECHAM4 and HadCM3 global climate models under the IPCC SRES A1F1, A2a,
A2b, A2c, B2a, and B2b scenarios. The parts of western China where desertification is generally expected to increase include
the Taklimakan, Gurbantunggut, Kumutage, and Caldam deserts; the parts of eastern China where desertification is generally
expected increase include the Horqin, Otindag, and Hulunbeir deserts. The parts of central China where desertification is generally
expected to decrease include the BodainJaran, Tengger, Mu Us, and Hobq deserts (Wang et al. 2009).
12 Climate Trends and Impacts in ChinaIntroduction
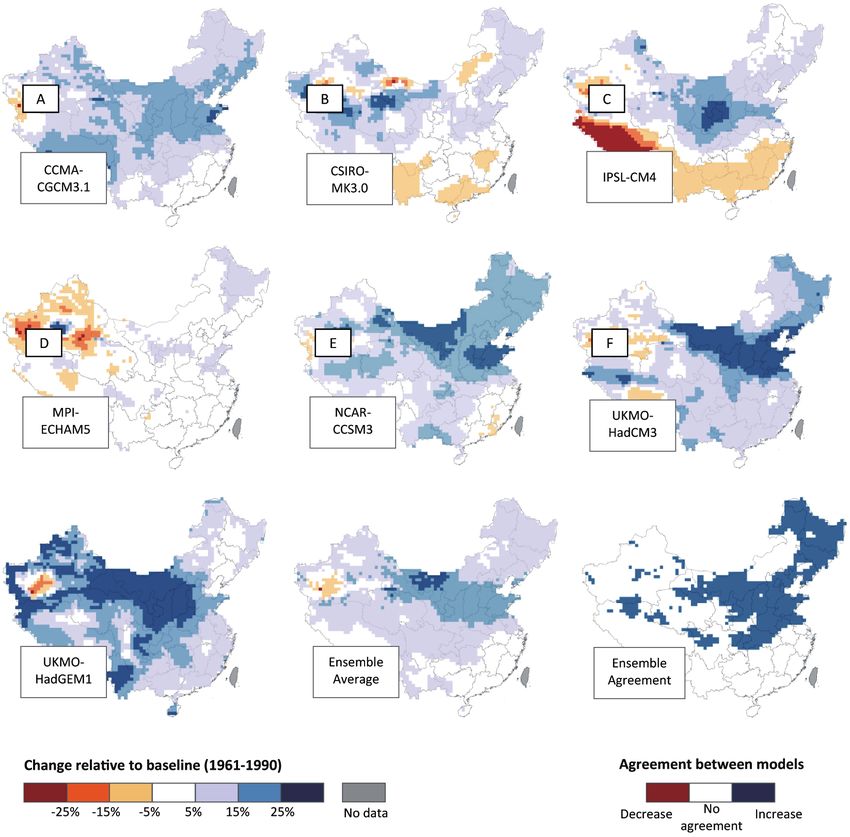
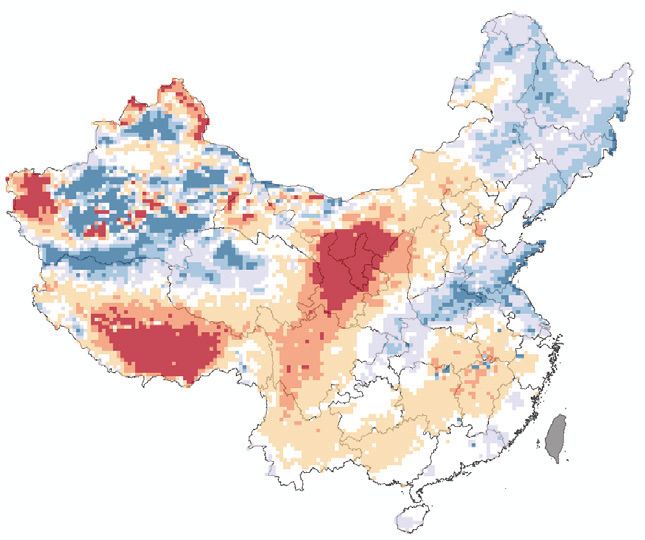
Figure 3: Projected change in annual precipitation for 2041-2060 compared to baseline climate
(1961-1990), as represented by seven downscaled global climate models
Notes and sources: created with data from global climate models included in the IPCC Fourth Assessment Report: CCMA-
CGCM3.1(T47) (Flato 2005); CSIRO-MK3.0 (Gordon et al. 2002); IPSL-CM4 (Hourdinet al. 2006); MPI_ECHAM5 (Roeckneret al.
2003); NCAR-CCSM3 (Collins et al. 2004); UKMO-HadCM3 (Pope et al. 2000); and UKMO-HadGEM1 (Martin et al. 2004). Data were
downscaled to resolution of 30 arc minutes using ClimGen statistical method (Osborn 2009), and obtained from the CCAFS GCM
Data Portal (http://www.ccafs-climate.org/).
Climate Trends and Impacts in China 13Introduction
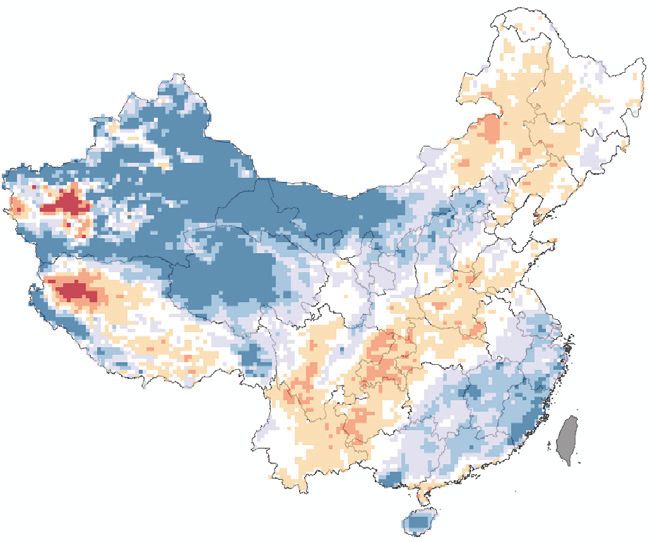
Figure 4Projected
Figure 4: Projectedchanges in seasonal
changes precipitation
in seasonal for the for
precipitation 2080s
the(2071-2100) comparedcompared
2080s (2071-2100) to baselineto
climate in 1970s (1961-1990), under twodynamic regional climate model scenarios
baseline climate in 1970s (1961-1990), under twodynamic regional climate model scenarios
A B C
FvGCM-RegCM3, FvGCM-RegCM3, FvGCM-RegCM3,
A2 scenario, A2 scenario, A2 scenario,
Winter Summer Annual
D E F
MIROC-RegCM3, MIROC-RegCM3, MIROC-RegCM3,
A1B scenario, A1B scenario, A1B scenario,
Winter Summer Annual
Change in 2041-2060 relative to 1961-1990 (above)
-25% -15% -5% 5% 15% 25% No data
Agreement between regional climate scenarios (below)
Decrease No Increase No data
agreement
G H I
Scenario Scenario Scenario
agreement, agreement, agreement,
Winter Summer Annual
Sources:FvGCM-RegCM3 results for high emissions scenario (A2), based on Gao X.J. et al. (2010 and 2011); MIROC-
Sources: FvGCM-RegCM3 results for high emissions scenario (A2), based on Gao X.J. et al. (2010 and 2011); MIROC-RegCM3results
RegCM3results from Gao X.J. et al. (2012a and 2012b); data for both scenarios obtained from China Regional Climate Change
from Projection
Gao X.J. etData
al. (2012a and 2012b); data for both scenarios obtained from China Regional Climate Change Projection Data site
site (http://www.climatechange-data.cn/).
(http://www.climatechange-data.cn/).
20 of 39
14 Climate Trends and Impacts in ChinaIntroduction
3. Drought stressed regions has also increased (see figure
5). The observed increase in exposure is due
On average, droughts affected 25 million
primarily to the fact that a larger area of land
hectares each year from 1977 to 2008 (NBS
has been brought under cultivation.12 There is
1996a, 1996b–2009b, 2007c–2011c, 2009d,
no evidence that the intensity of drought has
2010e). Direct economic losses from drought
worsened (Qian 2011).
between 2006 and 2011 were particularly
severe, averaging 115 billion yuan at 2011
Beyond the dry lands of China’s north, in
prices (MWR 2006–2010; Xinhua 2012).
recent years Yunnan, Guizhou, Guangxi, and
Sichuan Provinces have also experienced a
As precipitation and soil moisture in the Song,
spate of bad droughts. The drought that hit
Liao, and Hai River basins has declined, data
the Southwest in the winter of 2009–2010, for
collected from China’s network of weather
instance, caused direct losses of 82.2 billion
monitoring stations reveal that the area affected
yuan in Yunnan and Guizhou (about 8
by drought in these regions has expanded (Ma
percent of their combined GDP in 2009), and
and Ren 2007; Zou, Ren, and Zhang 2010; Qian,
left 23.3 million people and 16.3 million head
Shan, and Zhu 2011; see also Zhai and Zou
of livestock facing severe water shortages
2005). The exposure of the agricultural sector to
(MWR 2010).
drought in the provinces that form these water-
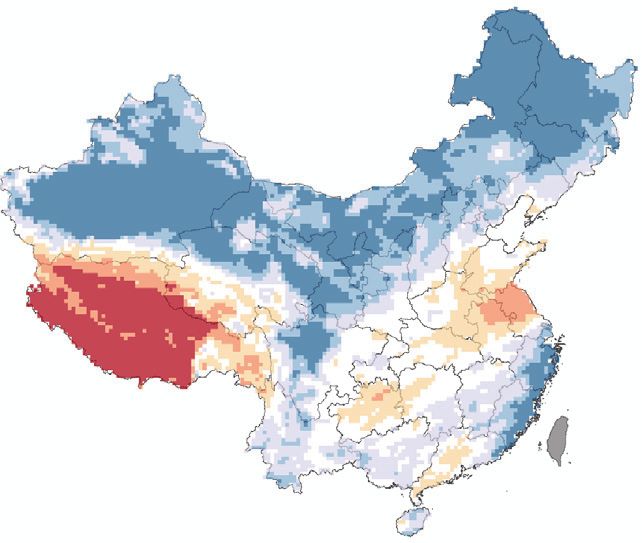
Figure 5: Trends in Exposure of Cropland to Drought, 1978-2009
Change in area of Change in portion of
cropland affected cropland affected
1,000 ha per year % points per year
Sources: Author, based on NBS 1996a, 1996b-2009b, 2007c-2011c, 2009d, 2010e
Notes: Tianjin and Hebei have been merged, as has Sichuan and Chongqing, for consistency across entire the timeframe. ha=
hectare.
12
Results are from author’s calculations using sources cited for figure 5. Note that the increase could also reflect improved reporting
in disaster losses over the years.
Climate Trends and Impacts in China 15Introduction
Droughts have ripple effects that proliferate following severe storms because blown-
across a range of sectors in China’s entire down trees and other organic debris increase
economy, including the power sector. China the amount of available fuel. Such changes
uses about 120 billion m3 of freshwater (20 in disturbance regimes affect the functioning
percent of the country’s total water use) of forest ecosystems and lead to reduced
every year for mining, processing, and ecosystem services such as soil erosion
burning coal (Han 2010; Dai and Cheng control and flood regulation (Sall and
2008). China’s abundant coal reserves are Brandon forthcoming). The adverse effects
located in some of the country’s most water- of greater exposure to drought and fire on
poor areas, such as Inner Mongolia. Greater forests are especially evident for plantation
exposure to droughts in the coal mining forests, which lack diverse groups of species
belt thus adds to existing bottlenecks in and show low levels of resilience. With
the supply of coal for power production additional warming and drying expected
and industry. Even in the water-rich South, for parts of the Northeast, the spring and
droughts have had a direct and significant autumn fire seasons will grow longer, and
impact on power production. The drought fire danger is projected to rise (Tian et al.
that hit southern China in the winter and 2011; Cheng and Yan 2007).13
spring of 2011, for example, lowered water
levels in reservoirs and forced dam operators The incidence of drought is projected to
to cut back on electricity generation by increase in the North and Northeast (NARCC
as much as 48 percent in some provinces 2011). Using the RegCM3 regional climate
at a time when electricity demand from model, Li Xinzhou and Liu Xiaodong (2012)
manufacturers in coastal areas was spiking project that warming and the northward
(see He 2011; Wang T. 2011; Wang W. Z. shift of vegetation zones will lead to greater
2011; Schneider 2011a, 2011b). water demand from plants and worsening
droughts in the Northwest, and the area
Droughts also amplify the risk of other affected by severe drought in this region will
extreme events such as forest fires. In begin to trend upward by the 2040s. 14 By
Chongqing, for example, wildfires rarely the end of the century, exposure to drought
occur during the summer monsoons. In will grow increasingly significant. Similarly,
the summer of 2006, however, Chongqing McKinsey & Company (Woetzel et al. 2009)
battled 158 separate incidents of forest fires, project that agricultural drought could
as the province was experiencing a one-in- worsen for most of the Northeast by the
100-year drought (Zhao et al 2009; see also 2040s as warming becomes more pronounced
Zhang forthcoming). The heightened risk and precipitation during the critical spring
of forest fire is especially severe in the years months decreases.15 With warmer and drier
13
In the United States, researchers have estimated that 1°C of warming is associated with a 200–400 percent increase in fire danger
for the western states (NRC 2011).
14
The upward trend is projected for low-(B1), medium- (A1B), and high- (A2) emission scenarios.
15
Projections are based on the results of the PRECIS regional climate model, run under a high- (A2) emissions scenario.
16 Climate Trends and Impacts in ChinaIntroduction
conditions projected by the regional climate and that there are large discrepancies in the
models for parts of the South, drought could results of the different GCMs used in the
also worsen in that region, especially during IPCC’s Fourth Assessment Report to project
the dry winter months (NARCC 2011). By changes in soil moisture associated with
contrast, Zhao et al. (2011) project that the drought (Wang 2005; Seneviratne et al. 2010;
drying effect of increased evapotranspiration see also IPCC 2012).
from crops in Tibet over the next 40 years
will likely be outweighed by precipitation
increases projected by the PRECIS model, and
there will be fewer droughts. Note that these
projections for drought are highly uncertain,
Climate Trends and Impacts in China 17Introduction
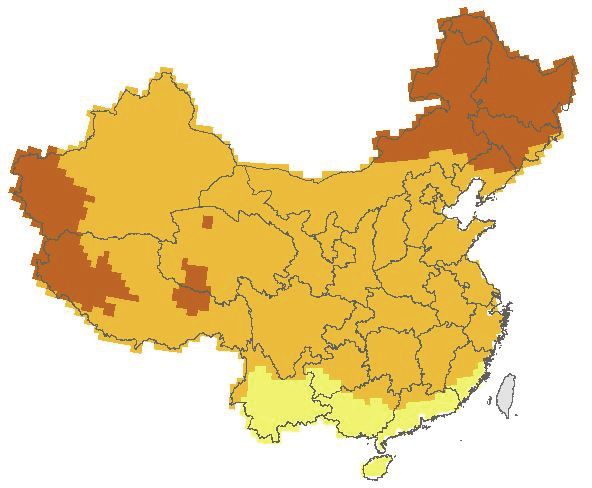
4. Floods up (NARCC 2011). With more rainfall from
severe storms during the spring and summer,
Floods affected about 10 million hectares
flooding events have been more frequent
each year between 1977 and 2008 (NBS 1996a,
along the Yangtze since the 1970s (Renet al.
1996b–2009b, 2007c–2011c, 2009d, 2010e).
2008; Zhaiet al. 2005; NARCC 2007).
Since 1990, they have caused direct economic
losses of 174 billion yuan annually (figure 6).
Intense rainfall, flooding, and other water-
These losses include damages to agriculture,
related hazards are particularly damaging
forestry, aquaculture, transportation, water
to infrastructure assets. Erosion from such
utilities, and other sectors.
hazards shortens the life-span of road and
rail networks and causes sudden drops
Since 1978, the area of farmland inundated
in service levels (Ollivier forthcoming).
by floods in the upper Yangtze River basin,
Disruptions of transportation services in
Tibetan Plateau, and parts of the Southhas
cities are exacerbated by poor drainage
shown a significant upward trend (figure
systems, many of which are inadequate to
7). 16 Evidence suggests that variability in
deal with current weather risks let alone with
the climate contributed at least in part to
even more frequent or severe flooding events
this trend. Since the 1950s, there has been
(Ollivier forthcoming; Jensen forthcoming).
a slight but statistically significant increase
Floods and mudflows also have adverse
in the observed frequency and intensity of
impacts on hydropower reservoirs. As
heavy precipitation events for the Pearl River
China’s stock of infrastructure assets
basinand 4. Floods
parts of the upper Yangtze River
continues to grow at a rapid pace, greater
basin (Chen, Chen, and Ren 2010). As days of
exposure to floods and other water-related
extreme precipitation increased
Floods affected formillion
about 10 the middle
hectares each year between 1977 and 2008 (NBS 1996a, 1996b–2009b,
hazards could lead to higher life-cycle costs
and lower 2007c–2011c,
reaches of the2009d,
Yangtze, the share
2010e). Sinceof1990, they have caused direct economic losses of174 billionyuan
annually (figure 6). These losses and more
include damages expensive investments.
to agriculture, forestry, aquaculture, transportation,
intense storms in total precipitation also went
water utilities, and other sectors.
FigureFigure 6: Economic
6Direct Direct Economic Losses
Losses from from Flooding
Flooding in1990‐2011
in China, China, 1990-2011
400
Billion yuan (2011 prices)
350
300
250
200
150
100
50
0
Sources: NBS
Sources: NBS1996a;
1996a;MWR 2006-2010;
MWR XinhuaXinhua
2006‐2010; 2012 2012
16 Since 1978, the area of farmland inundated by floods in the upper Yangtze River basin, Tibetan Plateau,
Results are from author’s calculations using sources cited for figure 7. Note that the increase could also reflect improved reporting
andover
in disaster losses parts
theof the Southhas shown a significant upward trend (figure 7).16Evidence suggests that
years.
variability in the climate contributed at least in part to this trend. Since the 1950s, there has been a
slight but statistically significant increase in the observed frequency and intensity of heavy precipitation
events for the Pearl River basinand parts of the upper Yangtze River basin (Chen, Chen, and Ren2010).
18 Climate Trends and Impacts in China
As days of extreme precipitation increased for the middle and lower reaches of the Yangtze, the share of
intense storms in total precipitation also went up(NARCC 2011). With more rainfall from severe stormsYou can also read