INSIGHTS GLOBAL MACRO TRENDS - China: A Visit to the Epicenter - KKR

Page created by Theresa Thompson
 
CONTINUE READING
INSIGHTS GLOBAL MACRO TRENDS - China: A Visit to the Epicenter - KKR
INSIGHTS
  GLOBAL MACRO TRENDS
VOLUME 8.5 • AUGUST 2018

China: A Visit to the
Epicenter
INSIGHTS GLOBAL MACRO TRENDS - China: A Visit to the Epicenter - KKR
China: A Visit to the
                                                Epicenter
                                                A recent trip to China again reminded my colleague Frances
                                                Lim and me why so many investors now consider China the
                                                ‘epicenter’ of global macro trends. In addition to accounting for
                                                nearly one-third of the global growth, the country is also in
                                                a heated trade dispute with the United States. Without ques-
Henry H. McVey
Head of Global Macro & Asset Allocation         tion, it is not sitting idle, and we saw visible signs of change
+1 (212) 519.1628
henry.mcvey@kkr.com
                                                in both monetary and fiscal policies during our visit. China is
                                                also facing a massive societal change, as its millennial popu-
                                                lation, which represents the largest in the world, is becoming
                                                increasingly influential in terms of what, how, and where to
                                                buy. Third, technology is also having a profound impact across
                                                a wide swath of Chinese industries — more so than any other
                                                country where KKR does business, we believe. Finally, while
                                                economic growth appears reasonable, we see major macro
                                                divergences occurring at the sector level that could profoundly
                                                impact which companies prosper and which ones wither dur-
                                                ing the next 12-24 months. From an investment standpoint, our
Frances B. Lim
                                                trip and our macro research lead us to remain supportive of
+61 (2) 8298.5553                               capital deployment in areas such as leisure, wellness, services
frances.lim@kkr.com
                                                (environmental, healthcare and financial), healthy food, and
                                                food safety. On the other hand, we left China quite cautious on
                                                branded consumer goods, global supply chains, and logistic
                                                plays that do not interface with the customer and/or can be
                                                disintermediated by the growing influence of Baidu, Alibaba,
                                                and Tencent. Finally, we believe now is the time to be thought-
                                                ful in terms of allocating to globally integrated industries such
                                                as autos as well as high-end technology.

MAIN OFFICE
Kohlberg Kravis Roberts & Co. L.P.
9 West 57th Street                                                  “
Suite 4200
New York, New York 10019                        When written in Chinese, the word ‘crisis’ is
+ 1 (212) 750.8300
                                                composed of two characters. One represents
COMPANY LOCATIONS
                                                  danger and the other represents a point
Americas New York, San Francisco,
Menlo Park, Houston, Orlando                         where things happen or change.
Europe London, Paris, Dublin, Madrid,
Luxembourg Asia Hong Kong, Beijing,                                 ”
Shanghai, Singapore, Dubai, Riyadh,                                        ANONYMOUS
Tokyo, Mumbai, Seoul Australia Sydney
© 2018 Kohlberg Kravis Roberts & Co. L.P.
 2          KKR INSIGHTS: GLOBAL MACRO TRENDS
All Rights Reserved.
INSIGHTS GLOBAL MACRO TRENDS - China: A Visit to the Epicenter - KKR
My colleague Frances Lim, who heads our Global Macro & Asset                      the bulk of the labor force. They are also the cohort that is now
Allocation effort in Asia, and I recently traveled through China and              entering middle income status in China, which suggests important
met with a variety of business executives across multiple segments                shifts in buyer behavior patterns. As we detail below, we now
of the economy. To cast the widest macro ‘net’ possible this trip, we             look for these individuals to reshape many traditional consumer
focused not only on Chinese corporate executives but also leaders                 markets within China – and around the globe for that matter.
from many large publicly traded U.S. companies that operate signifi-
cant businesses in China. In addition, we caught up with several large        3. Our latest visit again reminded us that the evolution of e-com-
asset allocators and macroeconomic experts, many of whom we have                 merce in China is unlike almost anything else we are seeing in
maintained regular dialogue with throughout the years.                           any other part of the world. Specifically, consumers are bypassing
                                                                                 conventional stages of online commerce development that have
As one might expect these days, the conversations were robust, and               traditionally defined migratory patterns in key markets like the U.S.
we were able to cover a variety of topical issues, including trade,              As a result, the power of Baidu, Alibaba, and Tencent (BAT) to de-
politics, currency, growth expectations, etc. However, for this report,          cide which companies succeed or fail in China’s vast consumer and
we have focused our attention on four areas that we believe are                  corporate markets has become both outsized and unprecedented.
potentially the most important for investors to better understand as             Indeed, by being part of the BAT network and infrastructure, several
China’s role in the global economy continues to evolve. They are as              of the companies we met with in the healthy foods, data center, and
follows:                                                                         logistics businesses are quickly emerging as almost preordained
                                                                                 winners, often at the expense of incumbent companies in the more
1. The escalation of trade barriers between the U.S. and China is an             traditional consumer categories (many of which are multinational
   undeniable attack on the traditional global supply chain, one that            players). In our view, this shift in power is secular, not cyclical,
   we now believe can no longer be easily repaired through rushed                and it has critical implications for return on capital in the Chinese
   and/or reconciliatory negotiations on a go-forward basis. Without             corporate sector (both public and private), we believe.
   question, President Trump in the United States is ushering in a
   different era as it relates to global trade. As we detail below in the     4. The headline economic statistics in China look fine, but they are
   section where we trim our 2018 China Real GDP estimate, we think              masking major sector disparities that we are uncovering in the
   that the Trump administration will implement its $200 billion of              underlying macro data1. For example, in terms of growth, China’s
   retaliatory trade initiatives by early September, and we now believe          GDP ex-Financials grew 9.1% year-over-year during the March
   that a global auto tariff is no longer out of the question. Hence, our        quarter, but the Financials component of the economy, which
   view is that President Trump’s trade negotiations may just further            includes many parts of the shadow banking system, plodded along
   intensify a global growth headwind that has actually been with us             at a much more modest four percent. Even within the financial
   for some time (Exhibit 1), particularly as China insources production         arena in China we found noteworthy divergences. For example,
   of more intermediate goods. It could also lead to further volatil-            total consumer growth surged 18.8% year-over-year as of June
   ity in the currency market, as trade-affected countries attempt to            2018; by comparison, consumer credit growth reached just 9.7%
   potentially regain strategic advantage through competitive devalu-            over the same period, reflecting the government’s heavy focus
   ations. These viewpoints are noteworthy, we believe, as many of               on deleveraging its State Owned Enterprises (SOEs). Meanwhile,
   the global business executives and investors with whom we met in              within Fixed Asset Investment (FAI), we note that year-to-date
   China are currently forecasting more optimistic outcomes. So, if we           infrastructure investment growth declined to 3.3% year-over-year
   are right, then investors should expect more earnings and market-             as of June 2018 versus 16.8% growth as of the same time last
   based volatility beginning in the third quarter of 2018. Maybe of             year. On the other hand, real estate investment, another impor-
   greater importance, though, is that the shift towards more nationalis-        tant subcomponent of FAI, increased to 7.4% year-over-year as of
   tic agendas represents a secular change that we believe has long-term         June 2018 from 5.5% a year ago. See below for more details, but
   implications for the way both business executives and allocators of           our punch line is that, while the aggregate numbers in China look
   capital think about the traditional benefits associated with ‘globaliza-      fine, it is not business as usual. Key issues such as e-commerce,
   tion’ compared to the past 30 years. In particular, we now expect a           deleveraging, and now trade are all creating massive undercurrents
   greater number of global multinational companies to begin to con-             to growth relative to the more benign generic headline level macro
   sider alternative supply chains, including more local production in           data that is currently being reported.
   both the U.S. and China. Technology, including semiconductors, and
   agriculture, including soybeans, are key areas of focus for us after       Overall, we believe that the current trade wars with the United States
   our trip. We also expect a change of destination in global flows, as       will only accelerate China’s shift away from an export economy de-
   already evidenced by China’s significant slowdown in purchases of          pendent on global trade/flows towards a more self-reliant consumer
   U.S. real estate in the second quarter of 2018.                            services economy that is gaining prominence, particularly within
                                                                              Asia. No doubt, this transition will take time, and it will likely be
2. Despite intensifying trade tensions, we are extremely bullish on           complicated in the near term by the political agendas of both the East
   secular growth trends within the Asian millennial generation,              and the West. However, the long-term trends of the Chinese millen-
   the Chinese one in particular. All told, there are now 828 million         nials helping to accelerate the transition of the nation towards more
   Asian millennials, compared to just 66 million in the U.S. Within          of a domestically focused, services-based economy with increasing
   China, which is the focus of this note, there are north of 300 mil-        technological advancements is undeniable. To this end, we think that,
   lion millennials. Not only do the numbers of Asian millennials in
   places like China dwarf those in the U.S. and Europe, they form            1 Data in this section as at July 31, 2018. Source: China Bureau of National
                                                                                Statistics.

                                                                                                             KKR    INSIGHTS: GLOBAL MACRO TRENDS            3
despite escalating trade tensions, there is a significant long-term op-      EXHIBIT 1
portunity for global investors to help fund this transition and receive
                                                                             We Believe Global Trade Actually Peaked in 2008
potentially outsized returns along the way.
                                                                                           Global Merchandise Exports as a % of Global GDP
We also left China with the strong belief that recent uncertainty is cre-
ating opportunity for more corporate carve-outs, as a growing number                                                           Sep-08
                                                                               28
of chief executives rethink what is really core to their Asian footprint,                                                       26.5
including distribution centers, supply chains, and capital equipment.
                                                                                                                                                Mar-18
An important caveat is that, as we describe below in more detail,              24
                                                                                                                                                 22.3
macro risks have definitely increased. In particular, both domestic
and foreign policies are now creating significantly more cross-
currents in the economy than in the past, influences that we believe           20
can now materially enhance or diminish the merit of any investment
thesis in key areas of today’s Chinese economy.
                                                                               16
DETAILS

In the following section we drill down on what we believe are four             12
key insights from our trip.                                                         80     85     90      95     00       05     10       15     20
                                                                              Data as at July 31, 2018. Source: IMF, Haver Analytics.
#1: We Are Likely More Cautious on Global Trade Tensions than
the Consensus. While we covered a range of issues during our most
recent visit to China, the most engaging topic was – not surprisingly        EXHIBIT 2
– trends in global trade. To review, our base case remains that global
trade actually peaked in 2008, as one can see in Exhibit 1. The second       Much of the U.S. Trade Deficit Can Be Explained by
key part of our thesis is that analyzing trade requires more focus on        China and Mexico
the signal and less on the noise. For example, as Exhibit 2 shows, over
                                                                                BALANCE OF GOODS IN 2017, BY TRADING PARTNER, US$ BILLIONS
100% of the U.S. – Mexico trade deficit can be explained by Trans-
portation (i.e., autos) in Mexico, while nearly 60% of the China deficit                                                                          ALL
                                                                                                       CANADA       MEXICO       CHINA
                                                                                                                                               COUNTRIES
with the U.S. is linked to the Apparel and Computer (i.e., Technology)
sectors. Without question, our travels and research suggest that autos       Agriculture                  0.2         -6.0        15.6            17.0
and high-end technology remain the real battlegrounds that the Trump         Oil, Gas, Minerals          -48.6        -4.0         8.4           -85.8
administration will continue to pursue under almost any scenario. If         Food                        -2.0         2.8         -0.5              3.2
we are right, then there is not likely to be a quick trade ‘fix’ that many
                                                                             Beverages, Tobacco           1.6         -4.4         0.1           -15.7
investors now champion (or at least are hoping for).
                                                                             Textile                      1.4         2.6         -13.5          -17.3
                                                                             Apparel                      2.3         -4.1        -49.4          -113.0
                                                                             Paper                       -10.4         4.3        -2.7              -7.7
                   “                                                         Petroleum                    -1.6        20.1         0.6           34.5

 Without question, our travels and                                           Chemical                     6.2         17.9        -3.0           -24.9

  research suggest that autos and                                            Plastics                     1.9          5.2        -15.6          -20.0
                                                                             Nonmetallic Minerals         1.5          -1.1       -7.0           -11.2
 high-end technology remain the                                              Primary Metals              -10.7         1.6        -2.2           -35.6
real battlegrounds that the Trump                                            Fabricated Metals            5.2          2.3        -20.3          -24.4

   administration will continue to                                           Machinery                    12.7         2.3        -25.7          -35.4

pursue under almost any scenario.                                            Computer                     18.7        -17.1      -167.3          -192.7
                                                                             Electrical Equipment         8.3         -11.5       -40.0          -54.0
  If we are right, then there is not                                         Transportation              -0.4         -76.0       10.5           -107.3
likely to be a quick trade ‘fix’ that                                        Furniture                   -0.5         -2.1        -23.4          -36.4

many investors now champion (or                                              Misc. Manufacturing          5.7         -3.5        -38.6          -41.6

       at least are hoping for)                                              All Goods                    -8.9        -70.6      -373.7         -768.3
                                                                              Note: Limited to top 30 trading partner of each country. Data as at
                   “                                                          December 31, 2017. Source: Goldman Sachs.
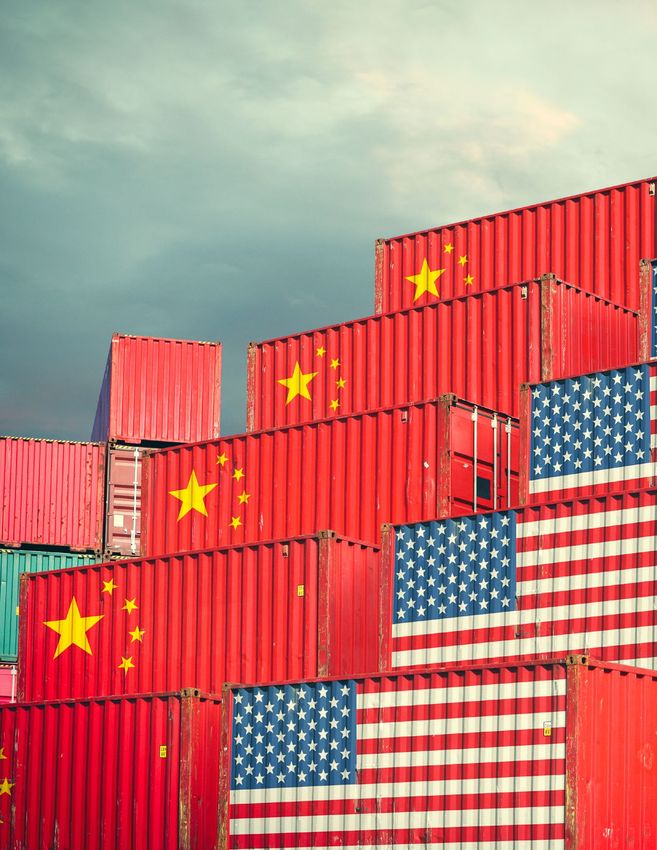
4        KKR   INSIGHTS: GLOBAL MACRO TRENDS
EXHIBIT 3                                                                     So, what insights did we learn from our most recent visit that inves-
                                                                              tors might value? For starters, overall business trends related to
Successive Rounds of U.S. Tariffs on China Will
                                                                              trade still do feel stable; major capex plans have not been halted,
Increasingly Hit Goods With Fewer Sourcing Alternatives                       and hiring proposals remain encouraging. That’s the good news. The
and More Direct Consumer Impacts                                              offset, however, is that we did learn of a few cases where U.S. firms
                            Average % of U.S. Imports                         felt that they were being potentially burdened through non-tariff
                               Sourced from China                             initiatives, including more frequent inspections and/or more difficult
                                                                              positioning on potential M&A situations. Also, while momentum has
                                                             68%
                                                                              not yet visibly slowed in the industrial economy, forward-looking
                                                                              orders appear to have peaked ― even before what we believe will
                                      51%                                     be intensifying headwinds from trade tensions. One can see the
                                                                              downward trajectory of ordering patterns below in Exhibit 6. Finally,
                                                                              we learned of some slowdown in consumption patterns in Tier 2 and
                                                                              Tier 3 cities, though we were not able to quantify if this moderation
               22%                                                            in activity was directly linked to trade concerns.

                                                                              EXHIBIT 5

                                                                              Both Imports and Exports Have Peaked, But Overall
                                                                              Business Trends Have Generally Held Up Well Despite
         1st Round (25%         2nd Round (25% Items Not Yet Tariffed
       Tariffs on $50bn of     Tariffs on $200bn of (~$250bn of Goods)
                                                                              Trade Tensions…
              Goods)                 Goods)                                                    China: Exports Y/y                China: Imports Y/y
 Data as at July 11, 2018. Source: U.S. International Trade Commission
                                                                                               Exports Y/y 12mma                 Imports Y/y 12mma
 Dataweb, Haver Analytics, KKR Global Macro & Asset Allocation analysis.

                                                                                      40%
EXHIBIT 4
                                                                                      30%
There Are Several Key Product Categories Included in the                              20%
                                                                                                                                               17%
Second Round ($200 Billion) of Tariffs Announced July                                 10%                                                      10%
10th                                                                                   0%

 BRIEF DESCRIPTION                                      2017 U.S. TRADE               -10%
                                                        IMPORTS FROM CHINA,          -20%
                                                        US$ BILLIONS
                                                                                     -30%
 Furniture                                                         29                     Jan-14 Nov-14 Sep-15        Jul-16   May-17 Mar-18

 Misc. Home Appliances                                             26          Data as at June 30, 2018. Source: China Customs, Haver Analytics.

 Network Routers                                                   23

 Computer Components                                               20

 Base Metals                                                       16
                                                                                                “
 Misc. Auto Parts & Agricultural Equipment Parts                   12
                                                                               We also left China with the strong
 Chemicals                                                         10
                                                                                belief that recent uncertainty is
 Plastic                                                           10
                                                                                 creating opportunity for more
                                                                                corporate carve-outs, as a grow-
 Agricultural Goods & Processed Foods                              6
                                                                                ing number of chief executives
 Wood/Wood Products/Paper                                          6
                                                                               rethink what is really core to their
 Data as at July 11, 2018. Source: U.S. International Trade Commission
 Dataweb, Have Analytics, KKR Global Macro & Asset Allocation analysis.         Asian footprint, including distri-
                                                                                 bution centers, supply chains,
                                                                                    and capital equipment.
                                                                                                “

                                                                                                          KKR       INSIGHTS: GLOBAL MACRO TRENDS     5
EXHIBIT 6                                                                  Importantly, though, we are not forecasting that trade tensions fully
                                                                           derail growth. In fact, our on-the-ground conversations in China give
...Though Forward Looking Export PMI Data Does
                                                                           us confidence that, under almost any scenario except for a full-blown
Suggest a Dip in Coming Quarters                                           trade war that extends into the global auto arena (which is not our
                  Official PMI         China Mfg PMI: Export Orders          base case), the Chinese government just won’t allow the economy to
                                                                           slip below the six percent growth threshold. To this end, we note that
        53
                                                                           the weekly State Council meeting reported on July 24th that the gov-
        52     Jul-14                                                      ernment would “make preemptive policy fine-tuning, depending on
                50.8            Mar-16                       51.5          the situation change, to deal with external uncertainties and keep the
        51                       50.2                                      economy growing at a reasonable zone”. In addition, we note that the
        50
                                                              49.8
                                                                           PBOC has allowed the currency to weaken a full nine percent since
                                                                           the end of March, which obviously helps exports. Weaker commodity
        49
                                                                           prices are also keeping inflation lower than expected, which gives the
        48                                                                 government more flexibility to be accommodative.
        47
                                                                           We also think that there will be moderate easing of policy to offset
        46                                                                 downside risks to growth in the second half of 2018. Specifically,
          Jan-14 Nov-14 Sep-15      Jul-16   May-17 Mar-18                 we now expect some modest reacceleration of fiscal spending on
 Data as at July 31, 2018. Source: China Federation of Logistics &         additional infrastructure projects and at least two more RRR cuts this
 Purchasing/CNBS, Haver Analytics.                                         year. A consumer tax cut will also be implemented in the second half
                                                                           of 2018, and this effort should also help to boost consumption, we
                                                                           believe. Importantly, these consumer benefits are being added to the
At the moment, our current base case is that the additional $200           system at a time, when, as we detail below in Exhibit 8, the Chinese
billion of retaliatory trade initiatives do go into effect in September.   consumer is still in good shape. In fact, the job market in China
This view assumes that the pace of dialogue with China increases,          remains quite tight, wage growth is steady, and consumer confidence
but it’s not enough to prevent President Trump from turning up the         remains at all-time highs (Exhibit 7).
heat on the Chinese government. Consistent with this view, we also
expect China to respond with $60 billion of its own retaliatory tariffs.   EXHIBIT 7
Interestingly, though, very few executives with whom we spoke are          The Job Market in China Is Tight and Consumer
currently planning for the scenario that we now view as the most           Confidence High, A Backdrop That Should Provide
likely. In our view, this is a missed opportunity and could lead to
                                                                           Some Ballast in the Event of A Downturn...
some supply chain headwinds and/or margin squeezes if not ad-
dressed rather quickly.                                                                        China: Job Openings to Job Seekers Ratio (L)
                                                                                               China: Consumer Confidence (R)
In terms of specifics for the economy, my colleague Frances Lim
estimates that the first tranche of 25% tariffs on $50 billion of goods
will impact China’s real GDP growth by 10-20 basis points. An incre-             1.25                                Tight Job Market and     130
                                                                                                                     Strong Consumer
mental 25% tariff on $200 billion of goods could have an additional              1.20
                                                                                                                     Sentiment
                                                                                                                                              125
40-60 basis points impact, though we actually believe the true effect             1.15                                                        120
will likely not make its way into the real economy until 2019. So, at             1.10                                                        115
the moment, we are currently lowering our real GDP estimate for                  1.05                                                         110
2018 by 10 basis points to 6.5%. This implies a deceleration of 45
                                                                                 1.00                                                         105
basis points to 6.3% in the second half of 2018 versus the first half of
                                                                                 0.95                                                         100
this year, with the possibility of additional downside if trade tensions
                                                                                 0.90                                                         95
escalate further beyond the $200 billion we now have incorporated                                            Slack Job Market
into our model.                                                                  0.85                                                         90
                                                                                         05 06 07 08 09 10 11 12 13 14 15 16 17 18
Of particular concern to us is the indirect impact of escalating trade      Data as at May 31, 2018. Source: Ministry of Human Resources and
tensions, which could deter business investment as well as dampen           Social Security of China, China National Bureau of Statistics, Haver
consumer spending in 2019. In our view, any material slowdown in            Analytics.
investment would be far more meaningful to long-term growth and
productivity than the tariffs in isolation. There is also potential for
an increase in trade tensions to incite a greater sense of nationalism
against the U.S., encouraging consumers to buy Chinese (or even Eu-
ropean and Japanese) products versus those from the U.S.

6        KKR   INSIGHTS: GLOBAL MACRO TRENDS
EXHIBIT 8                                                                    ing into China’s burgeoning consumer market as a retaliatory measure,
                                                                             should the U.S. decide to implement further tariffs on Chinese imports.
We Take Some Comfort That Disposable Income and
Wages Are Not Only Headed in the Right Direction but                         EXHIBIT 9
Are Also Running Well Above Inflation
                                                                             From China’s Perspective, Its Trade Deficit With the
                 China: Household Disposable Income Per Capita, Y/y          U.S. Is Actually Much More Balanced
                 China: Wage & Salary Per Capita, Y/y
                                                                                          2017: Aggregate Sales of Goods and Services Between
     12%                                                                                                  U.S. and China US$B

     11%
                                                                                              U.S. Surplus of $20B
                                                                                                                                        Services through
     10%                                                       Mar-18                      $448                   $428
                                                                                                                                        subsidiaries
                                                                9.0%                                                8
                                                                                              67                   18
      9%                                                       Mar-18                                               6                   Services imports
                                                                                              56
                                                                8.8%
      8%
                                                                                                                                        Goods through
                                                                                            213                                         subsidiaries
      7%                                                                                                          396
                                                                                                                                        Goods through
      6%                                                                                    112                                         trade*
            14         15          16         17         18
 Data as at March 31, 2018. Source: China National Bureau of Statistics,             US sold to China China sold to US
 Haver Analytics.
                                                                              *China goods sold to U.S. from China net of goods sold from non-
                                                                              Chinese affliates operating in China. Likewise, U.S. goods sold to China
                                                                              is net of goods sold to China by other countries affiliates operating in the
                                                                              US. Data as at June 11, 2018. Source: Deutsche Bank, China Macro: U.S.
Our trip gave us insight into the fundamental differences between
                                                                              Economic Balances With Partners.
the U.S. and China on what defines the current trade imbalance.
See details in Exhibits 9 and 10, respectively, but many China execu-
tives and politicians believe that the ‘true’ trade deficit is actually      EXHIBIT 10
close to zero, not the nearly $400 billion that President Trump cites.
True, as we show in Exhibit 9, the pure gross trade deficit of goods,        Goods and Services Sold to China Through Subsidiaries
on which the current U.S. administration is focused, is around $396          Is Actually Key to Understanding U.S.-China Trade
billion. However, the pure trade deficit of goods does not capture           Relations
trade of U.S. subsidiaries based in China selling to China or U.S.
services sold to China. This broader definition is an important con-                       2017: U.S. Surplus (Deficit) with China, US$ Billions
                                                                                              (China Sold to U.S. Less U.S. Sold to China)
sideration; one can see this in Exhibit 10. All told, Frances estimates
that U.S. firms currently sell $448 billion of net goods and services              President Trump's only focus
to China, while China sells $428 billion of net good and services to
                                                                                                                                                   20
the U.S.
                                                                                                                                      59
The big difference in views from China relative to the consensus in                                                      38
the United States is that most of goods sold by U.S. firms to China
are from U.S. companies with an onshore presence in China. Just
consider that Apple sold $40 billion worth of iPhones to China in                      -284                             Key risk if China
                                                                                                       207              goes after U.S.
2017, while General Motors sold more cars in China than in the U.S.
                                                                                                                        businesses in China
last year (four million versus three million, respectively). Neither
of these products is included in the reported goods trade balance
statistics. Moreover, China is actually a net importer of U.S. services.
                                                                                       Goods          Goods         Services       Services    US Surplus
So, after adjusting for sales of U.S. subsidiaries to China as well as
                                                                                      through        through        imports         through    With China
U.S. services sold to China, the aggregate sales deficit in 2017 actu-                 trade*      subsidiaries                   subsidiaries
ally appears to be a $20 billion surplus (i.e., $448 billion less $428
billion) rather than the $374 billion goods export deficit many folks in      *China goods sold to U.S. from China net of goods sold from non-
Washington, D.C. now quote.                                                   Chinese affliates operating in China. Likewise, U.S. goods sold to China
                                                                              is net of goods sold to China by other countries affiliates operating in the
Our bottom line: We left China thinking that investors, business execu-       U.S. Data as at June 11, 2018. Source: Deutsche Bank, China Macro: U.S.
tives, and politicians should not underestimate the growing risks of          Economic Balances With Partners.
selling into China’s large-end growth markets if the U.S. does impose
the next $200 billion in tariffs. Without question, China has some very
powerful tools in its toolkit, including clamping down on U.S. firms sell-

                                                                                                             KKR     INSIGHTS: GLOBAL MACRO TRENDS           7
Our bigger picture conclusion from our deep-dive in China is the            Another important conclusion from our trip is that the ‘old model’ of
that recent escalation in barriers to free trade is an undeniable at-       globalization, which was largely founded on the premise of the U.S.
tack on the traditional global supply chain, one that we now believe        buying low value-added Chinese goods at the same time that China
can no longer be easily repaired through rushed and/or reconcilia-          used its capital account surplus to buy assets such as real estate and
tory negotiations on a go-forward basis. Hence, almost regardless           U.S. Treasuries is now over. Already, for the first time since 2008,
of what President Trump now does around trade and tariffs, we ex-           China was a sizeable net seller of U.S. real estate in 2Q18 (it sold
pect more corporations around the world to begin to create local supply     $1.29 billion of real estate and bought just $126 million). On the other
chains. This insight is important for global real estate as well as many    hand, China’s burgeoning millennial population is rebalancing China’s
global manufacturing industries, particularly the Technology and Auto       economy and reshaping the global consumer market.
sectors. To be sure, global supply chains that emphasize required
local specialization will continue to survive, but large companies will     EXHIBIT 12
increasingly seek alternative sourcing options during what appears to       For Years the Chinese Government Has Been Committed
be a sustained period of heightened nationalist agendas, we believe.        to Making Trade a Smaller Part of Its Economy
As we show below in Exhibit 11, a reshuffling of global supply chains
will have far reaching implications beyond just China and the United                                China: LTM Trade as a % of GDP
States.
                                                                                             LTM Exports % GDP                 LTM Imports % GDP

We also believe that profit margins have most likely peaked in many                                Feb-07,
                                                                                 40
of the countries where we forecast macro trends. As such, we now                                    35.6
see tariffs as an additional input cost to consider beyond rising rates,         36                                           Global trade is a smaller
higher wages, and increasing oil prices.                                         32
                                                                                                                              part of China's economy

EXHIBIT 11                                                                       28
                                                                                                  Sep-06
Small, Open Economies Could Be Most Exposed to a                                 24                29.2                                            Jun-18
Global Trade Conflict                                                            20                                                                 18.0

                   Share of Exports Linked to Global Supply Chains               16                                                                  Jun-18
                                                                                 12                                                                   15.1
               Taiwan                                             67.6%                03 04 05 06 07 08 09 10 11 12 13 14 15 16 17 18

             Hungary                                         65.1%           Data as at June 30, 2018. Source: China Customs, Haver Analytics.

          Czech Rep                                       64.7%
                                                                            EXHIBIT 13
         South Korea                                 62.1%

           Singapore                              61.6%
                                                                            China Has Continued to Migrate Its Export Economy
                                                                            Towards Higher Value-Added Offerings
             Malaysia                           60.4%
                                                                                                   China % Total Exports, 12mma
               Ireland                       59.2%
                                                                                                          Ordinary Trade (Higher Value Add)
 Data as at July 2018. Source: World Trade Organization, WSJ.
                                                                                                          Reexports (Lower Value Add)               Jun-18
                                                                                  60
                                                                                                                                                     56.0
In sum, we fully acknowledge that predicting how trade negotiations               55
will play out, particularly when it involves many different political and
                                                                                  50
economic variables, remains an extremely difficult task for investors.
What we do know, however, is that we have entered what we believe                 45
is something akin to ‘trench warfare’ when it comes to US.-China
relations. So, while negotiations may produce some ‘deals’, we                    40
believe the new normal is a world where China’s continued focus on                           Re-exports are now less than
                                                                                  35                                                                Jun-18
higher value-added goods and services will inevitably produce more                                a third of exports
systematic and consistent trade tensions. Without question, it is one                                                                                32.6
                                                                                  30
of the key reasons that we do not believe China just buying more U.S.                  02    04      06      08    10    12    14     16      18
goods will ever satisfy the current U.S. administration.
                                                                             Data as at June 30, 2018. Source: China Customs, Haver Analytics.

8        KKR    INSIGHTS: GLOBAL MACRO TRENDS
Hence, as we turn towards 2019 and beyond (and almost irrespective        EXHIBIT 15
of near-term outcomes), we believe that China will aggressively in-
                                                                          …However, It Is Still Not the Owner of Critical Upstream
source more of its goods and services. Already, we note that exports
as a percentage of GDP in China have fallen to 18% from 36% at the
                                                                          Technology: Looking Ahead, However, We Expect This to
peak in 2007 (Exhibit 12). Meanwhile, during our trip we learned that
                                                                          Change
the government is raising a RMB 300 billion (US$47 billion) fund to                             Global Semiconductor Industry:
boost its semiconductor industry. This public-private partnership is                           Market Share By Production, 2015
noteworthy because it allows China to shift its supply chain in size by
creating alternatives to production located in the West. Given these
trends, we stick to our thesis that global trade actually peaked in                             China, 4%   Others, 3%
2008, something the consensus believes has not actually happened                           Taiwan,
yet. This viewpoint is significant, as it has ongoing implications for                     6%
shipping, logistics, and supply chain management.

EXHIBIT 14                                                                                   Europe, 9%
China’s Share of Global Mobile Phone Manufacturing                                                                       USA, 50%
                                                                                             Japan, 11%
Has Increased Dramatically in Recent Years...
                             Global Smartphone Shipments
                                   (Millions of Units)                                            Korea, 17%

       1600

       1400                                                                Data as at December 31, 2015. Source: WSTS, ITA, ANZ Research.
                    China makes and sells more             Other
       1200         smartphones than Apple and
                        Samsung combined
       1000                                                               Second, recent activity by both the Trump administration and the Au-
        800                                                Chinese        thorities in China underscore KKR Global Head of Public Affairs Ken
                                                           Brands         Mehlman’s view that the Technology sector is now a national security
        600
                                                                          concern, and as such, all investors will now need to approach invest-
                    Blackberry
        400                                                Apple          ments in this area using a different underwriting lens (e.g., more
                Nokia                                                     stringent CFIUS reforms). Indeed, we may all look back on the ZTE
        200                                                Samsung        incident as somewhat of an inflection point on U.S.-China relations
          0                                                               regarding technological dependence/connectivity.
               07    08    09    10   11    12   13   14   15   16   17
                                                                          EXHIBIT 16
 Data as at July 24, 2018. Chinese brands include Xiaomi, Huawei, ZTE,
 OPPO, Vivo, Lenovo (HK-based), Coolpad, Gionee, Hisense and K-Touch.     We Believe China Will Aggressively Move Into
 Source: Morgan Stanley Global Smartphone Model.                          the Design of Memory Chips and Compound
                                                                          Semiconductors After the ZTE Issue
                                                                                           China’s Integrated Circuit Consumption and
                                                                                              Production: 1999-2019e, US$ Billions

                  “                                                              240
                                                                                               Consumption (L)
                                                                                                                                           60%
  The escalation of trade barriers                                                             Production (L)

   between the U.S. and China is                                                 200           Production % Consumption (R)                50%

    an undeniable attack on the                                                   160                                                      40%

  traditional global supply chain,                                                120                                                      30%

  one that we now believe can no                                                   80                                                      20%

 longer be easily repaired through                                                 40                                                      10%
    rushed and/or reconciliatory                                                    0                                                      0%
negotiations on a go-forward basis.                                                     99 01 03 05 07 09         11   13   15   17   19

                                                                           Data as at November 15, 2017. Source: PWC China’s Semiconductor
                  “                                                        Industry.

                                                                                                      KKR   INSIGHTS: GLOBAL MACRO TRENDS        9
EXHIBIT 17                                                                    #2: Invest Behind the Rise of the Asian Millennials, Chinese
                                                                              Ones in Particular. There are times when our team does macro
There Have Been Winners and Losers Amongst Public
                                                                              analysis on a particular topic while working with a deal team on an
Equities So Far in the Trade Dispute                                          investment, and an on-the-ground visit to a certain country and/or
                           Price Performance Since June 1, 2018               company helps to confirm that the micro and the macro are totally
                                                                              in sync, which is what we are usually searching for when we deploy
                         MexBol
                         Nasdaq
                                                                              capital on behalf of our limited partners. Our recent trip to China was
                     MSCI India                                               one of those times, as Frances and I had several corporate meetings
                      S&P 500                                                 that confirmed her bullish thesis about the massive opportunity set
                    India (Nifty)                                             linked to the burgeoning Chinese millennial population.
                       Bovespa
                    MSCI World
                  Russell 2000                                                By way of background, of the total 828 million millennials in Asia,
                     Nikkei 225                                               Frances estimates that fully 40%, or 330 million, are today in China.
                           ACWI                                               To put the 330 million in perspective, we would note that there are
               EURO STOXX 50
                JPX Nikkei 400
                                                                              ‘just’ 66 million millennials in the U.S. One can see this in Exhibit 19.
                  Japan (Topix)                                               Said differently, China’s millennial population alone is now roughly
            MSCI EM Gross USD                                                 the same size as the entire population of the United States. Also,
                  Straits Times                                               as we show below, millennials are now a sizeable proportion of the
                       MSCI EM
     Shanghai Shenzhen CSI 300
                                                                              overall Chinese population; moreover given this heft and growth, they
               Hang Seng (HSI)                                                will unequivocally dominate the labor force and consumer markets
        Vietnam Ho Chi Minh SE                                                over the next two decades.
                   Korea KOSPI
                 China (HSCEI)                                                EXHIBIT 18

                                -10%   -5%      0%      5%        10%   15%   China Is One of the Larger EM Countries with a
 Data as at July 26, 2018. Source: Bloomberg.                                 Millennial Population That Is Well Above Those of the
                                                                              U.S. and Europe in Terms of Size and Representation
Third, there are likely to be some significant opportunities for inves-                         2017: Millennials as a % of Total Population
tors to make outsized returns in the coming months. For example,
our on-the-ground conversations with CEOs across a broad range of
industries suggest that, given the uptick in nationalist agendas, more                                                        24.5%
                                                                                                         23.9%      23.9%
and more multinational companies will reassess their global foot-                                                                       23.4%   23.6%
prints in the near-term, which is bullish for our Deconglomeratization
thesis. We also believe that a growing percentage of equity securities
in Asia is being sold indiscriminately, which may lead to opportunities
in the public equity markets that were previously not available. One                            20.5%
can see this in Exhibit 17.

Finally, heightened trade tensions could ultimately put pressure on
                                                                                      18.0%
our call that the Federal Reserve will raise rates by a cumulative six
times in 2018 and 2019. To be sure, we do believe that both wages
and input costs are rising to levels where the Fed will feel compelled
to act. However, if we get into September and President Trump does
actually implement $200 billion of additional tariffs (and remember                 Euro Area    U.S.   Indonesia ASEAN       India     China   ASIA
as Exhibit 3 above shows, the percentage of goods dependent on
China for sourcing increases as the tariff pool grows), then both              Asia includes China, India, Japan, Hong Kong, Korea, and ASEAN
                                                                               (Indonesia, Malaysia, Philippines, Thailand, Singapore, Vietnam). Data as
the Fed and the KKR Global Macro & Asset Allocation team may be                at June 24, 2017. Source: United Nations World Population Prospects,
forced to consider revising down our short-term rate forecasts. The            Haver Analytics.
offset to this premise (and one we will also be watching closely), is
that tariffs could push the Federal Reserve to further increase its
inflation forecast. This viewpoint is significant because the Fed is
already forecasting cyclical inflation that is in excess of its long-term
projected rate of two percent.
                                                                                                “
                                                                                  Invest behind the rise of the
                                                                                 Asian millennials, Chinese ones
                                                                                          in particular.
                                                                                                “
10        KKR     INSIGHTS: GLOBAL MACRO TRENDS
EXHIBIT 19                                                                     EXHIBIT 21

Asia’s Milennial Population Is Now Likely the Most                            The Millennial Population Is the Highest Percentage of
Influential Demographic Cohort in the World                                   the Labor Force Within ASEAN, India, and China
                      2017: Number of Millennials                                                               Millennials as Part of the Total Working Age
                       Born 1980-1994 (Millions)                                                                         Population (Age 15-64), %

                                                                                                                                                    2000                2017
                                                                    828             45
              5.0x the number of millennials in                                                                                                                                                                                 39.4
                                                                                                                                                                                            37.0 37.2
             China and 12.5x the total number in                                    40                                                                                            35.6 36.7
                                                                                                                                                            32.7 32.7
                   Asia relative to the U.S                                         35                                                30.6 31.2
                                                                                                           28.8
                                                                                    30      27.4 28.3 28.7

                                                                                    25                                                                                                        21.3 19.9 20.0
                                                                                                                                                                                 19.3                                          18.5
                                                                                    20                                   14.9
                                                                                                                13.5                 12.9 12.8             14.1
                                                                                     15 10.7 10.9                                                                   12.3
                                                      330
                                       328
                                                                                     10
                                                                                      5
                                                                                     0
             60             66

                                                                                                                                                                                                                                Malaysia
                                                                                                                                                    U.S.

                                                                                                                                                                                                             India

                                                                                                                                                                                                                     Vietnam
                                                                                                                                                                                  Indonesia
                                                                                            Japan

                                                                                                                                                            China
                                                                                                                          Thailand

                                                                                                                                                                                               Philippines
                                                                                                    Singapore

                                                                                                                                                                     Australia
                                                                                                                 Korea

                                                                                                                                      New Zealand
        Euro Area        U.S.         India          China         ASIA

 Asia includes China, India, Japan, Hong Kong, Korea, and ASEAN
 (Indonesia, Malaysia, Philippines, Thailand, Singapore, Vietnam). Data as      Data as at June 24, 2017. Source: United Nations World Population
 at June 24, 2017. Source: United Nations World Population Prospects,           Prospects, Haver Analytics.
 Haver Analytics.
                                                                              Beyond the sheer size in population differential, we also estimate that
                                                                              there is also a huge income disparity between U.S. and Asia millen-
EXHIBIT 20
                                                                              nials in regard to attaining more wealth than their parents. Indeed,
Chinese Millennials Save Less and Allocate Three Times                        proprietary research from a group led by Stanford’s Raj Chetty as
More of Their Income to Leisure                                               well as leading economists and sociologists from Harvard and the
                                                                              University of California at Berkeley now suggest that only half the
              Spending Breakdown China Overall vs. Chinese Millennials        U.S. children born in the 1980s, after adjusting for inflation, earn
                                                                              more than their parents ― a drop from 92% of children born in
                  Leisure                     Shopping, Non-Food              19402. By comparison, most millennials in Asia are rich compared to
                  Shopping, Food              Housing, Transport, Utilities   their parents and grandparents in Asia. These diverging paths have
                                                                              huge implications for politics, public policy and populism on both
      100%
                                                                              ends of the spectrum. One can see this in Exhibit 22. In our view,
                             9%                                               this dichotomy in wealth is significant, and both our quantitative
       80%                   14%                            30%               research as well as our qualitative research in China suggest that it
                                                                              does shape psychology about consumer behavior patterns for these
       60%                  28%                             16%               cohorts of individuals.
                                                            16%
       40%                                                                    Against this backdrop, we have come to appreciate that Chinese
                            49%                                               millennials have developed distinct consumption preferences in
       20%                                                  37%               recent years. As we show in Exhibit 20, they spend about one-third
                                                                              more on leisure. They value fresher and healthier food and product
        0%
                                                                              alternatives than their parents, and they price comparison shop much
                      China Overall                Chinese Millennials
                                                                              more than their elders and many of their global peers. We link many
 Data as at December 31, 2016. Source: Goldman Sachs Global Investment        of these traits to their tech-savvy ways – and it is not just goods
 Research.                                                                    purchased. Just consider that it only took Didi, China’s ride hailing
                                                                              leader, three years to reach 50% penetration, while Uber has yet to
                                                                              reach 50% penetration after seven years in the U.S. Meanwhile, Ali-
                                                                              Pay has only taken four years to hit a penetration rate of 50%, while
                                                                              ApplePay has yet to reach the 50% milestone in the United States. To
                                                                              be sure, some of this accelerated migration in China is linked to the

                                                                              2 Data as at December 8, 2016. Source: American Dream Collapsing For Young
                                                                                Adults, Study Says, As Odds Plunge That Children Will Earn More Than Their
                                                                                Parents, Washington Post.

                                                                                                                                     KKR              INSIGHTS: GLOBAL MACRO TRENDS                                                        11
EXHIBIT 22

While Many Asian Consumers Still Earn Less Than Their Counterparts in Developed Economies, Asian Millennials
Have Higher Incomes Compared to Their Parents
                                                                         Millennial Gross Income Indexed to Gross Income of Older Population (100)
             119
     120                      116
                                              114
     115                                                  111
     110                                                                                                                                            ...unlike many Advanced Economies
                                                                  106         105         104
     105                                                                                            101
   100
     95                                                                                                         98
                                                                                                                           95
     90                       Most millennials in Asia are rich compared to                                                          93
                                    their parents and grandparents...                                                                        89          89
     85
     80                                                                                                                                                                  84         83
                                                                                                                                                                                                81
      75                                                                                                                                                                                                        79
                                                                                                                                                                                                                           77
                                                                              Thailand

                                                                                                    Brazil
                               Malaysia

                                                                                                                                                                                                France
                                                                                                                                             U.K.

                                                                                                                                                                                                                           U.S.
                                              Indonesia

                                                                     India

                                                                                          Russia

                                                                                                                                                         Singapore

                                                                                                                                                                                    Australia

                                                                                                                                                                                                            South Africa
             Philippines

                                                                                                                Japan

                                                                                                                           Germany

                                                                                                                                     Korea
                                                          China

                                                                                                                                                                         Canada
 Source: Morgan Stanley research The Millennial Series Unique Insights into the Future of Indian Consumption dated March 23, 2017.

country’s desire to use technology to accommodate its population of                                                     24), China’s Internet economy was 6.9% of GDP in 2016 (latest data
1.4 billion as well as to create national champions, but it also speaks                                                 available), a full 150 basis points larger than the 5.4% of GDP in the
to the rapid adoption of technology throughout the country. We attri-                                                   U.S. We think that number is even larger today given the trends we
bute this to the favorable logistics in the country where courier costs                                                 see in online shopping, particularly when you consider that China’s
are low and population density high, as well as the emergence of the                                                    Internet penetration is just 53% versus 76% for the U.S.
growing middle class which is unencumbered by traditional chan-
nels. As a result, China’s Internet economy as a percent of GDP is
larger than that of the U.S. According to a recent BCG study (Exhibit

EXHIBIT 23

China’s Pace of Adoption Across Various Technology Platforms Is Unprecedented
                                                                                                             China vs. US: Time to Reach 50% User Penetration
                                                           ...2000                                     2005                                       2010                                                   2015              2017

                                          Amazon                                         14 years
     e-Commerce
                                           Taobao                                                                        9 years

                                          ApplePay                                                                                                                                                  Yet to reach 50%
  Mobile Payments
                                           AliPay                                                                                                                                   4 years

                                          Whatsapp                                                                                                                          Yet to reach 50%
  Social Networks
                                          WeChat                                                                                                                         3 yrs

                                            Uber                                                                                                                                    Yet to reach 50%
     Ride Sharing
                                            Didi                                                                                                                                  3 yrs

                                           Netflix                                                                                                                          Yet to reach 50%
     Online Video
                                            Iqiyi                                                                                                                    6 years

 Note: User penetration is defined as the ratio of app’s registered users to the total number of Internet users of the year. Taobao (淘宝) is the e-commerce
 platform under Alibaba; Alipay (支付宝) is the #1 online payment service provider in China owned by Ant Financial; Wechat (微信) is the mobile message
 app launched by Tencent; Didi (滴滴) is the #1 car hailing app in China, acquired Uber China in 2016; Iqiyi (爱奇艺) is an online video platform in China and
 just got listed in US. Source: BCG white paper on China’s Internet economy dated September 2017.

12         KKR             INSIGHTS: GLOBAL MACRO TRENDS
EXHIBIT 24                                                                                     EXHIBIT 26

China’s Internet-Related Activities Contribute More to                                         China Has Overtaken the U.S. in Online Sales Penetration
GDP Than the U.S. or Europe
                                                                                                                  Online Shopping as a % of Retail Sales
            Share of Internet-Driven GDP as a % of Total GDP, 2016
                                                                                                                              China          U.S.
        8.0                                                                                           24%
                 6.9                                                                                  20%                                                   2017
                                                                                                                      China's online                        19.6%
                         5.6     5.6      5.4                                                                      penetration is much
                                                                                                      16%
                                                                                                                   higher than the U.S.                     2017
                                                 4.0                                                  12%                                                   13.3%
                                                           3.6      3.4
                                                                             2.8
                                                                                      2.4              8%

                                                                                                       4%

                                                                                                       0%
                                                                                                            06 07 08 09 10 11 12 13 14 15 16 17

                                                                                      Brazil
                                                                    France
                                          U.S.
                                 India

                                                                             Russia
                         Japan

                                                 Germany
        Korea

                 China

                                                           Canada

                                                                                                Data as at December 31, 2017. Source: iResearch, China National Bureau
                                                                                                of Statistics, U.S. Census Bureau, Bloomberg.
 Source: BCG white paper on China’s Internet economy dated September
 2017.
                                                                                               So, what does this all mean for investment opportunities? Without
                                                                                               question, all our quantitative – and maybe more importantly, our
EXHIBIT 25                                                                                     qualitative – research of late shows the secular trend towards Experi-
                                                                                               ences Over Things in China has inflected upward in what feels like an
China Has Made Significantly More Progress in                                                  exponential fashion. In fact, we had several interesting conversations
e-commerce and Online Finance Than the U.S.                                                    with parents whose kids are paying up to ‘experience’ a concert with
                  Internet Market Revenue Breakdown 2016 Estimate, %                           friends at the same time that they are cutting back on purchases of
                                                                                               fashion clothing. Amusement parks, travel, and theatre all appear to
                                                                                               be gaining momentum as a share of consumers’ wallets.

                                                             e-Commerce                        Personal financial services, healthcare services, wellness/beauty,
                                         27                                                    healthier foods, and food safety should also be major beneficiaries
                 44                                          Social network/                   of the environment we are envisioning. We also anticipate continued
                                                             entertainment                     demand for China to tackle air, water and soil pollution, likely creating
                                         23                                                    opportunities for companies that address these issues. Importantly,
                                                             Online finance
                                                                                               though, the Chinese consumer is becoming increasingly sophisti-
                                          5
                 23                                                                            cated, which is leading to a more demanding customer who uses
                                         13                  Basic applications                technology more often to drive value, select aspirational brands over
                 12                                                                            standardized ones, and comparison shops more often than in the
                                         17
                                                                                               past.
                 12                                          Public services
                 6                       15
                 3                                                                             On the other hand, we left China quite concerned about traditional
                                                             Other business /living            goods, food items in particular, offered by many multinationals. Their
                China                    U.S.
                                                             svcs                              brands appear to be losing appeal at the same time their distribution
 Source: BCG white paper on China’s Internet economy dated September                           networks are being squeezed by higher costs and increased competi-
 2017.                                                                                         tion.

                                                                                               #3: The Significant Impact of the Internet on the Chinese Econ-
                                                                                               omy. We have been highlighting for some time that e-commerce
                 “                                                                             growth in China would ‘leap frog’ that of the U.S. Key to our thinking
  Our research shows the secular                                                               is that China’s e-commerce giants have not had to contend with the
                                                                                               same degree of competition, infrastructure expenditure, and deep
  trend towards Experiences Over                                                               pockets of global competitors that U.S. companies have faced. They
   Things in China has inflected                                                               also have had more government backing than many of the e-com-
                                                                                               merce giants we see in other parts of the global economy.
             upward.
                                                                                               Despite our optimism about these companies’ prospects to reshape
                 “                                                                             the nature of commerce in China, it is still happening faster than

                                                                                                                            KKR    INSIGHTS: GLOBAL MACRO TRENDS     13
EXHIBIT 27

Favorable Logistics and a Supportive Policy Backdrop Have Helped to Facilitate China’s Rapid Ascent in e-Commerce
                    Average Courier              Number of Couriers            Population Density 2017                Online Shopping as a %
                      Salary 2016               2016 (Per 10k People)               (People/km2)                       of Retail Sales 2017
                       ($/hour)

                                13                203
                                                                                  148
                                                                                                                            20

                                                                                                                                         13

                                                               72
                    4
                                                                                                   36

                  China        U.S.              China        U.S.               China             U.S.                 China           U.S.

 Source: BCG white paper on China’s Internet economy dated September 2017.

                                                                             EXHIBIT 28
what we thought. All told, Alibaba’s various online market places
now count more than 550 million active customers, while Tencent’s            China Is a Global Leader in the Adoption of Financial
WeChat messaging service survey recently surpassed one billion               Technology
(yes, one billion) accounts. Given such heft, we were not surprised
to learn that in 2017, China processed $15.4 trillion worth of mobile                         Adoption Rate of Financial Technology Services, %
payment transactions, which was greater than the combined $12.5                               83
trillion volume of credit card transactions of Visa and Mastercard.
                                                                                         72

Moreover, all three companies are acquiring expertise in new                     57 60                                           58
verticals at an outstanding rate, which argues for even further                                                                                                   47
                                                                                                                                                   46
convergence between their offerings in the coming quarters. All                                                                                              43
                                                                                                                            39                          38
told, OppenheimerFunds technology analyst Bhavtosh Vajpayee
                                                                                                                    27 29
estimates that there have been 280 Tencent deals over the past three                                21 22 20                                  20
years and 174 for Alibaba over the same period. By blending social,                                            15                     13 15
e-commerce and payment functions into single apps, customers can
manage their finances at the same time as managing their social
lives. Collectively, China’s Tech sector has created an interlocking
                                                                                 China

                                                                                                    China

                                                                                                                    China

                                                                                                                                      China

                                                                                                                                                        China
                                                                                                       US

                                                                                                                       US

                                                                                                                                         US
                                                                                  India

                                                                                                     India

                                                                                                                     India

                                                                                                                                       India

                                                                                                                                                        India
                                                                                 Brazil

                                                                                                    Brazil

                                                                                                                    Brazil

                                                                                                                                      Brazil
                                                                                    UK

                                                                                                                                                          UK
network of offerings that complement each other, fueling a powerful
network effect that we believe may be hard to replicate as sharply
                                                                               Money Transfer        Financial       Savings &        Borrowing         Insurance
in other e-commerce networks that we have studied. Importantly,                 & Payments           Planning       Investments
as part of this initiative, ‘distributors’ like Tencent and Alibaba
are now increasingly leveraging data and their pricing power to               Note: The figures show the average percentage of respondents in each
                                                                              market who reported using one or more FinTech service in that category.
force traditional manufacturers to pay more for advertising and
                                                                              Data as at 2017. Source: EY FinTech Adoption Index 2017.
infrastructure costs than we previously thought ahead of our trip.
Unfortunately for manufacturers of traditional consumer products,
these pricing headwinds from the BAT community are occurring at a
time when consumers want more add-on services and customized
offerings at little to no additional cost.
                                                                                              “
                                                                              E-commerce trends in China are
                                                                              occurring in a radically different
                                                                                  pattern than in the U.S.
                                                                                              “

14       KKR   INSIGHTS: GLOBAL MACRO TRENDS
EXHIBIT 29                                                                    he has helped to make the economy not only more efficient but also
                                                                              more productive. These attributes are necessary for China’s massive
When It Comes to Mobile Payments, China’s Activity
                                                                              population to continue its transition from rural to urban.
Dwarfs That of the U.S.
          U.S. vs. China Mobile Payments, US$ Billions and Trillions          On the other hand, Alibaba is on track to dominate large swaths of
                                                                              the infrastructure food chain across transportation, media, commu-
                              2011           2017                             nication, and financial services. As such, it has become a credible
                                                          $15 Tn
                                                                              threat to the government in terms of the information and data analyt-
                                                                              ics that it now holds on the Chinese consumer. However, given our
                                                                              view that the government is inclined to be more accommodative than
                                                                              less during this period of uncertainty surrounding trade, we believe
                                                                              that the potential for the government to intervene in a detrimental
                                                                              fashion has been vastly diminished for the next six to 28 months.

                                                                              So what’s our bottom line? Without question, our trip re-affirmed our
                                                                              strong belief that the infrastructure of Baidu, Alibaba, and Tencent
                                                $2 Tn                         are increasingly dictating if and when businesses succeed across a
                       $377 Bn                                                growing band of industries within China’s domestic economy. Impor-
             $8.3 Bn
                                                                              tantly, in today’s unsettled environment the government may have
                   U.S.                              China                    more patience to allow these companies to pursue oligopolistic busi-
                                                                              ness practices. From a business standpoint, this backdrop only gives
 Source: iResearch, Forrester, Alibaba and Tencent Set Fast Pace in Mobile-
 Payments Race, WSJ, September 22, 2017.                                      us additional conviction that marginal businesses, particularly on the
                                                                              consumer goods side of the Chinese economy, will wither quickly.
                                                                              Key to our thinking is that these companies are increasingly facing
As one might guess, mobile devices have already dwarfed fixed                 pricing pressure from both the consumers that buy their products as
Internet connectivity, including the traditional desktop; maybe more          well as the service providers (i.e., the BATs) that allow for the distri-
important, though, is the dawning reality that e-commerce trends in           bution of their products online.
China are occurring in a radically different pattern than in the United
States (i.e., large incumbents such as Target.com and Walmart.                EXHIBIT 30
com poured billions of dollars into trying to protect their historical        WeChat Is Becoming a Digital Operating System for the
franchises against online start-ups, including Amazon). In China,             Entire Chinese Economy
by comparison, the shift towards online has been much more rapid
and much more concentrated, as there were only a few dominant                                   Tencent WeChat Statistics, Millions
e-commerce interfaces, as only a limited number of major publicly
traded competitors had the wherewithal to invest in a sophisticated
online strategy. However, we do want to underscore that there is                                                                 1,000
still room for a small number innovative new competitors to emerge.
                                                                                                   800
For example, creative offerings by companies like Pinduoduo (who
recently filed for a public listing in the U.S.), which is using social
networks to create ‘shopping teams’ to get further discounts and
scale via bulk buying, are making their impact known as well.

Against this backdrop, the overall e-commerce market has just
exploded. All told, China’s Internet giants have already helped to
create a $15 trillion mobile payments market (and one that is likely
to grow meaningfully larger), up sharply from just $2 trillion in 2011,                 Linked App to Bank Account        Number of Accounts
according to iResearch. The U.S. mobile payments market, which is              Data as at 2017. Source: iResearch Global, Fortune.
not nearly as widespread in practice by comparison, only reached
$377 billion in 2017, up from $8.3 billion in 2011. One can see this in
Exhibit 29.

What would disrupt the current momentum in China’s e-commerce
space, we believe, is not increased competition. We think it is likely
too late for that threat to play out. Rather, we think it would be the
growing concern by the government that these private sector players
have gotten too powerful. Without question, a high profile executive
like Jack Ma is walking the razor’s edge. On the one hand, he repre-
sents an executive who has helped to create a national champion that
puts China’s technology effort on par with that of the U.S. In addition,

                                                                                                           KKR    INSIGHTS: GLOBAL MACRO TRENDS     15
EXHIBIT 31                                                              EXHIBIT 32

China’s Mobile Payment Market Accounted for $15                          Nominal GDP in China Fell 67% from 2011 to 2015;
Trillion Worth of Transactions in 2017                                   As Such, We Think that China’s Economy Has Already
                                                                         Crashed
              Mobile Payments in China, US$ Trillions
                                                                                                           China: PPI, Y/y, %, LHS
                                                          15.4
                                                                                                           China: Nominal GDP, Y/y,%, RHS

                                                                               12          83% correlation between                                          30
                                                   9.1                                          PPI and GDP                    Inflation peaked in
                                                                                                                                      1Q17                  25
                                                                                8

                                                                                                                                    Jun-11                  20
                                       1.9                                      4                                                    19.7
                             0.9
                 0.2                                                                                                                                        15
                                                                               0
               2013         2014       2015        2016   2017                                                                                              10

  Source: iResearch, Forrester, Alibaba and Tencent Set Fast Pace in           -4                                                                  Jun-18
                                                                                                                                Dec-15
  Mobile-Payments Race WSJ, September 22, 2017.                                                                                                     9.8 5
                                                                                                                                 6.4
                                                                               -8                                                                           0
                                                                                     00     02        04    06    08    10     12        14   16   18
Importantly, we left China thinking that public growth companies
                                                                          Data as at June 30, 2018. Source: China National Bureau of Statistics,
such as Baidu, Alibaba, and Tencent may represent better value than
                                                                          Haver Analytics.
some of the private investment opportunities that we learned about
during our trip. Valuations appear more reasonable, and growth
remains strong. All told, the BAT companies are expected to grow         EXHIBIT 33
earnings per share by an average of 101%, or a CAGR of 26% per
year during the next three years.                                        With Supply Being Rationalized, Chinese Industrial
                                                                         Profits Appear to Have Bottomed
#4: The Aggregate GDP Statistics Do Not Tell the Whole Story in
China. During a series of meetings post our most recent journey to                                         China: Industrial Profits, Y/y, %, LHS
China, Frances and I have been consistently asked about how the                                            China: Headline PPI, %, RHS
Chinese economy is performing3. At the aggregate level, we stick to            40                                                                           10
our view that we feel pretty good about current trends. Key to our
                                                                                                                                                   Jun-18   8
thinking is that China has already crashed as an economy as nomi-
                                                                               30                                                                   4.7
nal GDP actually fell 67% from 2011 to 2015. Subsequently, with                                                                                             6
the country’s producer price index (PPI) jumping back into positive                                                  Profits bottomed
                                                                               20                                                                           4
territory, nominal GDP has actually rebounded more than 50% to                                                          with PPI
around 10%. One can see this in Exhibit 32. Moreover, in trying to                                                                                          2
extricate the country from deflationary pressures, the government              10
                                                                                                                                                     Jun-18
                                                                                                                                                            0
has forced capacity to come out of many ‘old economy’ sectors. This                                                                                   21.1
                                                                                                                                                            -2
decision has been instrumental in returning profitability to not only           0
China’s major industrial producers, but we also heard similar sighs                                                                                         -4
of relief from commodity producers in other markets such as India
                                                                               -10                                                                          -6
too. Finally, as we mentioned earlier, there is enough stimulus in the
                                                                                      11         12        13     14      15        16        17    18
system to ride out many of the known risks that are emerging from
heightened trade tensions.                                                Data as at June 30, 2018. Source: China National Bureau of Statistics,
                                                                          Haver Analytics.

                                                                         However, our strong opinion is that the headline statistics do not tell
                                                                         the real story of the significant rebalancing that is actually occurring
                                                                         under the surface – a story that investors may not fully appreciate. For
                                                                         starters, we believe that the composition of GDP is changing faster
                                                                         and more dramatically than many investors and executives with
                                                                         whom we speak may fully comprehend. Indeed, as we show below
                                                                         in Exhibit 35, the portion of GDP of the Chinese economy linked to
                                                                         Financials has been under considerable pressure in recent quarters,
3 All data this paragraph is Ibid.1.

16         KKR     INSIGHTS: GLOBAL MACRO TRENDS
as the government looks to wring excesses out of the system. In         EXHIBIT 35
particular, there has been a massive attack on the shadow banking
                                                                        While China’s GDP Appears Stable, There Have
system, which has put notable downward pressure on the growth of
the Financials component of Chinese GDP. All told, this sector of the
                                                                        Been Some Substantial Changes Occurring as the
economy, which is now just 16.0% of Chinese GDP, is growing at just
                                                                        Deleveraging Happens
4.0% (Exhibit 35). On the other hand, non-Financials GDP, which is                            China: Real GDP Growth, Y/y, %
a sizeable 86.0% of the economy, is growing quite nicely. As we de-
scribed earlier, Chinese millennials – amongst others – are spending                       Real GDP                        Financials (16%)
more and saving less than their predecessors.                                              Ex-Financials (84%)
                                                                               20                                     Jun-15
EXHIBIT 34
                                                                                                                       18.8
Services, Not Manufacturing, Now Drive Growth in                               16
China
                     China: LTM GDP By Industry, %                             12
                                                                                                                                         Mar-18
                       Secondary (Mining, Mfg, Cnstrn)                                                                                    9.1
                                                                                8
     56%               Tertiary (Services)                 Mar-18                                                                             6.8
                                                           51.9%
     52%             Note: U.S. Services % GDP = 69%                            4                                                           4.0

     48%                                                                        0
                                                                                    11   12     13      14       15   16        17     18
     44%
                                                                         Data as at 1Q2018. Source: Ministry of Finance of China, China National
                                                            Mar-18       Bureau of Statistics, Haver Analytics.
    40%                                                     40.4%

     36%                                                                Interestingly, even with the credit story, there is a notable divergence
                                                                        in patterns. Within the consumer segment of the market, loan growth
     32%                                                                has been strong. Autos and mortgages, in particular, have certainly
           92 94 96 98 00 02 04 06 08 10 12 14 16 18                    become more influential drivers of credit growth. At the same time,
                                                                        however, the government has been clamping down more on corpo-
 Data as at 1Q2018. Source: China Household Survey, China National
 Bureau of Statistics, Haver Analytics.                                 rate loan growth. As a result, consumer credit growth across China
                                                                        has increased to 18.8% year-over-year as of June 2018; by compari-
                                                                        son, corporate credit growth has slowed to just 9.7% during the same
                                                                        period, reflecting the government’s heavy focus on deleveraging its
                    “                                                   State Owned Enterprises (SOEs). One can see the dichotomy in
                                                                        growth rates in Exhibit 37.
     Our strong opinion is that the
      headline statistics do not tell
    the real story of the significant
       rebalancing that is actually
     occurring under the surface –
     a story that investors may not
   fully appreciate. For starters, we
      believe that the composition
    of GDP is changing faster and
     more dramatically than many
     investors and executives may
           fully comprehend.
                    “

                                                                                                      KKR    INSIGHTS: GLOBAL MACRO TRENDS          17
You can also read