Maternal and Post-Weaning High-Fat Diets Produce Distinct DNA Methylation Patterns in Hepatic Metabolic Pathways within Specific Genomic Contexts ...
←
→
Page content transcription
If your browser does not render page correctly, please read the page content below
International Journal of
            Molecular Sciences

Article
Maternal and Post-Weaning High-Fat Diets Produce
Distinct DNA Methylation Patterns in Hepatic
Metabolic Pathways within Specific
Genomic Contexts
Laura Moody 1 , Huan Wang 2 , Paul M. Jung 3 , Hong Chen 4 and Yuan-Xiang Pan 5, *
 1    Division of Nutritional Sciences, University of Illinois at Urbana-Champaign, Urbana, IL 61801, USA
 2    Department of Human Genetics, University of California at Los Angeles, CA 90095, USA
 3    Department of Food Science and Human Nutrition, University of Illinois at Urbana-Champaign, Urbana,
      IL 61801, USA
 4    Department of Food Science and Human Nutrition, Division of Nutritional Sciences, University of Illinois at
      Urbana-Champaign, Urbana, IL 61801, USA
 5    Department of Food Science and Human Nutrition, Division of Nutritional Sciences, Illinois Informatics
      Institute, University of Illinois at Urbana-Champaign, Urbana, IL 61801, USA
 *    Correspondence: yxpan@illinois.edu; Tel.: +1-217-333-3466

 Received: 28 May 2019; Accepted: 26 June 2019; Published: 30 June 2019

 Abstract: Calorie-dense high-fat diets (HF) are associated with detrimental health outcomes,
 including obesity, cardiovascular disease, and diabetes. Both pre- and post-natal HF diets have
 been hypothesized to negatively impact long-term metabolic health via epigenetic mechanisms.
 To understand how the timing of HF diet intake impacts DNA methylation and metabolism, male
 Sprague–Dawley rats were exposed to either maternal HF (MHF) or post-weaning HF diet (PHF).
 At post-natal week 12, PHF rats had similar body weights but greater hepatic lipid accumulation
 compared to the MHF rats. Genome-wide DNA methylation was evaluated, and analysis revealed
 1744 differentially methylation regions (DMRs) between the groups with the majority of the DMR
 located outside of gene-coding regions. Within differentially methylated genes (DMGs), intragenic
 DNA methylation closer to the transcription start site was associated with lower gene expression,
 whereas DNA methylation further downstream was positively correlated with gene expression. The
 insulin and phosphatidylinositol (PI) signaling pathways were enriched with 25 DMRs that were
 associated with 20 DMGs, including PI3 kinase (Pi3k), pyruvate kinase (Pklr), and phosphodiesterase 3
 (Pde3). Together, these results suggest that the timing of HF diet intake determines DNA methylation
 and gene expression patterns in hepatic metabolic pathways that target specific genomic contexts.

 Keywords: MeDIP-seq; CpG island and shore, maternal programming; insulin signaling;
 phosphatidylinositol signaling

1. Introduction
     High-fat (HF) diet intake during both the pre-natal and post-natal periods has adverse effects on
metabolic health, including higher body weight, reduced insulin sensitivity, systemic inflammation,
and dysregulation of hypothalamic satiety cues [1,2]. Furthermore, the metabolic consequences of HF
diet consumption have been in part attributed to diet-induced epigenetic modifications. For instance,
post-natal HF diet exposure in rats and mice has been associated with differential methylation of the
hunger/satiety genes melanocortin 4 receptor (Mc4r), proopiomelanocortin (Pomc), and leptin (Lep) as
well as the glycotic enzymes glucokinase (Gck) and pyruvate kinase (Pklr) [3–5]. Perinatal HF diet also

Int. J. Mol. Sci. 2019, 20, 3229; doi:10.3390/ijms20133229                             www.mdpi.com/journal/ijms
Int. J. Mol. Sci. 2019, 20, 3229                                                                    2 of 24

produces methylation differences in the energy homeostasis gene, peroxisome proliferator-activated
receptor α (Ppara) [6], the inflammatory genes, toll-like receptors 1 and 2 (Tlr-1 and Tlr-2) [7], and the
hepatic cell cycle inhibitor, cyclin-dependent kinase inhibitor (Cdkn1a) [8].
      The perinatal and post-natal periods studied in the aforementioned publications are characterized
by separate epigenetic events. De novo DNA methylation is established in the perinatal period
while environmental factors during the post-natal period can interfere with the maintenance of such
methylation patterns [9–11]. Given these differences between perinatal and post-natal epigenetic
processes, it is important to understand how each exposure window impacts metabolism and gives
rise to a unique methylome. As opposed to using a candidate-gene approach to examine the effects of
HF diet on DNA methylation, the present study instead used more comprehensive high-throughput
sequencing methodologies. Genome-wide DNA methylation can be measured through using one of
the methods that differentiates the methylated cytidines from unmethylated ones: bisulfite conversion,
affinity capture, or endonuclease digestion. While bisulfite sequencing provides superior coverage
and resolution, it is both labor-intensive and comparatively more expensive [12,13]. Alternatively,
Methylated DNA Immunoprecipitation coupled with high-throughput sequencing (MeDIP-seq) is an
affinity enrichment method that uses 5mC-specific antibodies to directly quantify methylated DNA
sequences. MeDIP-seq offers a more cost-effective option, and integration of Methylation-sensitive
Restriction Enzyme digestion followed by sequencing (MRE-seq) compensates for the limitations of
MeDIP-seq by having single-base resolution and extensive coverage at regions with low CpG densities.
MRE-seq is an endonuclease-based technique in which restriction enzymes identify unmethylated
regions [14]. Alone, MRE-seq is confined by the sequence-specificity of existing restriction enzymes,
but integrating MRE-seq with MeDIP-seq can improve coverage and resolution of genome-wide
methylation and proves to be a viable way of assessing methylation in large samples [15].
      The liver changes substantially throughout the early stages of life. Not only does the organ
undergo structural transformation, but the functional demands before and after birth are also very
different. This is reflected in the altered metabolic profiles including insulin output and hepatic enzyme
kinetics in the fetus versus adult [16,17]. Therefore, the present study was designed to combine
MRE-seq and MeDIP-seq to survey the effects of HF diet exposure on genome-wide methylation to
further elucidate the underlying mechanisms and pathways related to hepatic metabolic adaptation.
Male rats were exposed to a HF diet during either the perinatal period (maternal HF, MHF) or at
post-weaning (post-weaning HF, PHF). To understand how timing of HF diet exposure impacts the
hepatic epigenome, we first compared DNA methylation patterns directly between MHF and PHF rats.
Using the identified differentially methylated regions (DMRs), we then compared DNA methylation
and gene expression between MHF, PHF, and lifelong control-fed animals (CON) to assess whether
any HF diet intake affects DNA methylation. Finally, we further examined the metabolic pathways
that were potentially differentially influenced by the HF diet at perinatal and post-natal time points.

2. Results

2.1. Compared to Maternal HF Diet Exposure, Post-Weaning HF Does Not Alter Body Weight but Induces
Greater Hepatic Lipid Accumulation
     To assess the potential differential effects of HF exposure at different developmental stages, male
rats were exposed to HF diet either during gestation and lactation (maternal high fat: MHF) or after
weaning (post-weaning high fat: PHF) (Figure 1a). Additionally, a control group (CON) was fed an
AIN93G diet during both the perinatal and post-weaning periods. Food intake in grams per week
was not significantly different between the three groups, except on week 6 and 7, when CON animals
consumed more than PHF rats (Figure 1c). However, given the higher caloric density of the HF diet,
the PHF group consistently consumed more calories during the post-weaning period than both CON
and MHF (Figure 1d). PHF rats were only significantly heavier than CON, but not MHF, on post-natal
weeks 5, 7, 10, 11 and 12 (Figure 1b). Food efficiency (weight gain/kcal intake) was lower in PHF
compared to both CON and MHF (Figure S1). ORO staining revealed that lipid accumulation was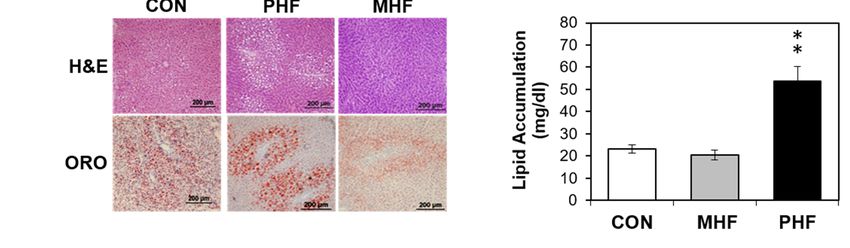
Int. J. Mol. Sci. 2019, 20, 3229 3 of 24
Int. J. Mol. Sci. 2019, 20, 3229 3 of 24
unchanged in MHF compared to CON, but was significantly higher in PHF (Figure 1e,f). To account
for differences in body
unchanged weight
in MHF and lipid
compared accumulation,
to CON, we measured
but was significantly expression
higher of de 1e,
in PHF (Figure novo lipogenesis
f). To account
and triglyceride synthesis
for differences genesweight
in body and found decreased
and lipid levels in
accumulation, wePHF and increased
measured levels
expression of deinnovo
MHF
(Figure S2).
lipogenesis and triglyceride synthesis genes and found decreased levels in PHF and increased levels
in MHF (Figure S2).
Physiological
Figure 1.Figure differences between perinatal and post-weaning HF diet exposure. (a) The
1. Physiological differences between perinatal and post-weaning HF diet exposure. (a) The
experimental design involved
experimental design involved pregnant dams
pregnant thatthat
dams werewerefedfedeither
eitheraaHFHF diet (45%kcal
diet (45% kcalfrom
fromfat)fat)
or aor
a standard AIN93G control diet throughout gestation and lactation. At weaning,
standard AIN93G control diet throughout gestation and lactation. At weaning, male pups from male pups from
control diet-fed dams were
control diet-fed damsweaned onto either
were weaned the same
onto either the samecontrol diet
control oror
diet HF HFdiet,
diet,and
and male pupsfrom
male pups from
HF-fed dams
HF-fedwere
damsweaned onto the
were weaned control
onto diet, diet,
the control creating three
creating groups
three groups ofofpups,
pups,control (CON; nn==8),
control (CON; 8),
post-weaning
post-weaning high fathigh
(PHF; = 9) nand
fatn(PHF; = 9)maternal
and maternal
highhigh fat (MHF;
fat (MHF; n =n 7),
= 7), respectively. (b)
respectively. (b) Body
Body weight
weight
was measured
was measured weekly weekly
duringduring the post-weaning
the post-weaning period.
period. (c) Weekly
(c) Weekly food
food intakewas
intake wasmonitored
monitored during
during
the post-natal
the post-natal period.
period. (d) Caloric(d) intake
Caloricasintake as kcal/week
kcal/week was calculated
was calculated based on based
theon the grams
grams of foodofintake.
food
intake. (e) Liver cross-sections were stained with hematoxylin and eosin (H&E) (top) and Oil Red O
(e) Liver cross-sections were stained with hematoxylin and eosin (H&E) (top) and Oil Red O (ORO;
(ORO; bottom). (f) PHF animals had greater hepatic lipid accumulation than MHF and CON rats.
bottom). (f) PHF animals had greater hepatic lipid accumulation than MHF and CON rats. Lipid
Lipid accumulation was normalized to total protein. Data points represent mean ± standard error of
accumulation was normalized to total protein. Data points represent mean ± standard error of the
the mean (SEM). *denotes a significant difference (p < 0.05) between PHF and CON. **denotes a
mean (SEM). * denotes
significant a significant
difference difference
(p < 0.01) between (p
PHF< 0.05) between
and CON as wellPHF and CON.
as between PHF** and
denotes
MHF. a significant
difference (p < 0.01) between PHF and CON as well as between PHF and MHF.
Int. J. Mol. Sci. 2019, 20, 3229                                                                                     4 of 24

     Int. J. Mol. Sci. 2019, 20, 3229                                                                            4 of 24
2.2. Timing HF Diet Exposure Determines Distinct Methylation Patterns
     2.2.
      WeTiming   HF Diet Exposure
          first compared          Determines Distinct
                          DNA methylation    patterns Methylation Patterns MHF and PHF to identify regions
                                                       directly between
that differ
          Weaccording     to timing
               first compared     DNA  of HF   diet exposure.
                                           methylation           Genome-wide
                                                           patterns               DNA methylation
                                                                     directly between      MHF and PHF    wastomeasured
                                                                                                                identify in
liverregions
      using MeDIP-seq         and MRE-seq.
             that differ according               MeDIP-seq
                                         to timing    of HF dietproduces
                                                                  exposure.extensive
                                                                              Genome-wideCpG coverage      while MRE-seq
                                                                                                DNA methylation      was
offers  high resolution
     measured                such MeDIP-seq
                 in liver using    that combining        the two methods
                                                  and MRE-seq.      MeDIP-seq hasproduces
                                                                                   been proven      to improve
                                                                                              extensive          detection
                                                                                                         CpG coverage
     while
quality     MRE-seq
         [18].           offers produced
                Sequencing      high resolution
                                              over 49such  that combining
                                                        million              the two
                                                                 filtered MeDIP         methods
                                                                                    reads           has 31
                                                                                             and over   been  proven
                                                                                                           million     to
                                                                                                                    filtered
     improve   detection    quality  [18]. Sequencing     produced   over 49  million  filtered
MRE reads for each animal. The R-package MethylMnM was used to integrate reads from both        MeDIP    reads and over
     31 million
methods           filteredaMRE
           to provide             reads for each
                             comprehensive            animal.
                                                 analysis   ofThe   R-package
                                                               differences      MethylMnM was
                                                                             in methylation           used
                                                                                                 profile    to integrate
                                                                                                          between   groups.
     reads from    both  methods    to  provide  a  comprehensive     analysis of  differences
We uncovered 1744 DMRs (FDR q-value < 0.05), of which 990 (57%) were more methylated in the      in methylation  profile
PHFbetween
      group andgroups. We uncovered 1744 DMRs (FDR q-value < 0.05), of which 990 (57%) were more
                     754 (43%) were more methylated in the MHF group (Figure 2a,b). These DMRs were
     methylated in the PHF group and 754 (43%) were more methylated in the MHF group (Figure 2a, b).
distributed fairly evenly across 21 chromosomes (Data not shown).
     These DMRs were distributed fairly evenly across 21 chromosomes (Data not shown).

      Figure 2. Identification of differentially methylated regions in maternal and post-weaning HF
      diet groups. (a) Heatmap shows the weighted MeDIP and MRE reads in the MHF and PHF conditions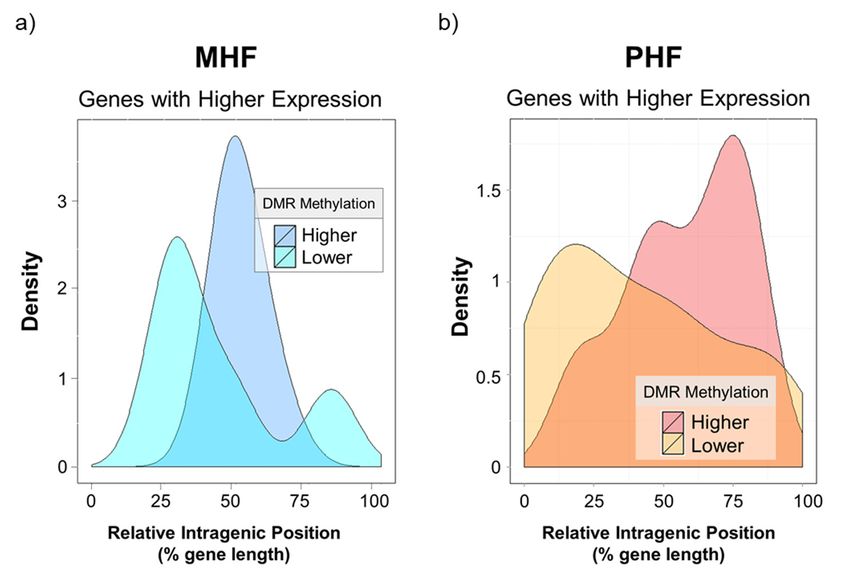
Int. J. Mol. Sci. 2019, 20, 3229                                                                          5 of 24

      (black and white), where darker shades represent more reads. Overall methylation is shown in the
      far-right column. Blue represents higher methylation in the MHF group compared to the PHF group
      and red represents higher in the PHF group compared to the MHF group (FDR q-value < 0.05). (b) Pie
      chart shows overall numbers of DMRs that are more methylated in MHF animals (blue, n = 754) and
      that are more methylated in PHF animals (red, n = 990). (c–f) Probe-based analysis of DNA methylation
      was used to validate results from MeDIP and MRE-seq. (c) Representative tracks from the Genome
      Browser showing a DMR within the Pklr gene that was identified by MeDIP-seq and MRE-seq analysis
      to be more methylated in the PHF group. The region of interest used for validation is outlined in
      orange. The top tracks show the MRE reads in black. The red track indicates the MeDIP reads for each
      group. The blue track represents annotated genes and indicates the DMR position relative to exons
      (blue bar) and introns (blue hashed line). (d) A probe-based analysis of DNA methylation was used
      to validate the DMR. The PHF group had a higher percentage of methylated DNA (% of amplified
      DNA) and a lower percentage of unmethylated DNA compared to the MHF group (* p < 0.00001).
      (e) Representative tracks from the Genome Browser showing a genomic region upstream of the Il6 gene
      identified by the joint MeDIP-seq and MRE-seq analysis as being not differentially methylated in the
      computational analysis. (f) Methylation in the Il6 locus was measured using probe-based analysis
      of DNA methylation. No difference was detected between the MHF and PHF groups in this region
      (p = 0.2). (g) MSP was used to confirm methylation status of a region in the Acacb gene identified as
      significantly differentially methylated by MeDIP-seq and MRE-seq (p = 0.007). (h) MSP was used to
      validate no change in methylation status of a DMR within the Gpam gene that was not identified to be
      significant by MeDIP-seq and MRE-seq (p = 0.7). All bar graphs show mean ± SEM.

     Methylation results were validated in multiple animals from each of the groups using both a
probe-based PCR method and MSP. First, a DMR located within a gene of interest, pyruvate kinase
(Pklr), was verified using a fluorescent probe-based PCR technique (Figure 2, Table 1). Using the
fluorescent probe, we confirmed that the MeDIP- and MRE-identified DMR was highly methylated in
PHF (74% methylated) when compared to MHF (43% methylated, Figure 2c,d). We used the same
method to examine a genomic location upstream of the Il6 gene that was not differentially methylated
according to MeDIP and MRE analysis. Probe-based analysis of DNA methylation confirmed this
result, as the methylation in the MHF (48% methylated) and PHF (47% methylated) groups were not
significantly different (Figure 2). Additionally, we used MSP to confirm that a region within the Acacb
gene was differentially methylated between PHF and MHF rats (Table 1). PHF animals had higher
methylation than MHF animals (70% and 25%, respectively; Figure 2). MSP also confirmed that a
region in the Gpam gene was not differentially methylated, as predicted by MeDIP-seq and MRE-seq
(PHF: 57%, MHF: 53%). Given the strict criteria set by the MethylMnM package and the results from
the subsequent validation both in this study and in previous work [19], we assume that any MeDIP-
and MRE-identified DMRs represent true differential methylation between groups.

                                            Table 1. QAMA Primers and Probes.

              Gene                         Position                             Sequence
                                     Forward Primer +4333      50 -TGGTGTTATTTAGATGTTGGAGAGTATGA-30
                                     Reverse Primer + 4557       50 -AACATAATACAATCAACCCCATCCA-30
          Pklr (+ chr2)
                                    Methylated Probe + 4467     50 -VIC-AGGTTCGATTAATTCGGGCG-MGB-30
                                   Unmethylated Probe + 4470   50 -FAM-TGATTAATTTGGGTGGAGATAA-MGB-30
                                     Forward Primer −2516         GTGAGTAAGGGATTTAGTTTGAGTATGGT
                                     Reverse Primer − 2441     CTTATTCCTAAATATCTAATACCCTCTTATAACCTC
               IL-6
                                    Methylated Probe − 2480           50 -VIC-CGTGTGTGAATGTGCGTTA-30
                                   Unmethylated Probe − 2483     50 -FAM-TTTGTGTGTGAATGTGTGTT-MGB-30

    Next, we examined DMR location relative to CpG islands. Despite the relative enrichment of
DMRs in island regions, most of the differential methylation was observed in the 2000 bp shore
sequences flanking the islands. In fact, more than twice as many DMRs were identified in shore regions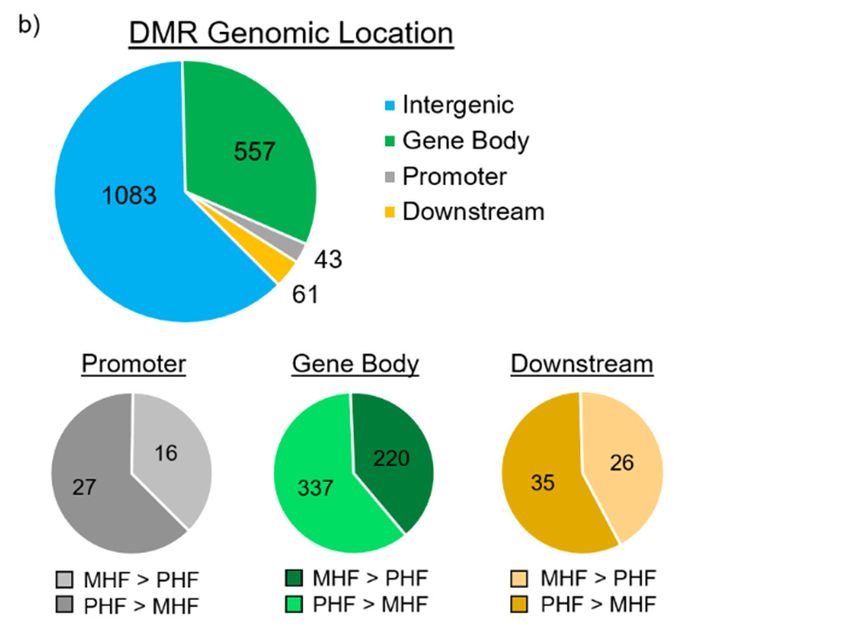
Int. J. Mol. Sci. 2019, 20, 3229                                                                                                6 of 24
 Int. J. Mol. Sci. 2019, 20, 3229                                                                                                6 of 24

 sequences
(Figure 3a, nflanking   the islands.
               = 484, 27.8%)          In CpG
                                than in  fact, more
                                               islandsthan
                                                        (n =twice as manyThis
                                                             227, 13.0%).   DMRs   were identified
                                                                               is consistent        in shore
                                                                                              with previous
reports showing that most treatment-induced changes of DNA methylation does not occur withinwith
 regions (Figure   3a,  n = 484,  27.8%)   than  in CpG   islands (n = 227, 13.0%). This  is consistent   the
 previous  reports  showing    that most  treatment-induced    changes of DNA   methylation   does
conserved CpG islands, but rather is localized primarily to nearby regions with slightly lower CpG not  occur
 within theincluding
densities,   conserved theCpG   islands,
                           shores        but rather is localized primarily to nearby regions with slightly
                                   [20,21].
 lower CpG densities, including the shores [20,21].

       Figure3.3.DMR
      Figure      DMRdistributions
                          distributions in in
                                            relevance
                                               relevance to CpG
                                                            to CpGislands and and
                                                                      islands   to gene   locations
                                                                                      to gene         and structures.
                                                                                                 locations              (a) DMR
                                                                                                             and structures.   (a)
      distribution   around   CpG    islands.    CpG     shore   was  defined   as  the  2000
       DMR distribution around CpG islands. CpG shore was defined as the 2000 base pair sequencebase   pair  sequence   flanking
      either sideeither
       flanking    of a CpG   island.
                         side of a CpG  DMRs
                                          island.in DMRs
                                                     the shores   (dark
                                                             in the      gray,
                                                                    shores     n = gray,
                                                                            (dark    484) outnumbered         the DMRs
                                                                                           n = 484) outnumbered        thelocated
                                                                                                                            DMRs
      within  CpG    islands  (black,   n =   227).   (b) DMR     locations  relative   to  gene   structures.
       located within CpG islands (black, n = 227). (b) DMR locations relative to gene structures. Promoter       Promoter   and
      downstream     regions  were   defined    as ±  1500  bp  upstream   of the  transcription
       and downstream regions were defined as ± 1500 bp upstream of the transcription start site andstart site and  downstream
      of the transcription
       downstream      of theend  site, respectively.
                              transcription     end site,Top  panel depicts
                                                            respectively.     thepanel
                                                                            Top    number     of DMRs
                                                                                          depicts         not associated
                                                                                                    the number      of DMRswithnot
                                                                                                                                a
      gene  (blue, n =  1083) and   DMRs     located   within   the gene  body   (red,  n =  557),  within
       associated with a gene (blue, n = 1083) and DMRs located within the gene body (red, n = 557), within the  promoter   (gray,
         = 43),
      nthe      and within
           promoter    (gray,the
                               n =downstream
                                   43), and within  region   (yellow, n = 61).
                                                        the downstream           A majority
                                                                            region    (yellow, ofn =DMRs
                                                                                                      61). Aare   not associated
                                                                                                               majority of DMRs
      with  protein-coding
       are not  associated withgenes.    Bottom panels
                                   protein-coding      genes.classify
                                                                Bottomthepanels
                                                                          DMRsclassify
                                                                                    withinthe theDMRs
                                                                                                   promoter,
                                                                                                          withingene
                                                                                                                   thebody,  and
                                                                                                                       promoter,
      downstream regions. DMRs that are more methylated in MHF (MHF > PHF) are in darker shades,
       gene body, and downstream regions. DMRs that are more methylated in MHF (MHF > PHF) are in
      while those that more methylated in PHF (PHF > MHF) are in lighter shades.
       darker shades, while those that more methylated in PHF (PHF > MHF) are in lighter shades.

     DMRs were then aligned with gene positions. Of the 1744 identified DMRs, 661 (38%) were
      DMRs were then aligned with gene positions. Of the 1744 identified DMRs, 661 (38%) were
associated with protein-coding genes (Figure 3b). Among the 661 gene-associated DMRs, only 43 were
 associated with protein-coding genes (Figure 3b). Among the 661 gene-associated DMRs, only 43
positioned within the 1500 bp upstream promoter region and 61 were in the 1500 bp downstream
 were positioned within the 1500 bp upstream promoter region and 61 were in the 1500 bp
regions. The rest of the 557 gene-associated DMRs are located within intragenic regions. Furthermore,
 downstream regions. The rest of the 557 gene-associated DMRs are located within intragenic regions.
37%, 40%, and 43% were more methylated in the MHF group than the PHF group, and 63%, 60%, and
 Furthermore, 37%, 40%, and 43% were more methylated in the MHF group than the PHF group, and
57% were more methylated in the PHF group than the MHF group within the promoter, gene body,
 63%, 60%, and 57% were more methylated in the PHF group than the MHF group within the
and downstream regions, respectively.
 promoter, gene body, and downstream regions, respectively.
     A majority of the DMRs identified (n = 1,083, 62%) were not associated with a protein-coding
      A majority of the DMRs identified (n = 1,083, 62%) were not associated with a protein-coding
gene. These regions were further examined for non-coding RNA sequences using the Genome
 gene. These regions were further examined for non-coding RNA sequences using the Genome
 Browser rat dataset, and only one DMR was located in an RNase P. While it is possible that these
Int. J. Mol. Sci. 2019, 20, 3229 7 of 24
Browser rat dataset, and only one DMR was located in an RNase P. While it is possible that these
non-gene-associated DMRs are positioned within regions of “junk DNA”, it may be the case that these
regions serve regulatory functions for unknown gene targets.
DMGs were annotated with Gene Ontology terms and Kyoto Encyclopedia of Genes and Genomes
(KEGG) pathways. Significant clustering was observed based on functional similarity (Figure S3).
When all DMRs were considered, 8 annotation clusters were identified (Enrichment Threshold > 2.0,
p < 0.01). Representative annotation terms with the smallest p-value from each cluster included ion
binding (GO:0043167, Cluster 1), cell morphogenesis (GO:0000902, Cluster 2), cell fraction (GO:0000267,
Cluster 3), cell morphogenesis involved in differentiation (GO:0000904, Cluster 4), stereocilium
(GO:0032420, Cluster 5), regulation of synaptic transmission (GO:0050804, Cluster 6), triglyceride
biosynthetic process (GO:0019432, Cluster 7), and cAMP catabolic process (GO:0006198, Cluster 8).
Investigation of KEGG pathways demonstrated that seven pathways were DMR-enriched (Table 1,
Fisher’s exact p-value < 0.05). Using Benjamini–Hochberg correction, only the phosphatidylinositol (PI)
signaling system (rno04070) was significantly enriched (corrected p-value = 0.006). Other pathways
of interest included insulin signaling pathway (rno04910), axon guidance (rno04360), pathways in
cancer (rno05200), purine metabolism (rno00230), glycerolipid metabolism (rno00561), and Fc gamma
R-mediated phagocytosis (rno04666). There were three pathways that were more methylated in the
MHF group: phosphatidylinositol signaling system (rno04070), apoptosis (rno04210), and Fc gamma
R-mediated phagocytosis (rno04666). On the other hand, the insulin signaling pathway (rno04910)
was the only pathway that is more methylated in the PHF group.
2.3. Post-Weaning HF Increases Gene Expression While Maternal HF Decreases Gene Expression in the PI and
Insulin Signaling Pathways
From the pathway analysis, we chose to further investigate the PI signaling and insulin signaling
pathways. Not only are these two pathways interconnected, but they also serve metabolic roles that
are known to be perturbed by high calorie diets. Furthermore, the PI and insulin signaling pathways
were statistically the most DMR-enriched according to the DAVID analysis (p = 0.006 and p = 0.4,
respectively, Table 2). Additionally, we compared methylation and gene expression results to the CON
group in order to assess not only differences in timing of the HF exposure, but also to examine whether
any HF diet intake might disrupt metabolic pathways compared to control diet (Figure 4).
Table 2. Pathway Analysis.
Pathway DMGs Fold Enrichment p-Value
Phosphatidylinositol signaling system 11 5.2 0.00004
Insulin signaling pathway 11 2.8 0.006
Axon guidance 10 2.6 0.01
Pathways in cancer 18 1.9 0.01
Purine metabolism 10 2.1 0.04
Glycerolipid metabolism 5 3.8 0.04
Fc gamma R-mediated phagocytosis 7 2.6 0.05
Maternal versus post-weaning HF diet exposure results in seven differentially methylated pathways. DMGs column
refers to the number of differentially methylated genes in the pathway. Fold Enrichment signifies the degree of
enrichment within each pathway given the overall list of DMGs. A lower p-value indicates higher gene-enrichment
within a pathway.Int. J. Mol. Sci. 2019, 20, 3229 8 of 24
Int. J. Mol. Sci. 2019, 20, 3229 8 of 24
Figure4. 4.Summary
Figure Summaryofofepigenetic
epigeneticand
andgene
geneexpression
expressiondifferences
differencesininthe theinsulin
insulinandandPIPIsignaling
signaling
pathways.
pathways. Genes
Genesin in
each pathway
each pathwayareare
boxed andand
boxed filled withwith
filled two two
colors. The The
colors. colorcolor
in theinleft
theside
left of theof
side
box indicates methylation levels, while the color in the right side of the box denotes
the box indicates methylation levels, while the color in the right side of the box denotes gene gene expression
levels. White levels.
expression color signifies
White no change,
color blue color
signifies signifiesblue
no change, higher methylation
color signifies or expression
higher in MHFor
methylation
animals, and red signifies higher methylation or expression in PHF animals. Yellow
expression in MHF animals, and red signifies higher methylation or expression in PHF animals. and purple boxes
represent
Yellow andmetabolic
purplefunctions. A solidmetabolic
boxes represent line represents a direct
functions. relationship,
A solid a dashed
line represents line represents
a direct a
relationship,
multi-step process, and compounds with no outline are other important signaling
a dashed line represents a multi-step process, and compounds with no outline are other importantmolecules.
signaling molecules.
We combined and condensed the pathways by focusing on 27 genes, 17 of which were differentially
methylated and 10 of which
We combined were not differentially
and condensed the pathways methylated but served
by focusing on 27crucial
genes,metabolic
17 of whichfunctions
were
(Figure 4). We first examined the methylation in each of the genes relative
differentially methylated and 10 of which were not differentially methylated but served crucial to the CON group
(Figure 5a,b).
metabolic Generally,
functions methylation
(Figure 4). We first Dgkg, Ip3k,the
of examined Pik3c2b, Pde3, and
methylation Larof
in each was
thelower
genes in PHF than
relative to the
CON methylation of Pklr
CON group (Figure 5a,b). Generally, methylation of Dgkg, Ip3k, Pik3c2b, Pde3, and Lar waslower
while was higher in PHF than CON. Additionally, methylation was lowerinin
Inpp5,
PHF Pik3c2b,
than CON Cbl, Lar, and
while Pklr in MHF
methylation than
of Pklr wasCON
higherwhile methylation
in PHF than CON. of Ip3k and Pde3 was
Additionally, higher
methylation
inwas
MHF than in CON. We then performed quantitative PCR for all 27 genes
lower in Inpp5, Pik3c2b, Cbl, Lar, and Pklr in MHF than CON while methylation of Ip3k andand found 10 that were
Pde3
differentially expressed (p < 0.05). Among the differentially methylated genes,
was higher in MHF than in CON. We then performed quantitative PCR for all 27 genes and found 10 diacylglycerol kinase
gamma (Dgkg),differentially
that were inositol-triphosphate
expressed3-kinase
(pInt. J. Mol. Sci. 2019, 20, 3229 9 of 24
Int. J. Mol. Sci. 2019, 20, 3229 9 of 24
Figure 5.
Figure Differential gene
5. Differential gene expression
expression inin the
the insulin
insulin and
and PI
PI signaling
signaling pathways.
pathways. (a)(a) Methylated
Methylated DNA
DNA
reads were measured using MeDIP-seq. † denotes a ≥15% difference between CON
reads were measured using MeDIP-seq. † denotes a ≥15% difference between CON and either PHF or and either PHF or
MHF. Data are presented as mean ±SEM across each DMR. (b) Unmethylated
MHF. Data are presented as mean ±SEM across each DMR. (b) Unmethylated DNA was measured DNA was measured
using MRE-seq. ††denotes
using MRE-seq. denotesa ≥15%
a ≥15%difference between
difference CONCON
between and either
and PHF
eitherorPHF
MHF.orData are presented
MHF. Data are
as mean ±SEM across each DMR. (c) Eight DMGs were significantly differentially expressed
presented as mean ±SEM across each DMR. (c) Eight DMGs were significantly differentially expressed between
MHF and PHF groups. The bar graph represents the mRNA quantity relative to
between MHF and PHF groups. The bar graph represents the mRNA quantity relative to B Actin. B Actin. Data are
presented as mean ±SEM. * p < 0.05.
Data are presented as mean ±SEM. * p < 0.05.
2.4. Genomic Context of DNA Methylation Is Indicative of Gene Expression
2.4. Genomic Context of DNA Methylation is Indicative of Gene Expression
Among the 17 DMGs of interest, we examined the distance of the gene-associated DMR to the
Among the 17 DMGs of interest, we examined the distance of the gene-associated DMR to the
nearest CpG island as well as their intragenic locations (Figure 6). Of the 8 differentially expressed
nearest CpG island as well as their intragenic locations (Figure 6). Of the 8 differentially expressed
DMGs, only one contained a DMR that was located within a CpG island (Pklr, Figure 6a). Interestingly,
DMGs, only one contained a DMR that was located within a CpG island (Pklr, Figure 6a).
the remaining 7 DMRs fell outside the 2000 bp shore region (Figure 6a). We also found that except for
Interestingly, the remaining 7 DMRs fell outside the 2000 bp shore region (Figure 6a). We also found
one, all DMRs were intragenic, with a majority located in introns (Figure 6b).
that except for one, all DMRs were intragenic, with a majority located in introns (Figure 6b).Int.
Int.J.J.Mol.
Mol.Sci. 2019,20,
Sci.2019, 20,3229
3229 1010ofof2424
Figure 6. Genomic context of DMRs. (a) DMGs within the PI and insulin signaling pathways were
Figure 6.
mapped Genomictocontext
according of DMRs.
their distance from(a)the
DMGs within
nearest CpGthe PI and
island. Geneinsulin
namessignaling
in red and pathways were
blue denote
mapped
those that according
were moretohighly
their distance from
expressed thePHF
in the nearest
andCpGMHFisland.
group,Gene names in(b)
respectively. redIntragenic
and blue denote
DMR
those that were more highly expressed in the PHF and MHF group, respectively. (b)
position is shown for each DMG in the PI and insulin signaling pathways. Blue circles represent DMRsIntragenic DMR
position is shown for each DMG in the PI and insulin signaling pathways. Blue circles
in which DNA methylation was higher in the MHF group. Red circles represent DMRs in which DNA represent DMRs
in which DNA
methylation wasmethylation
higher in the was higher
PHF in the
group. MHF
Gene group.
names Redand
in red circles
bluerepresent DMRs
denote those in which
that DNA
were more
methylation
highly expressedwasinhigher
the PHF in the
andPHF
MHF group.
group, Gene names in red and blue denote those that were more
respectively.
highly expressed in the PHF and MHF group, respectively.
Lastly, we investigated the intragenic locations of these differentially methylated and differentially
Lastly,
expressed we investigated
regions. Based on qPCR theresults,
intragenic
a genelocations
expressionoft-score
thesewas differentially
calculated for methylated
every geneand in
differentially
every expressed
animal. Values thatregions. Based
were four on qPCR
standard results, away
deviations a genefrom
expression
the mean t-score
werewas calculated
chosen. for
Relative
every gene
intragenic in every
position ofanimal.
a givenValues
DMR was that calculated
were four by standard
dividing deviations awayoffrom
the distance the mean
the DMR fromwere
the
chosen. Relative
transcription startintragenic
site (TSS)position of a given
by the total lengthDMRof thewas calculated
gene (Figure by dividingThe
7 x-axis). thekernel
distance of the
density
DMR fromwas
estimation the plotted
transcription start site
to visualize the(TSS) by the total
distribution length of the
of intragenic DMR gene (Figure 7Interestingly,
positions. x-axis). The kernel
none
ofdensity estimationexpressed
the differentially was plottedDMRtowas visualize the distribution
in the promoter regions (dataof intragenic
not shown).DMR Genes positions.
highly
Interestingly,
expressed in thenone
MHF of group
the differentially
tended to be expressed DMR was
less methylated, andinthis
thelow
promoter regions
methylation was(data
foundnot
shown).
almost Genes highly
exclusively in the expressed
middle of thein the MHF group
intragenic tended
region (blue to beFigure
curves, less methylated, and this
7a). Furthermore, low
higher
methylation
gene expression wasinfound
the PHFalmost exclusively
group in the middle
was correlated of themethylation
with lower intragenic region (blue
near the curves,
TSS Figure
and higher
7a). Furthermore,
methylation higher gene
in downstream expression
regions closer into the
the PHF group was
transcription correlated
end site (TES,with lower
yellow vs methylation
red curves,
near the
Figure TSS
7b). and higher
However, wemethylation
highlight the in idea
downstream
that generegions closer to the may
body methylation transcription end site (TES,
play an activating or
yellow vs red curves, Figure 7b). However,
repressive role in transcriptional regulation [22]. we highlight the idea that gene body methylation may
play an activating or repressive role in transcriptional regulation [22].Int. J. Mol. Sci. 2019, 20, 3229 11 of 24
Int. J. Mol. Sci. 2019, 20, 3229 11 of 24
Figure7.7.Gene
Figure Geneexpression
expressionis associated withwith
is associated intragenic DMRDMR
intragenic position. X-axisX-axis
position. indicates intragenic
indicates DMR
intragenic
position relative to the gene’s transcription start site (x = 0) and transcription end site (x = 100).
DMR position relative to the gene’s transcription start site (x = 0) and transcription end site (x = 100). Y-axis
represents the density
Y-axis represents theofdensity
DMRs.of(a)DMRs.
the density plot
(a) the depictsplot
density DMGs that were
depicts DMGs more
thathighly
were expressed in
more highly
the MHF group. Higher gene expression in MHF was associated with lower DNA
expressed in the MHF group. Higher gene expression in MHF was associated with lower DNA methylation in the
middle of the in
methylation intragenic
the middleregion. (b)
of the The density
intragenic plot (b)
region. shows
TheDMGs
densitythat were
plot more
shows DMGshighly expressed
that in
were more
the PHF group. Higher PHF expression was associated with higher downstream DNA
highly expressed in the PHF group. Higher PHF expression was associated with higher downstream methylation
and
DNAlower DNA methylation
methylation and lowernear
DNA the TSS.
methylation near the TSS.
3. Discussion
3. Discussion
The present study used deep sequencing technologies to examine DNA methylation profiles
The present study used deep sequencing technologies to examine DNA methylation profiles in
in animals exposed to HF diet at different time points. First, to address whether timing of HF diet
animals exposed to HF diet at different time points. First, to address whether timing of HF diet
exposure induced methylation changes, we compared between MHF and PHF rats. Over 1700 DMRs
exposure induced methylation changes, we compared between MHF and PHF rats. Over 1700 DMRs
were identified, of which a large portion were in CpG shores and intragenic regions. Gene-associated
were identified, of which a large portion were in CpG shores and intragenic regions. Gene-associated
DMRs also clustered in the insulin and PI signaling pathways. We then compared DNA methylation
DMRs also clustered in the insulin and PI signaling pathways. We then compared DNA methylation
in the identified regions to lifelong control-fed animals to uncover the impact of HF intake regardless
in the identified regions to lifelong control-fed animals to uncover the impact of HF intake regardless
of timing. In these metabolic pathways, we conclude that any HF diet decreases DNA methylation, as
of timing. In these metabolic pathways, we conclude that any HF diet decreases DNA methylation,
both the MHF and PHF groups generally had lower methylation than CON; however, expression of
as both the MHF and PHF groups generally had lower methylation than CON; however, expression
key metabolic regulators tended to be higher in PHF and lower in MHF. Finally, we examined DMR
of key metabolic regulators tended to be higher in PHF and lower in MHF. Finally, we examined
location relative to CpG islands and gene features. We found the greatest number of DMRs located in
DMR location relative to CpG islands and gene features. We found the greatest number of DMRs
CpG shores and showed an inverse correlation between gene expression and distance of intragenic
located in CpG shores and showed an inverse correlation between gene expression and distance of
DNA methylation from the TSS.
intragenic DNA methylation from the TSS.
The current study used two diets. The control and HF diets had equal amounts of soybean oil, but
The current study used two diets. The control and HF diets had equal amounts of soybean oil,
the HF diet contained higher amounts of lard. Lard provides more saturated and monounsaturated fat
but the HF diet contained higher amounts of lard. Lard provides more saturated and
compared to soybean oil. This has been shown to increase adiposity and markers of inflammation [23].
monounsaturated fat compared to soybean oil. This has been shown to increase adiposity and
Chronic obesity-induced inflammation also underlies insulin resistance [24]. Interestingly, we found
markers of inflammation [23]. Chronic obesity-induced inflammation also underlies insulin
differential methylation in the insulin signaling pathway, so inflammatory factors may be a potential
resistance [24]. Interestingly, we found differential methylation in the insulin signaling pathway, so
link between HF diet and epigenetic modifications. This can be tested in future experiments using HF
inflammatory factors may be a potential link between HF diet and epigenetic modifications. This can
diets with different amounts of lard, soybean oil, or fish oil to distinguish the effects of inflammation
be tested in future experiments using HF diets with different amounts of lard, soybean oil, or fish oil
versus obesity. All other dietary components were kept constant, except for the major carbohydrate
to distinguish the effects of inflammation versus obesity. All other dietary components were kept
source, which was cornstarch in the control diet and sucrose in the HF diet. Sucrose and cornstarch
constant, except for the major carbohydrate source, which was cornstarch in the control diet and
have been shown to differentially impact body weight gain, circulating lipid profile, insulin sensitivity,
sucrose in the HF diet. Sucrose and cornstarch have been shown to differentially impact body weight
and hepatic gene expression [25–27]. Thus, it is possible that the observed effects could have resulted
gain, circulating lipid profile, insulin sensitivity, and hepatic gene expression [25–27]. Thus, it is
possible that the observed effects could have resulted from dietary carbohydrate differences ratherInt. J. Mol. Sci. 2019, 20, 3229 12 of 24
from dietary carbohydrate differences rather than fat intake, so further investigation should examine
individual dietary components to better understand their effects on DNA methylation.
Overall, we observed higher body weight and hepatic lipid accumulation in PHF rats. At post-natal
week 12, the PHF group weighed more than CON, but there was no difference in body weight between
MHF and PHF. Given the large difference in caloric intake, this finding was surprising. However, while
HF diet administration has been shown to induce weight gain during adulthood, high energy intake
during the post-weaning period results in only moderate body weight differences [28–31]. During
the post-weaning period, rapid growth occurs, which may mask any additional diet-induced weight
gain. We found greater hepatic lipid deposition in the PHF group compared to both CON and MHF.
To understand the potential mechanisms mediating these differences, we measured expression of
genes that were related to de novo lipogenesis and triglyceride synthesis. We found higher expression
in MHF animals and lower expression in PHF rats. The down-regulation of these pathways in PHF
animals is not surprising and is likely a direct effect of abundant dietary fat and a reduced need for de
novo synthesis. However, the influx of dietary fat likely leads to the increased quantity of hepatic lipid
that we observed. On the other hand, MHF rats had higher expression of de novo lipogenesis genes
than controls, despite the eating the same post-weaning diet. Previous reports have similarly found
increased acetyl-CoA carboxylase (Acc) expression in liver and adipose tissue of maternal HF-fed
animals [32,33]. Moreover, disturbances in maternal diet have been shown to drive metabolic outcomes
via epigenetic programming [34,35]. In our study, it is unclear whether this was due to maternal
programming, considering that there were no methylation differences at these loci at post-natal week 12.
Moreover, there were no differences in hepatic lipid accumulation between MHF and CON. Thus, while
gene expression might suggest that the MHF group is more efficient at converting excess energy to fat,
there are other factors that prevent hepatic accumulation. Future work should quantify lipid export
and size of different adipose depots to find whether changes in the liver could affect other organs.
Among 1744 DMRs identified across 21 chromosomes, ~28% of which were located within CpG
shores, more than twice the number located in CpG islands (13%). This is in line with previous
studies illustrating that DMRs within the same tissue type occur more frequently in shores versus
islands [20,21]. We also found many DMRs in intragenic and intergenic regions as opposed to promoter
regions, which is expected, as CpG islands tend to be localized in promoters [36]. Although a majority
of the DMRs resided in intragenic regions, only one corresponded with an annotated non-coding RNA.
We attribute this finding to the fact that information regarding the function of intergenic regions is
sparse, especially for the rat. For example, the microRNA database, mirBase, annotates 4694 miRNA
sequences in humans and 3232 in mouse, but only 1318 in rat. As non-coding regions become more
widely studied and compiled in other model organisms, we suspect that our identified intergenic
regions will show more regulatory functions. Over the past decade, ENCODE and similar projects have
gradually uncovered the intricacies of the vast genetic regulatory network [37]. Most of these advances
have focused on human transcriptional regulators, but as the data becomes publicly available for other
model organisms we might be able to assign function to previously unnamed genomic regions.
Functional clustering and pathway analysis revealed DMR enrichment in the insulin and PI
signaling pathways. Both are nutrient-sensing pathways important in carbohydrate and lipid
metabolism, suggesting that maternal and post-weaning HF dietary exposure may cause distinct
metabolic outcomes. Indeed, PHF animals had greater lipid accumulation in the liver than did MHF
animals. In the MHF group, we also observed higher methylation and lower gene expression of Pi3k
and Pde3, two genes involved in a phosphorylation cascade that inhibits lipolysis. Three separate
PI3K genes were more highly methylated in the MHF compared to the PHF group, including PI3K
regulatory subunit 1 (Pi3kr1), PI3K regulatory subunit 3 (Pi3kr3), and PI3K catalytic subunit type 2 beta
(Pi3kc2b). While Pi3kr1 and Pi3kr3 expression was modestly decreased in the MHF group, only Pi3kc2b
expression was significantly reduced. PI3K is a key component of the insulin signaling pathway, but
its regulation is also controlled in large part by PI signaling [38]. Previous studies have shown that
when members of the PI signaling system are knocked down, PI3K activity and the insulin signalingInt. J. Mol. Sci. 2019, 20, 3229 13 of 24
pathway are dysregulated. For example, Inositol Polyphosphate Phosphatase-Like 1 (Inppl1) knock
out mice display insulin hypersensitivity, increased levels of phosphorylated AKT, and protection
against diet-induced obesity [39,40]. Moreover, knocking down inositol polyphosphate-4-phosphatase
type II (Inpp4b), a component of the PI signaling pathway, results in the deregulation the PI3K-AKT
pathway such that the magnitude and duration of insulin-stimulated AKT activation are significantly
altered [41]. In our experiment, we observed four PI signaling genes (Ip3k, Inpp5, DG kinase, and PI
synthase) that were more highly expressed in the PHF than MHF group. This difference in PI signaling
genes may reflect the distinct regulation of PI3K between the two groups. The observed differences
in methylation of PI3K as well as the gene expression changes of its regulators in the PI signaling
pathway indicate that PI3K’s function as a catalytic protein may be altered in PHF compared to MHF
diet exposure.
In the MHF group, we observed higher methylation within the first intron of Pde3, which was
associated with the decreased expression of Pde3. Inhibition of Pde3 sufficiently blocks the antilipolytic
action of insulin via its role in hydrolyzing cAMP and cGMP [42]. In fact, an adipocyte Pde3 knockout
has been shown to result in higher levels of insulin-stimulated lipogenesis [43]. Similarly, knockout
mice had altered phosphorylation state of insulin- and cAMP-signaling components as well as higher
lipolysis upon catecholamine stimulation. Thus, the decrease in Pde3 expression in the MHF group
suggests that insulin may have less of an inhibitory effect on the catabolism of triacylglercerol and
contribute to the lower hepatic lipid accumulation in the MHF group.
In addition to identifying genes that have annotated functions in PI and insulin signaling pathways,
our results corroborate GWAS analyses that have investigated the association between novel loci
and traits such as body–mass index (BMI), waist circumference, triglyceride levels, cholesterol and
diabetes [44–46]. Specifically, previous studies have found that SNPs within Cdh23 were correlated
with BMI [45], SNPs in Tph2 were correlated with obesity [44], SNPs in Prox1 were correlated with
glucose metabolism [47], SNPs in Lipc were correlated with cholesterol [48–50], and SNPs in Pnpla3
were correlated with hepatic lipid content [51]. We found DMRs associated with each of these genes:
Cdh23, Tph2, and Lipc were more methylated in MHF while Prox1 and Pnpla3 were more methylated
in PHF. Although reproducibility across GWAS studies is often lacking, we provide evidence that
strengthens past findings. Furthermore, we suggest that future research may benefit from combining
multiple sequencing modalities to identify robust biomarkers of metabolic health.
Beyond analyzing the role of HF diet in controlling metabolic processes, we also attempted to
characterize the differences in epigenetic landscape between MHF and PHF and to examine how DNA
methylation is associated with gene expression. We identified that most DMRs were in CpG shores.
CpG island methylation has been studied extensively in the context of islands at TSSs where higher
island methylation represses gene expression. Reports have shown that intragenic CpG islands are
more likely to contain alternative promoters and other regulatory features [14,52]. Differential DNA
methylation in CpG shores has also been shown to be associated with gene expression [20], but it is
unknown whether CpGs outside CG-dense regions perform similar regulatory functions. In our study,
we also found that out of the DMRs associated with insulin and PI signaling, five were located in CpG
islands, one was in a CpG shore, and the remaining 11 were more than 2 kb away from the nearest
island in the open sea. CpGs in the open sea have been shown to be generally hypomethylated [53–56].
While in cancer, this hypomethylation has been associated with chromosomal instability, open sea
methylation also naturally changes with during development. From birth to age 10, CpG islands tend to
gain methylation whereas open sea CpGs tend to lose methylation [53,57–61]. Thus, it may be the case
that the identified DMRs are a result of diet-mediated alterations in developmental processes. Future
work should focus on defining the role of DNA methylation outside of CpG islands to understand
how metabolic disturbances impact such loci.
Through the investigation of the relationship between intragenic DMR location and gene
expression, we observed that all differentially expressed DMGs contained DMRs in the gene body.
Five out of 8 differentially expressed DMGs contained a DMR exclusively in an intronic region whileInt. J. Mol. Sci. 2019, 20, 3229 14 of 24
the remaining 3 genes had a DMR spanning both an intron and an exon. The role of intronic DNA
methylation is not well understood. Past investigation has hypothesized that it controls alternative
splicing [62,63]. Others have reported regulatory elements within introns that when methylated have
either repressive or activating role in gene expression [64,65]. Additionally, reports have speculated that
the balance between intronic and exonic DNA methylation to be important in determining nucleosome
spacing and subsequent Pol II binding [66–69]. Thus, it is difficult to discern which mechanism is at
play in each of the identified genes.
There is currently no clear consensus as to the function of gene body DNA methylation. It has
been proposed to mediate chromatin structure, splicing, and transcriptional kinetics; however, it is
clear that gene body methylation does not necessarily act in the same way as traditionally studied
promoter methylation [70]. We observed that DMR distance from the TSS was associated with gene
expression. Higher expression was associated with higher methylation in more distal regions. These
findings are supported by previous reports that gene expression increased with higher gene body
methylation, but did not distinguish among different intragenic locations [71,72]. Other studies showed
that highly expressed genes were characterized by low methylation in the gene body near the TSS and
high intragenic methylation closer to the 3’ TES [22,73]. Similarly, low gene expression is correlated
with high methylation in the first exon [74].
HF diet may affect the epigenetic landscape via numerous mechanisms. HF diet can incite
inflammation and hormonal changes that have been associated with altered DNA methylation
patterns [75]. However, it may be the case that HF diet acts directly on epigenetic modifiers and
methylation processes. For instance, short-chain fatty acids such as butyrate and acetate have been
shown to inhibit histone deacetylases (HDACs) and alter DNA methylation [76]. Furthermore,
acetyl-CoA, the end-product of beta oxidation, is a rate-limiting cofactor in histone acetylase (HAT)
activity [77]. Due to the bidirectional recruitment and interaction between histone modifications and
DNA methylation, HF diet has the potential to perturb chromatin state and severely impact transcription.
The observed methylation discrepancies that occur during the perinatal versus post-weaning
periods may be explained by the drastic differences in methylation events between the two groups.
During the perinatal period, an initial wave of demethylation is followed by de novo methylation
by methyltransferases DNMT3a and DNMT3b [9]. However, during the post-weaning period,
methylation patterns have already been established, and further upkeep relies solely on the maintenance
DNA methyltransferase DNMT1 [78]. HF diet may interfere differently with certain types of
methyltransferases. Previous reports have shown that altering dietary folate and choline has different
effects on the expression of DNMT1 and DNMT3 and that these changes vary with length and timing
of exposure [79–82]. Another study showed that HF diet differentially affected the expression of
DNMT1, DNMT3a, and DNMT3b, as well as their binding to the DNA [83]. After eight weeks of
post-weaning HF diet intake, DNMT1 binding at the leptin receptor promoter significantly decreased,
and DNMT3b binding significantly increased. The study also investigated methyl binding domain
protein 2 (MBD2), which may play a role in DNA demethylation. In addition to DNA methyltransferases,
it is possible that HF diet differentially affects mediators of active DNA demethylation. In the future,
next generation sequencing will allow for a genome-wide view of epigenetic modifier binding in
response to dietary challenges.
We provide novel insight into epigenetic programming by HF diet; however, the current study
has limitations that should be addressed in future investigation. First, we examine only male offspring
in our study. Previously, we have found sex-specific physiological and molecular changes resulting
from HF diet intake [84–86]. In particular, we have observed large differences in gene expression
and DNA methylation in male rats [19,87,88]. In the current study, we build upon prior results in
male offspring; however, it is unknown whether these results would be broadly applicable to females.
Thus, subsequent studies should examine whether DNA methylation patterns are robust across sexes.
Furthermore, we found molecular changes, but we do not provide evidence that these changes induce
functional consequences. As this was a genome-wide exploratory study, it was unclear whether certainInt. J. Mol. Sci. 2019, 20, 3229 15 of 24
pathways would be more enriched for changes in DNA methylation. However, now that PI and insulin
signaling have been identified, follow-up studies should measure insulin sensitivity and glucose
tolerance. Finally, we measured DNA methylation and gene expression at one time point at post-natal
week 12, but it is unknown whether DNA methylation is labile between birth, weaning, and further
into the post-natal period. It could be the case that younger animals are better equipped than older
animals to combat disturbances in the methylome to normalize gene expression. Further work should
explore molecular changes at multiple time points to discern whether epigenetic alterations have a
similar impact at different life stages.
4. Materials and Methods
4.1. Animals and Diets
Timed-pregnant Sprague Dawley rat dams (Charles River Laboratories) were divided into two
groups. One group of dams was fed a standard AIN93G diet (n = 12; Research Diets, Inc.; 16%, 64%,
20% calories from fat, carbohydrate, and protein, respectively) while the other group was fed a HF diet
(n = 12; Research Diets, Inc.; 45%, 35%, 20% calories from fat, carbohydrate, and protein, respectively)
during gestation and lactation [85]. On post-natal day 21, male pups from control diet-fed dams were
weaned onto control diet (n = 10) or HF diet (n = 10). Male pups from HF-fed dams were weaned onto
the AIN93G control diet (n = 10). This created three groups of pups: control (CON), post-weaning
high fat (PHF), and maternal high fat (MHF). Diet composition is detailed in Table S1.
Rats were individually housed in standard polycarbonate cages in a humidity- and
temperature-controlled room on a 12-hour light-dark cycle with ad libitum access to food and drinking
water. Body weight and food intake was measured weekly. Each treatment group was kept on their
respective post-weaning diet until 12 weeks of age. Before sacrifice, animals were fasted for 12 h
and received free access to water. Euthanasia was performed via CO2 followed by decapitation. The
median lobe of the liver was immediately frozen in liquid nitrogen and stored at −70 ◦ C. Institutional
and governmental regulations regarding the ethical use of animals were followed during the study. The
protocol for ethical use of animals for this study was approved by the University of Illinois Institutional
Animal Care and Use Committee (IACUC protocol no. 09112).
4.2. Histological Analysis
Frozen liver samples were embedded in Tissue-Tek OCT compound (VWR, cat. #25608-930)
and sectioned, stained, imaged, and quantified using a previously published protocol [86]. Briefly,
OCT-embedded liver tissues were sectioned to 7 µm and stained with hematoxylin and eosin (H&E) and
Oil Red O solution (Newcomer Supply, cat. #1277A). The slides were imaged using the Nanozoomer
imaging system at the Carl R. Woese Institute for Genomic Biology core facilities at the University of
Illinois (Hamamatsu Photonics, Hamamatsu City, Japan). Quantification of lipid accumulation was
normalized to total protein as previously described [87].
4.3. Genomic DNA Isolation
Ten mg of liver tissue was ground in liquid nitrogen and genomic DNA was extracted in 600 µL of
Extraction Buffer (50 mM Tris, pH 8.0, 1 mM EDTA, pH 8.0, 0.5% SDS, 1 mg/mL Proteinase K) at 55 ◦ C
overnight. Lysate were centrifuged and supernatant was collected and mixed with phenol/chloroform.
The mixture was transferred to a phase lock gel tube (Fisher Scientific, cat. #NC1092951) and centrifuged
at 16,000× g for 5 min for phase separation. The upper phase was transferred and incubated with
1 µL of RNase (Roche, 10 mg/mL) for 1 h at 37 ◦ C. The extraction was then repeated, and the resulting
purified DNA was precipitated with 1/10 vol of 3 M Na Acetate (pH 5.2) and 2.5 vol of 100% ethanol.
The DNA pellet was washed with 70% ethanol and resuspended in TE. DNA electrophoresis was used
to confirm the integrity of the extracted genomic DNA.You can also read