Characterization of the first tetrameric transcription factor of the GntR superfamily with allosteric regulation from the bacterial pathogen ...
←
→
Page content transcription
If your browser does not render page correctly, please read the page content below
Published online 11 December 2020                                                           Nucleic Acids Research, 2021, Vol. 49, No. 1 529–546
                                                                                                                       doi: 10.1093/nar/gkaa1181

Characterization of the first tetrameric transcription
factor of the GntR superfamily with allosteric
regulation from the bacterial pathogen Agrobacterium
fabrum
Armelle Vigouroux1,† , Thibault Meyer2,† , Anaı̈s Naretto1 , Pierre Legrand 3 ,
Magali Aumont-Nicaise1 , Aurélie Di Cicco4 , Sébastien Renoud2 , Jeanne Doré2 ,
Daniel Lévy 4 , Ludovic Vial2 , Céline Lavire2,* and Solange Moréra 1,*

                                                                                                                                                              Downloaded from https://academic.oup.com/nar/article/49/1/529/6031445 by guest on 13 December 2021
1
 Université Paris-Saclay, CEA, CNRS, Institute for Integrative Biology of the Cell (I2BC), 91198 Gif-sur-Yvette,
France, 2 Univ Lyon, Université Claude Bernard Lyon 1, CNRS, INRAE, VetAgro Sup, UMR Ecologie Microbienne,
F-69622 Villeurbanne, France, 3 Synchrotron SOLEIL, L’Orme des Merisiers, Saint-Aubin, 91192 Gif-sur-Yvette,
France and 4 Sorbonne Université, Laboratoire Physico Chimie Curie, Institut Curie, PSL Research University, CNRS
UMR168, 26 rue d’Ulm, 75005 Paris, France

Received July 05, 2020; Revised November 12, 2020; Editorial Decision November 18, 2020; Accepted November 24, 2020

ABSTRACT                                                                              present in the effector domain has both a structural
                                                                                      and regulatory role. Overall, our work shed light on
A species-specific region, denoted SpG8-1b allowing
                                                                                      the allosteric mechanism of transcription employed
hydroxycinnamic acids (HCAs) degradation is impor-
                                                                                      by this GntR repressor.
tant for the transition between the two lifestyles (rhi-
zospheric versus pathogenic) of the plant pathogen
Agrobacterium fabrum. Indeed, HCAs can be ei-                                         INTRODUCTION
ther used as trophic resources and/or as induced-
                                                                                      Agrobacterium fabrum has two lifestyles: it can interact with
virulence molecules. The SpG8-1b region is reg-                                       a large variety of plants as a rhizosphere inhabitant or as a
ulated by two transcriptional regulators, namely,                                     pathogen when it harbors a tumor-inducing plasmid (which
HcaR (Atu1422) and Atu1419. In contrast to HcaR,                                      is a virulence plasmid), and transfers a portion of this to
Atu1419 remains so far uncharacterized. The high-                                     the plant cells upon infection, resulting in the crown-gall
resolution crystal structures of two fortuitous citrate                               disease (1–3). A. fabrum possesses a species-specific region,
complexes, two DNA complexes and the apoform                                          denoted SpG8-1b (a region present in strains of this species
revealed that the tetrameric Atu1419 transcriptional                                  but absent from other Agrobacterium species), located in
regulator belongs to the VanR group of Pfam PF07729                                   the circular chromosome and responsible for hydroxycin-
subfamily of the large GntR superfamily. Until now,                                   namic acids (HCAs) degradation such as ferulic acid, caf-
GntR regulators were described as dimers. Here, we                                    feic acid and p-coumaric acid (4,5) (Figure 1). These latter
                                                                                      compounds are common plant secondary metabolites being
showed that Atu1419 represses three genes of the
                                                                                      precursors of lignin incorporated into plant cell walls. They
HCAs catabolic pathway. We characterized both the                                     are abundantly released in soil during the decay of root cells
effector and DNA binding sites and identified key nu-                                 and are significant environmental molecules for soil- and
cleotides in the target palindrome. From promoter                                     plant-interacting bacteria (6). Although HCAs are gener-
activity measurement using defective gene mutants,                                    ally a strong bacterial repellent, they appear to be chemoat-
structural analysis and gel-shift assays, we pro-                                     tractants in the case of rhizobia and agrobacteria for which
pose N5,N10-methylenetetrahydrofolate as the effec-                                   they can be used as trophic resources and/or induced-
tor molecule, which is not a direct product/substrate                                 virulence molecules (7–11). We have previously showed that
of the HCA degradation pathway. The Zn2+ ion                                          HCAs degradation via the SpG8-1b region interferes with
                                                                                      virulence gene expression suggesting that this metabolic

* To
   whom correspondence should be addressed. Tel: +33 169824213; Email: solange.morera@i2bc.paris-saclay.fr
Correspondence may also be addressed to Céline Lavire. Tel: +33 426237126; Email: celine.lavire@univ-lyon1.fr
†
 The authors wish it to be known that, in their opinion, the first two authors should be regarded as Joint First Authors.
Present address: Anaı̈s Naretto, Department of Biochemistry, Vanderbilt University, Nashville, TN 37235, USA.


C The Author(s) 2020. Published by Oxford University Press on behalf of Nucleic Acids Research.
This is an Open Access article distributed under the terms of the Creative Commons Attribution License (http://creativecommons.org/licenses/by/4.0/), which
permits unrestricted reuse, distribution, and reproduction in any medium, provided the original work is properly cited.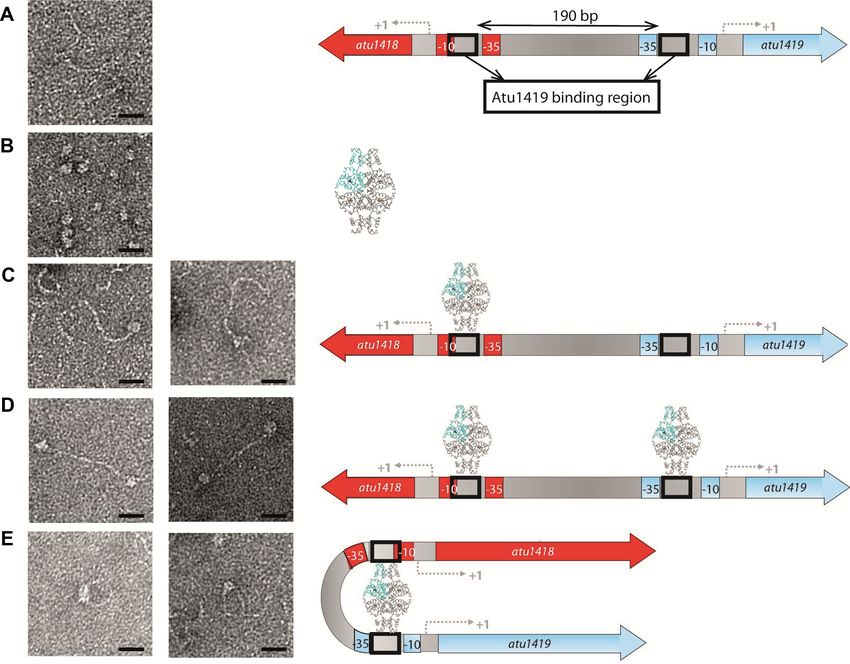
530 Nucleic Acids Research, 2021, Vol. 49, No. 1
Downloaded from https://academic.oup.com/nar/article/49/1/529/6031445 by guest on 13 December 2021
Figure 1. (A) Ferulic acid degradation pathway: a coenzyme A is added to ferulic acid by Atu1416, a feruloyl-CoA synthase. Feruloyl-CoA is then converted
by Atu1417, an enoyl-CoA hydratase, into 4-hydroxy-3-methoxyphenyl--hydroxypropionyl (HMPHP)-CoA, which is in turn transformed into vanillic
acid by Atu1415, a phenylhydroxypropionyl-CoA dehydrogenase, and then Atu1421, a 4-hydroxy-3-methoxyphenyl--ketopropionyl-CoA (HMPKP)-
CoA -keto-thiolase. The O-demethylase Atu1420 degrades vanillic acid into protocatechuic acid using tetrahydrofolate (H4F) as a cofactor and produces
N5-methyl-tetrahydrofolate (MH4F). Protocatechuic acid enters the cycle of Krebs. Atu1418 enzyme was proposed to be involved in the recycling of H4F
from transformation of MH4F into MEF, a compound that can be enzymatically or spontaneously converted to H4F (18,50). Dashed arrows indicated
putative reactions based on sequence similarities and references (4,18,44,50). (B) Organization of the SpG8–1b region for which genes expression is regulated
by the two transcriptional factors HcaR and Atu1419 (their genes are framed in red). Promoters are shown with small arrows in black for HcaR dependent-
transcription and in blue for putative Atu1419 dependent-transcription indicating the direction of gene transcription.
pathway is important for the transition between the two Although the SpG8-1b genomic region degrades both
lifestyles (rhizospheric versus pathogenic) of Agrobacterium ferulic and p-coumaric acids, this latter induces the gene ex-
(11). Such a transition requires fine-tuning of the regulation pression of the first part of the SpG8-1b region while fer-
of gene expression to express the appropriate genes at the ulic acid induces that of the whole pathway (11). There-
right time (12–14). fore, two expression units are differently regulated suggest-
The SpG8-1b genomic region encodes six enzymes ing the existence of two regulators. These regulators are
(Figure 1A). Five of them operate in this sequen- Atu1419 (predicted to be a GntR member) and Atu1422 de-
tial order for the degradation of ferulic acid leading noted HcaR (for hydroxycinnamic acid catabolic repressor
to different intermediates (5): Atu1416 (a feruloyl-CoA belonging to the MarR family), respectively (4,11) (Figure
synthase), Atu1417 (an enoyl-CoA hydratase), Atu1415 1B). HcaR is the repressor of its own transcription and that
(a phenylhydroxypropionyl-CoA dehydrogenase), Atu1421 of the first atu1416 and atu1417 genes of HCA degradation
(a 4-hydroxy-3-methoxyphenyl--ketopropionyl-CoA - pathway (11). However, because atu1415 and atu1416 be-
keto-thiolase) and Atu1420 (a tetrahydrofolate-dependent long to the same transcription unit as well as atu1421 and
vanillate O-demethylase). Atu1420 shares 56% sequence hcaR do, HcaR also regulates atu1415 and atu1421 genes
identity with Sphingomonas paucimobilis and Sphingob- expression, completing the regulation of five genes (Figure
ium sp. SYK-6 homologues of known structures (PDB 1B). In contrast to HcaR, the second regulatory protein
5TL4 (15) and PDB 5X1I (16), respectively). This en- Atu1419 likely involved in the second part of the pathway
zyme degrades vanillic acid into protocatechuic acid us- corresponding to the vanillate degradation remains unchar-
ing the tetrahydrofolate (H4F) cofactor and producing the acterized so far.
N5-methyl-tetrahydrofolate compound (MH4F) (5). Pro- Herein, we investigated the molecular role and struc-
tocatechuic acid is then processed by pca genes to pro- tural aspects of Atu1419 combining in vitro and in vivo ap-
duce intermediates of the tricarboxylic acid (TCA) cycle proaches. We first proved that Atu1419 was a transcription
(17). Based on sequence identity of 29% with the N5,N10- repressor of three genes of the second part of the HCA
methylene tetrahydrofolate reductase MetF of Sphingob- degradation pathway. None of HCA degradation interme-
ium sp. SYK-6, Atu1418 the sixth enzyme of the SpG8- diates could release Atu1419 from DNA binding. Nonethe-
1b genomic region, is likely a 5,10-methylene tetrahydro- less, structural analysis of five high-resolution crystal struc-
folate reductase which transforms MH4F into N5,N10- tures of Atu1419 in apoform, in complex with a fortu-
methylenetetrahydrofolate (MEF), which would, in turn, al- itous citrate molecule bound to the effector domain orig-
low the regeneration of H4F (4,18) (Figure 1A). inated from the crystallization condition (two structures),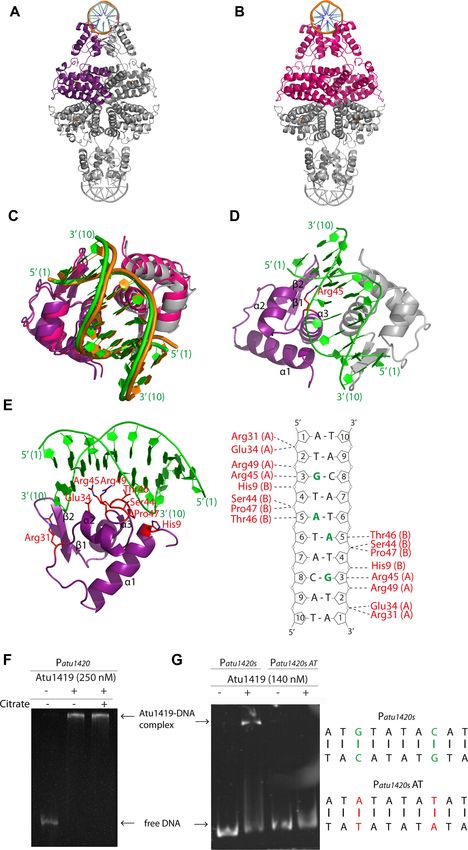
Nucleic Acids Research, 2021, Vol. 49, No. 1 531
in complex with DNA and in complex with both DNA were generated as described (11) (Supplementary Table S2
and citrate, helped us infer a possible effector molecule, for specific primers). Reporter constructions were intro-
which was confirmed by gel-shift assays and microcalorime- duced into A. fabrum C58 wild-type and derivatives by
try. The structures revealed Atu1419 to be a member of electroporation, and gentamycin-resistant colonies were se-
the VanR group of the FadR C-terminal domain (FCD; lected.
Pfam PF07729) subfamily of the large GntR superfam-
ily of transcriptional factors (>93 135 members in Pfam
Measurement of promoter activity
database) (19–22). The FCD subfamily encompasses two
groups of regulators namely FadR and VanR. So far, the Genes expression was measured after 24 h in A. fabrum with
dimeric FadR from Escherichia coli was the best character- a pOT1e plasmid harboring an eGFP transcriptional fu-
ized of the FadR group of FCD-GntR regulators shown to sion (24) as described (11). Results were normalized by di-
be regulated by the acyl-CoA effector and able to bind spe- viding the fluorescence level by the optical density at 600
cific palindromic DNA through a winged Helix-Turn-Helix nm values. At least five technical replicates and two biolog-
Downloaded from https://academic.oup.com/nar/article/49/1/529/6031445 by guest on 13 December 2021
(wHTH) motif (23). Like FadR, Atu1419 possesses a char- ical replicates were performed for each condition. Differ-
acteristic molecular architecture, composed of a conserved ences between conditions were determined with Tukey test
N-terminal DNA binding domain containing the wHTH (P-value = 0.05).
motif and a C-terminal effector binding/oligomerization
domain. Unlike FadR, this latter domain of Atu1419 dis-
Oligonucleotides and DNA preparation
plays six helices instead of seven observed in members of
the FadR group. Atu1419 is the first example of a tran- The synthetic palindromic oligodeoxyribonucleotide 5 -
scriptional regulator of the whole GntR superfamily to be ATGTATACAT-3 was purchased from Sigma-Aldrich
tetrameric. Our work brings new insights into mechanistic (Darmstadt, Germany). Oligonucleotide solution in sterile
aspects of such repressor, which uses an induced-allosteric water at 2 mM was hybridized by heating to 90◦ C for 5 min
mechanism for DNA release upon effector binding. and cooling in the crystallization room at 18◦ C overnight to
produce a 10-mer DNA.
MATERIALS AND METHODS The atu1420 promoter regions were amplified with spe-
cific primer pairs listed in Supplementary Table S2. The
Bacterial strains and growth conditions atu1416–1417, atu1418–1419, virB and hcaR promoter re-
The bacteria and plasmids used for this study are listed in gions were prepared as previously described (11) and pu-
Supplementary Table S1. Escherichia coli were grown rou- rified with a PCR Clean-up kit (Macherey-Nagel, Düren,
tinely, with shaking (150 rpm), at 37◦ C in LB medium. Germany).
Growth media were supplemented with appropriate antibi-
otics (tetracycline, 10 g/ml; gentamicin, 15 g/ml; ampi- Cloning, expression and purification of Atu1419 and
cillin, 100 g/ml) when necessary. The A. fabrum strains Atu1419-H3A mutant
were grown with shaking (160 rpm), at 28◦ C in YPG (Yeast
Peptone Glucose)-rich medium or in AT minimal medium Coding sequences for Atu1419 was amplified by PCR
supplemented with 10 mM succinate and 10 mM ammo- adding a C-terminal 6-Histidine tag and using atu1419F
nium sulfate. AT minimal medium was supplemented with and atu1419R primers and was inserted into the NdeI/XhoI
750 M of ferulic acid or citrate and with the appropriate restriction sites of the pET-20b vector (Novagen, Merck
antibiotic (gentamicin, 10 g/ml). Ferulic acid and MH4F Biosciences, France). The nucleotide sequence was con-
were obtained from Sigma Aldrich (St. Louis, USA) and firmed by DNA-sequence analysis (GATC Biotech, Mul-
MEF from Merck Company (Switzerland). house, France). E. coli BL21 competent cells transformed
with pET-20b-Atu1419 were grown in LB media until
OD600 of 0.8 and protein production was induced by 0.5
Construction of the deletion mutant C58atu1419 and tran-
mM isopropyl -D-thio-galactopyranoside (IPTG) for 3 h
scriptional fusions
at 37◦ C. Cells were centrifuged at 4000 g for 15 min at 4◦ C,
The C58atu1419 and C58atu1420 strains were con- resuspended in a buffer of 50 mM Tris–HCl pH 8, 300 mM
structed according to a strategy as described (4,11). Vectors NaCl and 20 mM imidazole and disrupted by sonication.
containing the recombinant region (amplified by PCR with After centrifugation at 25 000 g for 30 min at 4◦ C, the fil-
specific primers listed in Supplementary Table S2), flank- trated supernatant was loaded onto a 5 ml His-Trap HP
ing downstream and upstream of the atu1419 or atu1420 column (GE Healthcare, Chicago, IL, USA). After a wash-
genes, were introduced into A. fabrum C58 by electropo- ing step of 6% with 50 mM Tris–HCl pH 8, 300 mM NaCl
ration. Single-crossover integration was selected by gen- and 300 mM imidazole (Buffer B), protein elution was per-
tamycin resistance on YPG medium plates. Gentamycin- formed with Buffer B. Protein fractions were loaded onto
resistant colonies were spread on YPG plates containing 5% a gel filtration column (HiLoad 26/60 Superdex 200 prep
of sucrose to obtain plasmid excision and double-crossover grade, GE Healthcare) equilibrated with 50 mM Tris–HCl
events leading to nonpolar mutants. atu1419 and atu1420 pH 8 and 150 mM NaCl. The protein fractions were pooled,
deletions were confirmed by PCR analysis and DNA se- concentrated and stored at −80◦ C.
quencing (GenoScreen, Lille, France). The synthetic gene (Genscript, Piscataway, NJ, USA)
pOT1e (24) transcriptional fusions of the promoter re- coding for Atu1419 mutant (H192A, H141A and H214A)
gions of SpG8-1b genes, namely Patu1419 and Patu1420 namely Atu1419-H3A was inserted into pET-20b. The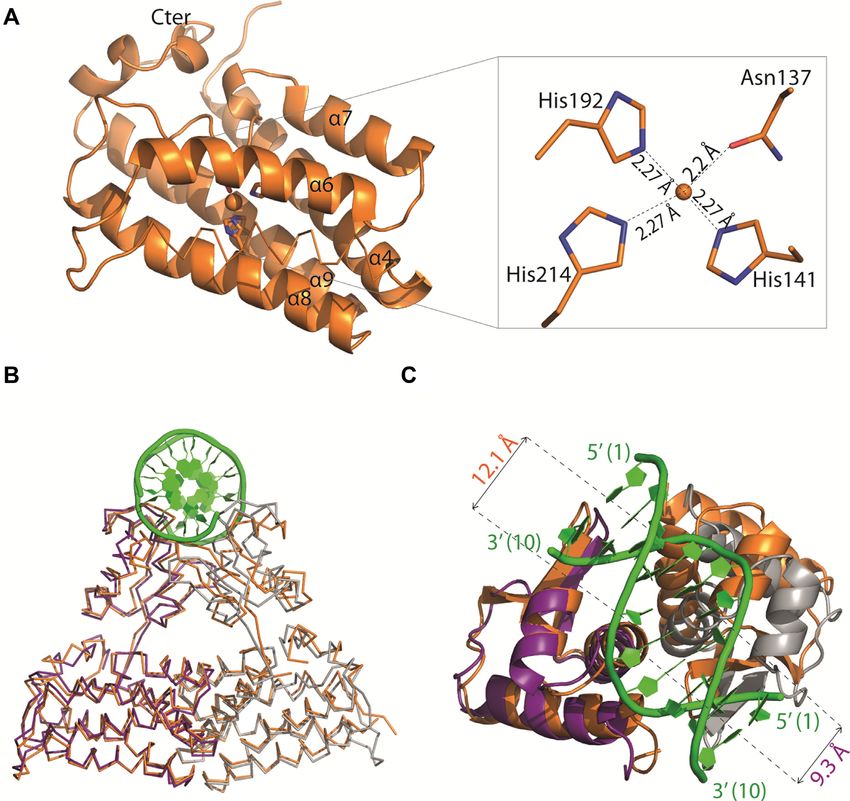
532 Nucleic Acids Research, 2021, Vol. 49, No. 1
Atu1419-H3A mutant was expressed and purified as the in crystals was found thanks to an X-ray fluorescence emis-
wild-type protein described above. sion scan on the beamline. The steps of zinc ion substruc-
ture determination, phases calculation and density modi-
Size exclusion chromatography (SEC) and SEC-MALS. fication were performed using CRANK from CCP4 (Col-
For size exclusion chromatography (SEC) and SEC coupled laborative Computational Project, Number 4) and a par-
to multi-angle light scattering (SEC-MALS) analyses, apo tial model was built using BUCCANEER (CCP4). This
Atu1419 was prepared at 25 M and Atu1419 in complex model was then used to calculate the phases of a higher
with the palindromic DNA was prepared with a ratio pro- resolution dataset at 2 Å resolution leading to the com-
tein:DNA of 1:2 in a buffer containing 50 mM Tris pH 8 plete polypeptide chain model. A tetramer is present in the
and 150 mM NaCl. The same buffer was used as the mo- asymmetric unit. Other structure determinations were per-
bile phase for SEC using a Superdex 200 10/300 GL col- formed by molecular replacement with PHASER (26) us-
umn on an AKTA FPLC system (GE Healthcare) and on a ing the first refined structure of Atu1419 (monomer, dimer
Shimadzu HPLC. Multiangle light scattering was detected or tetramer). Because of the anisotropy of the diffrac-
Downloaded from https://academic.oup.com/nar/article/49/1/529/6031445 by guest on 13 December 2021
with a MiniDAWN TREOS light scattering module and a tion of Atu1419–DNA complex in P64 22 crystals and apo
refractometer Optilab T-rEX (Wyatt Technology). Atu1419, the DEBYE and STARANISO programs devel-
oped by Global phasing Ltd were applied to the data scaled
with XDS using the STARANISO server (http://staraniso.
Electrophoretic mobility shift assay (EMSA)/Gel-shift assay globalphasing.or/). These programs perform an anisotropic
cut-off of merge intensity data on the basis of an analy-
Atu1419 or Atu1419-H3A mutant were mixed with dif- sis of local I/(I), compute Bayesian estimates of struc-
ferent promoter regions (Patu1416–1417, Patu1418–1419, tures amplitudes, taking into account their anisotropic fall-
PhcaR, Patu1420 and PvirB) and with variants of the off, and apply an anisotropic correction to the data. The
atu1418–1419 and atu1420 regions. The intergenic regions corrected anisotropic amplitudes were used for further re-
of virB was used as a nonspecific control probe. Gel- finement. Refinement of each structure was performed with
shift assays/EMSA were performed in 10 l reaction mix- BUSTER-2.10 (27) employing TLS groups and NCS re-
ture containing 30 nM of DNA probe without and with straints. Inspection of the density maps and manual rebuild-
Atu1419 at different concentrations in 50 mM Tris–HCl ing were performed using COOT (28). Refinement details of
pH 8 and 150 mM NaCl. 50 to 300 M of MEF, MH4F, each structure are shown in Table 1. Molecular graphics im-
H4F or citrate were added for testing their influence on ages were generated using PyMOL (http://www.pymol.org).
Atu1419–DNA complex formation. After incubation for
30 min at room temperature, the samples were separated
by electrophoresis in TBE buffer (45 mM Tris–HCl pH 8, Circular dichroism experiments (CD)
45 mM boric acid and 1 mM EDTA) on non-denaturing Circular dichroı̈sm in the far-UV region was performed us-
6% or 12% polyacrylamide gels at 150 V and 4◦ C for ing a spectropolarimeter (Jasco J-810, Jasco, Lisses, France)
2 h. Gels were then stained with either SYBR® Green equipped with a water-cooled Peltier unit (Jasco circular
EMSA nucleic acid gel stain (Invitrogen, Carlsbad, CA, dichroı̈sm spectrometer model J810). Apo Atu1419 and
USA) or ethidium bromide for 20 min. DNA was vi- Atu1419-H3A mutant were both concentrated at 25 M
sualized under UV light (Fisher Bioblock Scientific, Il- in 50 mM Tris pH 8 and 150 mM NaCl. Spectra were
lkirch, France or UVP BioDoc-it2 Imager, Analytic Jena, recorded in a cell width of 0.1 mm path length (121.QS,
Germany). Hellma, Hellma Analytics, Müllheim, Baden Württemberg,
Germany) from 190 to 240 nm at 20◦ C. Five consecutive
scans from each sample were merged to produce an av-
Crystallization and structure determination of Atu1419
eraged spectrum; the spectra were corrected using buffer
Crystallization conditions are summarized in Table 1. For baselines measured under the same conditions. Data were
all protein samples (140 M tetrameric protein alone or recorded in mdeg and converted using the mean residues
in complex with 700 M palindromic DNA), conditions ellipticity method (deg cm2 mol−1 ). Secondary structure
were screened using QIAGEN kits (Valencia, CA, USA) estimates were derived from the normalized spectra using
with a Mosquito nanodrop robot (TTP Labtech, Melbourn, the CDSSTR, SELCON3, CONTIN of the DICHROWEB
Great Britain) and were manually optimized at 20◦ C in server (29,30).
hanging drop by mixing equal volumes of the protein or
protein–DNA solution with precipitant solution. Crystals
Differential scanning calorimetry (auto PEAQ DSC)
were transferred to a cryoprotectant solution (paraffin oil or
mother liquor supplemented with 20% PEG 400) and flash- Thermal stability of 10 M apo Atu1419, 10 M Atu1419
frozen in liquid nitrogen. Diffraction data were collected at in the presence of 100 M MEF and 20 M Atu1419-H3A
100 K on PROXIMA 1 and PROXIMA 2 beamlines at syn- mutant was performed by DSC on an auto PEAQ DSC
chrotron SOLEIL (Saint-Aubin, France). Intensities were (Malvern, France) in a standard buffer. Each measurement
integrated using the XDS package (25) (Table 1). was preceded by a baseline scan with the standard buffer.
The first structure of Atu1419 in P21 21 21 space group Scans were performed at 1 K min−1 between 20 and 90◦ C.
was determined at 2.35 Å resolution by single-wavelength The heat capacity of the buffer was subtracted from that of
anomalous dispersion (SAD) method at the peak absorp- the protein sample before analysis. Thermodynamic param-
tion energy of Zinc (Table 1). The presence of a zinc metal eters were determined by fitting the data to the following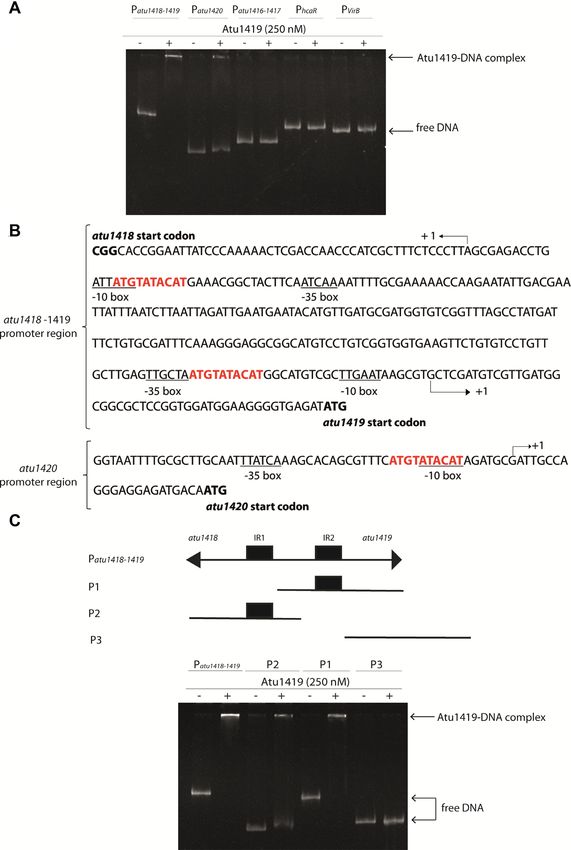
Nucleic Acids Research, 2021, Vol. 49, No. 1 533
Table 1. Crystallographic data and refinement parameters
Zn2+ SAD Atu1419 citrate Atu1419 citrate Atu1419-DNA# Atu1419-DNA§ Apo Atu1419†
PDB code 6Z74 6ZA0 6ZAB 6ZA3 6ZA7
Wavelength (Å) 1.282290 0.97541 0.978570 1 1 0.97934
Crystallization 5% PEG 4K, 0.2 M 5% PEG 4K, 0.2 M 5% PEG 4K, 0.2 M 10% Terbutanol, 0.1 25% PEG 400, 0.1 12% PEG 4K, 0.2
conditions AS, 0.1 M AS, 0.1 M AS, 0.1 M M Na-citrate pH M MES pH 6.7, 0.2 Ammonium sulfate,
Na-citrate pH 5.6 Na-citrate pH 5.6 Na-citrate pH 5.6 5.6, 2 mM MgCl2 M Na-acetate 0.1 M Tris/HCl pH
8.5
Za 4 4 2 1 2 4
Space group Cell P21 21 21 P21 21 21 P21 21 2 P64 22 C2221 P21
parameters (Å,◦ ) a = 77.4 a = 77.2 a = 72.2 a = 179.5 a = 62.4 a = 52.1
b = 114,1 b = 113.7 b = 145.6 b = 179.2 b = 112.4 b = 79.0
c = 130.5 c = 130.5 c = 41.2 c = 96.8 c = 179.6 c = 140.6
 = 95.1
Downloaded from https://academic.oup.com/nar/article/49/1/529/6031445 by guest on 13 December 2021
Resolution (Å) 49.8–2.35 45.6–2 (2.12–2) 24.0–1.65 45.61–2.8 (2.87–2.8) 47.64–2.0 (2.05–2.0) 43.38–2.34
(2.42–2.35) (1.69–1.65) (2.41–2.34)
No. of observed 518 098 (29677) 467 551 (72154) 239 555 (17376) 444 041 (30119) 376 669 (23170) 504 810 (31752)
reflections
No. of unique 48 018 (3262) 78 344 (12280) 51 917 (3674) 23 089 (1642) 43 067 (3095) 47 943 (3255)
reflections
Completeness (%) 99.4 (92.1) 99.6 (98.1) 97.9 (95.8) 99.7 (88.4) 99.9 (99.1) 99.4 (92.3)
Completeness 68.7 (11.9) 97.7 (79.3) 71.5 (30.6)
staraniso (%)
Rsym (%) 8.8 (78.6) 12 (155.5) 8.1 (127.3) 11.6 (236.4) 8.6 (190.3) 10.9 (128.8)
Rpim (%) 2.8 (26.6) 5.4 (78.1) 4.2 (64.4) 2.7 (57.7) 3.1 (79.3) 3.5 (41.5)
I/(I) 18 (2.3) 10 (1.12) 10.7 (1.1) 18.8 (1.1) 13.7 (0.9) 13.0 (1.4)
CC1/2 0.999 (0.809) 0.998 (0.582) 0.999 (0.461) 0.999 (0.469) 0.999 (0.421) 0.999 (0.696)
Rcryst (%) 19.1 16.9 18.8 19.2 19.4
Rfree (%) 21.4 18.9 19.9 22.8 22.2
rms bond deviation 0.01 0.001 0.009 0.01 0.009
(Å)
rms angle deviation 0.99 0.95 1 1 1.02
(◦ )
Average B (Å2 )
Protein A/B/C/D 42/53.1/60/57.5 27.9/29.2 86.4 50.7/50.1 66.2/74.3/73.2/80.8
Zn2+ 35/41.4/39.7/45.2 18.3/18.6 106.9 43.3/46.2 46.2/63.2/69.3/66.6
Citrate 44.4/45.2/44.5/45.7 23.1/22 127.9
DNA 65.3 60.2
Solvent 50.5 36.7 56.3 48.0 50.0
a
Clashscore 4.56 1.6 3.2 2.11 2.88
MolProbity score 1.51 0.93 2.07 1.24 1.38
a
Ramachandran
plot (%)
Favoured 99.36 98.73 94.94 98.73 98.2
Outliers 0 0 0 0 0.21
Values for the highest resolution shell are in parentheses. CC1/2 = percentage of correlation between intensities from random hall-dataset.
a
Calculated with MolProbity.
Numbers in italic account for statistical values after ellipsoidal mask application by Staraniso.
#A dataset collected from a crystal, which diffracted anisotropically to 3.4 Å along b* and 0.894a* – 0.447b* and 2.7 Å along c*.
†Two datasets collected from a crystal, which diffracted anisotropically to 3.2 Å along 0.81a* – 0.58c*, 2.3 Å along b* and 2.2 Å along c*.
§One dataset collected from a crystal, which diffracted anisotropically to 2.02 Å along a*, 1.99 Å along b* and 1.95 Å along c*.
equation: tion in the microcalorimeter cell (0.2 ml) was 100 M.
Nineteen injections of 2 l MEF solution at 1.2 mM
K d (T) H cal H v H
C p (T) = were performed at intervals of 180 s while stirring at
[1 + K d (T)]2 RT 2 500 rpm. The experimental data were fitted to theoreti-
where Kd is the equilibrium constant for a two-state cal titration curves with software supplied by MicroCal
process, HvH is the enthalpy calculated on the ba- (ORIGIN®).
sis of a two-state process and Hcal is the measured
enthalpy. Electron microscopy
Atu1419 (150 nM) was incubated with equimolar
Isothermal titration microcalorimetry measurements (ITC)
Patu1418–1419 region (370 bp containing two palindromes
Isothermal titration microcalorimetry experiments were separated by 190 bp) for 10 min at room temperature
performed with an ITC200 isothermal titration calorime- in a buffer containing 50 mM Tris pH 8 and 150 mM
ter from MicroCal (Malvern, Orsay, France). The ex- NaCl. Samples were deposited on a glow-discharged
periments were carried out at 20◦ C. Protein concentra- carbon coated grid and stained with 2% uranyl acetate.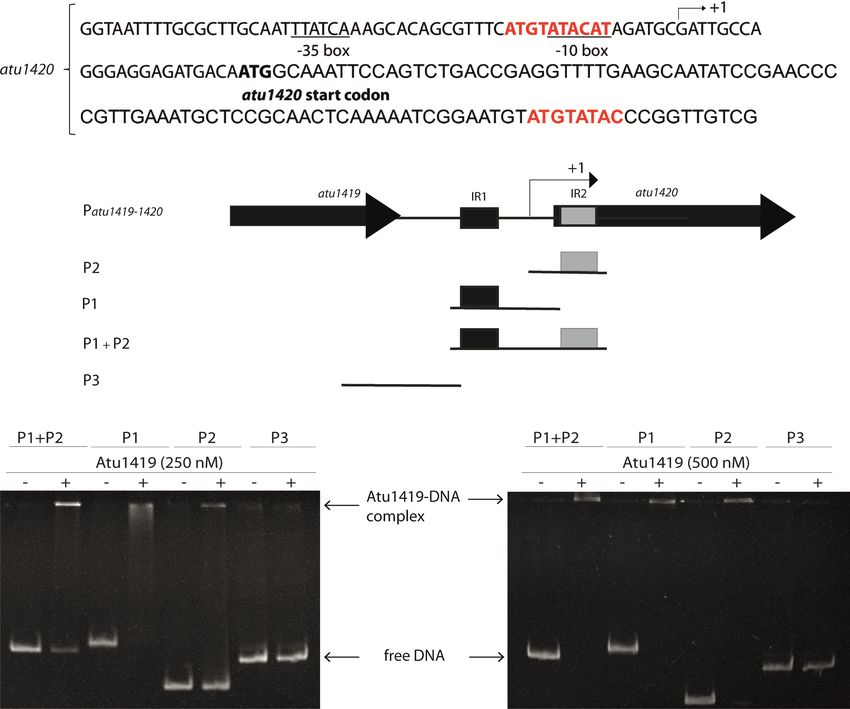
534 Nucleic Acids Research, 2021, Vol. 49, No. 1
Images were recorded with a Lab6 Tecnai Spirit operat- Table 2. SpG8 1-b genes expression in the wild-type (WT) and
ing at 80 kVolt and a Quemesa Olympus CCD camera. C58atu1419 strains. Values refer to fold change at 24 h obtained by com-
Nominal magnification was X 45 000 corresponding parison of genes expression in the WT C58 strain with and without 750 M
of ferulic acid and correspond to the mean of three biological replicates
to 3.17 Å/pixel.
with at least six technical replicates. Fold change at 24 h without ferulic
acid was obtained by comparison of genes expression in the C58atu1419
RESULTS AND DISCUSSION and the WT strains and corresponds to the mean of at least two biological
replicates and six technical replicates. Empty pOT1e corresponds to plas-
The transcriptional regulator Atu1419 is the second repressor mid without any promoting region before the egfp gene in order to measure
of the HCAs degradation pathway basal expression of the system
To study the role of Atu1419 in transcriptional regula- Fold change C58 WT in the Fold change
tion of the HCAs degradation genes, we constructed re- presence/in the absence of C58atu1419/WT in the
porter fusions with pOT1e plasmids containing each pro- Genes ferulic acid absence of ferulic acid
moter region of the SpG8-1b region (Figure 1) cloned up- Patu1416 2.53 ± 0.2 0.63 ± 0.08
Downloaded from https://academic.oup.com/nar/article/49/1/529/6031445 by guest on 13 December 2021
stream the egfp gene. This allowed reporting the transcrip- Patu1418 1.44 ± 0.19 3.67 ± 0.14
tion of each gene by measuring the eGFP fluorescence. The Patu1419 1.81 ± 0.13 3.92 ± 0.12
atu1419 and atu1420 plasmid reporter gene fusions were Patu1420 3.31 ± 0.32 1.58 ± 0.26
Empty 1.12 ± 0.11 0.97 ± 0.05
constructed in this study. Those corresponding to atu1416 pOT1e
and atu1418 were already available (11). The plasmid re-
porter fusions were introduced into the wild-type A. fab-
rum C58 strain to evaluate gene expression in response to
palindromic sequence overlaps the -10 box regulatory ele-
ferulic acid. Compared to the fluorescence level measured
ment of atu1418 and atu1420, whereas in the atu1418–1419
in the absence of ferulic acid, the fluorescence level mea-
promoter sequence, an additional palindromic sequence is
sured in the presence of ferulic acid was higher for the
found between the –10 and the –35 regulatory elements
four reporter fusions (Table 2). Hence, atu1416, atu1418,
of the atu1419 (Figure 2B). Using electrophoretic mobil-
atu1419 and atu1420 genes were induced in the presence of
ity shift assay (EMSA), we showed that Atu1419 was able
ferulic acid. The four plasmid reporter fusions were also in-
to bind each palindrome of the atu1418–1419 promoter se-
troduced into the C58atu1419 mutant strain to compare
quence without the presence of the other palindrome mean-
genes expression with that of the wild-type C58 strain in
ing that only one palindrome site was required for binding
the absence of ferulic acid. The fluorescence level measured
(Figure 2C). Nonetheless, the intensity of the shifted bands
after 24 hours for atu1418, atu1419 and atu1420 reporter
was greater for the DNA fragment containing both palin-
fusions were respectively 3.67, 3.92 and 1.58 times higher in
dromes (Figure 2C). We also analyzed the quaternary struc-
the C58atu1419 mutant strain than in the wild-type strain
ture of Atu1419 in complex with the 10-bp palindrome us-
(Table 2). Thus, in the strain lacking Atu1419 regulatory
ing gel filtration/SEC-MALS measurements (Supplemen-
protein (C58atu1419), the reporter fusions for atu1418,
tary Figure S1). Atu1419 was also tetrameric upon DNA
atu1419 and atu1420 genes were constitutively expressed.
binding.
In contrast, the fold change between C58atu1419 and the
wild type strains was 0.63 and 0.97 for the atu1416 gene
fusion and the empty pOT1e vector, respectively indicating Crystal structures of Atu1419 in complex with a fortuitous
that atu1416 gene expression was not repressed by Atu1419 ligand
(Table 2). These results showed that Atu1419 was a tran-
scriptional repressor that regulates atu1418, atu1420 and its We solved the first structure of Atu1419 from crystals grown
own transcription. in sodium citrate buffer using SAD method at the peak ab-
sorption energy of Zinc at 2 Å resolution in the space group
P21 21 21 (Table 1). The zinc ion comes from E. coli protein
DNA-binding targets
expression because no metal was added during protein pu-
To characterize the target DNA sequence of Atu1419, we rification and crystallization. Four molecules (A, B, C and
purified Atu1419 (theoretical molecular weight of ∼26 542 D) are present in the asymmetric unit and form a tetramer
Da for a monomer), which appeared as a tetramer in so- (a dimer of dimer) (Figure 3A), which is consistent with the
lution according to gel filtration/SEC-MALS chromatog- observation that Atu1419 is a tetramer in solution (Sup-
raphy (Supplementary Figure S1). Using the intergenic re- plementary Figure S1). Each monomer consists of an N-
gions (between 300 and 400-base pair (bp)) of atu1416– terminal DNA binding domain (residues 1–71) and a C-
1417, atu1418–1419, atu1420, hcaR and virB (negative con- terminal all ␣-helical effector binding domain (residues 76–
trol gene outside the SpG8-1b region) as DNA probes for 244) (Figure 3B). The DNA binding domain is composed of
binding assays (Figure 2A), we showed that Atu1419 bound three helices (␣1–␣3) with helix ␣2 and helix ␣3 forming the
to the atu1418–1419 and atu1420 promoter regions only, in helix-turn-helix motif and two anti-parallel -strands (1–
agreement with the gene expression data described above. 2) connected by a small loop designated as the wing motif.
In silico comparison of the promoter regions of atu1418– The secondary element with six helices (␣4–␣9) and topol-
1419 and atu1420 using the BPROM program (31) re- ogy of the C-terminal domain place Atu1419 in the VanR
vealed three 10-mer identical palindromic sequences (5 - group of the FCD subfamily of GntR transcriptional regu-
ATGTATACAT-3 ), two in atu1418–1419 promoter region lators. Approximately 2776 Å2 of accessible surface area is
and one in the atu1420 promoter region (Figure 2B). A buried upon dimerization for dimers AB or CD correspond-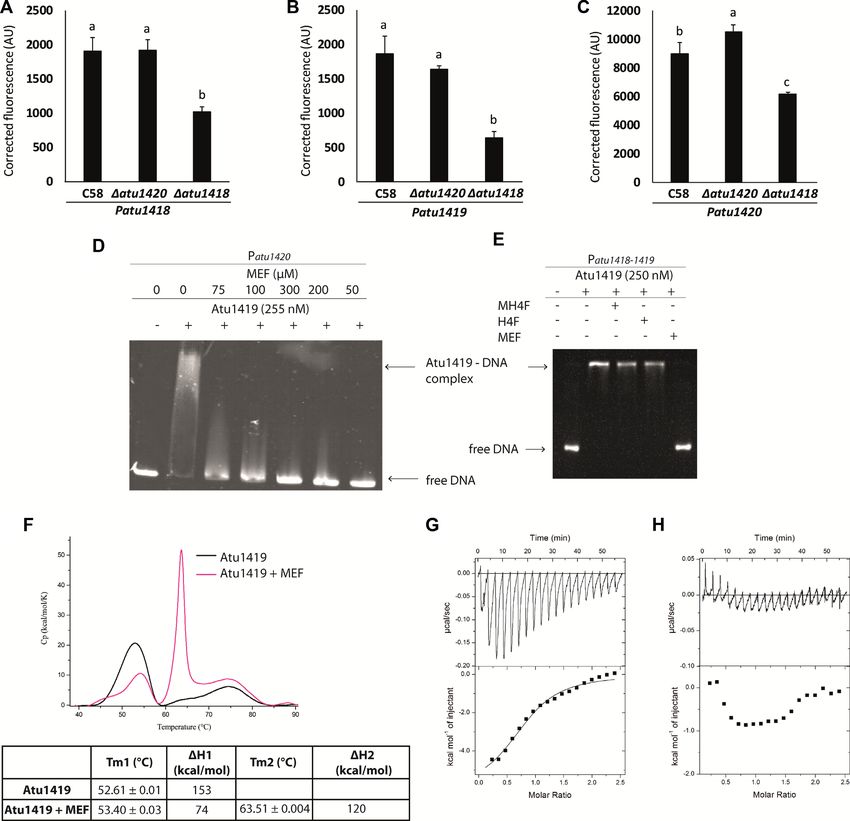
Nucleic Acids Research, 2021, Vol. 49, No. 1 535
Downloaded from https://academic.oup.com/nar/article/49/1/529/6031445 by guest on 13 December 2021
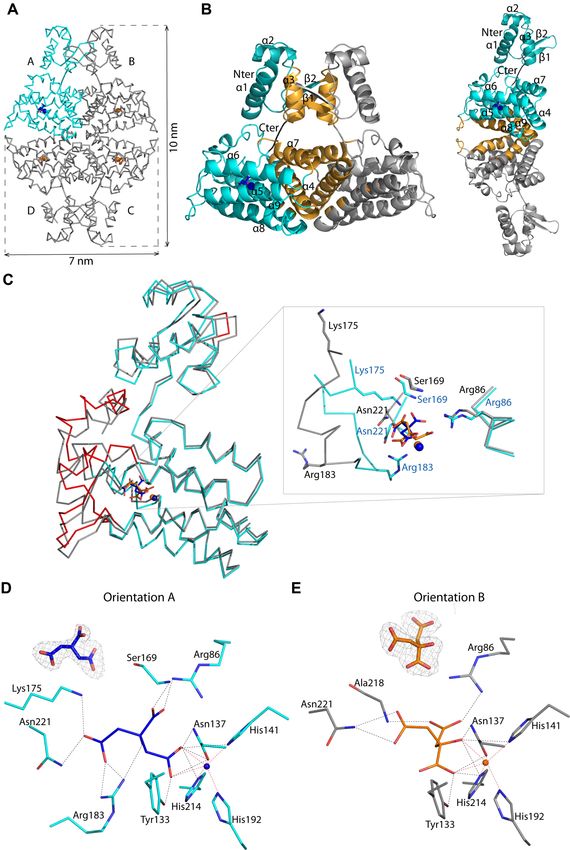
Figure 2. Atu1419 regulation mechanism. (A) EMSA analysis of 30 nM of each promoter region Patu1416–1417, Patu1418–1419, Patu1420, PhcaR
(atu1422) incubated without and with 250 nM tetrameric Atu1419 (ratio protein:DNA of 8.3). PvirB was used as a promoter region control. (B) In
silico analysis of the atu1418–1419 and atu1420 promoter regions performed with the BPROM program (31): –10 and –35 boxes are underlined, and the
palindromic sequences are shown in red. The transcription initiation sites are shown with an arrow and the translation start sites are indicated in bold.
Palindromic regions (IR1 and IR2) are separated by 190 bp in atu1418–1419 region. (C) EMSA analysis of 30 nM of three parts of the promoter region
of atu1418–1419 containing each one palindrome (P1 or P2) or none (P3) incubated without and with 250 nM tetrameric Atu1419 (ratio protein:DNA of
8.3).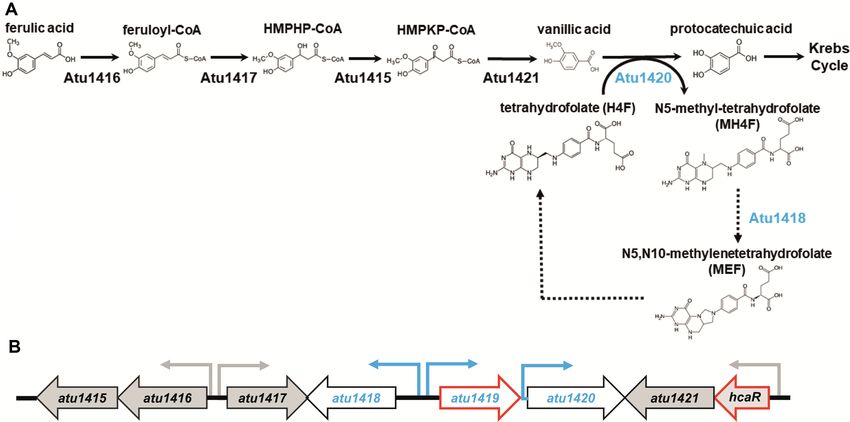
536 Nucleic Acids Research, 2021, Vol. 49, No. 1
Downloaded from https://academic.oup.com/nar/article/49/1/529/6031445 by guest on 13 December 2021
Figure 3. (A) Wire representation of Atu1419 tetramer in complex with a fortuitous citrate molecule and a co-purified Zn2+ ion, shown as sticks and ball,
respectively, bound to the effector binding domain in the structure at 2 Å resolution (molecule A is in cyan whereas molecules B/C/D in gray). (B) Left:
ribbon representation of dimer AB within the tetramer in (A). The secondary structural elements are indicated in subunit A and the orange elements form
the dimeric interface. The linker joining the N-terminal DNA binding domain and the C-terminal effector binding domain is shown in black. Right: ribbon
representation of dimer AD within the tetramer in (A). The secondary structural elements are indicated in subunit A and the orange elements form the
other dimeric interface (C) Superposition of the subunits A in cyan and B in gray of the tetramer in (A) (the subunits B–D adopt the same fold). The
red parts indicate major conformational changes between both subunits. A close-up view of the citrate and ion binding sites in the effector/metal binding
domain shown in blue and orange for subunits A and B, respectively. (D) Interactions between the bound citrate in orientation A and in blue/Zn2+ (blue
ball) and subunit A in cyan. Hydrogen bonds are shown as dashed lines in black (distance below 3.2 Å) and metal contacts are shown as dashed lines in red.
Residues involved in the interactions are labeled and shown as sticks. Citrate is shown in its Fo-Fc omit map contoured at 4 in subunit A. (E) Interactions
between the bound citrate in orientation B and in orange/Zn2+ (orange ball) and subunit B in gray. Hydrogen bonds are shown as dashed lines in black
(distance below 3.2 Å) and metal contacts are shown as dashed lines in red. Residues involved in the interactions are labeled and shown as sticks. Citrate
is shown in its Fo-Fc omit map contoured at 4 in subunit A.Nucleic Acids Research, 2021, Vol. 49, No. 1 537
ing to an average of 11.7% of the total surface area of each in the asymmetric unit and form a dimer, which in turn
monomer and 41 amino acids per monomer. The interface form a tetramer by the crystal symmetry with globally un-
between dimers AB and CD involves side chains of both do- changed dimer interfaces (1553 and 701 Å2 per subunit for
mains: helix ␣3 and strand 1 (residues 49–67) of the DNA dimers AB and AD, respectively) compared with those from
binding domain and the three helices ␣4 (residues 78–100), the P21 21 21 structure. They resemble subunits B/C/D of
␣7 (residues 150–163) and ␣9 (residues 208 and 212) of the the P21 21 21 structure and bind similarly a citrate molecule.
effector binding domain (Figure 3B). Arg72 in the linker Nonetheless, their citrates are slightly shifted by 0.6 Å to-
region participates to the dimer interface. Two salt bridges ward Arg86 losing the interaction with Asn221 compared
with Glu57-Arg63 (the prime refers to the second monomer with those in the P21 21 21 structure (Supplementary Figure
in the dimer), and two polar interactions Glu57-Ser53 S2).
and Asn62-Arg155 are located in the N-terminal domain
whereas fourteen H-bonds/salt-bridges including Asp81,
Crystal structures of Atu1419 in complex with the palin-
Glu84, Arg95, Arg100, Ser150, Arg155, Glu156, Glu208
dromic DNA
Downloaded from https://academic.oup.com/nar/article/49/1/529/6031445 by guest on 13 December 2021
and Arg212 belong to the C-terminal domain. The contacts
of dimer AD through eleven polar interactions/salt bridges The structures of two palindromic DNA-Atu1419 com-
bury 686 Å2 per subunit and concern 23 amino acids, plexes solved at 2.79 Å resolution (P64 22 space group)
which are located in the loop between helices ␣5–␣6 (mainly and 2.05 Å resolution (C2221 space group) present a dis-
residues 123–125), helices ␣8 (residues 183–194) and ␣9 tinct neighboring crystal packing with an asymmetric unit
(residues 203–216) (Figure 3B). The dimer BC displays a containing a monomer bound to a single DNA strand
smaller interface of 557 Å2 per subunit comprising 21 amino and a dimer bound to the 10-mer palindromic DNA, re-
acids and the same structural elements as for dimer AD. spectively (Table 1, Supplementary Figure S3). Nonethe-
The total surface contact area between two neighbouring less, a tetramer, where dimers AB and CD bind each to
subunits within the tetramer is characteristic of biological a DNA palindrome, was reconstituted by crystal symme-
interactions (32). tries (Figure 4A and B) in line with the conservation of
Remarkably, the four subunits within the tetramer are not Atu1419 tetramer in solution upon DNA binding. The
identical: molecule A shows large conformational changes three monomers of the asymmetric units (one in P64 22 and
as indicated by an average root mean square deviation two in C2221 ) are similar with an average RMSD value of
(RMSD) of 1.28 Å for all C␣ atoms compared with the sub- 1 Å for all C␣ atoms making almost identical interactions
units B/C/D, which are more similar (average RMSD of 0.7 with DNA, although the positions of the DNA binding do-
Å for all C␣ atoms). This is due to the presence of a citrate mains within the dimers between the two crystal structures
originated from the crystallization condition, which binds do not completely overlap (Figure 4C). This observation
molecule A in the effector binding site in a different orienta- explains the different crystal packing resulting of flexibil-
tion (orientation A; Figure 3C and D) than that for citrates ity from both the DNA ligand and the DNA binding do-
in subunits B/C/D (orientation B; Figure 3C and E), which mains of Atu1419. Each monomer recognizes a half-site
bind similarly (Figure 3C). Four loop regions (shown in red DNA with helices ␣2 and ␣3 of the HTH motif making nine
in Figure 3C), comprised of residues 64–67 of the wing be- polar interactions with both strands in the major groove of
tween 1 and 2 of the wHTH motif, residues 119–130 be- the DNA (Figure 4D and E). Helix ␣3 via Ser44, Thr46,
tween helices ␣5 and ␣6, residues 169–184 between helices Arg45 and Arg49 side chains is responsible for six hydrogen
␣7 and ␣8 and residues 225–244 corresponding to the end bonds with both strands, half with oxygens of phosphate
of the effector binding domain, can move between 3 and 10 groups 5 of guanine (G3) at position 3 on one strand and
Å. The loop region 169–184 can drastically rearrange upon of adenine (A5) at position 5 on the complementary strand.
ligand binding. In molecule A, the C␣ atoms of Ser169, The other half is made by the guanidinium group of Arg45,
Lys175 and Arg183 are respectively, 0.92, 6.84 and 7.34 which provides specific contacts with the N7 and O6 atoms
Å away from those in molecules B/C/D, allowing the side of G3 on one strand and by OG1 of Thr46 with the N7 of
chains of Lys175, Arg183 and the NH main chain of Ser169 A5 on the other strand (Figure 4C). The remaining H-bonds
to interact with the citrate molecule (Figure 3C and D). come from helix ␣2 via the Arg31 side chain and the main
These latter protein-citrate interactions cannot exist in sub- chain amino group of Glu34, and an additional interaction
units B/C/D. Nonetheless, all bound citrates share interac- is present with the main chain NH of His9 in helix ␣1. They
tions with Arg86, Tyr133, Asn137, His141, His214, Asn221 consist of phosphate contacts with A1 and T2 on one DNA
and a Zn2+ ion that co-purified with Atu1419 (Figure 3D strand and T4 on the other.
and E). Thirteen polar interactions are observed between All Atu1419-DNA subunits contain a bound Zn2+ ion
monomer A and the citrate molecule (orientation A), which at the same position as that observed in both Atu1419–
is buried within the monomer, leaving only 26.6 Å2 or 8.4% citrate complexes. In contrast to the protein-DNA complex
of the molecule surface exposed to solvent. In contrast, in C2221 space group, which crystallized in MES buffer,
there are only ten polar interactions between monomers the P64 22 protein–DNA complex reveals a bound citrate in
B/C/D and the citrate with a similar buried surface the effector binding pocket. This citrate adopts the orien-
area. tation B described in both Atu1419-citrate complexes, ex-
The orientation B of the citrate was also observed in an- cept for molecule A (orientation A) in the P21 21 21 struc-
other structure of Atu1419 solved at a higher resolution of ture. Because both tetrameric Atu1419-DNA structures are
1.75 Å but in a different space group (P21 21 2). Here, two similar, the presence of the bound citrate in orientation B
similar monomers (RMSD of 0.98 Å for all C␣ atoms) are in all subunits of one DNA complex has clearly no effect538 Nucleic Acids Research, 2021, Vol. 49, No. 1
Downloaded from https://academic.oup.com/nar/article/49/1/529/6031445 by guest on 13 December 2021
Figure 4. Cartoon representation of the tetrameric Atu1419-DNA complex (A) in the P64 22 structure with the monomer of the asymmetric unit shown in
purple. (B) in the P21 21 21 structure with the dimer of the asymmetric unit shown in magenta. (C) Superposition of the DNA binding domains of the dimers
AB of the P64 22 structure in purple and gray for subunits A and B, respectively and of the P21 21 21 structure in magenta. The palindromic 10-mer DNA
is in green and orange in the P64 22 and P21 21 21 structures, respectively. (D) View of the DNA binding domain of the dimer AB of the P64 22 structure
in purple and gray for subunits A and B, respectively bound to the palindromic 10-mer DNA shown in green. The secondary elements are indicated in
subunit A. Arg45 in helix ␣3 is the key residue, which interacts with the essential guanine base at position 3. This residue is shown as sticks. (E) View
showing a close-up of the Atu1419–DNA interface within a monomer and schematic diagram of Atu1419–DNA contacts. Nucleotide bases that interact
with Atu1419 are shown in green. (F) EMSA analysis of Patu1420 incubated without and with Atu1419, and with Atu1419 and 100 M citrate (ratio
tetrameric protein:DNA of 8.3). (G) EMSA analysis of Patu1420s containing a unique palindrome or Patu1420s AT, in which the palindrome was mutated
with the recognized guanine at position 3 replaced by an adenine and its cytosine partner replaced by a thymine, incubated without and with Atu1419
(ratio tetrameric protein:DNA of 4.6).Nucleic Acids Research, 2021, Vol. 49, No. 1 539
on Atu1419 for DNA binding and DNA release, in agree- complex. This suggests that this citrate may mimic a non-
ment with EMSA (Figure 4G) and promoter activity (Sup- productive-like binding in the effector binding site.
plementary Table S3).
We modified the specifically recognized guanine base G3
Comparison with other FCD members
by an adenine base and its partner base C8 by a thymine on
each strand within the unique palindrome of the atu1420 Atu1419 belongs to the VanR subgroup of the FCD sub-
promoter region. EMSA showed that Atu1419 was no family of the large GntR superfamily due to the number of
longer able to bind Patu1420s AT mutant (Figure 4F). helices in its effector binding domain. The FCD subfamily
Therefore, the guanine at position 3 has an essential role is divided into two groups; VanR and FadR. Members that
in the DNA palindrome binding by Atu1419 meaning that are structurally characterized in FadR subgroup possess an
Arg45 has a key role in recognizing this guanine base. additional helix after the linker region at the beginning of
the effector binding domain (23,33–35). This major differ-
ence leads to a domain-swapped quaternary structure, in
Crystal structure of apo Atu1419 and structural comparison
Downloaded from https://academic.oup.com/nar/article/49/1/529/6031445 by guest on 13 December 2021
which the DNA binding domain of FadR subunit A crosses
We solved the structure of Atu1419 in the apoform at 2.7 the dimerization interface to be in contact with the effector
Å resolution using Tris-HCl buffer instead of citrate buffer binding domain of subunit B (35–37). This is not observed
in the crystallization condition to avoid any bound citrate in the VanR subgroup where both domains from the same
(Table 1). The asymmetric unit contains a tetramer with a subunit are associated.
bound Zn2+ ion in each effector binding domain. Asn137 Atu1419 is now the seventh VanR member to be struc-
and three histidine (His141, His192 and His214) side chains turally characterized. The six others are Thermotoga mar-
form the metal binding site of Atu1419 and chelate the zinc itima TM0439 (PDBs 3SXY/3FMS (38)), Ralstonia eu-
ion with a classical tetrahedral coordination geometry and tropha JMP134 YP 298823.1 (PDB 3IHU no related pub-
average distances ∼2.2 Å (Figure 5A). We mutated the three lication), Pseudomonas syringae PS5454 (PDB 3C7J, no
histidine (His141, His192 and His214) into alanine to make related publication), Rhodococus sp. RHA1 (PDB 2HS5,
the triple point mutant Atu1419-H3A and alter the metal no related publication), E. coli McbR/YncC (PDB 4P9F
binding site. The zinc ion holds helices ␣6, ␣8 and ␣9 in- (37)) and Listeria monocytogenes MouR (PDB 6EP3 (39)).
volved in the tetrameric interface far from the DNA binding Structural comparison using SSM-EBI (http://www.ebi.ac.
domain, and likely interacts with the effector as shown by uk/msd-srv/ssm) reports RMSD of 3.19 Å over 190 C␣
the structures solved with a citrate taking the place of the ef- atoms/3.46 Å over 184 C␣ atoms between the full-length of
fector. Atu1419-H3A is correctly folded as checked by using Atu1419 and MouR (PDB 6EP3)/TM0439 (PDB 3SXY),
circular dichroism (Supplementary Figure S4) and shares respectively. The same search using the C-terminal domain
the same secondary structure content (about 58% ␣-helices of Atu1419 only improves the RMSD values to 2.59 and
and 1% -sheets) as the wild-type protein in line with what 2.71 Å over 127 residues with the effector binding domains
is observed in all crystal structures of Atu1419. Similar to of TM0439 and MouR corresponding to 15% and 13% se-
the wild-type protein, this mutant is tetrameric and capable quence identity, respectively (Supplementary Figure S6A).
of binding atu1418–1419 and atu1420 promoter regions. The best match concerns the effector binding domain of
The dimeric (dimers AB/CD) and tetrameric interfaces McbR/YncC (PDB 4P9F) with a RMSD of 2.23 Å over 132
(dimers AD/BC) covering around 1400 Å2 and 516 Å2 per residues and 18% sequence identity, meaning that there are
subunit, respectively, are comparable to those of Atu1419- major significant differences between Atu1419 and the six
citrate complexes and Atu1419–DNA complexes. Subunits other VanR members. While only the C-terminal domain is
A and D overlap well (RMSD of 0.53 Å), as well as sub- responsible for dimerization for most VanR regulators (37),
units B and C (RMSD of 0.83 Å), whereas subunits A and Atu1419 is similar to McbR/YncC in using both the N-
B or C and D show a RMSD over 2 Å, mainly due to dif- and C-terminal domains as the dimeric interface. However,
ferences in the position of their HTH motif and the end of the dimer of Atu1419 does not structurally resemble that of
their C-terminal domain, evidencing large flexibility (Sup- McbR/YncC (Supplementary Figure S6B).
plementary Figure S5A). This is confirmed by the struc- Like Atu1419, two other VanR members, which are
tural comparison of the DNA binding domains of the apo TM0439 and PS5454 display a metal binding site with three
dimer AB with those of the Atu1419–DNA complex (Fig- histidine residues and an asparagine or an aspartate residue
ure 5B). While subunits A are rather similar, helix ␣3 of the involved in the metal coordination (37,38). These histidine
apoform subunit B clashes into the DNA sugar-phosphate residues are conserved and structurally close (Supplemen-
backbone. Indeed, this helix is far from its optimized posi- tary Figure S6C). LldR (PDB 2DI3) from the FadR group
tion for DNA binding, which is perpendicular to the helical binds a zinc ion chelated by these three conserved histidines
axis of the DNA. A displacement up to 7 Å would be re- and an aspartate (35). It was proposed that an additional
quired to correctly places its wHTH motif. A similar struc- subgroup within the FCD subfamily could be created for
tural analysis between the DNA binding domains of the regulators from both FadR and VanR members, which are
Atu1419-citrate complexes and Atu1419–DNA complexes capable of binding to metal ions (35,38). Using thermal de-
led to similar conclusions (Supplementary Figures S5B–D). naturation experiments by differential scanning calorime-
It is noteworthy that the conformation of the effector try (DSC), Tm of 52.6 and 34◦ C were measured with the
binding pocket in all subunits bound or not to DNA and wild-type Atu1419 and Atu1419-H3A mutant respectively
containing a citrate in orientation B is similar to that of (Supplementary Figure S7). The drastic difference of al-
the empty pocket observed in the apo form and one DNA most 20◦ C indicates that the metal assists in stabilizing the540 Nucleic Acids Research, 2021, Vol. 49, No. 1
Downloaded from https://academic.oup.com/nar/article/49/1/529/6031445 by guest on 13 December 2021
Figure 5. (A) Cartoon representation of the C-terminal domain except for helix ␣5 shown in ribbon of Atu1419 with a co-purified Zn2+ ion and a close-up
view of the Zn2+ binding site. The four amino acid residues bound to the metal ion (orange ball) are shown as sticks. (B) Superposition of dimers AB of
apo Atu1419 (in orange) and Atu1419-DNA complex (in purple and gray). The DNA is in green. (C) Close-up view showing the superposition of their
DNA binding domains colored as in (B) with a view at 90◦ .
structure affording an explanation as to why Atu1419-H3A 2. Nonetheless, the wing in Atu1419 does not appear
could not be concentrated over 50 M without precipitat- as crucial for DNA interaction as that in FadR, which
ing, in contrast to the wild-type protein (140 M). All at- recognizes a pseudo-palindrome of 17 base pairs. Indeed,
tempts to crystallize Atu1419-H3A were unsuccessful. His65, which specifically recognizes a DNA base in FadR
Atu1419 is the first VanR member to be structurally char- is a glycine in Atu1419. DNA binding domains super-
acterized in complex with DNA whereas several FadR- position of the Atu1419-DNA complex with those of E.
DNA complexes are available (23,33,34). Each dimer of coli and V. cholerae FadR-DNA complexes shows that al-
Atu1419 within the tetramer can bind an identical palin- though the positions of subunits A are rather similar, the
drome. Similarly to regulators with a wHTH motif such second subunit of Atu1419 makes steric clashes with the
as MarR regulators (40,41), FCD regulators bind to one DNA bound to FadR and that of FadR is too far from
half-site of the palindromic DNA, with the dimerization the DNA bound to Atu1419 (Supplementary Figure S8).
interface helping to establish the spacing between the two Atu1419 displays only one specific interaction shared in
half-sites. The DNA binding domains of Atu1419, which FadR with the guanine present within the major groove
are involved in the dimerization interface, allow Atu1419 of DNA via their conserved Arg45, a typical feature of
to bind a short palindrome of 10 base pairs. As in E. the GntR family (22). The other specific DNA contacts of
coli FadR (PDB 1H9T (23) and 1HW2 (33)) and in Vib- FadR (via Arg35, Thr44, Thr46 and His65) are not compa-
rio cholerae FadR (PDB 4P9U (34)), the DNA-binding rable with those of Atu1419. The recognized DNA sequence
site of each Atu1419 monomer is recognized by conserved of Atu1419 which is 5 -ATGTATACAT-3 is in agreement
residues such as Glu34 in helix ␣2, Arg45 (specific DNA with the predicted DNA signature for the GntR family:
contacts), Thr46 and Arg49 (phosphate backbone contacts) 5 -(N)y GT(N)x AC(N)y -3 where the number x and y vary
in helix ␣3 that interact with the major groove and Gly66 (20). Later, this DNA binding signature was suggested to
in the tip of the wing (residues 64–68) between 1 and be modified as 5 -TNG(N)nCNA-3 on the basis of base-Nucleic Acids Research, 2021, Vol. 49, No. 1 541
specific interactions (22) or as 5 -TGGTNxACCA-3 for type C58 and C58atu1420 strains. These results indicate
FadR subgroup (35) but both sequences are not appropriate that the presence of atu1418 gene is important for the full
for Atu1419. induction of atu1418, atu1419 and atu1420 genes expres-
The DNA binding of Atu1419 requires conformational sion in the presence of ferulic acid. The accumulation of
changes of the DNA binding domains. Indeed, the distance MH4F and the lack of MEF production in the defective
between the two DNA recognition helices (Thr46 of he- C58atu1418 mutant suggests that MEF could be the ef-
lix ␣3) narrows from 12 Å in the apoform to 9.3 Å in the fector of Atu1419. MEF is not stable in aqueous in vitro so-
Atu1419-DNA complex, for a productive interaction with lutions as it enters a rapid reversible equilibrium into H4F
DNA (Figure 5C). A similar observation was reported for (42,43). Nonetheless, immediately using freshly-made MEF
V. cholerae FadR (PDB 4P9U (34)). The structures of FadR solution for EMSA, we were able to show that MEF could
repressors in complex with their effector show significant relieve repression of Atu1419 (Figure 6D) whereas H4F and
conformational changes transmitted from the effector bind- MH4F had no effect (Figure 6E). In the C58atu1418 mu-
ing domain to the DNA binding domain, leading to a con- tant, induction of Patu1418, Patu1419 and Patu1420 was
Downloaded from https://academic.oup.com/nar/article/49/1/529/6031445 by guest on 13 December 2021
formational state that is no longer favorable for interaction not totally abolished, probably due to functional redun-
with DNA (22,23,34). The fundamental process wherein the dancy of N5,N10-methylene tetrahydrofolate reductase ac-
binding of a ligand or effector molecule alters the activity of tivity in A. fabrum genome, which allows to keep a basal
the protein at a distant site is defined as an allosteric mech- pool of folate and intermediates essential for the cell (44).
anism. In the case of Atu1419, the citrate in orientation A The interaction between MEF and Atu1419 was con-
bound in the effector binding pocket induces large confor- firmed by DSC with a Tm of 63.5◦ C for Atu1419 in com-
mational changes from the C-terminal domain to the N- plex with MEF compared to the Tm of 52.6◦ C for the apo
terminal domain. It affects four different protein regions: Atu1419 (Figure 6F). This was also confirmed by isother-
the wing of the DNA binding domain and three regions of mal titration microcalorimetry (ITC, Figure 6G). Because
the effector binding domain including the C-terminus pro- MEF instability did not allow a return to the baseline be-
tein which is in contact with the DNA binding domain (Fig- tween two injections, we could not rigorously determine a
ure 3C). The presence of this citrate clearly reveals the plas- dissociation constant KD value, which is around 20 M. In-
ticity of the effector binding pocket and the large potential jection of MEF towards buffer solution was a control of its
rearrangement of the repressor. It also shows that within the instability effect (Figure 6H). No interaction could be ob-
tetramer, one subunit can adopt a different conformation served between MH4F and Atu1419 by DSC and ITC, in
around the effector binding pocket and further away (Fig- agreement with the results from EMSA.
ure 3C) compared to the three others subunits, highlighting
an allosteric mechanism. The citrate bound in orientation A
Atu1419 tetramer is the biologically active form
may mimic a part of the physiological effector, which binds
to the metal ion. We analyzed the quaternary structure of Atu1419 in com-
plex with MEF using gel filtration measurement (Sup-
plementary Figure S9). Atu1419 remains tetrameric when
Atu1419 effector is the N5,N10-methylenetetrahydrofolate
bound to MEF. Thus, Atu1419 is a tetramer in its apo
(MEF)
form, upon DNA binding or effector binding suggesting
The effector molecule bound to the members of the GntR that this quaternary structure is the biologically active form.
superfamily are often related to catabolic substrates or in- Both crystal structures of Atu1419 in complex with DNA
termediates of the pathway controlled by the transcrip- revealed that each dimer of Atu1419 within the tetramer
tion factor (19,20), and several molecules are produced can bind a palindromic site of 10 bp, separated by ap-
during the ferulic acid degradation pathways (5). Because proximately 10 nm (Figure 3A). This separation distance
the citrate molecule was able to bind to the effector bind- is compatible with DNA loop formation (45) allowing the
ing site of Atu1419, we searched for molecules resem- simultaneous binding of two distant palindromes (190 bp
bling citrate among those described in the HCA pathway apart) within the intergenic region of atu1418–1419. Thus,
(Figure 1A), and we asked whether the substrate-cofactor Atu1419 tetramer could repress gene expression via DNA
H4F or the product-cofactor M4HF of the O-demethylase looping, such as several negative regulators in prokaryotes
Atu1420 enzyme could be a potential effector. Indeed, (46) such as the extensively studied tetrameric lac operon
citrate compound with three carboxylate groups mimics repressor (47).
two carboxylate groups located at one end of the H4F or We searched for a second potential DNA binding site of
MH4F molecules. Alternatively, MEF, the putative product Atu1419 in atu1420 region and found a degenerated palin-
of Atu1418 enzyme, which possesses the same two carboxy- drome (8 bp conserved over the 10 bp palindrome; Figure
late groups could also be a potential effector of Atu1419. 7A). The degenerated palindrome is separated by 109 bp
To verify this, Patu1418, Patu1419 and Patu1420 plas- from the palindrome and is located downstream within the
mid reporter gene fusions were introduced into the open reading frame of atu1420 gene (Figure 7A). We then
C58atu1418 and C58atu1420 mutant strains. For each performed EMSA with three oligonucleotides containing
strain, the fluorescence level was monitored in the presence either the palindrome, the degenerated palindrome, or both
or absence of ferulic acid and compared to the wild-type A. and identified in the gel a retarded band for each oligonu-
fabrum C58 (Figures 6A–C). For the C58atu1418 strain, cleotide proving the formation of a stable non-covalent
the overproduction of fluorescence observed in the presence protein-DNA complex (Figure 7B). Thus, the repressor can
of ferulic acid is significantly lower than that in the wild- recognize a palindrome and a degenerated palindrome pro-You can also read