CONFINED COMPRESSION OF SINGLE PARTICLES - DIVA
←
→
Page content transcription
If your browser does not render page correctly, please read the page content below
Digital Comprehensive Summaries of Uppsala Dissertations
                from the Faculty of Pharmacy 255

                Confined Compression of Single
                Particles
                Development of a Novel Triaxial Testing Instrument
                and Particle-Scale Modelling

                HENRIK JONSSON

    ACTA
UNIVERSITATIS
 UPSALIENSIS    ISSN 1651-6192
                ISBN 978-91-513-0329-1
  UPPSALA       urn:nbn:se:uu:diva-348091
    2018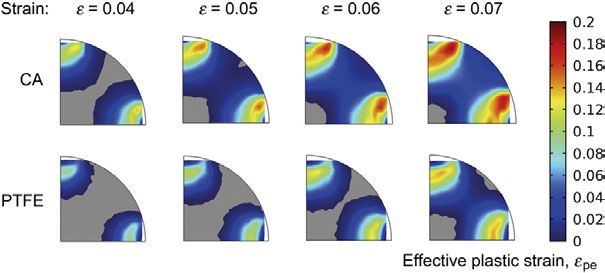
Dissertation presented at Uppsala University to be publicly examined in B21, BMC,
Husargatan 3, Uppsala, Tuesday, 5 June 2018 at 09:15 for the degree of Doctor of Philosophy
(Faculty of Pharmacy). The examination will be conducted in English. Faculty examiner:
Doctor Abderrahim Michrafy (RAPSODEE Centre, UMR CNRS, Ecole des Mines - Albi,
France).

Abstract
Jonsson, H. 2018. Confined Compression of Single Particles. Development of a Novel
Triaxial Testing Instrument and Particle-Scale Modelling. Digital Comprehensive Summaries
of Uppsala Dissertations from the Faculty of Pharmacy 255. 58 pp. Uppsala: Acta
Universitatis Upsaliensis. ISBN 978-91-513-0329-1.

When predicting the performance of a powder compaction process, assessing the behaviour
of the particles comprising the powder bed is of central relevance. Currently, however, no
experimental methods are available for mimicking the multiaxial loading conditions imposed
on the individual particles in a powder bed during compaction, and such analyses are therefore
usually performed in silico. Thus, the purpose of this thesis is to introduce a novel experimental
method that enables experimental evaluation of confined triaxial loading conditions on
individual particles in the mm-scale.
   The work underlying the thesis consists of three major parts. Firstly, the triaxial instrument
was designed and developed, after which its performance was evaluated using nominally ideal
elastic-plastic spheres as model materials. These initial experiments showed that the instrument
was able to successfully impose confined triaxial conditions on the particles, something that
was verified by finite element method (FEM) simulations.
   Secondly, the triaxial instrument was used to investigate differences in deformation
characteristics under uniaxial and triaxial loading conditions for four different microcrystalline
cellulose (MCC)-based granules. It was shown that fragmentation, associated with unconfined
uniaxial compression, was impeded under confined triaxial conditions, despite the emergence
of cracks. In addition, it was observed that the primary crack always occurs in a plane parallel to
the most deformed direction, and that the location of the largest pore has a pronounced influence
on the path of the crack.
   Thirdly, the influence of different triaxial loading ratios were evaluated on polymer spheres,
after which a unified description of contact pressure development was devised. Data from these
experiments were then successfully used to calibrate a contact model for simulating bulk powder
compression with the discrete element method (DEM).
   All in all, a novel experimental method has been established, which has proven useful as
an alternative and complement to numerical studies when studying single particle deformation
under confined triaxial conditions.

Keywords: Powder compaction, Compression, Single particle, Particle mechanics, Powder
mechanics, Confined conditions, Triaxial, Apparatus design, Modelling

Henrik Jonsson, Department of Pharmacy, Box 580, Uppsala University, SE-75123 Uppsala,
Sweden.

© Henrik Jonsson 2018

ISSN 1651-6192
ISBN 978-91-513-0329-1
urn:nbn:se:uu:diva-348091 (http://urn.kb.se/resolve?urn=urn:nbn:se:uu:diva-348091)
Till farfar, vars efternamn jag bär
Till morfar, som lyckades överföra familjens
                       enda teknikgen till mig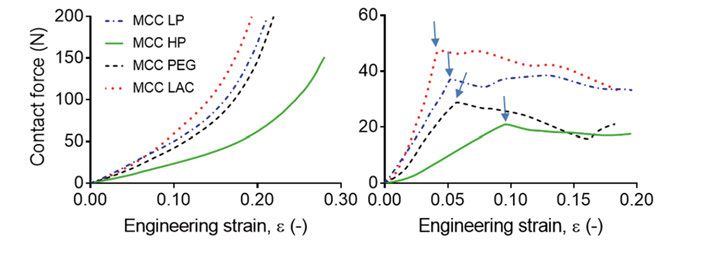
Either one does not dream, or one does so interestingly.

One should learn to spend one's waking life in the same way:

                                  Not at all, or interestingly.

                                       -   Friedrich Nietzsche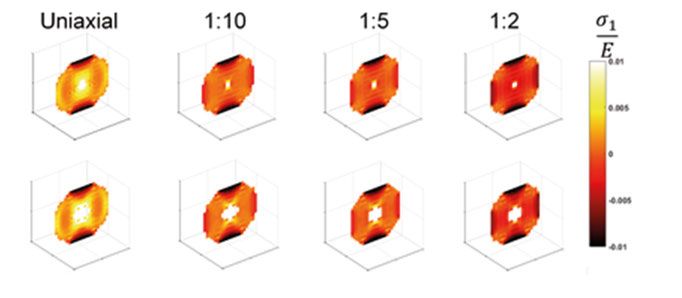
List of Papers

This thesis is based on the following papers, which are referred to in the text
by their Roman numerals.

      I       Jonsson H., Gråsjö J., Nordström J., Johansson N., Frenning
              G. An apparatus for confined triaxial testing of single parti-
              cles. Powder Technology, (2015), 270:121-127.
      II      Jonsson H., Frenning G. Investigations of single microcrystal-
              line cellulose-based granules subjected to confined triaxial
              compression. Powder Technology, (2016), 289:79-87
      III     Jonsson H., Gråsjö J., Frenning G. Mechanical behaviour of
              ideal elastic-plastic particles subjected to different triaxial
              loading conditions. Powder Technology, (2017), 315:347-355
      IV      Jonsson H., Öhman-Mägi C., Alderborn G., Isaksson P., Fren-
              ning G. Crack nucleation and propagation in microcrystalline
              cellulose-based granules subject to uniaxial and triaxial load.
              Manuscript
      V       Jonsson H., Frenning G. Evaluation of bulk compression us-
              ing a discrete element procedure calibrated with data from tri-
              axial experiments on single particles. Manuscript

Reprints were made with permission from the respective publishers.

I was the main author of all the appended papers. I performed all the experi-
ments on my own, except for some of the initial experiments which were done
in conjunction with my co-authors, and the X-ray computed microtomography
experiments, which were performed without my participation. I performed the
simulations in Papers III-V and I was highly involved in planning all the pro-
jects and in interpreting the obtained data.
Contents

1.      Introduction ......................................................................................... 11
     1.1 Objectives ....................................................................................... 12
     1.2 Outline of the thesis ........................................................................ 13
2.      The powder compaction procedure...................................................... 14
     2.1 Modelling powder compaction ....................................................... 15
3.      Particle mechanics ............................................................................... 16
     3.1 Modes of deformation ..................................................................... 16
        3.1.1 Elasticity ................................................................................ 16
        3.1.2 Plasticity ................................................................................ 16
        3.1.3 Fragmentation ........................................................................ 18
     3.2 Interparticle contact......................................................................... 18
        3.2.1 Single contact......................................................................... 18
        3.2.2 Multiple simultaneous contacts ............................................. 19
4.      The triaxial testing apparatus ............................................................... 21
     4.1 Initial considerations ....................................................................... 21
     4.2 Compression mechanism ................................................................ 21
     4.3 Apparatus design ............................................................................. 23
        4.3.1 Original setup......................................................................... 23
        4.3.2 Modified setup ....................................................................... 24
5       Numerical Methods ............................................................................. 26
     5.1 The finite element method .............................................................. 26
     5.2 Smoothed particle hydrodynamics .................................................. 27
     5.3 The discrete element method .......................................................... 27
        5.3.1 The extended truncated sphere model.................................... 27
6       Experimental methods ......................................................................... 29
     6.1 Granule fabrication and characterisation ........................................ 29
     6.2 X-ray computed microtomography ................................................. 30
     6.3 Bulk powder compression ............................................................... 30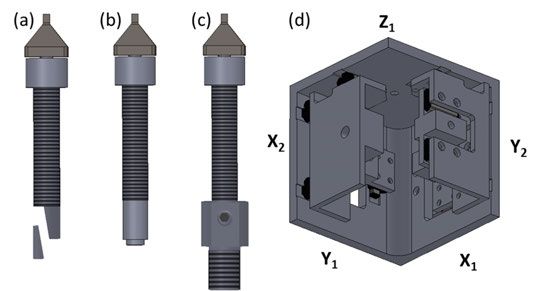
7        Results and discussion ......................................................................... 32
     7.1 Performance of the triaxial testing apparatus .................................. 32
     7.2 Deformation characteristics of MCC-based granules under
     triaxial compression (Paper II) ................................................................. 33
     7.3 Onset and direction of cracking (Paper IV) ................................... 36
     7.4 Influence of different loading ratios (Paper III) .............................. 38
     7.5 Calibration and evaluation of a DEM model (Paper V) .................. 41
8        Conclusions ......................................................................................... 44
9        Future perspective................................................................................ 45
10      Populärvetenskaplig sammanfattning .................................................. 46
     En maskin för treaxlig belastning av partiklar ......................................... 47
     Fragmenterar granuler eller inte? ............................................................. 47
     Kraftutveckling vid flera samtidiga kontakter .......................................... 48
     Kalibrering av kontaktmodell för simuleringar ........................................ 48
Acknowledgements ....................................................................................... 49
References ..................................................................................................... 51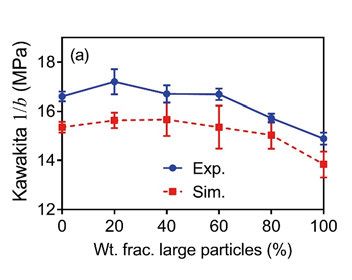
Abbreviations

a          Kawakita parameter
ac         Radius of contact area
AF         Abbott-Firestone (contact model)
b          Kawakita parameter
C          Degree of compression (Kawakita)
CA         Cellulose acetate
D          Relative density
d          Particle diameter
DEM        Discrete element method
E          Young´s modulus
Fc         Contact force
Fi         Contact force at the i:th contact
Ffrac      Force at fracture
FEM        Finite element method
h          Contact overlap
hi         Contact overlap at the i:th contact
H          Material hardness
           Effective hardness
HP         High-porous
K          Heckel parameter
k          Hardening parameter
LAC        Lactose
LP         Low-porous
MCC        Microcrystalline cellulose
n          Hardening parameter
P          Pressure
           Effective contact pressure
Py         Heckel yield pressure
PEG        Polyethylene glycol
PTFE       Polytetrafluoroethylene (Teflon)
R          Current particle radius
R0         Initial particle radius
Si         Area of contact surface at the i:th contact
SPH        Smoothed particle hydrodynamics
V          Current volume of a Voronoï cell
V0         Initial volume of the compression cell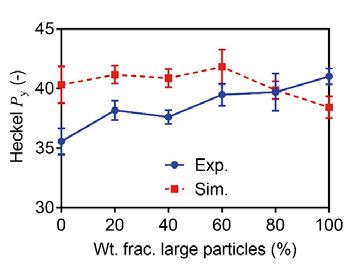
V2        Particle volume at onset of elastic deformation
Vc        Current volume of the compression cell
Vf        Final volume of the compression cell
Vp0       Initial particle volume
β         Parameter in the extended truncated sphere model
          Engineering strain
          Effective plastic strain
          Bulk modulus
          Poisson’s ratio
          Mechanical stress
          Nominal fracture strength
  ,   ,   Principal stresses
          Yield strength
          Yield strength prior to strain hardening
          Volumetric constraint
1. Introduction
The process by which a coherent object is shaped from granular matter by
means of compressive pressures has accompanied humanity since ancient
times. One main driving force was the discovery that iron, which occurs nat-
urally as ore, could be crushed and then shaped into tools and weapons when
heated and pressed together. The first presence of iron objects in human civi-
lisations is normally attributed to the advent of the Iron age, around 1200 B.C.,
but the earliest account of this technology actually dates back to the days of
ancient Egypt almost 2000 years earlier [1]. A related history is that of ceramic
materials, in which compaction procedures traditionally have been used for
producing tiles and porcelain objects [2]. Within pharmaceutics, the conven-
ience of the compact as a dosage form have been known for a vast period of
time. Recently, archaeologists have found pharmaceutical compacts, most
likely used for treating ophthalmic diseases, that could be dated to the second
century B.C. [3].
Following the advent of modern technology, techniques for manufacturing
through bottom-up shaping of compacts from powder beds have been signifi-
cantly improved. Specifically, the introduction of the automated tablet press
immensely increased the performance and output of the tableting process in
the pharmaceutical industry. Today, the tablet is well-established as the dom-
inating dosage form, demanding a daily manufacture of billions of units.
As in all manufacturing processes, there is a constant endeavour to assure
a high and consistent quality of the manufactured product. Obviously, the
characteristics of a compact are a direct result of how the individual particles
deform during the compaction procedure [4]. Thus, there is a pronounced in-
terest to develop models for describing the deformation characteristics of a
powder under compression, and considerable progress has been made in this
area during the past few decades [5-8].
However, one limitation of many current contact models is that they be-
come increasingly inaccurate at high relative densities, i.e. when deformations
are large [9, 10]. One reason for this is that contact models usually build on
material data derived from deformation characteristics of a single, isolated
contact. Although this assumption has been shown to be invalid, alternatives
are scarce, since assessing the deformation characteristics of a single particle
under multiple contacts is a cumbersome task which currently can only be
performed in silico.
11In the the present thesis, an apparatus for confined triaxial compression of
individual particles in the mm-scale is introduced and evaluated. The appa-
ratus employs a compression mechanism with rigid sliding boundaries,
adapted from soil mechanics. The data are evaluated using numerical and an-
alytical methods, as well as used to calibrate a discrete element model for bulk
powder compaction.
1.1 Objectives
This thesis describes the establishment and evaluation of a novel method for
confined triaxial compression of single particles in the mm-scale. The purpose
of the method is to give a deeper insight into the deformation of single parti-
cles under stresses similar to those imposed on individual particles during a
conventional powder compaction process. Alongside this novel experimental
method, conventional experimental methods such as confined bulk powder
compression and unconfined uniaxial compression are employed to character-
ise the investigated materials. Throughout the study, confined powder bed
compression as well as computational methods such as the finite element
method (FEM), smoothed particle hydrodynamics (SPH) and the discrete ele-
ment method (DEM) are used to evaluate the experimental results. Materials
used are nominally spherical lead (Paper I), cellulose acetate (CA; Papers I,
III, V) and polytetrafluoroethylene (PTFE; Paper III) as well as different gran-
ules based on the common pharmaceutical excipient microcrystalline cellu-
lose (MCC; Papers II and IV).
More specifically, the objectives are:
• To establish an experimental method for analysing confined com-
pression of single particles
• To investigate the differences in deformation characteristics of sin-
gle particles between uniaxial and triaxial loading conditions
• To study the tendency of granular materials to fracture under uni-
axial but not under multiaxial loadings, like those in a powder bed.
• To find a way to describe the force development at a contact under
confined compression to high relative densities.
• To implement the obtained results in computational models for im-
proving the prediction of a powder compaction procedure.
121.2 Outline of the thesis
The thesis is organised as follows: a general introduction to powder com-
paction is given in Chapter 2, whereas Chapter 3 introduces the principles
of single particle mechanics. Chapter 4 describes the triaxial testing appa-
ratus used in the study. In Chapter 5, an account is provided of the different
numerical methods used in the work underlying the thesis, and Chapter 6
introduces additional experimental methods. Results and discussion are
found in Chapter 7, conclusions in Chapter 8 and future perspectives in
Chapter 9. Finally, a short popular-scientific summary in Swedish is given
in Chapter 10.
132. The powder compaction procedure
P owder compaction is a unit operation that is usually well-integrated into a
production line. After pouring a powder into a cavity of defined dimensions,
an external pressure of desired magnitude is applied by means of a rigid punch,
enforcing the particles to form bonds between each other and thus shaping the
powder into a coherent body [11, 12]. When using pharmaceutical materials,
which is the main concern of this thesis, this process is either the final step in
the production chain or the product is finished by a coating procedure. In ce-
ramics and metallurgy, the compact is usually an intermediary product known
as the green body, which is required to undergo a sintering process to attain
its desired strength [13].
The densification of a powder bed under compaction is usually divided into
three stages (Figure 1) [14]. During pouring and initial compression (region
I), the powder behaves as a fluid, with rearrangement of the powder particles
enforcing a denser packing until the powder reaches a jamming transition, af-
ter which plastic deformation of the particles (and hence the powder bed) be-
comes predominant (region II). As the powder bed approaches full relative
density – i.e. when pores present between and inside the particles become in-
creasingly exhausted – the ability of the material to deform plastically dimin-
ishes and a region (III) of elastic deformation is reached. For fragmenting ma-
terials, such as ceramics and some pharmaceutical materials, fragmentation
forms an additional event during the compaction procedure, usually occurring
during the early stages of compaction [11, 15].
14Figure 1. The different stages during a powder compaction procedure, illustrated in
a Heckel plot of compaction data of MCC granules used in the work underlying this
thesis.
2.1 Modelling powder compaction
In practice, there are three major strategies for modelling the densification of
a powder bed. One method is to model the powder bed as a continuum, using
the finite element method (FEM) and constitutive relationships from soil me-
chanics, such as the Drucker-Prager Cap or the Cam-Clay model [7, 16-18].
An alternative to continuum modelling is to model the powder bed as an as-
sembly of distinct particles using the discrete element method (DEM), where
the behaviour of the powder under compression is governed by micromechan-
ical laws evaluated at interparticular contacts [19, 20].
The third approach employs a combination of the other two, where the
powder is modelled as distinct particles and each particle in turn is modelled
as a continuum. This approach, known as the MDEM (meshed discrete ele-
ment method) or MPFEM (multi-particle finite element method) [6, 10, 21-
23], renders superior representation of the powder, but demands high compu-
tational cost, limiting such analyses to unpractically small amounts of parti-
cles. Hence, provided suitable micromechanical contact laws are used, dis-
crete element modelling is a reasonable trade-off between efficiency and ac-
curacy.
153. Particle mechanics
3.1 Modes of deformation
3.1.1 Elasticity
When a material is loaded in such a way that if the stress is removed, the
material regains the shape it had before applying the stress, the deformation is
defined as elastic. The elastic stiffness of a material is generally defined
through Hooke’s law, which approximates the elastic deformation of the ma-
terial as that of a linear spring. The parameter E is a material parameter known
as the elastic modulus or Young’s modulus, equal to the ratio between the
(uni)axial stress ( ) and the axial strain ( ) [24]
= . (1)
Since all materials have elastic properties to some extent, the Young’s modu-
lus is an important parameter when characterising the material behaviour in
the elastic regime. When the deformation of a body in three dimensions is of
interest, it is convenient to make use of the Poisson’s ratio ( ) and the bulk
modulus ( ). The Poisson’s ratio is a measure of the extent to which a material
expands in the radial directions when compressed axially, and usually ranges
between 0.0 (no radial expansion) and 0.5 (radial expansion that fully com-
pensates for the axial compression). The bulk modulus, which relates the rel-
ative volume decrease (volumetric strain) of the material to the applied pres-
sure, can be determined from the elastic modulus and the Poisson’s ratio as
[25]
= . (2)
( )
3.1.2 Plasticity
When the stress in a material under loading is high enough to cause the mate-
rial to deform irreversibly, the material is said to deform plastically. This limit
is defined by the concept yield strength (or yield stress) ( ). Under uniaxial
16stress, the material simply starts to flow plastically when . Under mul-
tiaxial stress, the combination of stresses in the different spatial directions
must be accounted for [26]. Such a stress state can be analysed in terms of its
principal stresses, which are the normal stresses in the three orthogonal direc-
tions where shear stresses are zero, denoted as . Any multiaxial
stress state consists of a hydrostatic* and a deviatoric component. For non-
porous elastic-perfectly plastic materials, it is well known that plastic flow is
induced solely by deviatoric stresses, which is a measure of the difference
between the principal stresses. For such a material, the onset of plastic flow
can be calculated from the von Mises yield criterion [27]:
( − ) +( − ) +( − ) = (3)
Not all materials are perfectly plastic. Rather, most materials undergo some
degree of strain hardening, which means that the value of the yield strength
continuously increases from an initial value to a new value as the de-
formation proceeds, increasing the stress required for the material to keep
flowing plastically (Figure 2). For the purpose, a strain hardening component
can be introduced on the right-hand side of Eq. (3). For porous materials, plas-
tic flow can be induced both by deviatoric and hydrostatic stresses, for which
a hydrostatic component can be introduced into the yield criterion [28].
Figure 2. Example of a 2D von Mises
yield criterion with isotropic hardening
_______________________
*Hydrostatic stress should not be confused with hydrostatic loading conditions, a term fre-
quently used in this thesis for denoting equivalent loading rates along all three axes.
173.1.3 Fragmentation
Porous particles, such as pharmaceutical granules, are prone to fracture under
unconfined uniaxial loading conditions. Fracture and subsequent fragmenta-
tion results from tensile stresses emerging in the directions normal to the uni-
axial load. A nominal fracture strength of a granule can be determined from a
diametrical (unconfined) compression test with the following relationship
[29]:
= , (4)
where is the measured force at fracture and is the particle diameter.
3.2 Interparticle contact
3.2.1 Single contact
When two spherical particles are pressed against each other (in this example
two monosized particles; Figure 3), the surfaces of the particles deform and a
circular contact area of radius is formed between the particles. This radius
grows as the compression proceeds and can be expressed as a function of the
overlap ℎ and the original particle radius . Investigation of the characteris-
tics of normal frictionless contact between two spheres was pioneered for
small elastic deformations in the latter part of the 19th century by Heinrich
Hertz [30]. For plastically deforming particles, contact pressure development
is normally described using the material hardness ( ) obtained from indenta-
tion experiments [5, 31], where an indenter of a certain geometry is pressed
into a material sample. Tabor [26, 32] noted that ≅ 3 when indenting
with Brinell (spherical) as well as Vickers (pyramidal) indenters. A similar
relationship was derived by Abbott and Firestone, who described the contact
force development of a sphere indented by a rigid flat as [33, 34]:
= 5.6 ℎ (5)
Figure 3. Normal contact between two monosized spheres (a). (b)
shows a magnification of the contact area.
183.2.2 Multiple simultaneous contacts
Successful prediction of contact pressure on a single contact is a result of av-
eraging the stress at the contact surface. In reality, a zone of hydrostatic and
deviatoric stresses arise beneath the contact, stresses that together are respon-
sible for the magnitude of the measured contact pressure [35, 36]. Under mul-
tiple simultaneous contacts, these zones coalesce (Figure 4), causing a soften-
ing of the contact response [36-38]. At large deformations, contact surfaces
come so close to each other that they impinge, invalidating the assumption of
circular contacts (Figure 5) [10, 39]. Simultaneously, particle confinement be-
comes increasingly pronounced and the sample under compression ap-
proaches a limit where no further plastic deformation can take place [6].
Figure 4. Illustration of coalescence of plastic zones. From finite element
simulations in Paper III.
Figure 5. A spherical particle subjected to multiple
simultaneous contacts. The red circle highlights
contact impingement.
19Several researchers have tried to capture the characteristics of deformation under multiple simultaneous contacts at high relative densities. Examples in- volve Gonzalez and Cuitiño, who formulated a nonlocal solution for elastic deformation [40, 41], Montes et al, who developed an expression for effective pressure on individual particles during powder densification [39], Harthong et al, who used Voronoï cells for determining the degree of confinement at each contact from the local relative density [6, 42] as well as Tsigginos et al, who devised a fabric tensor for describing the emergence of new contacts during compression [37]. 20
4. The triaxial testing apparatus

4.1 Initial considerations
Considering the general aim to be able to experimentally measure the behav-
iour of individual particles under conditions similar to those exerted on indi-
vidual particles in a powder compression procedure, the following require-
ments were established with respect to the design of the triaxial instrument:

      •   A confined environment must be constituted, i.e. the equipment
          should be able to restrict the particle from expanding in any direc-
          tion. The confining surfaces must be considerably harder than any
          tested specimen and should at no point deform inelastically.
      •   The environment must be of relevant dimensions. Samples of inter-
          est are particles of such a size that they could be used in bottom-up
          fabrication of compacts. The experimental equipment should there-
          fore be scaled accordingly.
      •   Variation of the loading conditions (i.e. the ratio between the three
          loading directions) imposed on the particle must be possible, since
          the loading conditions on an individual particle in a powder bed
          under compression vary. Therefore, compression along each axis
          should be able to be programmed independently of the other direc-
          tions of compression.
      •   The design should allow for insertion of particles in a convenient
          way prior to an experiment, and likewise for convenient collection
          of particles for post-compression analysis.

4.2 Compression mechanism
Although not previously present in literature on contact mechanics and dry
powder compression, confined triaxial testing is a central concern within soil
mechanics, where several different compression mechanisms have been pre-
sented [43]. With the requirements stated in the previous paragraph, a mecha-
nism was chosen that was first introduced to the scientific society by Hambly
in 1969 [44] and later adapted e.g. by Pearce [45, 46], by Airey and Wood
[47] and by Ibsen and Praastrup [48]. The mechanism involves six rigid

                                                                            21
boundaries (hereafter referred to as punches) arranged in such a manner that
they constitute a compression cell in the shape of a rectangular box, in which
a sample of desired size can be placed (Figure 6). Using such a construction,
each boundary is able to move independently of the others in its axial direc-
tion, and laterally as determined by the adjacent punches. This gradually
shrinks the rectangular box and thus compresses the sample.
(a) (b)
(c) (d)
Figure 6. Compression mechanism of the tri-
axial apparatus
Aligning the punches naturally becomes more cumbersome with decreasing
punch area. Moreover, insertion and removal of samples requires increasingly
more precision with lower initial volume of the cavity. A trade-off was there-
fore necessary, and a punch side length of 2 mm was aimed at. During a con-
ventional powder compaction procedure, the coordination number (i.e. the
number of particle contacts at a given instance) is not constant during the pro-
cess. Rather, the coordination number increases as the powder bed densifies
[49-51]. Constructing experimental equipment that accounts for large and in-
creasing coordination numbers would require an extraordinary degree of tech-
nological sophistication, and hence the apparatus is restricted to a maximal
coordination number of 6.
224.3 Apparatus design
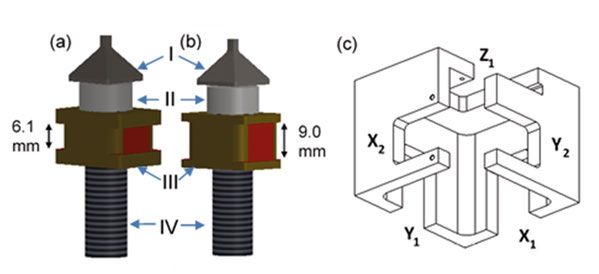
4.3.1 Original setup
Figure 7. Punch arrangements at X1, Y1, Z1 (a) and at X2, Y2 (b) in the
original setup. (c) depicts the original coordination device with the punch
positions indicated.
The punches (I, Figure 7) were fabricated from stainless steel and given a
broad conical base to stabilise the punch tip and to provide a site for attach-
ment of 500 N load cells (ELFF-500N-T2M, Measurement Specialities, Les
Clayes-sous-Bois, France) (II, Figure 7). In order to arrange the punches in
the desired configuration and to convey movements during compression, a
coordination device (Figure 7c) was designed, leaving an opening between X2
and Y2 for sample insertion. The punches were connected to the coordination
device by bronze pieces furnished with flanges (III, Figure 7). At three of the
punches (X1, Y1, Z1, Figure 7a), the distance between the flanges was 6.1 mm,
prohibiting sliding relative to the coordination device in the axial direction.
Instead, these punches move the entire coordination device upon compression.
Two of the punches (X2, Y2, Figure 7b) were provided with bronze pieces in
which the distance between the flanges were 9.0 mm, hence allowing for axial
sliding of about 3 mm. The sixth punch (Z2, not shown) was fixed in space,
and thus not attached to the coordination device.
For effectuating the movement along each axis, high precision linear actu-
ators with built-in position sensors and a loading capacity of 400 N were cho-
sen (M238.5PL, Physik Instrumente GmbH & Co, Karlsruhe/Palmbach, Ger-
many) (Figure 8). These were attached to the X1, Y1, Z1 punches by a threaded
segment (IV), whereas the remaining punches were attached in the same man-
ner to rigid aluminium cylinders. To hold actuators and cylinders in desired
positions, an outer frame was constructed (Figure 9). As with the punches,
23actuators and cylinders along each axis must be able to follow when a move-
ment is imposed along another axis. Therefore, the frame was furnished with
roll bearings, as visible in the figure.
Figure 8. Linear actuator.
Figure 9. The triaxial testing apparatus.
4.3.2 Modified setup
The coordination device in the original setup, used in Papers I-II, was rede-
signed prior to Paper III to increase the performance of the apparatus. The
mechanism involving sliding bronze pieces was replaced with a mechanism
Figure 10. Punch arrangements in the modified setup along with
the modified coordination device.
24where roll bearings were built into the coordination device (Figure 10d). In
addition to conveying movements in a manner analogous to that of the outer
frame, movements earlier carried by the bronze pieces at X2 and Y2 are here
conveyed by roll bearings in the axial directions.
The mechanism by which the punches are attached to the actuators and
rigid cylinders was also modified. Instead of connecting punch extensions di-
rectly to an actuator or a rigid cylinder, a joint (Figure 10c) was introduced,
by which the punch extensions are attached by a small screw seen at the front
side of the joint. At X2, Y2, Z2 (Figure 10a), the end piece of the punch exten-
sion was bevelled and accompanied by a wedge, enabling some degree of flex-
ibility when fixating the punch extension axially. The end pieces at X1, Y1, Z1
(Figure 10b) were made cylindrical and non-threaded, in turn allowing for
flexibility when fixating the punch extension angularly. Due to the fact that
the type of load cell used in the original setup were no longer manufactured
by the time of redesigning the punch extensions, new load cells of the type
ELAF-T1-M-500N-AC were used in the modified setup.
255 Numerical Methods
5.1 The finite element method
1
The finite element method (FEM) is a numerical method in which a material
segment is divided into smaller subdomains (finite elements) that are con-
nected to each other by mutual nodes, creating a mesh over the material seg-
ment (Figure 11). An external stress field can then be applied to the body,
after which the response is evaluated at each node and an interpolation proce-
dure is used to calculate values between nodes [52]. Hence, increasing the
number of elements gives higher accuracy, but also increases the computa-
tional cost. FEM analyses are common when modelling deformation of solid
materials, including spherical particles [9, 37, 38, 53]. When simulating the
compression of a spherical particle positioned in a simple cubic lattice, corre-
sponding to six equispaced contacts, the domain to be analysed can be reduced
to one eighth of a sphere due to symmetry conditions, which allows for a
denser mesh than if the whole sphere were to be modelled.
Figure 11. Finite element mesh employed in Paper III
265.2 Smoothed particle hydrodynamics
Like FEM, smoothed particle hydrodynamics (SPH) uses a Lagrangian mate-
rial description. However, SPH employs a smoothing kernel function instead
of the shape functions used in FEM. Whereas the nodes in a finite element
mesh are connected to adjacent nodes, the connectivity between SPH-particles
is determined by whether they are within the support domain of each other, as
governed by the smoothing kernel function [54]. As distances between mate-
rial points changes during deformation, the number of neighbours within the
support domain of a particle changes accordingly. This characteristic often
makes SPH preferable over the FEM when simulating procedures where large
deformations are expected, such as cracking [55, 56], since this may require
remeshing of the region of interest if a finite element procedure is used.
5.3 The discrete element method
The discrete element method (DEM) was introduced in 1979 by Cundall and
Strack [57] for modelling particle systems. In DEM simulations, particles are
generated as separate bodies with given positions and velocities. Each itera-
tion consists of detection of particle contacts and overlaps, from which contact
forces can be determined from the contact model in use and particle accelera-
tions calculated using Newton’s second law. At the end of each iteration, ac-
celerations are integrated to obtain updated particle velocities and positions
[58].
The usefulness of the DEM in reproducing powder behaviour has made it
suitable in modelling several powder processing steps, such as hopper flow
[59, 60], mixing [61] and fluid bed drying [62]. DEM modelling of bulk pow-
der compression was pioneered by Redanz and Fleck [63] and by Heyliger
and McMeeking [64] and has since been employed by a number of researchers
for the purpose [20, 65-67].
5.3.1 The extended truncated sphere model
As contact model in the DEM-simulations, a modified version of the extended
truncated sphere model [38, 68, 69] was used. The model builds on the as-
sumption that a particle under compression can be estimated as a truncated
sphere with an equivalent radius, as first suggested by Fischmeister and Arzt
[70]. This means that the model predicts no change in total solid volume due
to plastic deformation. Rather, plastic displacement at a contact causes a com-
pensatory increase in the particle radius. The force at a contact with surface
area is defined as
= × = ×2 ℎ, (6)
27where is the average contact pressure, ℎ is the overlap at contact and is
the radius of the truncated sphere.
The prediction of contact pressure can be divided into three domains. At
small deformations, the predicted deformation is purely plastic with the con-
tact pressure set equal to a material specific effective hardness ( ), whereas
the response at large deformations is purely elastic, governed by
= 1− , (7)
where is the bulk modulus and is the initial particle volume. is the
current particle volume, determined from a Voronoï polyhedron [71]; a
method introduced for modelling powder densification by Arzt [50] that has
since been utilised for the present purpose by e.g. Larsson et al [72] and by
Harthong et al [6]. At intermediate strains, the model utilises an interpolation
procedure to capture the transition between the two other domains.
For calibrating the model in Paper V, the following unified function from
small to large deformations was used:
( )
≃ 1 + ( − 1)exp − ( )
. (8)
Here, is a parameter that governs the rapidity of the transition between
purely plastic and purely elastic domains and is the volume of the Voronoï
cell below which the deformation becomes purely elastic.
286 Experimental methods
6.1 Granule fabrication and characterisation
The granules used for experiments in Papers II and IV were produced using a
extrudation-spheronisation procedure and chosen with regard to systems that
have earlier been investigated and mechanically characterised [69, 73, 74].
Microcrystalline cellulose (MCC) is a ductile material which is a common
pharmaceutical excipient. With the addition of lactose, another common phar-
maceutical excipient, a harder and more brittle granule type (MCC LAC) can
be generated [69, 75]. Polyethylene glycol (PEG) was added with the purpose
of creating a softer granule type [76]. When including ethanol in the granula-
tion liquid, a more rapid drying procedure is induced [77, 78], resulting in a
more porous granule type (MCC HP).The granule diameter as determined
from the area of a projected circle in the most stable configuration of the gran-
ule were between 1.64-1.82 mm (Table 1). The estimate of circularity of the
MCC HP granules was lower than for the other granule types, which can be
attributed to the rougher surface texture exhibited by these granules.
Table 1. Characteristics of granules used in Papers II and IV
Granule Median diameter Porosity Circularity
type (mm)* (%) (-)
MCC LP 1.63 (IQR=0.16) 13.7 (1.1) 0.881
(0.0007)
MCC HP 1.82 (IQR=0.22) 37.1 0.752
(0.86) (0.0023)
MCC PEG 1.75 (IQR=0.20) 12.6 0.864
(0.40) (0.0007)
MCC LAC 1.84 (IQR=0.23) 10.3 0.858
(0.37) (0.0007)
*IQR=Interquartile range
296.2 X-ray computed microtomography
Porous granules made from primary particles by some agglomeration proce-
dure are usually structurally irregular. Thus, assessing the internal structure of
these is of relevance. For the purpose, X-ray computed microtomography (mi-
cro-CT) has attracted increasing interest in recent years [79-82]. X-ray imag-
ing techniques make use of the difference in absorption between different me-
dia, with the traditional application being within medicine, employing the dif-
ference in X-ray absorption of bone and teeth compared the surrounding tissue
[83]. When imaging porous solids, the difference in absorption between solid
matter and air makes it possible to locate pores and density differences through
X-ray imaging [84].
The major difference between micro-CT and conventional 2D X-ray imag-
ing techniques is that the sample is rotated relative to the radiation source,
capturing a set of two dimensional images at several different angles. These
2D-slices are then used for mathematically reconstructing a three dimensional
image of the sample [83].
6.3 Bulk powder compression
One of the main purposes of the thesis is to relate the deformation character-
istics of the individual particles to those of a powder bed, for which confined
bulk powder compression is the process to be evaluated. During a bulk com-
pression experiment, the pressure can be measured at the boundary of the pow-
der bed. By using a relationship where the compression pressure is related to
the degree of compression, certain compression parameters can be evaluated.
One example of such a relationship is the Kawakita equation [85], which re-
lates the compression pressure ( ) to the degree of compression ( ) through
= + . (9)
Investigations of the physical meaning of the Kawakita parameters have
shown that the parameter is a measure of the maximal engineering strain,
whereas 1/ is a measure of the resistance to compression (i.e. the plastic
stiffness) of the powder [74, 86].
Another equation for analysis of bulk powder compression is the Heckel
equation [87], which has proven convenient for powders that are non-porous
and have an / -ratio higher than ~30 [88, 89]. The Heckel equation relates
the pressure to the relative density ( ) through
ln = + , (10)
30where the reciprocal of is known as the yield pressure ( ), ideally being a
measure of the material yield strength [90, 91].
317 Results and discussion
7.1 Performance of the triaxial testing apparatus
Initial triaxial (hydrostatic) compression experiments on lead and cellulose
acetate (CA) spheres with diameters of 2.0 mm rendered contact force curves
Figure 12. Typical uniaxial and triaxial compression curves on cellu-
lose acetate spheres along with curves from FEM simulations and
prediction from the theoretical Abbott-Firestone model.
that were clearly distinguished from those obtained from unconfined uniaxial
compression (Figure 12) and exhibited the characteristic shape observed for
confined triaxial compression of single particles in numerical studies [6, 38].
At ≈ 0.05, a softening effect was observed both for the uniaxial and the
triaxial case, demonstrating the onset of plastic zone coalescence, which was
not captured by the linear Abbott-Firestone model. For small and intermediate
deformations, the triaxial curve for CA (lead was not investigated
numerically) was perfectly captured by FEM simulations ( = 20 , =
37 [92], = 0.3). At large deformations, however, the numerical results
predicted a stiffer response than what was seen in the experiments. It was thus
suspected that the compression cell did not stay completely sealed as large
deformations were approached.
32As elaborated on in section 4.3, the inner coordination device was
redesigned prior to the experiments performed for Paper III. Figure 13 shows
average curves of contact force development from confined triaxial
compression under hydrostatic loading of CA using the original and the
modified setups, respectively. A considerable difference in contact force
development was thus observed, with a significantly stiffer response at large
deformations using the modified setup. The curves start to diverge at an
engineering strain of about 0.10, which is where particle confinement first
becomes pronounced, judging from Figure 12.
250
Contact force (N)
Modified setup
200 Original setup
150
100
50
0
0.00 0.05 0.10 0.15 0.20
Engineering strain, (-)
Figure 13. Average curves for hydrostatic compression experiments of CA using the
original and the modified setups of the triaxial testing apparatus.
7.2 Deformation characteristics of MCC-based granules
under triaxial compression (Paper II)
In Figure 14, typical curves from hydrostatic triaxial compression and
unconfined uniaxial compression of the granules are shown. As the arrows
indicate in graphs representing uniaxial compression experiments, there is a
sudden drop in contact force at a certain degree of engineering strain (~0.05
for MCC LP, MCC PEG and MCC LAC, ~0.10 for MCC HP). This drop,
associated with particle fragmentation, was completely absent in the triaxial
curves.
33Figure 14. Typical curves from triaxial (a) and uniaxial (b) compression experi- ments of MCC granules. When retrieving granules after certain degrees of triaxial compression, it could be observed that none of them showed any tendency to fragment (Figure 15). Rather, the granules were compacted to integral cubes, assuming the shape of the compression cell. However, cracks were observed in the regions between the contact surfaces, indicating that some cracking event takes place also dur- ing triaxial compression, but that fragmentation is impeded by the confined loading conditions. These results align well with previous studies where indi- vidual granules were retrieved after bulk powder compaction, exhibiting no tendency of fracturing, but with minor cracks in the regions between contact surfaces [93-95]. 34
0

                                                                            0.15

                                                                            0.20

                                                                            0.25

                                                                            0.25
                                                                        (             )

Figure 15. Light microscope images of granules before triaxial hydrostatic compres-
sion and at certain degrees of engineering strain.

                                                                                35
7.3 Onset and direction of cracking (Paper IV)
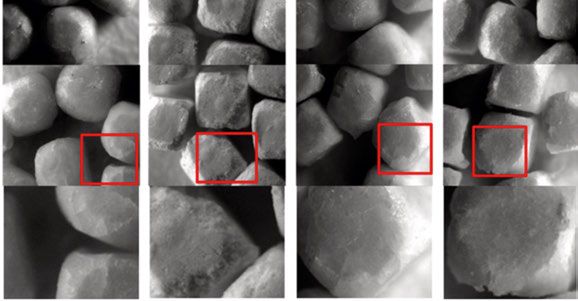
Figure 16. Micro-CT images depicting granules in a plane normal to the loading di-
rection before unconfined uniaxial compression, at primary fracture and at second-
ary fracture.
When examining MCC granules through micro-CT, it was noted that the dis-
tribution of pores differed considerably between the granule types (Figure 16),
something that most likely can be attributed to physico-chemical processes
occurring during drying, which vary depending on granule composition [77,
78]. Typically, MCC LP and MCC PEG granules had a large macropore at the
core but were denser towards the surface, whereas MCC HP and MCC LAC
had a more even pore distribution. Regardless of the size and location of the
largest pore, this pore had a pronounced effect on the path of the primary frac-
ture. However, neither the size, nor the position of the macropore influenced
the direction of the primary crack, which always occurred in the meridional
direction (in a plane parallel to the load), something that has earlier been ob-
served for unconfined uniaxial loading of other materials [79, 80, 96, 97].
Confined triaxial experiments using different triaxiality ratios (i.e. ratios
between horizontal and vertical loading rates, see Table 2) rendered similar
results in terms of crack direction: cracking always occurred in a plane parallel
to the dominant load, regardless of the triaxiality ratio. However, contrary to
unconfined uniaxial experiments, none of the cracks caused fragmentation of
the granule, even when retrieved from the compression cell directly after the
crack event (Figure 17). Hence, fragmentation appears to be impeded already
at low triaxiality ratios.
36Figure 17. Light microscope images of granules retrieved directly after the
cracking event. The dominant loading direction is in the vertical direction of the
paper. Arrows indicates the location of primary crack.
A numerical analysis of all the investigated loading cases with SPH expect-
edly showed that the largest principal stress was most tensile around pores
towards the dominant contact, which explains the direction and the path of the
cracks. However, comparing the uniaxial loading case with the triaxial loading
cases, it was clearly observable that already at low degrees of triaxiality, ten-
sile stresses were to a considerable extent replaced by compressive stresses,
which largely explains why no fragmentation occurs under confined triaxial
loading conditions.
Figure 18. Results from SPH simulations showing the distribution of the largest
principal stress in a plane tangential to the dominant loading direction, representing
granules with two different macropore sizes. Positive values indicate tension.
37Table 2. Characteristics of the loading conditions used in Paper IV
Loading con- Loading rate x Loading rate y Loading rate z
dition (horizontal) (horizontal) (vertical)
(mm/min) (mm/min) (mm/min)
1:2 1.2 mm/min 1.2 mm/min 2.4 mm/min
1:5 1.2 mm/min 1.2 mm/min 6.0 mm/min
1:10 1.2 mm/min 1.2 mm/min 12 mm/min
7.4 Influence of different loading ratios (Paper III)
In Paper III, hydrostatic compression and 8 additional loading ratios (identical
to those studied in [38], see Table 3 for details) were investigated experimen-
tally and numerically (FEM; 16 000 tetrahedral elements) on spherical CA
(d=2.0 mm) and PTFE (d≈1.59 mm). The experimental data (left column in
Figure 19) were accurately reproduced by simulations (right column in Figure
19) after the inclusion of a strain hardening term ( ; values provided in
Table 4) [98] in the von Mises yield criterion.
As seen in Figure 19 (results shown for CA; the same trends were observed
for PTFE), a straightforward force-displacement presentation of the results
rendered curves that follow a mutual master curve under initial plastic defor-
mation (not drawn, but for CA approximately equal to the Abbott-Firestone
(AF) curve) from which they departed at different strains, depending on load-
ing case and whether the contact was dominant (most deformed) or secondary
(least deformed). A more unified approximation was obtained by introducing
the following volumetric constraint:
= , (11)
where , and are the original, current and final volume, respectively, of
the compression cell. When plotted against a nominal contact pressure calcu-
lated as the contact force divided by the available punch surface, the curves in
Figure 20 were obtained. Such a description rendered similar nominal contact
pressures for all loading cases at small and large deformations. At intermedi-
ate deformations, somewhat stiffer responses were observed for dominant
than for secondary contacts; a difference that increases with loading ratio.
385:5:5 AF 5:5:5
5:5:1 (d) 5:5:1 (s) 5:5:1 (d) 5:5:1 (s)
300 5:5:2 (d) 5:5:2 (s) 300 5:5:2 (d) 5:5:2 (s)
5:5:3 (d) 5:5:3 (s) 5:5:3 (d) 5:5:3 (s)
5:5:4 (d) 5:5:4 (s) 5:5:4 (d) 5:5:4 (s)
200 200
100 100
0 0
0.0 0.1 0.2 0.3 0.0 0.1 0.2 0.3
Figure 20. Results from experiments (left) and simulations (right) done
on CA in Paper III, along with the fully plastic Abbott-Firestone (AF)
model. Parentheses in labels indicate whether the curve represents a dom-
inant or secondary contact.
Figure 19. The results presented in Figure 19 described using a volumetric
constraint and a nominal contact pressure.
39Table 3. Characteristics of the loading conditions investigated in Paper III
Loading condition Loading rate Loading rate Loading rate
x (mm/min) y (mm/min) z (mm/min)
5:5:5 (hydrostatic) 1.2 1.2 1.2
5:5:4 1.5 1.5 1.2
5:5:3 2.0 2.0 1.2
5:5:2 3.0 3.0 1.2
5:5:1 6.0 6.0 1.2
5:4:4 1.5 1.2 1.2
5:3:3 2.0 1.2 1.2
5:2:2 3.0 1.2 1.2
5:1:1 6.0 1.2 1.2
Table 4. Parameters used in FEM simulations in Paper III
(mm) (GPa) (-) (MPa) (MPa) (-)
CA 1.0 4.0 0.4 37 2.4 1.25
PTFE 0.8 0.5 0.46 15 2.4 1.25
407.5 Calibration and evaluation of a DEM model (Paper V)
When the results obtained for CA in Paper III are described using the extended
truncated sphere model and plotted against the relative specific volume, i.e.
the ratio between the volumes of the compression cell and the particle, the
grey curves starting at the right end of the graph in Figure 21 are obtained.
Although large variations in initial contact pressure, the curves tend collapse
into a mutual master curve at larger deformations. In Figure 21, the curve used
to calibrate the extended truncated sphere model is shown in bold black. After
assuming a reasonable value of the bulk modulus [99], the curve was fitted in
such a way that it rendered as close to an average curve as possible, with the
extracted parameters shown in Table 5. As previously established, a good es-
timate is obtained when the effective hardness parameter ( ) is set to around
60% of the initial hardness [69], which corresponds well to the value obtained
in the calibration procedure (67 MPa).
Figure 21. Calibration of the extended truncated sphere model
Table 5. Parameters extracted from calibration of the contact model
Meaning Symbol Value
Effective hardness 67.0 MPa
Bulk modulus 11.0 GPa
Parameter in pressure expression 9.7
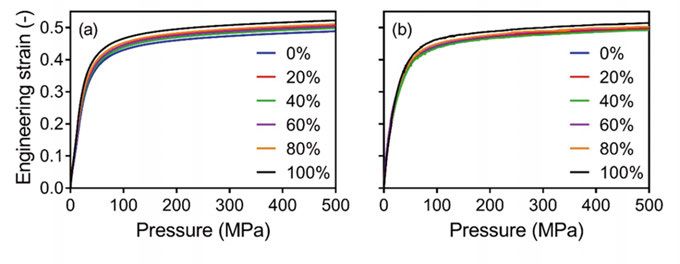
41The calibrated model was evaluated by implementing it in DEM-simulations
of bulk powder compression of a series of bimodal mixtures of spherical CA
particles with diameters of 1.5 and 2.0 mm. A comparison of the thus obtained
compression profiles to experimental results revealed a high degree of simi-
larity (Figure 22), with the compression profiles from simulations being
slightly less dependent on composition.
Figure 22. Typical compression profiles obtained from experiments (a) and
simulations (b) in Paper V. Labels indicate weight fraction of large particles.
(a) (b)
Figure 23. Kawakita a and 1/b parameters for the different bimodal compositions
Figure 24 - Heckel yield pressure for the dif-
ferent bimodal compositions.
42When analysing the compression parameters, the trend for simulations were
generally similar to those earlier observed for bimodal mixtures of other ma-
terials [100], with values attaining maximum/minimum values (depending on
parameter) at intermediate compositions. This trend was also exhibited by the
experimental data for the Kawakita 1/ parameter (Figure 23b), whereas the
Kawakita parameter (Figure 23a) and the Heckel yield pressure (Figure 24)
increased with weight fraction of large particles.
Notwithstanding the slightly different trends, the correspondence between
experiments and simulations for the parameter is nearly ideal. For 1/ and
, the differences between experiments and simulations are larger, yet only
in the magnitude of 5-10%. In addition, the average values of were similar
for experiments and simulations, and close to tabulated values of yield
strength for CA [101]. All in all, the results in Paper V show that simulations
of bulk compression can be done with high accuracy by calibrating a contact
model with data from confined triaxial compression experiments.
438 Conclusions
In the work underlying the present thesis, a novel apparatus for confined tri-
axial compression of individual granules in the mm-scale has been success-
fully designed and constructed. Results obtained from experiments using the
apparatus have been well-reproduced by the different numerical and analytical
models employed in the thesis work. Specifically, the following findings
should be emphasised:
• Pharmaceutical granules, which usually fragment under unconfined uni-
axial load, tend to remain integral when subjected to multiaxial loading.
This phenomenon has earlier been observed for individual granules after
bulk compression but has here been studied in further detail and in con-
junction with the contact force during deformation.
• The primary crack in a granule under load tends to always occur in the
meridional direction (parallel to the dominant loading direction), regard-
less of the position and size of intragranular pores. However, the location
and shape of the largest pore highly influences the path that the crack
takes.
• Meridional cracking also takes place under triaxial loading conditions.
However, the triaxial stress impedes the event of fragmentation already at
low degrees of triaxiality, which cause the granules to keep their integrity.
• The force development at a contact is highly dependent on the loading
conditions and how the individual contact is influenced by the rest of the
contacts on the particle. By describing the contact pressure as a function
of the relative volume of the triaxial compression cell, curves that are
largely independent of these factors can be obtained.
• A further improvement was obtained when the contact pressure was de-
scribed using the extended truncated sphere model. After calibration of
the model with the extracted parameters, implementation in DEM-simu-
lations for bulk powder compression showed highly promising results –
proving the utility of the apparatus in contact model development.
449 Future perspective
Establishing an experimental method for confined triaxial compression of
particles in the mm-scale reveals a whole field of possible investigations of
which the present thesis has just scratched the surface. For example, one ob-
vious application of the apparatus is in more applied research, where materials
used in commercial compacts are characterised under conditions imposable
by the apparatus.
The coordination number of a particle is never constant during compaction.
It would therefore be of interest to evaluate the emergence of new interparticle
contacts during the compression procedure, such that has been done numeri-
cally by Tsigginos et al [37].
Another interesting approach, which would be feasible but demand a more
meticulous precision during the sample loading sequence, is to expand the
analysis beyond the domain of individual particles and examine how different
packings (e.g. simple cubic and body centred cubic) deform under triaxial
load.
Finally, if a way is found to insert entire powder samples, the triaxial testing
apparatus is virtually ideal for calibrating constitutive models (e.g. Drucker-
Prager Cap) for bulk powder compression, something that otherwise requires
rather large amounts of material.
45You can also read