Constitutive Musashi1 expression impairs mouse postnatal development and intestinal homeostasis
←
→
Page content transcription
If your browser does not render page correctly, please read the page content below
MBoC | ARTICLE

Constitutive Musashi1 expression impairs mouse
postnatal development and intestinal
homeostasis
Thelma T. Chiremba and Kristi L. Neufeld*
Department of Molecular Biosciences, University of Kansas, Lawrence, KS 66045

ABSTRACT Evolutionarily conserved RNA-binding protein Musashi1 (Msi1) can regulate de-                                         Monitoring Editor
velopmentally relevant genes. Here we report the generation and characterization of a mouse                                    Néstor Oviedo
                                                                                                                               University of California, Merced
model that allows inducible Msi1 overexpression in a temporal and tissue-specific manner.
We show that ubiquitous Msi1 induction in ∼5-wk-old mice delays overall growth, alters or-                                     Received: Mar 26, 2020
gan-to-body proportions, and causes premature death. Msi1-overexpressing mice had short-                                       Revised: Sep 1, 2020
ened intestines, diminished intestinal epithelial cell (IEC) proliferation, and decreased growth                               Accepted: Nov 3, 2020
of small intestine villi and colon crypts. Although Lgr5-positive intestinal stem cell numbers
remained constant in Msi1-overexpressing tissue, an observed reduction in Cdc20 expression
provided a potential mechanism underlying the intestinal growth defects. We further demon-
strated that Msi1 overexpression affects IEC differentiation in a region-specific manner, with
ileum tissue being influenced the most. Ilea of mutant mice displayed increased expression of
enterocyte markers, but reduced expression of the goblet cell marker Mucin2 and fewer Pa-
neth cells. A higher hairy and enhancer of split 1:mouse atonal homolog 1 ratio in ilea from
Msi1-overexpressing mice implicated Notch signaling in inducing enterocyte differentiation.
Together, this work implicates Msi1 in mouse postnatal development of multiple organs, with
Notch signaling alterations contributing to intestinal defects. This new mouse model will be
a useful tool to further elucidate the role of Msi1 in other tissue settings.

INTRODUCTION
Most metazoans develop from a single fertilized egg that divides                        external developmental cues, regulates the biological events that
repeatedly to produce an embryo with pluripotent stem cells capa-                       occur during embryonic and fetal development (Wilczynski et al.,
ble of forming the diverse tissue structures of an organism. Precise                    2012). Proper coordination of cellular processes such as cell pattern-
spatial and temporal gene expression, in response to internal and                       ing, proliferation, differentiation, and survival is crucial for normal
                                                                                        tissue development and functioning. As such, perturbations in the
This article was published online ahead of print in MBoC in Press (http://www
                                                                                        genetic control systems governing these cellular processes can have
.molbiolcell.org/cgi/doi/10.1091/mbc.E20-03-0206) on November 11, 2020.                 deleterious effects on a developing organism or on the health of an
ORCID: 0000-0003-3653-9385.                                                             adult. For example, dysregulated gene expression is associated
*Address correspondence to: Kristi L. Neufeld (klneuf@ku.edu)                           with various birth defects (Bittel et al., 2011) and cancers (Sanz-
Abbreviations used: APC, Adenomatous polyposis coli; cDNA, complementary                Pamplona et al., 2014). Therefore, identifying and characterizing
DNA; CDS, coding sequence; Ct, cycle threshold; CTCF, corrected total cellular
fluorescence method; Chga, chromogranin A; Cre, Cre-recombinase; dpi, days              molecular regulators of gene expression could illuminate potential
postinjection; ERT2, tamoxifen-inducible estrogen receptor; ES, embryonic stem;         therapeutic targets for human diseases.
Hes1, hairy and enhancer of split 1; IEC, intestinal epithelial cell; ISC, intestinal
                                                                                            RNA-binding proteins (RBPs) are now appreciated as essential
stem cell; Jag1, Jagged1; Lac, lactase; Math1, mouse atonal homolog 1; Muc2,
Mucin2; Msi1, Musashi1; PBS, phosphate-buffered saline; RBP, RNA-binding pro-           players in the posttranscriptional control of gene expression. One
tein; RMCE, recombination-mediated cassette exchange; Sis, sucrase-isomaltase;          such RBP is Musashi1 (Msi1), an evolutionary conserved RBP that
TAM, tamoxifen; UBC, ubiquitin; UTR, untranslated region.
                                                                                        was originally discovered in Drosophila melanogaster (Nakamura
© 2021 Chiremba and Neufeld. This article is distributed by The American Society
for Cell Biology under license from the author(s). Two months after publication it      et al., 1994) and has homologues in mouse (Sakakibara et al., 1996),
is available to the public under an Attribution–Noncommercial–Share Alike 3.0           human (Good et al., 1998), rat (Nagata et al., 2006), and zebrafish
Unported Creative Commons License (http://creativecommons.org/licenses/by-
nc-sa/3.0).
                                                                                        (Shibata et al., 2012) to name a few. Mammalian Msi1 regulates vari-
“ASCB®,” “The American Society for Cell Biology®,” and “Molecular Biology of            ous RNA metabolic processes through binding to motifs in the cod-
the Cell®” are registered trademarks of The American Society for Cell Biology.          ing sequences (CDS), introns, and untranslated regions (UTRs) of

28 | T. T. Chiremba and K. L. Neufeld                                                                                              Molecular Biology of the Cell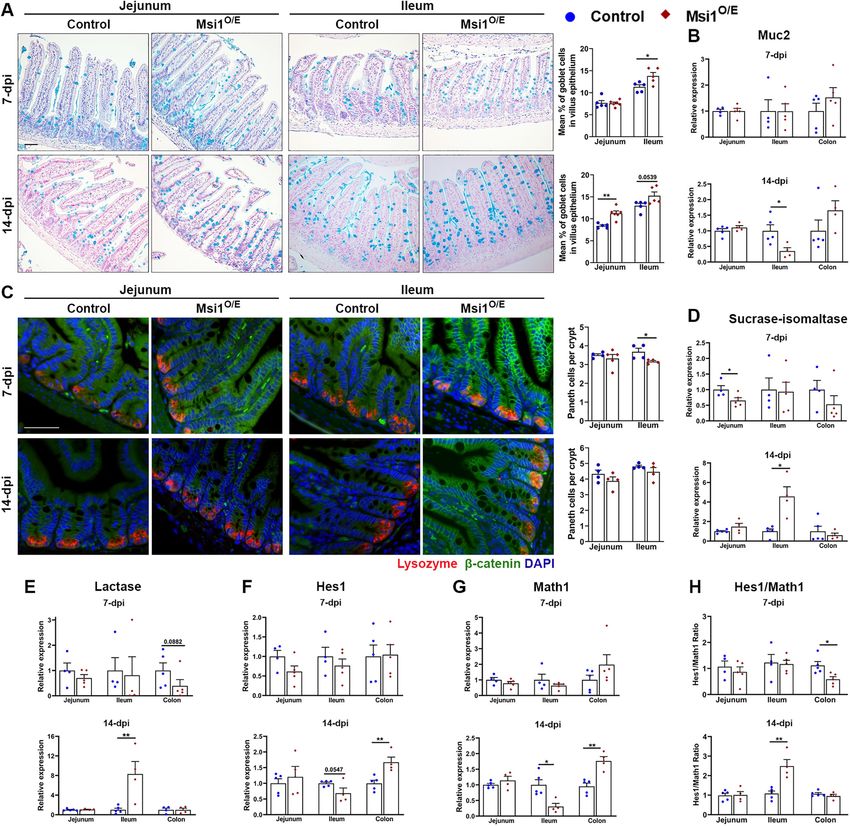
target mRNAs (Imai et al., 2001; Ohyama et al., 2012; Katz et al.,             Over 80% of colorectal cancers have inactivating mutations in
2014; Zearfoss et al., 2014; Li et al., 2015; Uren et al., 2015). The      the Adenomatous polyposis coli (Apc) gene, which encodes a tumor
best-characterized role of mammalian Msi1 is in translational repres-      suppressor and Wnt signaling antagonist. Msi1 is highly up-regu-
sion of targets (Imai et al., 2001; Battelli et al., 2006; Spears and      lated in mouse intestinal tissue on Apc loss (Sansom et al., 2004)
Neufeld, 2011; Katz et al., 2014; Li et al., 2015; Chen et al., 2017).     and in intestinal tumors expressing mutated Apc (Potten et al.,
Msi1 interacts with sequence-specific motifs in the 3′-UTRs of target      2003). These results, together with the identification of Msi1 as a
mRNAs and competes with elF4G for interaction with the poly(A)-            Wnt target gene (Rezza et al., 2010), led us to consider if a functional
binding protein, consequently inhibiting translation initiation (Kawa-     relationship exists between Msi1 and Apc. Our previous in vitro
hara et al., 2008). It has also been shown that Msi1 can stabilize RNA     studies demonstrated that APC mRNA is a target of MSI1 and re-
(Cambuli et al., 2015; Nahas et al., 2016), promote translation (Ku-       vealed a mutual-inhibitory relationship between MSI1 and APC in
wako et al., 2010; Uren et al., 2015; Cragle et al., 2019; Lin et al.,     human colonocytes that express wild-type APC (Spears and Neufeld,
2019), and influence alternative splicing (Li et al., 2015; Uren et al.,   2011). We proposed that this relationship is critical for maintaining a
2015; Murphy et al., 2016) of direct targets. In addition, numerous        balance between proliferation and differentiation of intestinal epi-
direct mRNA targets of Msi1 that are involved in key cellular pro-         thelial cells (IECs) and is disrupted in intestinal tumors expressing
cesses such as cell cycle, proliferation, metabolism, survival, and        truncated Apc.
migration have been identified using both in vitro and in vivo sys-            Our original intention of generating an inducible Msi1 gain-of-
tems (de Sousa Abreu et al., 2009; Vo et al., 2012; Li et al., 2015;       function mouse model was to characterize the oncogenic proper-
Uren et al., 2015). However, the regulatory effects of Msi1 on the         ties of Msi1 in an in vivo setting. Given the broad range of cancers
majority of those targets have yet to be fully determined.                 that exhibit up-regulation of Msi1, we also aimed to develop a
    Msi1 expression is enriched in stem and progenitor cells of vari-      mouse model that could be a valuable tool to the field as a whole
ous mammalian tissues including brain (Sakakibara et al., 1996),           in delineating the pathological functions of Msi1 in cancers origi-
mammary (Clarke et al., 2005), hair (Sugiyama-Nakagiri et al.,             nating from different tissues. Unexpectedly, we identified altered
2006), stomach (Nagata et al., 2006), pancreas (Szabat et al., 2011),      organ and animal size in our tamoxifen (TAM)-inducible ubiquitous
testis (Sutherland et al., 2014), and intestine (Kayahara et al., 2003).   Msi1-overexpressing mice and therefore embarked on a study to
The expression pattern of Msi1 and its large pool of developmen-           determine the effects of Msi1 overexpression on postnatal devel-
tally relevant target mRNAs implicate Msi1 in tissue development           opment. Here we report that young transgenic mice ubiquitously
and in the renewal of adult tissues. For example, targeted Msi1            expressing Msi1 failed to thrive and died prematurely. These mice
disruption in the developing mouse brain resulted in obstructive           had stunted body and organ sizes and shorter intestines, indicating
hydrocephalus, improper cell proliferation and differentiation             that ectopic Msi1 expression disrupted their normal postnatal de-
(Sakakibara et al., 2002), and impaired neural cell motility (Kuwako       velopment. Our data show that Msi1 up-regulation had varying ef-
et al., 2010). Moreover, Msi1 deficiency diminished regeneration of        fects on IEC differentiation along the proximal-to-distal axis of
the intestinal epithelial tissue following irradiation-induced injury in   mouse intestines, suggesting that Msi1 has region-specific func-
adult mice (Yousefi et al., 2016). The importance of Msi1 in early         tions in the intestine. It is worth noting that while this study was
development is further emphasized by findings that Msi1 expres-            underway, Cambuli et al. (2015) and Li et al. (2015) generated and
sion is higher in some embryonic tissues, for example, in mouse            characterized two distinct Msi1 gain-of-function mouse models.
brain, but decreases as the organism matures (Sakakibara et al.,           Notably, our findings both confirm and conflict with the intestinal
1996).                                                                     phenotypes observed in these studies.
    Aberrant Msi1 expression has been implicated in the pathogen-
esis of several human cancers, including glioblastoma (Muto et al.,        RESULTS
2012; Vo et al., 2012; Uren et al., 2015; Chen et al., 2017), colorectal   Generation of conditional and inducible
(Sureban et al., 2008; Li et al., 2015), breast (Wang et al., 2010; Lag-   Msi1-overexpressing mice
adec et al., 2014), lung, and prostate cancers (Katz et al., 2014).        Up-regulated Msi1 levels have been detected in tumors originating
Most of these tumors exhibit Msi1 levels higher than that of unin-         from many tissues including colon and brain (Sureban et al., 2008;
volved tissue, implicating up-regulated Msi1 expression and activity       Katz et al., 2014; Chen et al., 2017). To study the consequences of
in driving oncogenesis. The potential oncogenic effects of Msi1            Msi1 up-regulation in a living organism, we developed a double-
were supported by evidence that Msi1 overexpression can trans-             transgenic mouse model that enabled conditional and inducible
form normal cells. Exogenous Msi1 expression in cultured primary           overexpression of Msi1, dependent on Cre-recombinase (Cre) ac-
rat intestinal cells enhanced cell proliferation, activated Wnt and        tivity (Figure 1). Briefly, a Msi1 transgene, controlled by a strong
Notch signaling pathways, and induced tumors in a xenograft                promoter, but with a loxP-flanked transcription termination se-
mouse model (Rezza et al., 2010). In contrast, the knockdown of            quence blocking expression, was inserted into the Rosa26 locus
Msi1 impaired growth of xenografts derived from different cancer           (Figure 1A; Supplemental Figure S1A). These “Rosa26Msi1/Msi1”
cell lines (Sureban et al., 2008; Wang et al., 2010; Muto et al., 2012;    mice can be bred with mice that express active Cre to induce Msi1
Vo et al., 2012), indicating that Msi1 up-regulation is essential for      overexpression. For the current study, homozygous Msi1 trans-
sustaining cancer cell proliferation and growth. Furthermore, high         genic mice were bred with hemizygous ubiquitin (UBC)-Cre-tamox-
Msi1 expression increased the growth of mouse intestinal organoids         ifen-inducible estrogen receptor (ERT2) mice which express an inac-
(Cambuli et al., 2015; Li et al., 2015). In addition, elevated Msi1        tive form of Cre in all cells under the control of the ubiquitin
promoted cell migration (Uren et al., 2015; Chiou et al., 2017; Gong       promoter (Figure 1B; Ruzankina et al., 2007). We utilized a whole-
et al., 2017) and augmented chemoresistance (Chen et al., 2016;            body mouse model for Msi1 overexpression because we were in-
Chiou et al., 2017) of various cancer cell types. Taken together,          terested in the potential for tumorigenesis in any tissue. Following
these studies show that independent manipulation of Msi1 expres-           Cre activation with a single TAM injection, double-transgenic mice
sion can alter cell biology and thus implicate Msi1 as a potential         (Rosa26Msi1/+;UBC-CreERT2) overexpressed Msi1 ubiquitously. Lit-
therapeutic target.                                                        termate control mice (Rosa26Msi1/+) were heterozygous for the Msi1

Volume 32 January 1, 2021                                                                        Msi1 impairs development, gut homeostasis   | 29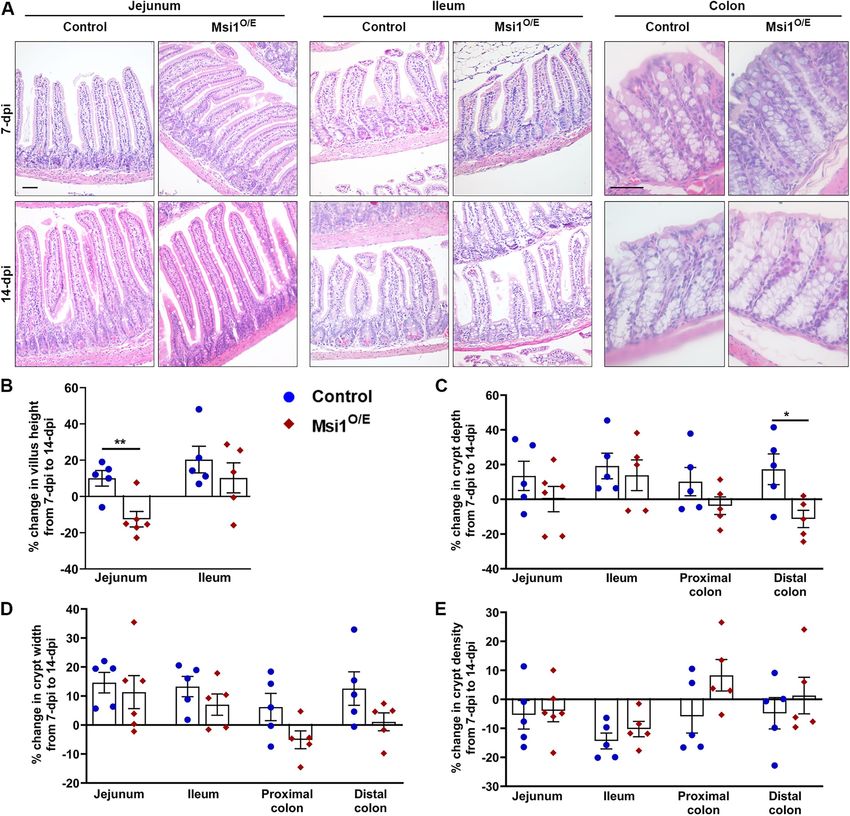
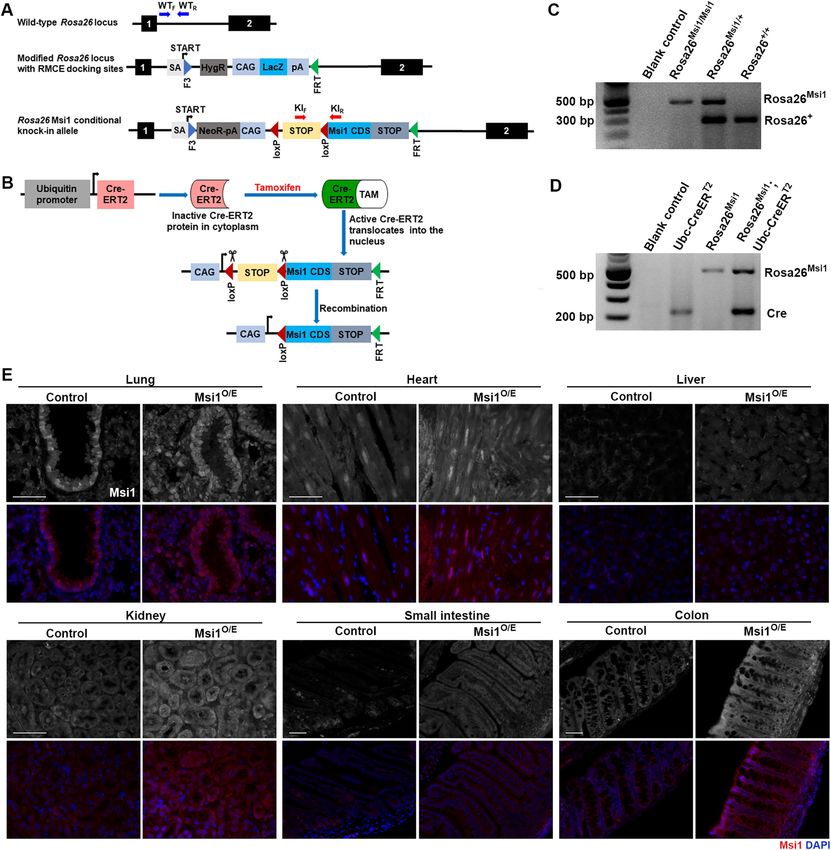
FIGURE 1: A knock-in mouse model for inducible Msi1 overexpression. (A) Schematic representation of CAG-loxP-
STOP-loxP-Msi1CDS-STOP transgene insertion into a modified Rosa26 locus equipped with F3/FRT-RMCE docking sites.
Binding sites for primers used in genotyping are shown (not to scale). (B) Strategy for Cre-mediated recombination of
the Rosa26 Msi1 conditional knock-in allele. Genotyping analysis by PCR and gel electrophoresis for (C) Msi1 knock-in
and (D) Cre transgenes. For blank controls, nuclease-free water was added to the PCR mix in place of mouse genomic
DNA. (E) Representative immunofluorescence images for Msi1 (gray, red) and DAPI (blue) in various tissues harvested
from 3-dpi mice. Scale bars, 50 µm.

transgene (Figure 1, C and D), but were UBC-CreERT2 null; there-            For our initial analysis, mice were given one intraperitoneal injection
fore, they expressed only endogenous Msi1 even after TAM injec-         of TAM at 4–5 wk of age and then sacrificed 3 days (d) later (days
tion. Single- and double-transgenic mice were phenotypically in-        postinjection, dpi). Immunofluorescence analysis showed elevated
distinguishable before TAM administration. For simplification,          Msi1 protein levels in lung, heart, liver, kidney, small intestine, and colon
TAM-injected Rosa26Msi1/+ and Rosa26Msi1/+;UBC-CreERT2 mice will        tissues of Msi1O/E mice when compared with controls (Figure 1E). Ubiq-
be referred to as control and Msi1O/E (Msi1-overexpressing) mice,       uitous up-regulation of Msi1 was more pronounced in the kidney, small
respectively.                                                           intestine, and colon epithelia of Msi1O/E mice relative to other tissues.

30 | T. T. Chiremba and K. L. Neufeld                                                                                  Molecular Biology of the Cell
Taken together, these results indicate efficient Msi1 induction as      we focused the rest of our study on analyzing the effects of Msi1
early as 3 d following TAM administration and show the successful          overexpression in the intestinal epithelium. It has been reported that
generation of an inducible Msi1 knock-in transgenic mouse.                 TAM and its active metabolite, N-desmethyltamoxifen, are cleared
                                                                           out of mouse brain at 7 dpi (Jahn et al., 2018). To avoid confounding
Severe growth retardation in Msi1-overexpressing mice                      results that could be caused by residual TAM or CreERT2 genome
After confirming efficient Msi1 overexpression in various tissues of       toxicity (Valny et al., 2016; Bohin et al., 2018), we did not analyze the
our TAM-injected double-transgenic mice, we set up a long-term             intestinal phenotype at time points earlier than 7 dpi. Furthermore,
experiment to determine whether Msi1 overexpression could in-              the gut–brain axis can influence intestinal functioning and pathol-
duce tumor development in tissues that display elevated Msi1 ex-           ogy (Gue et al., 1997; Tache and Perdue, 2004) and since Msi1 is
pression during human tumorigenesis. Unexpectedly, ubiquitous              expressed in the central nervous system of postnatal and adult mice
Msi1 up-regulation resulted in lethality in 15% of the mice by 14 dpi      (Sakakibara and Okano, 1997), the 7-day wait period was essential
at which time all mice were killed because many had lost ∼20% of           for accurate comparison of the intestinal phenotypes of control and
their body weight and appeared morbid. The 14-day period from              Msi1O/E mice.
TAM injection to tissue harvesting was too short for analysis of po-           It is well established that there is heterogeneity in tissue mor-
tential tumor formation; therefore, we examined consequences of            phology, cell populations, and gene expression along the proximal-
ubiquitous Msi1 overexpression on overall postnatal development            to-distal axis of mouse intestinal tissue. Therefore, we examined ef-
of mice.                                                                   fects of Msi1 overexpression on the jejunum, ileum, and colon as
    Although all mice had positive growth during the initial week fol-     separate entities.
lowing TAM-administration, weights of the Msi1O/E mice lagged be-              First we analyzed Msi1 RNA and protein expression in the intes-
hind their littermate controls (Figure 2A). Unexpectedly, we ob-           tinal epithelial tissue. Elevated Msi1 mRNA levels were confirmed in
served growth retardation in Msi1O/E mice starting at 2 dpi, with          IECs isolated from jejunum, ileum and colon segments of Msi1O/E
drastic weight loss from 10 dpi onward. When compared with con-            mice compared with their injected control littermates (Figure 3A).
trols, Msi1O/E mice had significantly lower body weights and shorter       Furthermore, immunofluorescent staining showed increased Msi1
body lengths at 14 dpi (Figure 2, B and C). This stunted growth            protein levels in intestinal tissue sections of Msi1O/E mice (Figure 3B).
phenotype was further emphasized by significantly shorter intes-           Bright fluorescent signal in the villi stroma of both control and
tines at 7 and 14 dpi (Figure 2, D and E) and significantly smaller        Msi1O/E mice was due to nonspecific tissue autofluorescence (white
organs at 14 dpi (Figure 2F).                                              arrows, Figure 3C) and absent from the intestinal epithelium.
    Although Msi1O/E mice showed a global decrease in body size,               We observed that recombination of the Msi1 knock-in transgene
the reduction was not uniform as seen by their differentially altered      approached but did not reach 100% efficiency. We provide, as an
organ proportions (Figure 2, G and H, and Supplemental Figure S2).         example, an image of small intestinal tissue of Msi1O/E, which dis-
When organ weights were normalized to body weights and then                played some areas of low Msi1 protein expression (within the
expressed as a percentage of similarly normalized organ propor-            dashed-white line, Figure 3D) comparable to endogenous Msi1 lev-
tions in wild-type mice, the spleen and lung proportions were sig-         els in control tissue. This mosaicism was not surprising, given recom-
nificantly lower in the Msi1O/E mice by 14 dpi (Figure 2H). In contrast,   bination efficiencies reported for other Cre-LoxP systems (Ruzankina
Msi1 overexpression resulted in increased relative brain size. There       et al., 2007).
were no differences in the normalized sizes of heart, kidney, and              To determine whether the transgenic Msi1 protein in Msi1O/E
thymus. Compared to control mice, small intestinal length to body          mice was functioning properly, we analyzed Jagged1 (Jag1) expres-
length proportions of Msi1O/E mice were significantly reduced at           sion. Jag1 mRNA is a validated Msi1 target; Msi1 binds to Jag1
both 7 and 14 dpi (Figure 2G). The colon proportions also trended          mRNA and inhibits its translation, resulting in diminished Jag1 pro-
to be reduced in Msi1O/E mice, but were not statistically different        tein levels (Katz et al., 2014). We performed immunofluorescence
from littermate controls. Notably, only the liver and small intestine      staining for Jag1 and observed a significant decrease in Jag1 pro-
proportions were significantly altered in Msi1O/E mice at 7 dpi, with      tein expression and fluorescence intensity in colon epithelia at 7 dpi
the liver proportion being larger (Figure 2H).                             (Figure 4, A and B). These results are consistent with Jag1 response
    TAM toxicity and mere activation of Cre have each been linked          to Msi1-overexpression in mouse neural stem cells (Katz et al., 2014)
to various phenotypes in mice (Huh et al., 2012; Bohin et al., 2018).      and indicate that the Msi1 transgene is functioning as expected.
To investigate this possibility, we analyzed body and organ sizes of
TAM-injected C57BL/6 wild-type mice either with or without the             Msi1 overexpression results in subtle effects on intestinal
UBC-CreERT2 transgene (Supplemental Figure S3). No significant             crypt and villi architecture
differences in body weight, body length, intestinal lengths, or organ      To assess whether the shorter intestines in Msi1-overexpressing mice
weights were observed at 14 dpi, indicating that TAM administra-           were related to changes in the overall structure of the intestinal
tion or Cre expression alone was not sufficient to cause the stunted       epithelium, we analyzed crypt and villi morphology. Histological anal-
growth pattern we observed in Msi1O/E mice. Therefore, we con-             yses of hematoxylin and eosin-stained tissue showed no overt differ-
clude that the ubiquitous overexpression of Msi1 in developing             ences between control and Msi1-overexpressing mice (Figure 5A),
mice results in severe growth retardation that is characterized by         indicating that normal gross crypt-villi architecture was maintained in
altered body and organ sizes.                                              the intestinal epithelial tissue of Msi1O/E mice.
                                                                               Intestinal development during the first 6 weeks of postnatal life
Analysis of transgene expression and function in Msi1O/E                   in wild-type C57BL/6 mice is characterized by a gradual increase in
intestinal epithelia                                                       small intestine length, crypt depth, and villus height (Dehmer
Our previous studies suggested a potential role for Msi1 in the regu-      et al., 2011). Therefore, we measured these parameters, along
lation of IEC functions (Spears and Neufeld, 2011). Given that the         with crypt width and density, in order to assess contributions of
small intestines of Msi1O/E mice were the only tissues that showed         Msi1 to intestinal tissue development (Supplemental Table S1).
significantly altered sizes at both 7 and 14 dpi (Figure 2, D and G),      Analysis of size changes between 7 and 14 dpi revealed that villi

Volume 32 January 1, 2021                                                                        Msi1 impairs development, gut homeostasis    | 31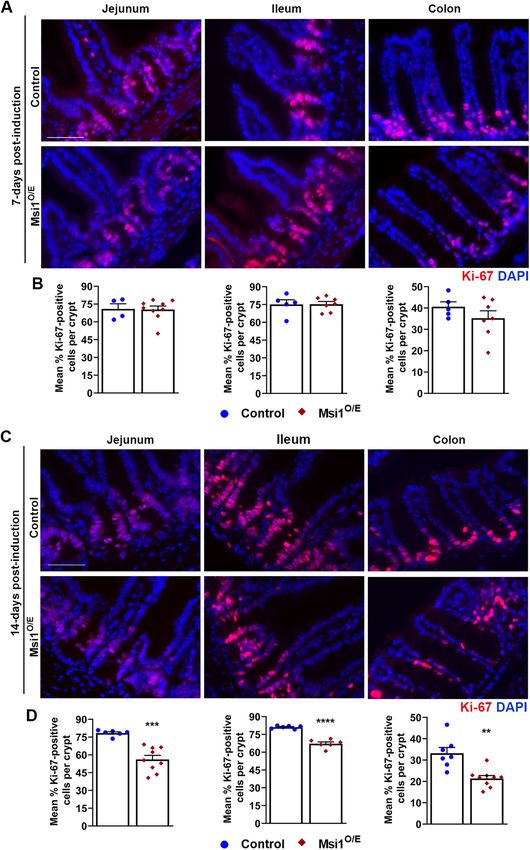
FIGURE 2: Gross morphology of Msi1-overexpressing mice. (A) Daily growth curve of mice from 0 to 14 dpi. Control
(blue circle), n = 9, Msi1O/E (red diamond), n = 8. (B) Body weight, (C) body length, (D) small intestine length, (E) colon
length, and (F) organ weights at 7 and 14 dpi. For B–F, each mouse is shown as individual blue circle (control) or red
diamond (Msi1O/E). (G, H) Normalized organ proportions of Msi1O/E mice at 7 and 14 dpi as a percentage of control
littermate proportions. Dashed line at 100% represents normalized organ proportions of control mice. Graphical data
represent mean ± SEM for each genotype (7 dpi, n = 11–26, 14 dpi, n = 11–20 mice). All data were analyzed using an
unpaired two-tailed t test. *p < 0.05, **p < 0.01, ***p < 0.001, ****p < 0.0001.

height and crypt depth and width of control mice had positive                 growth rates when compared with controls. Second, the proximal
growth, while crypt density decreased (Figure 5, B–E). Although               and distal colon crypts of Msi1O/E mice either changed in the op-
the overall patterns of Msi1O/E villi and crypt change over the               posite direction to that of control mice or barely changed between
7-day period tended to be similar to those of control tissue, the             7 and 14 dpi. In summary, although there were no exaggerated
mean sizes of these changes were smaller and we observed some                 alterations in crypt-villi morphology of Msi1O/E mice, the overall
notable differences. For instance, the jejunum villi height and dis-          decrease in intestinal growth observed was consistent with the
tal colon crypt depth of Msi1O/E mice had significant negative                shorter intestinal lengths.

32 | T. T. Chiremba and K. L. Neufeld                                                                                         Molecular Biology of the Cell
Decreased proliferation in intestinal epithelia with Msi1 intestinal sections (Murayama et al., 2009). Sis but not Lac expres-
overexpression sion was significantly decreased in jejunum IECs from Msi1O/E at 7
To test the hypothesis that altered IEC proliferation could contrib- dpi (Figure 7D). In contrast, both Sis and Lac RNA levels were signifi-
ute to the shorter intestines and reduced intestinal growth rates cantly higher (4.5-fold and 8-fold increase, respectively) in 14 dpi il-
of Msi1O/E mice, we stained and scored intestinal tissue for the eum of mice overexpressing Msi1 (Figure 7, D and E). No changes
proliferative cell marker Ki-67. Representative images of Ki-67 im- were observed in the other segments.
munofluorescence at 7 dpi are shown in Figure 6A. The percent- Collectively, these results suggest that Msi1 overexpression af-
age of Ki-67-positive IECs in crypts of the jejunum, ileum, and fects IEC differentiation, but not in the same way for each intesti-
colon did not differ between control and Msi1-overexpressing nal region. Ileum tissue at 14 dpi seemed the most dramatically
mice at 7 dpi (Figure 6B). In contrast, by 14 dpi, there were signifi- altered by Msi1 overexpression, showing significant decreases in
cantly fewer proliferative IECs in all three intestinal segments of goblet cell marker RNA and increases in enterocyte marker RNAs.
Msi1O/E mice compared with controls (Figure 6, C and D). This Canonical Notch signaling is a major regulator of IEC differentia-
decrease in the population of Ki-67-positive cells is consistent tion and is predicted to inhibit secretory cell differentiation and
with the stunted intestinal lengths and intestinal growth rates of thus support an absorptive enterocyte cell fate (Fre et al., 2005). In
Msi1O/E mice. contrast, high expression of Notch antagonist mouse atonal ho-
Our Msi1O/E mice displayed cell proliferation and crypt-villi molog 1 (Math1) promotes commitment of progenitor cells to the
growth phenotypes contrary to previous reports in other Msi1 secretory cell lineage (VanDussen and Samuelson, 2010). We hy-
mouse models (Cambuli et al., 2015; Li et al., 2015). To test for pothesized that the status of Notch signaling would vary among
mutations that might have occurred in the Rosa26Msi1 transgene the three intestinal tissue segments, with more Notch signaling in
which were potentially acting on the Msi1 wild-type alleles in a 14 dpi ileum. To test this, we assessed expression of downstream
dominant negative manner, we verified the sequence of the Rosa- Notch effector, hairy and enhancer of split 1 (Hes1) and its antago-
26Msi1 transgene. The Msi1 transgene locus was amplified from ge- nistic target Math1.
nomic DNA by PCR (Supplemental Figure S1, B–D) and sequenced. Though we expected Hes1 and Math1 expression to be inversely
We utilized genomic DNA that was extracted from tail biopsies of altered, we instead found that both antagonists were significantly up-
Rosa26Msi1/Msi1 pups. Our sequencing results showed no mutations regulated (67 and 76% increase, respectively) in 14 dpi Msi1O/E colon
in the transgene, and the sequence of the isolated locus was 100% compared with controls (Figure 7, F and G). In contrast, 14 dpi ileum
identical to the published CDS of mouse Msi1 isoform 1 (Supple- had significantly lower Math1 expression (70% reduction) and also
mental Figure S1E). lower Hes1 expression (32% reduction, p = 0.0547). No changes in
Therefore, we conclude that ubiquitous overexpression of Msi1 Hes1 and Math1 expression were seen in any intestinal segments at 7
results in decreased intestinal cell proliferation, shorter intestinal dpi or in jejunum at 14 dpi. Because Hes1 and Math1 act as antago-
lengths, and stunted crypt-villi growth rates. nists to control IEC differentiation, we analyzed the ratio of Hes1-to-
Math1 RNA as a readout of Notch activity. Consistent with the re-
Msi1 overexpression has region-specific effects on intestinal duced Muc2 and elevated enterocyte marker RNA levels in 14 dpi
cell differentiation ileum of Msi1O/E mice, we also found a significantly higher Hes1-to-
A possible mechanism for decreased IEC proliferation in mice over- Math1 ratio (Figure 7H). The only other significant change was a lower
expressing Msi1 is increased differentiation of transit-amplifying Hes1-to-Math1 ratio seen in 7 dpi colons of Msi1O/E mice compared
progenitor cells. To test this possibility, we first utilized Alcian blue to with their wild-type littermates. This decreased Notch readout was
label goblet cells. Intestinal tissue from both control and Msi1-over- consistent with observed trends of decreased enterocyte and in-
expressing mice displayed a general distribution of goblet cells creased goblet cell marker RNAs.
similar to previous reports, with numbers increasing from jejunum to Taken together, our findings suggest that Msi1 regulates IEC dif-
colon (Figures 7A and Supplemental Figure S4, A and B). Quantifi- ferentiation in a temporal and region-specific manner, potentially
cation revealed a significantly higher proportion of goblet cells in through modulation of Notch activity in some regions.
villi from Msi1O/E mouse ileum at 7 dpi and both jejunum villi and
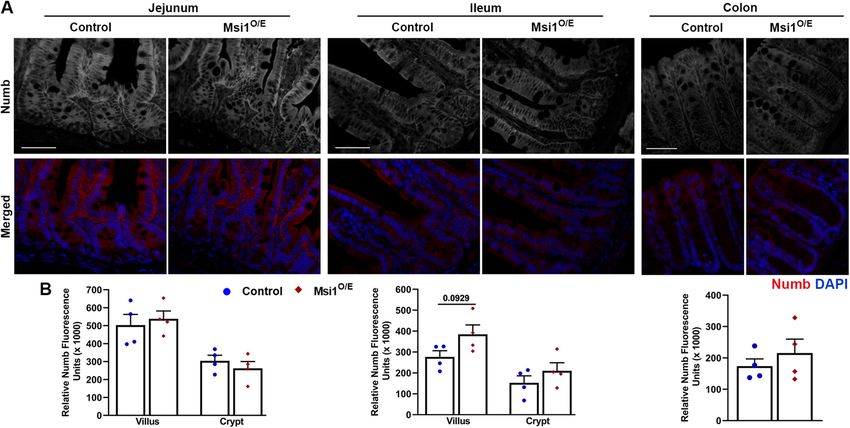
ileum crypts at 14 dpi. We were unable to quantify Alcian blue-pos- Ubiquitous Msi1 overexpression does not alter Numb
itive cells in the colon segments due to the high percentage of gob- protein expression in intestinal epithelia
let cells in that tissue (Supplemental Figure S4B). To further investigate a potential mechanism underlying altered
As a secondary method to evaluate goblet cells, we measured expression of Hes1 and Math1 in 14 dpi ileal and colon epithelia,
expression of Mucin2 (Muc2), a secretory mucin that is produced by we analyzed the expression of Numb, an antagonist of Notch
goblet cells. In contrast to Alcian blue staining results, Muc2 RNA signaling. It has been reported that Msi1 protein can bind to
levels were significantly reduced in IECs from Msi1O/E ileum compared Numb mRNA and inhibit its translation, resulting in reduced
with controls at 14 dpi (Figure 7B). Significant differences in Muc2 Numb protein amounts and in potentiation of Notch signaling
expression in the other intestinal segments were not observed. (Imai et al., 2001). We performed immunostaining for Numb
Next, we examined Paneth and enteroendocrine cell differentia- (Figure 8A) and quantified Numb fluorescence intensity in 14 dpi
tion by immunostaining for lysozyme and chromogranin A (Chga), intestinal epithelial tissue (Figure 8B). Numb expression pattern
respectively. Msi1O/E tissue had slightly fewer lysozyme-stained revealed a decreasing gradient from the jejunum to the colon. In
Paneth cells per crypt in all segments, with significant decreases in 7 addition, we observed higher Numb protein expression in jeju-
dpi ileum (Figure 7C). In contrast, enteroendocrine cells from 7 dpi num and ileum villi than in crypts. However, our analysis showed
jejunum segments showed an increase, albeit insignificant, in no significant differences in relative Numb protein fluorescence
Msi1O/E mice (p = 0.0698, Supplemental Figure S4C). intensity between control and Msi1O/E intestinal epithelial tissue.
To quantify differentiation into the absorptive enterocyte lin- Thus, these data suggest that altered Hes1 and Math1 expres-
eage, we measured RNA levels of two enterocyte markers, sucrase- sion in 14 dpi Msi1O/E epithelia is not due to modified Numb
isomaltase (Sis) and lactase (Lac), in IECs isolated from different protein levels.
Volume 32 January 1, 2021 Msi1 impairs development, gut homeostasis | 33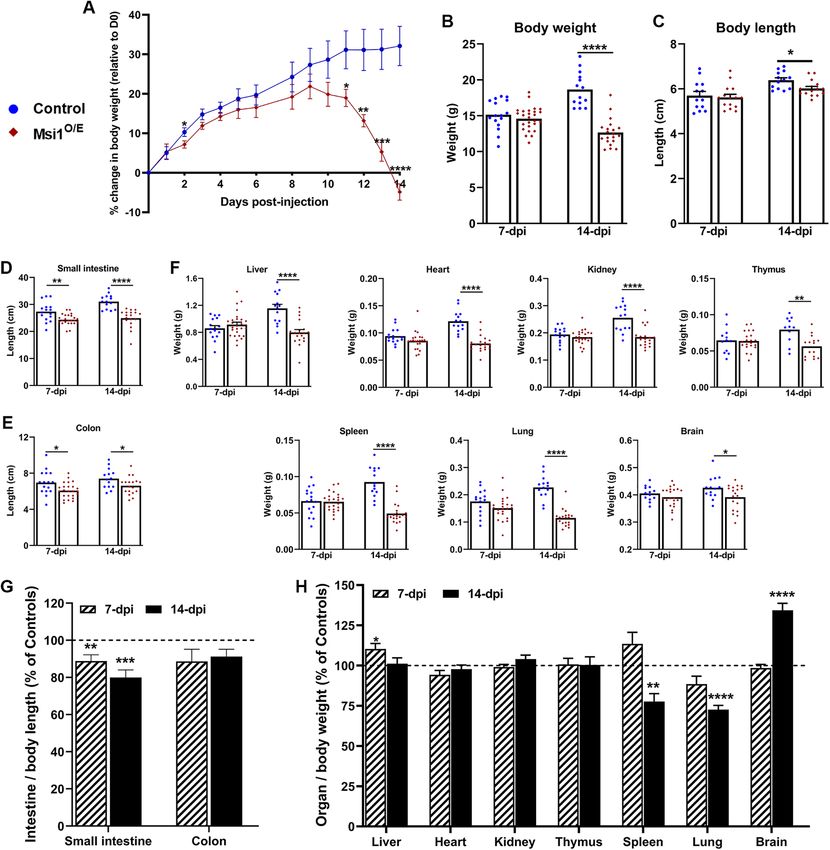
34 | T. T. Chiremba and K. L. Neufeld Molecular Biology of the Cell
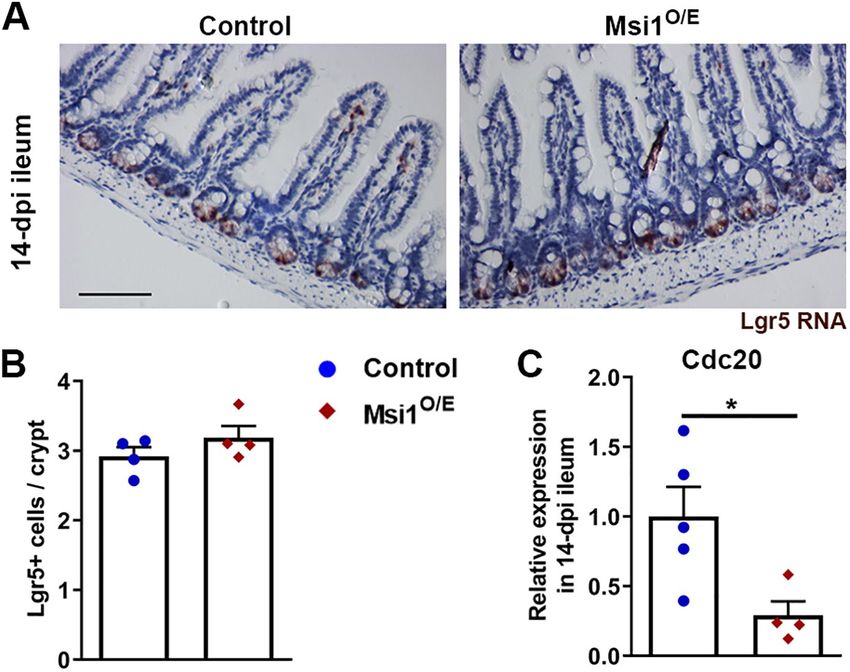
represent actively dividing ISCs in intestinal crypts. For ISC analysis,
we focused on 14 dpi ileum because it was the most severely af-
fected tissue with regard to differentiation. We found that the num-
ber of ISCs expressing Lgr5 RNA as detected by in situ hybridization
did not differ between control and Msi1O/E tissue in 14 dpi ileum
(Figure 9, A and B). Therefore, the decrease in IEC proliferation that
we observed was likely not the result of alterations in the population
of Lgr5-positive ISCs.
To gain insight into the mechanism underlying the decreased
proliferation observed when Msi1 is overexpressed for 14 d, we
looked at expression levels for “Cancer Pathway” genes using a
PCR array. Of the 84 genes in the panel, 12 transcripts showed ex-
pression changes greater than 25% in small intestine samples from
three 7 dpi Msi1O/E mice (Supplemental Table S2). Of these tran-
scripts, the only gene classified as a cell cycle regulator was Cdc20.
Cdc20 is required for cell cycle exit and its down-regulation has
been shown to induce mitotic arrest (Eichhorn et al., 2013). RNA
extracted from 14 dpi ileum was tested for Cdc20 expression levels
using independent primers for RT-qPCR. Notably, Cdc20 expression
was significantly decreased (∼70%) in Msi1O/E IECs (Figure 9C), con-
sistent with less proliferation also seen in this tissue.
Collectively, our data suggest that whole-body induction of Msi1
disrupts the proliferative capacity of IECs, resulting in a considerable
reduction of transit-amplifying progenitors, region-specific changes
in differentiation, and an overall decrease in intestinal growth and
consequently, in shortening of small intestines and colons.
DISCUSSION
In this study, we generated and characterized a novel Cre-inducible
mouse model that facilitates conditional transgenic overexpression
of Msi1. Our main aim for generating this transgenic mouse was to
investigate the oncogenic properties of Msi1 in vivo. The second
goal was to provide the Msi1 research field with a valuable resource
FIGURE 4: Decreased Jag1 protein expression in 7 dpi colon that can be used to further the overall understanding of the patho-
epithelial tissue of Msi1-overexpressing mice. (A) Representative logical roles played by Msi1 in tumors originating from different tis-
immunofluorescence staining images for Jag1 (gray, red) and sues. We utilized a TAM-dependent UBC-CreERT2 strain to drive
DAPI (blue) in colon tissue at 7 dpi. Scale bars represent 50 µm.
whole-body expression of our Msi1 knock-in transgene in order to
(B) Quantification of Jag1 immunofluorescence intensity. Each data
identify tissues that were altered by Msi1 overexpression and could
point represents the mean relative Jag1 intensity in the crypt epithelia
for a single mouse (five mice per genotype). Thirteen images were be characterized further.
analyzed for each mouse, and intensity was measured on the Here we report that Msi1 expression was up-regulated in various
brightest four 150 µm2 regions within the bottom two-thirds of crypts tissues, including kidney, lung, liver, and intestinal epithelium, at 3 d
per image. Mean ± SEM. Nested two-tailed t test analysis. *p < 0.05 after activation of Cre. However, the ubiquitous overexpression of
Msi1 in juvenile mice (4–5 wk old) resulted in a failure to thrive and
premature death. Two weeks after Msi1 induction, the Msi1O/E mice
Decreased Cdc20 expression in Msi1-overexpressing had smaller body and organ weights, as well as shorter intestinal
ileum IECs lengths when compared with littermate controls. Mouse pups are
Another possibility for the reduced IEC proliferation observed in not fully developed when they are born and it has been shown that
mice with overexpressed Msi1 is fewer intestinal stem cells (ISCs). neonatal organs, including the intestines, grow rapidly during the
Loss of ISCs has been correlated with diminished cell proliferative early postnatal period (∼6 wk) (Cheng and Bjerknes, 1985; Dehmer
abilities and villi shortening (Zhou et al., 2013). Lgr5-positive cells et al., 2011). Therefore, our findings suggest that whole-body
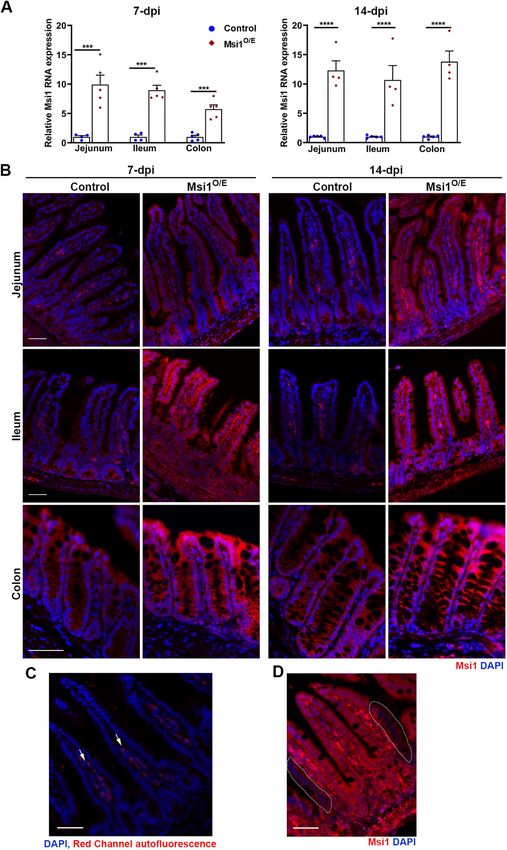
FIGURE 3: Up-regulation of Msi1 expression in the Msi1 knock-in mouse model. (A) Evaluation of Msi1 overexpression
in isolated IECs by RT-qPCR. Data were analyzed using an unpaired two-tailed t test on ΔΔCt values. Expression was
normalized to Gapdh. Graphical data represent mean ± SEM for each genotype (7 dpi, control jejunum, n = 4, ileum,
n = 4, colon, n = 5; Msi1O/E, n = 5; 14 dpi, control, n = 5, Msi1O/E, n = 4 mice). Each mouse is shown as an individual blue
circle (control) or red diamond (Msi1O/E). There were three technical replicates assayed for each mouse. ***p < 0.001,
****p < 0.0001. (B) Representative merged immunofluorescent images for Msi1 (red) and DAPI (nuclei staining, blue) in
small intestine and colon epithelium tissues at 7 and 14 dpi. (C) Negative control (no primary antibody, only secondary
antibody) immunofluorescent images showing autofluorescence (white arrows) in villi stroma. (D) Representative Msi1
immunofluorescent images illustrate areas of incomplete Cre-induced recombination of the CAG-loxP-STOP-loxP-
Msi1CDS-STOP transgene. White-dashed outlines indicate cells expressing endogenous Msi1 levels in TAM-injected
Msi1O/E tissue. Scale bars, 50 µm.
Volume 32 January 1, 2021 Msi1 impairs development, gut homeostasis | 35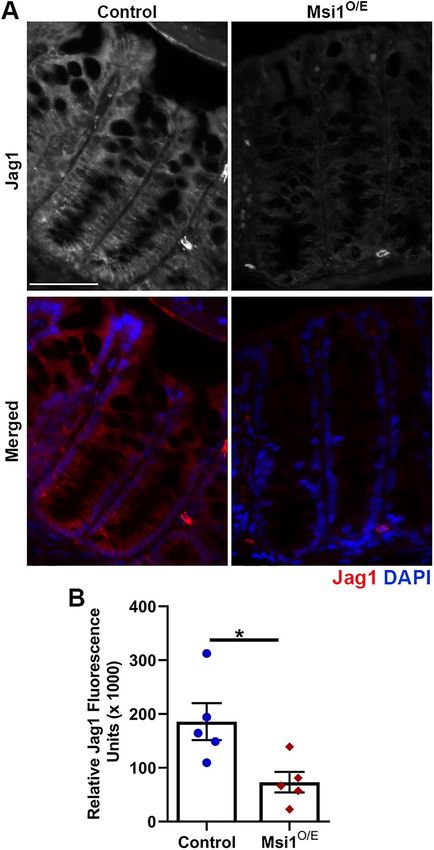
FIGURE 5: Effects of Msi1 up-regulation on intestinal crypt and villi architecture. (A) Representative hematoxylin and
eosin-stained images for small intestine and colon epithelia at 7 and 14 dpi. Scale bar, 50 µm. Growth analysis as
percentage change at 14 dpi relative to size at 7 dpi for (B) villi height, (C) crypt depth, (D) crypt width, and (E) crypt
density. Each data point in the scatter plots indicates the mean percentage change for a single mouse (7 dpi, control =
5, Msi1O/E jejunum = 6, ileum = 5, colon = 5; 14 dpi, control = 5, Msi1O/E jejunum = 6, ileum = 5, colon = 5). Technical
replicates per mouse: n ≥ 29 villi for height measurements; n ≥ 21 crypts for crypt depth and width measurements;
n ≥ 15 images for crypt density analysis. Mean ± SEM. Nested two-tailed t test analysis. *p < 0.05, **p < 0.01.

overexpression of Msi1 severely impairs the postnatal development            ber of Lgr5-positive stem cells. However, we found reduced Cdc20
process in mice. However, this stunted growth phenotype of Msi1O/E           expression in ileum IECs at 14 dpi. Knockout of Cdc20 in both
mice was not seen in every tissue, but rather showed selective al-           young and adult mice has been reported to induce metaphase ar-
terations in organ proportions. It is possible that this selectivity was     rest in proliferating IECs as well as to decrease Ki-67-positive cells
due to unequal organ sensitivities to up-regulated Msi1 or differ-           (Manchado et al., 2010). Thus, our results suggest that the impaired
ences in normal baseline Msi1 levels in different organs.                    IEC proliferation that we observed in Msi1-overexpressing mice
   While investigating the molecular basis underlying intestinal             could be due to down-regulation of Cdc20. Future work will investi-
shortening in Msi1-overexpressing mice, we also found a significant          gate whether Msi1 can directly bind to Cdc20 RNA and the conse-
decrease in epithelial cell proliferation in the small intestine and         quence of this interaction, or if Msi1 influences expression of Cdc20
colon at 14 dpi. Further analysis revealed no difference in the num-         indirectly.

36 | T. T. Chiremba and K. L. Neufeld                                                                                     Molecular Biology of the Cell
The intestine increases in length and di-
ameter during the early postnatal period,
resulting in a larger digestive and absorptive
epithelial surface area. These changes are
driven by increased IEC proliferation, villi
height and width, as well as crypt depth,
density, and diameter (Cheng and Bjerknes,
1985; Dehmer et al., 2011). Our crypt mor-
phology analysis revealed an overall but
marginal decrease in growth between 7 and
14 dpi. Jejunum villi height and distal colon
crypt depth were substantially reduced by
14 dpi. Taken together, the shorter intes-
tines, decreased crypt-villus growth, and al-
tered cell proliferation suggest that the in-
testines of Msi1-overexpressing mice have
reduced luminal surface area, which may
compromise their nutrient acquisition and
overall health.
Here we show that Msi1 up-regulation
had region-specific effects on IEC differen-
tiation; the ileum of Msi1O/E mice was more
responsive to Msi1 up-regulation than the
jejunum and colon. We detected enhanced
enterocyte marker expression as well as in-
creased Hes1-to-Math1 expression ratios in
the ileum segments 2 wk after Msi1 induc-
tion. These results indicate that ubiquitous
Msi1 overexpression promoted secretory
cell differentiation, potentially through
modulating the activities of Math1 and
Hes1. Consistent with a role for Notch in
regulating IEC differentiation, we saw de-
creased Paneth cell numbers in the ileum a
week after Msi1 induction. This finding
agrees with in vitro studies that have shown
inhibition of Paneth cell differentiation in re-
sponse to Msi1 overexpression (Murayama
et al., 2009). Inexplicably, there were no dif-
ferences in Paneth cell numbers in 14 dpi il-
eum tissue. Moreover, Muc2 was down-reg-
ulated in the ileum at 14 dpi, but there were
no changes in Muc2 in the other intestinal
segments. Contrary to expectations, there
were more goblet cells (Alcian blue) in the
jejunum and ileum of Msi1O/E mice. It is pos-
sible that the goblet cells from Msi1-overex-
pressing mice were making less Muc2 as a
way to compensate for the increased goblet
cell numbers or as a result of the high Hes1-
to-Math1 expression ratio. Additional RNA
FIGURE 6: Ubiquitous Msi1 overexpression results in decreased intestinal cell proliferation. expression analysis of other goblet cell
(A, C) Representative merged immunofluorescent images of Ki-67 (proliferative cell marker, red) markers will be required to test this com-
and DAPI (nuclei staining, blue) for 7- and 14 dpi groups, respectively. Scale bar, 50 µm.
pensation model.
(B, D) Graphs of the percentage of Ki-67-positive cells per crypt for 7 and 14 dpi, respectively.
Msi1 protein can bind to Numb mRNA
Each data point in the scatter plots represents the mean of Ki-67-positive cells per crypt for a
single mouse (7 dpi, control jejunum = 4, ileum and colon = 5, Msi1O/E jejunum = 9, ileum = 7, and inhibit its translation (Imai et al., 2001).
colon = 7; 14 dpi, control jejunum = 6, ileum = 6, colon = 7, Msi1O/E jejunum = 9, ileum = 6, Consequently, Msi1 overexpression has
colon = 9). For each mouse, 25 or more crypts were scored. Only those containing ≥30 total been shown to activate the Notch signaling
cells were analyzed. Mean ± SEM. Nested two-tailed t test analysis. **p < 0.01, ***p < 0.001, pathway (Imai et al., 2001; Rezza et al.,
****p < 0.0001. 2010). In IEC differentiation, high Notch
Volume 32 January 1, 2021 Msi1 impairs development, gut homeostasis | 37FIGURE 7: Altered intestinal cell differentiation with Msi1 up-regulation. (A) Representative images for goblet cells stained using Alcian blue and Nuclear Fast Red (left), and quantification of Alcian blue-positive cells in small intestine epithelia (right) (7 dpi, control jejunum, n = 5, ileum, n = 6, Msi1O/E jejunum, n = 5, ileum, n = 5; 14 dpi, control jejunum, n = 5, ileum, n = 5, Msi1O/E jejunum, n = 6, ileum, n = 5). N ≥ 30 villi per mouse. (C) Representative merged immunofluorescent images for lysozyme (Paneth cell marker) staining and quantification of positive cells in small intestinal epithelia (7 dpi, control jejunum, n = 4, ileum, n = 4, Msi1O/E jejunum, n = 5, ileum, n = 4; 14 dpi, control jejunum, n = 4, ileum, n = 4, Msi1O/E jejunum, n = 4, ileum, n = 4). N ≥ 25 crypts per mouse. Analyses of (B) Muc2, (D) Sis, (E) Lac, (F) Hes1, and (G) Math1 RNAs in IECs harvested from 7- and 14 dpi mice (7 dpi, control jejunum, n = 4, ileum, n = 4, colon, n = 5; Msi1O/E, n = 5; 14 dpi, control, n = 5, Msi1O/E, n = 4 mice). There were three technical replicates assayed for each mouse. Expression was normalized to Gapdh. (H) The ratios of Hes1-to-Math1 RNA levels were calculated from data presented in F and G with p value determined using ΔCt values. Graphical data represent mean ± SEM for each genotype. Each mouse is shown as an individual blue circle (control) or a red diamond (Msi1O/E). Data in A and C were analyzed using a nested two-tailed t test and in B and D–H analyzed using an unpaired two-tailed t test. *p < 0.05, **p < 0.01. Scale bars, 50 µm. signaling repressed the intestinal secretory cell lineage, resulting in Numb was not differentially expressed between Msi1O/E and control more enterocytes (Fre et al., 2005). Although our results from the 14 mice. In addition, we did not observe differences in Numb expres- dpi ileum section were mostly consistent with Notch activation, sion in 14 dpi jejunum and colon sections. Thus, these findings show 38 | T. T. Chiremba and K. L. Neufeld Molecular Biology of the Cell
FIGURE 8: Ubiquitous Msi1 overexpression does not alter Numb immunostaining in 14 dpi intestinal epithelial tissue.
(A) Representative immunofluorescence images for Numb (gray, red) and DAPI (blue) in small intestine and colon tissue
at 14 dpi. Scale bars represent 50 µm. (B) Quantification of Numb fluorescence intensity. Each data point represents the
mean relative Numb fluorescence intensity in the villus or crypt epithelia for a single mouse (four mice per genotype).
For each mouse, 13 images were analyzed, and intensity was measured on the brightest one or two 361-µm2 epithelial
sections per image. Mean ± SEM. Nested two-tailed t test analysis.

that Msi1 up-regulation did not modulate Numb expression in our            similar to our 7 dpi findings, Cambuli et al. (2015) showed no differ-
Msi1O/E mice, in contrast to the established Msi1/Numb/Notch rela-         ences in colon IEC proliferation. In terms of IEC differentiation, Li
tionship. However, this inconsistency between Msi1 and Numb ex-            et al. (2015) reported a decrease in the overall number of differenti-
pression patterns has been reported in other mouse models. No              ated cells, whereas Cambuli et al. (2015) observed no differences.
significant changes in Numb translation were observed in neural            Although Msi1 overexpression was lethal in our mice around 2 wk
stem cells that were derived from tetracycline-Msi1 mice and treated       after induction, Msi1 driven by a collagen promoter resulted in le-
with doxycycline to induce Msi1 overexpression (Katz et al., 2014).        thality within 3 d (Li et al., 2015). Discrepancies between these three
In contrast, Msi1 deficiency in Msi1-knockout mice resulted in the         mouse models could be due to the age at which Msi1 transgene
down-regulation of Numb protein expression and delayed gastric             expression was initiated and the tissue- and cell-type specificity of
regeneration, indicating that Msi1 is required for translational activa-   the expression. Another consideration is that our Msi1O/E mice over-
tion of Numb (Takahashi et al., 2013). Taken together, our results         express Msi1 in all cells and tissues. This might be the reason that
show that the high Hes1-to-Math1 expression ratio in 14 dpi ileum          our study is the first to report differences in mouse body and organ
IECs was not due to altered Numb expression. Although the high             weights. Ongoing studies are investigating the roles of Msi1 in early
Hes1-to-Math1 ratio suggested Notch activation, more work is               postnatal development using an intestine-specific inducible mouse
needed to determine whether the changes in ileum IEC differentia-          strain. Preliminary results suggest that overexpressing Msi1 in the
tion were due to modulations of Notch signaling or on transcription        intestines of ∼5-wk-old mice does not cause premature death.
factors that function downstream of Hes1 and Math1. In addition,               In summary, we have successfully developed a conditional and
future studies are required to unravel the complicated region-spe-         Cre-inducible Msi1 knock-in line by targeting the Rosa26 locus.
cific effects of Msi1 up-regulation on IEC differentiation.                Msi1 overexpression appears to have a global inhibitory effect on
     It is noteworthy that most phenotypes of our Msi1O/E mice differ      mouse postnatal development, with prominent phenotypes ob-
considerably from those of other Msi1-overexpressing mouse mod-            served in intestines, liver, spleen, lung, and brain. Our detailed anal-
els (Cambuli et al., 2015; Li et al., 2015). Whereas our study used a      ysis of intestinal tissue revealed roles for Msi1 in the maintenance of
ubiquitous and TAM-inducible model and focused on the early                intestinal homeostasis which might be important for future therapies
postnatal development stage, Li et al. (2015) utilized a doxycycline-      that manipulate Msi1 activity. Msi1 up-regulation for 14 d promoted
inducible collagen promoter to drive Msi1 expression in adult mice         enterocyte and inhibited goblet cell differentiation marker expres-
(Li et al., 2015). In the Cambuli et al. (2015) study, Msi1 overexpres-    sion in the ileum, consistent with a measured elevated readout of
sion was intestine epithelial cell-specific, driven by a noninducible      Notch signaling. At earlier stages, the ileum showed depressed Pa-
villin promoter from embryonic day 11 (Cambuli et al., 2015). In con-      neth cell numbers, also consistent with elevated Notch signaling. In
trast to our findings, both the inducible collagen promotor-driven         addition to this analysis of intestinal phenotypes, the Cre-inducible
adult mouse model and the villin-promoter driven model reported            Msi1 model will be a useful tool for future investigations of the regu-
increased IEC proliferation in the small intestine, which correlated       latory functions of Msi1 in other tissues and cell types at different
with enhanced stem cell marker expression and numbers. However,            developmental stages.

Volume 32 January 1, 2021                                                                        Msi1 impairs development, gut homeostasis   | 39
black, strain C57BL/6, offspring (G1) indicated successful germline
transmission. To genotype G1 mice, PCR was performed on ge-
nomic DNA from tail snips and PCR amplicons were analyzed using
a Caliper LabChip GX device. Homozygous and heterozygous
Msi1 knock-in mice will be referred to as Rosa26Msi1/Msi1and Rosa-
26Msi1/+, respectively.
Mice breeding and genotyping
Hemizygous B6.Cg-Tg(UBC-Cre-ERT2)1Ejb/2J (Ruzankina et al.,
2007) male breeders were purchased from The Jackson Laboratory
(# 008085). RosaMsi1/Msi1 females were crossed with the UBC-Cre-
ERT2 males to produce pups that were single transgenic RosaMsi1/+,
or double-transgenic RosaMsi1/+;UBC-CreERT2. Additional control
mice were obtained from breeding a C57BL/6 wild-type female with
a UBC-CreERT2 male. Tail-snips from 3-wk-old pups were digested
in 0.2 mg/ml Proteinase K (ThermoFisher, #EO0491) at 55°C over-
night and heat-inactivated at 95°C for 10 min to extract genomic
DNA. Primers used to genotype for Msi1 were: Msi1 WT Forward
(WTF) 5′- CTCTTCCCTCGTGATCTGCAACTCC-3′; Msi1 WT Re-
FIGURE 9: Msi1 overexpression does not alter Lgr5-positive stem cell
verse (WTR) 5′-CATGTCTTTAATCTACCTCGATGG-3′; Msi1 knock-in
numbers, but leads to reduced Cdc20 expression in 14 dpi ileum
tissue. (A) Representative Lgr5 in situ hybridization staining in 14 dpi
Forward (KIF) 5′-TGGCAGGCTTGAGATCTGG-3′; Msi1 knock-in Re-
ileum tissue. Scale bar, 50 µm. (B) Quantification of Lgr5-positive stem verse (KIR) 5′-CCCAAGGCACACAAAAAACC-3′. PCR conditions,
cells per crypt. Each data point represents the mean number of using OneTaq DNA polymerase (New England BioLabs [NEB],
positive stem cells per crypt; n = 20–24 crypts per mouse (four mice #M0482S), were 95°C for 5 min, 35 cycles (95°C for 30 s, 60°C for 30
per group). Data were analyzed using a nested two-tailed t test. Mean s, and 72°C for 1 min) and 72°C for 10 min. Msi1 WT primers ampli-
± SEM. (C) Relative RNA expression analysis of Cdc20 by RT-qPCR in fied a 299-base pair sequence of the endogenous Rosa26 locus (see
14 dpi IECs (control, n = 5, Msi1O/E, n = 4 mice). There were three Figure 1A). The binding sites for WT primers were also in the Rosa26
technical replicates assayed for each mouse. Expression was knock-in allele, but there was no amplification due to the large trans-
normalized to Gapdh. Unpaired two-tailed t test analysis. Mean ± genic vector inserted between the primer binding sites. The Msi1
SEM. *p < 0.05.
knock-in primers amplified a 492-base pair fragment. Primers used
to identify Cre were: CreF 5′-CACCGCAGGTGTAGAGAAGG-3′ and
MATERIALS AND METHODS CreR 5′-CCAGAGTCATCCTTAGCGCC-3′. PCR conditions were
Request a protocol through Bio-protocol. 94°C for 3 min, 35 cycles (94°C for 30 s, 59°C for 1 min, 68°C for 30
s) and 68°C for 5 min and the Cre fragment size was 225 base pairs.
Mouse husbandry To confirm the DNA quality of Rosa26Msi1/+ mouse samples analyzed
Mouse use was approved by the Institutional Animal Care and Use for Cre, an internal control fragment (492 base pairs) was amplified
Committee at the University of Kansas. All mouse experiments ad- using the Msi1 knock-in primers.
hered to federal regulations and institutional guidelines. Mice were
maintained in the Animal Care Unit at the University of Kansas under Sequencing the Rosa26Msi1 transgene
the animal use statement 137-02 and were housed in cages with The transgenic Msi1 CDS was isolated from genomic DNA by PCR
sex-matched littermates, except for breeding purposes, and fed ad using primers PF1 and PR1 (Supplemental Figure S1B). Primers PF1
libitum water and chow (ENVIGO, Teklad global #2918). and PR2 amplified a 1174-base pair product which included 61 base
pairs upstream and 24 base pairs downstream of the transgenic
Generation of a Msi1 knock-in transgenic mouse Msi1 CDS (1089 base pairs). The genomic DNA was extracted from
A conditional and TAM-inducible Msi1 knock-in transgenic mouse tail snips of 3-wk-old pups as mentioned above, and PCR was per-
was generated in collaboration with Taconic Artemis using recom- formed on samples from three independent Rosa26Msi1/Msi1 trans-
bination-mediated cassette exchange (RMCE) targeted transgen- genic mice and one negative control Rosa26+/+ (Msi1 wild-type)
esis. The RMCE vector (pMsi1Final RKL20014, Supplemental mouse. Primer sequences were: PF1 5′- CTCCGTCGACCTATA-
Figure S1A) contained a strong synthetic CAG promoter (Cyto- ACTTCGTATAG-3′ and PR1 5′-CTTAAAATCTTAAGCTAGCACGC-
megalovirus early enhancer element, chicken β-Actin promoter GTC-3′. PCR conditions, using Q5 High-Fidelity DNA Polymerase
and rabbit β-Globulin first exon and intron), a loxP-flanked polyad- (NEB, #M0492S), were 98°C for 2 min 30 s, 35 cycles (98°C for 10 s,
enylated transcription termination (STOP) cassette, and mouse 68 °C for 30 s, and 72°C for 45 s) and 72°C for 2 min. The PCR prod-
Msi1 open reading frame followed by a STOP cassette. This target- uct was then purified using a QlAquick PCR Purification Kit (Qiagen,
ing vector was transfected into Taconic Artemis C57BL/6 embry- #28104). Agarose gels were run before and after purification of the
onic stem (ES) cells equipped with F3/FRT-RMCE docking sites in PCR product to verify the amplicon size. In addition to PF1 and PR1,
the Rosa26 locus. Successful recombinant clones containing the primers PF2, PF3, PF4, PF5, and PR2 (Supplemental Figure S2B)
conditional Msi1 knock-in allele were selected using positive neo- were used to sequence the purified PCR product (GENEWIZ, NJ).
mycin resistance. Blastocysts isolated from impregnated BALB/c Primer sequences were: PF2 5′-GAAAGAGTGTCTGGTGATGC-3′;
females were each injected with 10–15 positively selected ES cells PF3 5′-GATGCCATGCTGATGTTCG-3′; PF4 5′-CTGGTTACACCT
and subsequently transferred into pseudopregnant NMRI females ACCAGTTC-3′; PF5 5′-CTTCCTAGGGACCACAAG-3′; and PR2
to produce chimeric offspring (G0). Highly chimeric mice were 5′-GATTGCGCCAGCACTTTATC-3′. Sequencing results were ana-
backcrossed into wild-type C57BL/6 females. The presence of lyzed and compared with the National Center for Biotechnology
40 | T. T. Chiremba and K. L. Neufeld Molecular Biology of the CellInformation reference sequence for mouse Msi1 CDS isoform 1 Immunoperoxidase staining
(NM_008629.2; assessed on 07/30/2020). Sequence alignment was After deparaffinization, rehydration, permeabilization, and metha-
performed using the MultAlin software (Corpet, 1988). nol washes; slides were incubated in 3% H2O2 methanol (100%) for
20 min. Antigen retrieval, blocking, and primary antibody (SP-1
Administration of TAM Chga, ImmunoStar, #20085), incubation steps were similar to those
Four- to 5-wk-old mice, both sexes, were given intraperitoneal for immunofluorescence staining. Goat anti-rabbit HRP–conjugated
injections with a single dose of 75 mg/kg body weight TAM solu- secondary antibody (1:1000 Bio-Rad, #172-1019) and 3,3′-diamino-
tion (MP Biomedicals, #156738). TAM was prepared under sterile benzidine tetrahydrochloride substrate (Invitrogen, #00-2020) were
conditions by dissolving in 10:1 sunflower oil/ethanol mixture; used. Tissue sections were counterstained with Gill’s Hematoxylin
10% of the mixture was evaporated before administration into (American MasterTech, HXGHE1LT) for 5 min followed by a 2-min
mice. Both control (RosaMsi1/+) mice and the Cre-containing water rinse. Bluing was achieved by dipping slides in 0.2% ammonia
(RosaMsi1/+;UBC-CreERT2) mice were injected with TAM. Mice water for 30 s. Slides were then rinsed in water for 2 min, dehy-
were killed by CO2 asphyxiation followed by cervical dislocation drated in ethanol (50, 70, 80, 95, 100%) for a minute each, and
at 3, 7, or 14 d post-TAM injections. Age-matched littermates washed 2× in xylene-substitute for 10 min total before application of
were used for all experiments. mounting solution (Biocare Medical, EM897L).
Body weight, organ weights, and length measurements Hematoxylin and eosin staining
Mice were weighed daily at approximately the same time. Final Deparaffinized slides were rehydrated in ethanol (5 min in 100%, 2
body weights were measured immediately after mouse sacrifice. To min in 90%, and 2 min in 70%) 2× for each concentration. Then
obtain total body lengths, mice were laid facedown on a flat surface slides were washed 2× in water for 2 min, stained with Gill’s Hema-
and body length was measured from the base of the skull to the toxylin for 8 min, washed in water for 2 min, and then blued as
anus. Organs were promptly excised and weighed, or their lengths above. This was followed by two rinses in water for a minute each,
were measured. Organ-to-body weight proportions for liver, kid- incubation in 95% ethanol for a minute, and staining with Eosin Y
neys, thymus, spleen, lungs, and brain were calculated by dividing (Fisher Scientific, 314-630) for a minute. After dehydration in ethanol
the weight of the organ by the body weight of the mouse. Intestinal (95, 100%) for 2 min with two changes for each concentration, slides
length-to-body length proportions were also determined for the were briefly washed in xylene substitute and then mounting solution
small intestine and colon. For comparison, organ proportions for (Biocare Medical, EM897L) was applied.
each mouse were normalized to the average organ proportion of
RosaMsi1/+ control mice. Alcian blue staining
For goblet cell staining, deparaffinized slides were rehydrated in
Tissue sample preparation and immunofluorescence ethanol (100, 95, 80, 70, 50%) for 5 min each and then washed 2× in
The small intestine was divided into three sections: duodenum, il- water for 5 min. Slides were stained in 1% (wt/vol) Alcian blue solu-
eum, and jejunum. The duodenum was the most proximal 5 cm and tion (Sigma Aldrich, dissolved in 3% acetic acid, pH 2.5) for 30 min
was not further analyzed. Jejunum and ileum sections were the followed by two washes in water for 5 min each. Counterstaining
proximal two-thirds and distal third of the remaining small intestinal was achieved by incubating slides with Nuclear Fast Read (New-
tissue, respectively. The jejunum, ileum, and colon tissues were comer Supply, 1255A) for 5 min. Slides were then washed 2× in wa-
flushed with 10% saline-buffered formalin, cut lengthwise, individu- ter for a total of 4 min. This was followed by dehydration in ethanol
ally rolled into “Swiss rolls,” and fixed in 10% saline-buffered forma- (50, 70, 80, 95, 100%) for a min each, three xylene washes for 5 min
lin for 24 h. Mouse heart, lung, and kidney that were harvested at 3 each, and application of mounting solution.
d post-TAM injections were fixed in 10% saline-buffered formalin for
24 h, whereas liver samples were fixed for 48 h. The tissue was then RNA in situ hybridization
stored in 70% ethanol before paraffin embedding. RNA in situ hybridization was performed using the RNAscope 2.5
In brief, for immunofluorescence staining, 4-µm tissue sections HD Detection Kit (ACD) according to manufacturer’s protocol.
were deparaffinized 3× in xylene substitute for a total of 30 min, rehy- Briefly, after deparaffinization and hydrogen peroxide treatment
drated in a graded ethanol series (100, 95, 80, 70, and 50%) for 5 min (ACD, #322335), antigen retrieval on 4-µm tissue sections was
each, and permeabilized in methanol (0.1% Tween20) for 15 min on achieved by boiling slides in 1× Target Retrieval Reagent (ACD,
a shaker. Slides were washed 2× in absolute methanol for 5 min each, #322000) in a 99–102°C water bath for 15 min. Slides were dipped
followed by a phosphate-buffered saline (PBS) wash. Antigen re- in 100% ethanol and air-dried at room temperature. Then, protease
trieval was achieved by incubating slides in 0.01 M citrate buffer (ACD, #322331) was performed at 40°C for 30 min. This was fol-
(0.05% Tween20, pH 6.2) in a 90–95°C water bath for 40 min. Slides lowed by hybridization using target probes for Lgr5 (ACD, #312171)
were incubated for 2 h in a PBS-blocking buffer containing 2% normal at 40°C for 2 h. Mm-Polr2a (ACD, #312471) and dapB (ACD,
goat serum, 0.1% Triton X-100, 0.05% Tween20, 5% cold-fish skin #310043) probes were used for the positive and negative control
gelatin, and 10% bovine serum albumin (wt/vol). Sections were then sections, respectively. The signal was amplified and detected using
incubated with primary antibodies overnight at 4°C. Primary antibod- the Red Detection Reagent (ACD, #322360). Counterstaining was
ies used were Msi1 (1:1000 Millipore, #MABE268 clone 7B11.1), achieved by incubating slides in 50% Gill’s Hematoxylin for 2 min at
Jag1 (1:50 Cell Signaling Tech (D4Y1R), #70109), Ki-67 (1:400 Cell room temperature and then blued in 0.02% ammonia water for 10 s.
Signaling Tech, #D3B5), lysozyme (1:500 DakoCytomation, #EC After dehydration at 60°C for 15 min, slides were dipped in xylene
3.2.17), β-catenin (1:500 BD Transduction, #610154), and Numb before application of mounting solution (Biocare Medical, EM897L).
(1:500 Cell Signaling Tech (C29G11), #2756). Slides were rinsed 3× in
PBS for 15 min total, incubated with Alexa Fluor secondary antibod- Microscope image acquisition and analysis
ies (1:1000 Invitrogen) for 1 h at room temperature, and rinsed 3× in Immunofluorescence images were acquired using a Zeiss (Axiovert
PBS before counterstaining with DAPI (Invitrogen, #P36962). 135) microscope and Hamamatsu (C10600) digital camera. A Nikon
Volume 32 January 1, 2021 Msi1 impairs development, gut homeostasis | 41You can also read