The Analysis of Stress and Negative Effects Connected with Scientific Work among Polish Researchers - MDPI
←
→
Page content transcription
If your browser does not render page correctly, please read the page content below
sustainability

Article
The Analysis of Stress and Negative Effects
Connected with Scientific Work among
Polish Researchers
Radosław Wolniak *            and Adam R. Szromek
 Department of Organization and Management, Institute of Economy and Informatics, Silesian University of
 Technology, Akademicka 2A, 44-100 Gliwice, Poland; innowator@o2.pl
 * Correspondence: radek_wol@o2.pl; Tel.: +48-237-77-73

 Received: 17 May 2020; Accepted: 18 June 2020; Published: 23 June 2020

 Abstract: In researchers’ work nowadays there is a big and increasing amount of stress. In this paper,
 we have conducted an analysis of this problem because we think it is necessary to cope with it to
 increase the academic workers’ quality of working life. The aim of this paper is to assess the level
 of stress load of Polish researchers concerning subsequent academic degrees and titles. Based on
 research, we can say that the level of stress load of Polish researchers concerning subsequent academic
 degrees and titles is differentiated—the least stressful is professorship, then doctoral thesis, and the
 most stressful is the habilitation. When analyzing the most frequently observed afflictions that the
 respondents associate with scientific procedures, it can be stated that these are irritation, nervousness,
 and aggression, as well as mild stress in the form of headache or stress, which was observed for at least
 half of the researchers. Almost every three respondents suffered from some kind of psychological
 problems (depression, depressed mood for a longer period, addictions, the necessity to undergo
 therapy), and 28.9% suffered from psychosomatic disorders (for example, pain of unknown source of
 limbs and of internal organs).

 Keywords: stress; researchers; scientific work; job satisfaction; quality of life

1. Introduction
       Scientific activity is an investment into the future of the whole society and brings a big contribution
to it in the aspect of the quality of life, knowledge, innovations, and personal skills of people. The work
of the scholars nowadays is also not an easy one. It is very long, the pay is not always satisfactory,
and the assessment of the achievements t is not easy and transparent. It brings many problems to the
work of scholars, which negatively affect the quality of their working life [1–10].
       Conducted research was based on the literature gap concerning the knowledge of the discussed
issue [11–15]. There were some research studies about stress in an academic job, but authors did not
concentrate on the analysis connected with academic degree. It is interesting to know if the academic
degree and the level of career influence the problem of stress among researchers. This problem is a
research gap. Conducted research was based on the broad context of the literature analysis described
in the literature review section.
       The aim of this paper is to assess the level of stress load of Polish researchers concerning subsequent
academic degrees and titles.

2. Literature Review
    Scientific work has a big influence on the functioning of the whole society. It has many both
educational and research values that bring a big contribution to current society. But this process is

Sustainability 2020, 12, 5117; doi:10.3390/su12125117                       www.mdpi.com/journal/sustainability
Sustainability 2020, 12, 5117 2 of 21
not easy, and the result of the carried research starts to appear after many years, long after it has
started. The literature analysis indicates problems that stress scholars, which are increasing in many
countries [16–21]. We think the problem is big and worth investigating in many countries and from
many different points of view. In this paper, we concentrate on the problem of stress in the work of the
researchers, especially on the example of empirical research conducted in Poland.
The factor that is important for the feeling of stress in the profession and has a big impact on
the satisfaction that comes with it are the deadlines imposed by the work or the need to meet the
requirements of renewing the employment contract and the next promotion. In Table 1, there are
selected definitions of stress. Research conducted in Great Britain in 2012 [22] showed that the main
cause of stress in scientific work was time pressure related to the performance of tasks.
Table 1. Selected stress definitions.
Author Definition
Defines stress by explaining the components of dealing with stress:
• the person perceives a threat,
• they then make a cognitive appraisal to try to understand what is causing the stress,
Latack (1986) [23] but at this stage, they are still uncertain as to how to respond,
• degree, or level, of stress that is experienced,
• the implementation of how to cope with the stressful event/threat.
Defines the term stress as being a complex and multidimensional negative emotion.
Lazarus (2000) [24]
Coping with stress can lead to the reduction of demands (internal and external).
States that external demands (stressors) and those experienced by the body (stress) can be
placed into two categories:
Krohne (2002) [25] • systematic stress that is associated with physiological or psychobiological factors;
• psychological stress that is associated with cognitive psychology.
Thoits (2010) [26] Stressors can have a substantial damaging effect on mental and physical health
Describes a stressor as “any biological process, emotion or thought”. It is the outcomes of
Walsh (2011) [27]
demands on the body during experiences of fight or flight.
Stress is an unpleasant psychological process that may happen as a response to
Robbins and Judge (2013) [28]
environmental pressures.
Luke Seaward (2016) [29] Stress is any change experienced by the individual.
Source: Own work.
However, research from 2006, conducted on over two thousand English institutions dealing with
higher education, indicated the existence of a different dependence. A negative correlation in this
research was found between the number of hours worked by scholars and job satisfaction. It did not
result from a simple translation into work at all, but it was dependent on what work the scientist was
doing. In P.A. Stevensa [30], interesting information can be found that the time spent on research had a
positive effect on overall job satisfaction, but that was not the case when performing administrative
work. Thus, the excessive burden related to filling the documentation affected the opposite of the
sense of satisfaction in comparison with the feeling of satisfaction, which was much greater when it
concerned research.
This is also confirmed by other analyses [31]. S. Liu and A.J. Onwuegbuzie show that all employees
who were excessively burdened with didactics had an increased level of stress and a reduced level
of job satisfaction. This study emphasized that excessive workload can cause excessive stress at
work. In turn, international research by F.J. Lancy and B.A. Sheehan [32] showed a difference between
academic staff from different countries, which shows that the relationship between job satisfaction and
subjects taught was different for different nationalities.
Many examples of reports about stress in scholars’ work come from international studies. A
2008 report which came from the University and College Union (UCU) says that most universities
were failing to meet expectations and standards for psychosocial working conditions which were set
out by the Health and Safety Executive [11,33]. According to this research, lack of time to engage
in research process was most the important factor. In this case, the highest number of respondents
pinpointed a very high contribution to their unacceptable levels of stress or level of frustration.Sustainability 2020, 12, 5117 3 of 21
Moreover, very important problems were connected with excessive workloads and lack of access
to sufficient resources to undertake their research. Respondents also pinpointed as very important
problems connected with obtaining sufficient funding levels. According to others research, we can
divide stress factors into the following seven categories [34]:
• Problems with working hours, workload, and pace of work;
• Control methods used to measures levels of autonomy, pacing, and timing of scholars
working methods;
• Peer support and the degree of help and respect from other university staff including colleagues;
• Managerial support and their supportive behaviors. Help from line managers and also the
organization itself. The examples of this help are encouragement and availability of feedback;
• Relationships between university staff and levels of conflict in the workplace. In this case, the very
important problems are bullying behavior and harassment;
• The extent to which researchers believe that their work is important and fits into the aims of the
particular organization; and
• Change which reflects how well changes in the university environment are managed
and communicated.
The authors of the mentioned report identified important factors to tackle problems with stress in
higher education (Table 2).
Table 2. Methods of tackling stress in higher education.
Factor Actions
• increase of appreciation of researchers’ work,
• help for scholars to cope with increased student numbers,
• quieter working spaces in the university,
General • use of more methods of mentoring and support,
• increase of collegial work and good organizational culture,
• giving more research opportunities for scholar-related academics and
university teachers,
• decrees of bureaucracy,
• implementation of methods of change management,
• improved planning methods,
• more inclusion of scholars in decision-making processes,
Management
• more communication between researchers and management staff,
• more training methods for managers,
• implementation of effective institutional action in the case of bullying
and harassment,
• more flexible patterns of work,
• measure of workload control,
• increase of job security,
• an end of implementation in university fixed-term contracts,
Employment
• proper reward for job and removal of problems connected with the gender
pay gap,
• greater equality in employment,
• UCU to take more action on stress and workload,
• more opportunity for career progression,
Career
• more worthwhile opportunities for professional development,
• smaller classes,
Teaching
• greater recognition for teaching.
Source: [33].
Other studies drew similar conclusions [35–40]. The authors in their research highlight primarily
the main cause of stress and job insecurity. In addition, they think that very important problems areSustainability 2020, 12, 5117 4 of 21
connected with stress relating to work relationships, resources, control, and communication. They also
highlighted significantly lower levels of stress-connected problems relating to work–life balance, lower
levels of physical health, and job overload.
Comparative data about stress work among English University Teachers in the years 1998–2012
were presented by the English Association of University research report [35]. The data in this report
are based on surveys of the higher education sector. The research was conducted in 1998, 2004, 2008,
and 2012. Analyzing data, we can say that year-by-year, the situation is worsening, The proportion
of respondents who strongly agree that their job is stressful is increasing. For example, in 1998,
21.6% of respondents said that their job is very stressful, in 2004 it was 26.3%, in 2008—24.5%, and in
2012—32.6% [39].
The phenomenon is not restricted to one country but is widespread in the modern academic world.
For example, interesting research is presented in the newsletter of CUPE Local 3902. The research
was done on a representative of 7000 workers at two universities: University of Toronto and Victoria
University. Authors in this paper highlight also the increasing stress level among researchers especially
in the 30–39 age group of staff [40].
In addition, the phenomenon of academic stress is not restricted to a particular profession.
The problem of stress among researchers is described especially well and in detail in medical
faculties [41,42]. However, other faculties are not stress-free [43,44].
Another very important problem is connected that was reported by some researchers, for example,
in the survey done by Psychosocial Working Conditions in Britain, the lower well-being of university
staff. The level of their well-being is lower than the average level for the target group (this target group
came from the education sector) [45].
The previous conclusions are contradicted by the studies of E. Bexley, J. Richard,
and S. Arkoudis [46], because they show that, despite the fact that many scholars point to too
much workload, it has a positive impact on job satisfaction. This research has shown that in many
cases, didactic work compensates for problems related to working conditions. There are also numerous
studies [47–52] in the literature on the subject pointing to the pressure associated with conducting
scientific research and publishing the results. It turns out, therefore, that this aspect of scientific work
may also be a reason for reducing the satisfaction of scientific work.
Due to the increasingly rapid development of higher education, the competition of scientific
units is becoming more and more intense. The research of X. Guan and others [53], conducted among
Chinese academic teachers, shows that with the development of higher education, the workload and
feeling of pressure related to raising the teaching level, conducting research, and publishing results is
increasing. These studies have also shown that researchers in China are exposed in their job to high
levels of occupational stress. Many of them suffer also from some symptoms of depression. Chinese
academic teachers were susceptible to deterioration of physical and mental health, which can effect the
deterioration of job satisfaction.
The rapid and increasing pressure and competition among researchers lead to long working hours
and have a negative impact on family life. Zabrodska points out the negative role of academic pressure
on work–life balance and conflicts in the families [54]. The negative impact of workaholism on family
life in academia was also found by Torp [55].
Research carried out in 2012 in Great Britain by G. Marek and A.P. Smith [13] revealed that the
reasons for university anxiety and depression were demands related to the job position, inability to
cope with obligations, and excessive effort. The problem was also connected to the employee reward
systems and support as a way to reduce the negative impact of work on well-being. Guarino and
Borden [56] observe that the situation depends on gender, and generally women’s situation in the
academy is worst. This was also pointed out by Tunguz [57].
In the next years, the situation tends to be worse. G. Kinman and S. Wray in his research in 2013 [35]
found that 75% of academics agreed or strongly agreed that their job is stressful. ComRes carried out
research for the National Association of Schoolmasters Union of Women Teachers (NASUWT). In thisSustainability 2020, 12, 5117 5 of 21
research, they found that 61% of researchers were often or always stressed. Moreover, 47% of them
were considering leaving the research and teaching profession [58]. A survey carried out by YouGov,
which was done in 2015 for the National Union of Teachers (NUT), also had a similar conclusion.
Authors found that 53% of researchers were considering leaving the profession in the next two year
period [59]. Mwangi in her research in 2014 points out that she observed an increasing competition in
the university and more challenges with recruiting and also retaining qualified academic staff. She
adds also that we can observe increased demands on grants and funding [60]. The problem with
research funding of the research especially on PhD level was also observed by Horta [61]. Nowadays
we can observe increasing pressure on the effectiveness of the research [62–70].
Stress in the academic environment does not appear to have declined. Nowadays it is an important
factor for university organizations and also individuals because the level of stress makes it difficult to
develop constructive ways for researchers to cope effectively with problems. Because of this, it is also
not easy to protect the feelings of their well-being [71,72].
One study about stress in the academic environment found that researchers who were more active
physically and meet the guidelines of 150 minutes of vigorous or moderate-intensity activity every
week reported lower levels of stress and a higher level of well-being [73].
Academic stress leads to many health and psychical problems of scholars. For example, it can
lead to burnout. Bad emotional experience has been related with the phenomenon of burnout. This is
a particularly important problem for staff in human service sectors. The study revealed that when
teachers are exposed to high numbers of students, they are more prone to burnout. The problem is
especially important in the case of postgraduates [39].
Bleiklie [74] observed a negative effect of bad management on the level of academic stress and
researchers’ burnout. This was also pointed out by Connell [75] and Lee [76]. We can especially observe
the effect of globalization that brings instability of academic contracts even to developed countries’
academy environments. This is because universities must compete on the global market and try to
find possibilities to cut costs [77].
The term “burnout” comes from the aerospace language and dates back to the 1950s. Then it was
only used to describe fuel in rockets or fuel consumption in nuclear reactors. Since then, definitions of
burnout varied. They were applied to human behavior. Now there are many definitions of burnout in
the literature [78,79]:
• Burnout is when a particular person has pushed creative energy beyond the borders.
• Burnout is when a person is subjected to continuous job-related stress, especially in situations
where one has the loss of emotional, physical, and mental energy.
• Burnout is the lack of motivation and desire to achieve a sufficient level of balance among
professorial responsibilities in the job, especially in areas of teaching, service, scholarship,
peer relationships, and student care-giving.
• Burnout is when one experiences problems connected with detachment (especially detachment
from staff, students, peers, and clients) and a decrease of satisfaction or sense of well-being.
• Burnout is frustration, fatigue, or apathy resulting from long periods of stress, intense activity,
or overwork.
• Burnout is neither a neurosis nor physical ailment. It is an inability to mobilize one’s capabilities
and interest or loss of will.
Quantity and severity of stressors researchers experience nowadays over a period of time can
easily lead faculty into the “burnout cycle”. Researchers caught up in this cycle will eventually have
dysfunctional professional behaviors, which can lead to a decrease of performance in one or sometimes
more of the job areas of research, teaching, service, and student-care and sometimes to problems with
interpersonal relationships with family and their colleagues.
Other studies [80–83] show that job satisfaction—based on the use of human resources—contributes
to the reduction of occupational burnout, general sense of stress, and depressive symptoms.Sustainability 2020, 12, 5117 6 of 21
An interesting observation is that the difference in remuneration in similar positions may be a
reason for dissatisfaction with the work performed. This phenomenon may give rise to distrust as to
the proper appreciation of scientific and didactic work and reduce the employee’s self-esteem.
Firstly, the burnout victim should recognize that they may be in a state of denial. Using
introspection, managers can determine their state. They can recognize if they have a sufficient number
of symptoms connected with burnout needed to be addressed by staff members. Once denial can be
recognized, the scholar is placed in a state of possibility to escape the following stages of the burnout
cycle [38]:
• Recognize symptoms of burnout regarding their performance, body language, communication
style, and attitudes.
• Willingness to make changes.
• Talk to someone, for example, counselor, friend, family physician, or doctors specializing in stress.
• Balance their lifestyle and analyze what is important in their life.
• Develop a plan to overcome the stressors. Set targets and goals for change.
• Join in some stress management programs.
• Read books and papers about burnout, stress, and suggested coping mechanisms.
• Negotiate with the department authorities to temporarily change their professional responsibilities.
• Take a sabbatical or personal leave.
• Reverse negative vocabulary and also negative thinking.
• Explore some relaxation exercises.
• Find a hobby.
• Explore about assistance in these problems with the university’s human resources department.
Navarro and Mas on the basis on macro analysis of many studies about burnout in academia
found that the burnout syndrome [84] in the case of researchers has prevalence rate of 16.4%; [85]
18.4% [86], and 22.9% [87] of teachers with maximum level burnout. On the basis of collected data,
they concluded that provided data seems to indicate that nowadays we are in the face of a frequent
problem with academics’ burnout, the consequences of which make it costly and serious. There are
some studies that found out that the experience of burnout and stress may affect commitment to the
job, job satisfaction, and the whole organization [88–94].
Permanent stress leads not only to burnout but also to many various mental illnesses. A recent
survey found that 43% of researchers exhibited symptoms of mental-disorder-connected problems [78].
The problem is nearly twice as common compared with mental disorders widespread in the general
population. This is due to are the increased demands to publish, increased workloads of scholars,
and problems to obtain external revenue [95].
High levels of problems connected with poor mental health of scholars have a profound impact
on their professional competence and also productivity. It is affecting teaching and administrative,
and research quality. It also decreases work relationships among staff and communication [39].
Some recent high-profile cases, like the suicide of a professor based in London in 2014 and the
suicide of a professor in the US have started discussions about how to support the mental health of
researchers. Because of this, concerns about mental health grow. We can see many challenges faced by
researchers. Now, several organizations involved in academic research try to find the problem and
better understand these challenges. They want to know how scholars could be better supported by
academic authorities. RAND Europe recently analyzed the evidence connected with this problem for
the Royal Society [96] and also the Wellcome Trust. They found that there is a lack of sufficient data
about the problem, but nevertheless we can observe strong grounds for concern. The now-available
evidence suggests that we are observing a decreasing level of well-being of researchers. This problem
is worse than in other types of employment [97].
We can distinguish many mental health problems among academics; for example, Shaw found
the following problems [98]:Sustainability 2020, 12, 5117 7 of 21
• depression (75%),
• panic attacks (42%),
• eating disorder (15%),
• self-harm (11%),
• obsessive-compulsive disorder (11%),
• alcoholism (11%),
• post-traumatic stress disorder (9%),
• other mental health disorder (7%),
• bipolar disorder (4%),
• drug addiction (2%).
Some important factors found by RAND Europe connected with academics’ mental health were
as follows [96]:
• In many surveys, UK higher education teachers have reported that their well-being is worse
compared with staff well-being in other types of organizations (including health, education,
and social work). They compared areas of work demands, support provided by managers,
change management, and clarity about one’s role.
• The proportions of both scholars and postgraduate students which have a risk of having or
developing a problem with mental health. This proportion is based on, for example, self-reported
data. It is generally higher than we can observe among other working populations.
• The main factors that are associated with the development of depression and other typical mental
health problems among PhD students are work–life conflict, high levels of work demands, poor
support from the supervisor, low job control, and exclusion from the decision making processes.
• Studies pinpoint that academic staff involved in research on sensitive topics as abuse or trauma
can be emotionally affected by the problems they encounter in their research. They should receive
better support for university authorities to mitigate the possible negative impacts of this work.
The problem of abuse in the university environment was also pointed out by Oleksinienko [99].
• We can observe that job stress levels and poor workplace conditions can contribute to reduced
productivity of academic staff. It can be both through absence and also through presentism.
Because of that researchers can attend work and are less productive.
To support the mental health of academics we can use, for example, the following methods:
• Implementation of detailed personal development plans, 360-degree feedback, group sessions,
and mentoring. Workshops with staff can be useful to increase the level of understanding
and engagement of researchers into the strategic plan, online resources, and communication,
vice-chancellor-led open meetings, etc.
• Briefings, stress risk assessment, free gym membership, training, and solution groups.
• Academic and non-academic middle managers can participate in a program connected with
individual executive coaching [100].
• Establishment of workplace policies useful for stress reduction [101].
• Yoga sessions for academic staff [102,103].
• Suicide-prevention training program [104].
• Mindfulness six-week program to decrease stress levels [105].
An interesting study about problems with work in University in Poland was conducted by A.
Baruk in 2016 [106,107]. She found that burning out professional and life energy quickly was one of
the most important factors of unwillingness to start work in an academic environment. Moreover,
low salaries, less free time compared to other employers, job insecurity, lack of prospects for professional
development, and the lack of professional stabilization were important elements in the analysis.Sustainability 2020, 12, 5117 8 of 21
3. Materials and Methods
In the prepared research, such factors as the demographic data of the studied researchers (age, level
of education, years worked in academic field, etc.) and conditions of work (position, job, remuneration),
as well as professional psychosocial factors (including stress) that may be associated with satisfaction of
work, were taken into account. The development of research results focuses on the influence analysis of
the mentioned aspects on the level of perceived stress when pursuing academic degrees. Additionally,
the presence of other health incidents (diseases or chronic illnesses), the source of which may be the
stress endured during the scientific procedure, was also taken into account. Therefore, two working
hypotheses were proposed:
Hypothesis 1 (H1). The level of stress load of Polish researchers concerning subsequent academic degrees and
titles is differentiated and decreases with each subsequent academic degree and title.
Hypothesis 2 (H2). The achieving of subsequent academic degrees in many cases has a negative effect on the
health of the researchers.
In the first stage, the research was focused on the analysis of the level of perceived stress and its
influence on the health of the researchers. This stage covers, therefore, the development and verification
of a research (diagnostic) tool the objective of which was to verify the working theories and provide a
general image of the problems of Polish researchers as compared with literature. In the analysis of
the discussed issue, our own research tool was used, which was developed on the basis of previously
used diagnostic tools used in some studies [108]. These tools, however, were used as an inspiration to
develop our own questionnaire that was the basis to collect data during the second stage.
The research focuses on the issues of subjective perception of stress characteristic of subsequent
degrees, as well as on the health and social effects of stressful work. It must be noted, however, that no
discussion of the real source of the defined illnesses or events took place. There is only analysis of the
studied subjects’ feedback that assesses by themselves the influence of stressful situations characteristic
of scientific work on their health and status of social relations.
The research questionnaire was handed to 10,000 randomly chosen academics from Poland.
They held at least a PhD degree. From them, 763 researchers took part in the research process, which
significantly exceeded the minimal size of a random sample, which was defined in this research at
the level of 589 questionnaires. It was estimated for the assumed level of maximum sample statistical
error on the level amounting to ±4% and confidence interval p = 0.95. Not all questionnaires which we
obtained were analyzed due to the presence of non-systematic errors (for example, lack of data, some
errors in the logic within provided answers); therefore, in the end, 712 from completed questionnaires
were analyzed. The whole research was carried out in Poland in 2017 (November and December).
The research questionnaire contained 19 groups of questions, mostly very complex, as they
referred to thematically grouped opinions that could be assessed on a scale of 1 to 10 or on the Likret
scale. The analysis of reliability in the following thematic groups indicated a sufficiently high reliability
of the tool. The survey questionnaire was sent by e-mail directly to randomly selected respondents.
In the conducted research, many of the statistical analysis methods that present the correlations
resulting from the conducted research were used. The conducted analysis of the collected data consisted
of the establishment of a database of collected data, initial organizing data, and then proper statistical
analysis. The stage of data ordering in the analysis consisted of random and systemic errors elimination.
In some cases in the research, persons who incorrectly understood the question or those which did not
read in whole the request in the questionnaire were studied.
To analyze collected data, we used statistical analysis methods, both one-dimensional (in the
form of traditional or item descriptive analysis) as well as two-dimensional (in the form of analysis of
dependencies of pairs of studied characteristics) and even an multidimensional one with the use of
correspondence analysis for taxonomic distances (in case of features of quality).Sustainability 2020, 12, 5117 9 of 21
In the case of variables with normal distribution, to compare two average values in the studied
independent groups, the t-Student test was used, first determining the uniformity of variations (with the
use of Fisher–Snedecor test). To compare two groups with variations of distribution other than normal
(and they were in the majority), the U test was used (Mann–Whitney). In the case of non-uniform
variations of features characterized by normal distribution, the C test was used (Cochran–Cox).
The comparative analysis of three and more independent groups of distribution other than normal
was made with the use of ANOVA test of Kruskal–Wallis, while in the case of non-uniformity of
variable variations of normal distribution, the tests were carried out with independent variations
estimation. The significance of differences between structure indicators was verified with Chi-squared
test. The presence of normality of distribution of studied variables was verified with Shapiro–Wilk test.
When verifying statistical hypotheses, the statistical tests were used, taking into account
significance at the level of α ≤ 0.05. At the same time, it was indicated that p probability of
making an error of type I is not greater than 0.05 and even sometimes 0.001.
4. Results of Our Own Research
In the conducted research, we collected data concerning 712 respondents. The respondents were
doctors, habilitated doctors, and professors who at the time of the conducted research (academic year
2018/2018) worked at Polish universities. The whole population consists of 416 doctors, 193 habilitated
doctors, and 103 professors. Based on the research, we can say that the age structure of the respondents
has a visible domination of people aged 40–45. The remaining age categories were represented by
smaller groups. Based on research, none of the respondents was above 75 years old. Additionally,
the smallest age group was researchers aged 25–30 (0.6%).
4.1. Stress Level in Scientific Procedures
Attaining subsequent academic degrees and titles (in this work, the term “academic degrees”
will be an umbrella term referring to the PhD, habilitated PhD, and professor titles) are quite often
linked with stress. The respondents were asked for a subjective assessment of the level of stress when
attaining subsequent degrees in the past on a scale from 1 to 10. It must be noted, however, that the
assessment of the level of perceived stress during subsequent scientific procedures can be given only
by respondents who had higher academic degree or equivalent academic degree as the assessed one,
which means that professors rated the stress level for all academic degrees, habilitated doctors assessed
the level of doctoral thesis and habilitated doctoral thesis, while doctors only assessed the habilitated
doctoral thesis. Thus, in assessments of some of the academic degrees, the number of assessments is
greater than the number of respondents participating in the research.
Not referring to correlation coefficients and significance analysis of differences between average
rates, on the basis of differences between the varied academic degrees it can be stated that the level
of stress can depend on the level of the academic degree being attained. The descriptive analysis
indicated that subjective level of stress (on a scale from 1 to 10) for a doctoral thesis amounted to
6.39 ±2.30. Habilitation is characterized by a slightly higher level of perceived stress as compared
with the doctoral thesis as in the studied sample it amounted to 6.48 ± 2.57. It must be clearly stated,
however, that this difference is statistically significant (p = 0.0396). The least stressful is the attaining of
professor title, which was assessed at the level of 4.44 ± 2.95, a result significantly lower than the level
characteristic for a doctoral thesis (p < 0.001) and habilitation (p < 0.001).
The obtained rates are presented in more detail in Table 3. It can be noted that in the case of
doctoral thesis and habilitation, the level of stress is similar, taking into account item measurements
(for example median). The level of stress for the professor’s title is different, which confirms the results
of traditional analysis. What is worth attention is the fact that among the respondents were those who
chose extreme answers for all the degrees and titles; therefore, taking the median value into account
is justified.Sustainability 2020, 12, 5117 10 of 21
Table 3. Results of descriptive analysis on the level of stress.
The Level of Stress for a Scientific Procedure Academic Degrees and a Title
(on a Scale from 1 to 10) In General PhD Hab. PhD Prof.
Sample size (N) 1019 626 298 95
Arithmetic mean (xsr ) 6.28 6.39 6.63 4.44
Standard deviation (SD) 2.53 2.30 2.62 2.95
Lower quartile Q1 5.00 5.00 5.00 2.00
Median Q2 7.00 7.00 7.00 4.00
Upper quartile Q3 8.00 8.00 9.00 6.00
Dominant Do 8.00 7.00 8.00 1.00
Minimum (MIN) 1.00 1.00 1.00 1.00
Maximum (MAX) 10.00 10.00 10.00 10.00
Coefficient of variation (Vx) 40.32 35.97 39.52 66.30
Source: Own study.
It is worth noting that despite the effort and good will of the respondents, such an approach
towards stress may be very subjective. A doctor when assessing their doctoral thesis cannot compare it
with subsequent academic degrees. Therefore, it is justified to look at stress from the perspective of
those who have all academic degrees, meaning professors, who can compare various stages of their
academic career. Such an approach has also a weak side, as in the case of professors the time that has
passed since, for example, their doctoral thesis is in general the longest from among other respondents.
In the assessment given by 103 professors, the most difficult in terms of stress was the habilitation
(6.1), then the doctoral thesis (5.8), and then professorship (4.4), which is similar to the results obtained
in general from all the respondents. What is different is only the level of perceived stress, which seems
to be lower than before, probably due to the longer time perspective towards stress and comparison
with other degrees.
4.2. Ailments and Dysfunctions Related to Participation in the Scientific Procedure
The respondents were asked to answer the following question: during the scientific procedure
and two years after attaining the last academic degree/title, did the respondents feel the listed ailments
and dysfunctions? They also had the possibility to define the ailments not listed in the questionnaire.
It was not assessed to what extent the observed disorder or ailment or dysfunction was associated
with the scientific procedure. What was taken into account was the assessment of this phenomenon as
given by the respondent towards oneself.
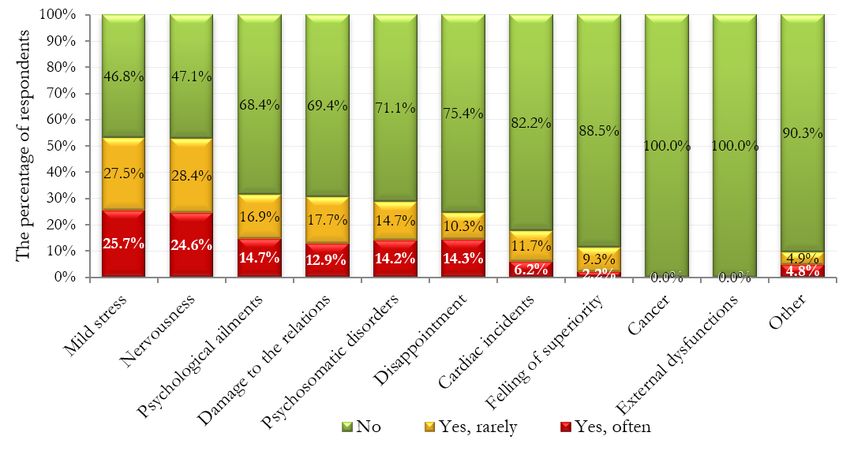
When analyzing the responses of all researchers in total (Figure 1), it was noted that the most
commonly listed ailments are irritation, nervousness, and aggression, as well as mild stress in the form
of headache or tension, which was observed for 52% of the researchers. Almost every third respondent
(31.6%) suffered from some kind of psychological problems (depression, depressed mood for a longer
period, addictions, the necessity to undergo therapy). Moreover, 28.9% suffered from psychosomatic
disorders (for example, pain of unknown source of limbs and of internal organs). The same number of
respondents (30.6%) indicated damage to the relationship understood as weakening or break up of
family relations, relationships, or friendships. Every fourth respondent (24.6%) was disappointed with
the lack of due benefits in the relation towards co-workers on equivalent position, which was more
frequently than every tenth respondent (11.5%) feeling superiority over other co-workers or feeling
more important.
Cardiac incidents of varied severity, understood as heart diseases and vascular diseases
(hypertension, arrhythmia, heart attack, stroke, etc.), were present among 17.9% of respondents,
while only one in every three (6.2%) resulted in serious consequences to health.
Every tenth respondent defined their ailments as “other”, although when writing details about
the observed dysfunctions it often turned out that these are psychosomatic or neurological, gastric
disorders (chronic fatigue, back pain, degeneracy, exhaustion, hormonal disorders, sleeplessness,Sustainability 2020, 12, 5117 11 of 21
chronic infections, loss of sight, irritable bowel syndrome, etc.). A full summary of the given responses
is presented in attachment no. 1.
At the same time, significant differences were observed in the frequency of occurrence of particular
Sustainabilityin2020,
ailments subsequent groups
11, x FOR PEER divided according to academic degree. Mild stress in the form
REVIEW 11 of of
21
headache or tension was felt by every third doctor (33.7%), while habilitated doctors suffered two times
less frequently
two (12.9%) and
times less frequently professors
(12.9%) suffered four
and professors timesfour
suffered less times
frequently (6.3%). A (6.3%).
less frequently similar Asituation
similar
concernedconcerned
situation irritation, irritation,
nervousness, and aggression,
nervousness, as well as psychological
and aggression, disorders (depression,
as well as psychological disorders
depressed mood
(depression, for a mood
depressed longer for
period,
a longeraddictions, the necessity
period, addictions, thetonecessity
undergototherapy),
undergo perceived
therapy),
damages todamages
perceived the relations (weakening
to the relations or break up ofor
(weakening family
breakrelations, relationships
up of family or friendships),
relations, relationshipsand or
psychosomatic
friendships), and disorders (pain ofdisorders
psychosomatic unknown(pain source of limbs, ofsource
of unknown internal organs,
of limbs, ofetc.). However,
internal organs,inetc.).
the
case of attaining
However, a title
in the case of of professor,
attaining theofdiscussed
a title professor,reactions occurred
the discussed eightoccurred
reactions times less frequently
eight as
times less
compared with
frequently doctors. Comparable
as compared with doctors. disproportions
Comparable of the frequencyof
disproportions of the
occurrence
frequency wereof observed
occurrencein
relation to cardiac and vascular disorders (hypertension, arrhythmia, heart attack,
were observed in relation to cardiac and vascular disorders (hypertension, arrhythmia, heart attack, stroke, etc.). A full
comparison
stroke, etc.). is A presented in Table
full comparison is 4.
presented in Table 4.
Figure 1.
Figure Ailments suffered
1. Ailments suffered during
during the
the scientific
scientific procedure
procedure and
and 22 years
years after
afterthe
theprocedure
procedurehas
hasended.
ended.
Source: Own study.
Source: Own study.
Table
Table 4.
4. Frequency
Frequency of
of occurrence
occurrence of
of aa given
given ailment
ailment during scientific procedures.
during scientific procedures.
Ailments
Ailments Felt Felt PhD
PhDhab.hab.
PhD PhD Prof.
Prof.
Mild stress 33.7%
Mild stress 33.7% 12.9% 12.9% 6.3%
6.3%
Nervousness 33.0%
15.0% 5.2%
Nervousness 19.9%
Psychological ailments
33.0% 8.7%15.0% 5.2%
2.9%
Damage Psychological
to the relations ailments
19.9% 8.1%8.7%
19.5% 2.9%
2.9%
Psychosomatic disorders 17.8%
Damage
Disappointment
to the 19.5% 8.8%
relations
16.3%6.2%
8.1% 2.2%
2.9%
2.1%
Psychosomatic
Cardiac incidents disorders
17.8% 5.1%8.8%
8.8% 2.2%
3.9%
Felling of superiority 6.7%
Disappointment
Cancer
16.3% 3.5%
0.0%0.0%
6.2% 1.3%
2.1%
0.0%
Cardiac incidents
External dysfunctions 8.8% 0.0%5.1%
0.0% 3.9%
0.0%
Other 6.3%
Felling of superiority 6.7% 2.5%3.5% 0.8%
1.3%
Source: Own study.
Cancer 0.0% 0.0% 0.0%
External dysfunctions 0.0% 0.0% 0.0%
The effects of stress endured during
Other subsequent6.3% scientific2.5%
procedures
0.8% to attain the next academic
degree were analyzed. The respondents were asked what changes they observed in their lives after
Source: Own study.
they were awarded their last academic degree or title. These were related to health and economics,
as well
Theaseffects
socialof
life. Respondents
stress couldsubsequent
endured during agree or disagree with
scientific the provided
procedures statements
to attain the nextor select a
academic
neutral response and agree only partially (Figure 2).
degree were analyzed. The respondents were asked what changes they observed in their lives after
they were awarded their last academic degree or title. These were related to health and economics,
as well as social life. Respondents could agree or disagree with the provided statements or select a
neutral response and agree only partially (Figure 2).
It was stated that more than 83% of respondents noticed an improvement in finances after
obtaining the next academic degree. However, it was not a permanent change, as 37.7% of
respondents (almost half of the percentage that stated improvement) admitted that they are onlySustainability 2020, 11, x FOR PEER REVIEW 12 of 21
Sustainability 2020, 12, 5117 12 of 21
The percentage of respondents that claimed that in general their lives are better is even higher
(45.3%).
2. Effects
Figure Figure of subsequent
2. Effects of subsequentacademic degrees.
academic degrees. Source:
Source: Own study.
Own study.
A slightly
It was stated smaller
that more number
than 83% ofof researchers
respondents whonoticed
were awarded another degree
an improvement noticed greater
in finances after obtaining
respect from the environment (students, co-workers)—37.1%—but taking into account those who
the next academic degree. However, it was not a permanent change, as 37.7% of respondents (almost
notice this respect only from time to time in total makes it 84.2% of respondents.
half of the percentage
An even that stated
greater numberimprovement) admitted
of people noticed that they
the increase are only sometimes
of importance financially better
of their professional
as compared withthat
position theis period
expressed before
by thethey were
feeling that awarded
the voice oftheir degree.
a promoted The percentage
university of respondents
employee matters
more.
that claimed Such
that inageneral
change istheir
noticed by 85.3%
lives of respondents,
are better is even while
higher 48.6% were only partially convinced.
(45.3%).
Every third respondent (31.5%) did not feel appreciated by the employer for the awarded
A slightly smaller number of researchers who were awarded another degree noticed greater
academic degree, which means that 68.5% of people felt appreciated by the employer or felt partially
respect from the environment (students, co-workers)—37.1%—but taking into account those who
appreciated.
notice this respect only from
Unfortunately, moretimethantoevery
timesecond
in total makes
person it 84.2%
noticed of respondents.
a deterioration of health which was
associated
An even greater with negativeof
number factors
people of participation
noticed theinincrease
scientific of
procedures that will
importance give the
of their researcher position
professional
the next academic degree. This is the standing of more than every fourth respondent (27.8%), and
that is expressed by the feeling that the voice of a promoted university employee matters more. Such a
nearly the same number (28.3%) only partially explains the deterioration of health by citing the
change is noticed
difficultiesbyof 85.3%
attainingofthe
respondents,
next academicwhiledegree.48.6% were43.9%
In addition, onlyofpartially
respondentsconvinced.
did not feel an
Everyinfluence
third respondent (31.5%)
on their health didby
as caused notthefeel appreciated
scientific process ofbyattaining
the employer
the nextfor the awarded
academic degree. academic
The people
degree, which means associating
that 68.5%the negative
of people health
felteffects with the load
appreciated associated
by the employerwith or
thefelt
scientific process
partially appreciated.
were mostly doctors (60%) and habilitated doctors (27%). The least numerous group that noticed
Unfortunately, more than every second person noticed a deterioration of health which was
negative effects after a scientific process are professors (13% of professors noticed a deterioration in
associatedhealth).
with negative factors of participation in scientific procedures that will give the researcher the
next academic degree. This is the standing of more than every fourth respondent (27.8%), and nearly
the same number (28.3%) only partially explains the deterioration of health by citing the difficulties of
attaining the next academic degree. In addition, 43.9% of respondents did not feel an influence on their
health as caused by the scientific process of attaining the next academic degree. The people associating
the negative health effects with the load associated with the scientific process were mostly doctors
(60%) and habilitated doctors (27%). The least numerous group that noticed negative effects after a
scientific process are professors (13% of professors noticed a deterioration in health).
Unfortunately, every fifth respondent (18.3%) noticed negative changes in family life and relations
with friends after being awarded the next academic degree. Every fourth respondent felt such changes
in relations with family and friends only partially (26.9%). More than half (54.8%) did not have these
problems or did not associate them with an academic degree.Sustainability 2020, 11, x FOR PEER REVIEW 13 of 21
Sustainability 2020, 12, 5117 13 of 21
such changes in relations with family and friends only partially (26.9%). More than half (54.8%) did
not have these problems or did not associate them with an academic degree.
Deteriorating relations with
Deteriorating relations with co-workers
co-workersafter afterobtaining
obtainingthe thenext
nextacademic
academic degree
degree is confirmed
is confirmed by
by only 4.0% of respondents, and every fourth respondent (23.6%) noticed this problem in a limited
only 4.0% of respondents, and every fourth respondent (23.6%) noticed this problem in a limited scope.
scope. The majority
The majority of respondents,
of respondents, or three out or of
three
fourout of four
of them of them
(72.4%), (72.4%),
did not noticedidsuchnot notice such in
a phenomenon a
phenomenon in their environment.
their environment.
Qualitative
Qualitative changes
changes describing
describing particular
particular features
features of of the
the respondents
respondents made made itit also
also possible
possible to to
make
make aa multidimensional
multidimensional qualitative
qualitative analysis.
analysis. ItItwas
wasmade
madewith withthetheuse
useofof correspondence
correspondence analysis,
analysis,
meaning the method of comparing similar
meaning the method of comparing similar answers given by respondents’
respondents’ groups. The analysis of
The analysis of the
the
distance betweenthethe
distance between itemized
itemized points points of responses’
of responses’ variantsvariants
allows the allows the identification
identification of the
of the interrelations
interrelations
between various between various
categories categories
of variables. As aof variables.
result As a result
of this process, of this process,
two artificial dimensions twoareartificial
created
dimensions
which enableare created representation
a graphic which enable aofgraphic representation
a multidimensional of a multidimensional
phenomenon. The resulting phenomenon.
dimensions
The resulting artificially
are therefore dimensions are therefore
created artificially
correspondence created correspondence variables.
variables.
The correspondence analysis concerning the research factors
The correspondence analysis concerning the research factors made
made itit possible
possible toto confirm
confirm several
several
of
of the statements made above. Figure 3 makes it possible to observe age intervals found the closest
made above. Figure 3 makes it possible to observe age intervals found the closest to
to
thethe subsequent
subsequent degrees
degrees andand title:
title: thethe academic
academic degree
degree of aofdoctor
a doctor is awarded
is awarded to persons
to persons belonging
belonging to a
to a wide age range of 25–50 which is convergent with the estimated average age range when such a
wide age range of 25–50 which is convergent with the estimated average age range when such a degree
degree is awarded,
is awarded, which iswhich
31–36.is 31–36.
Figure 3.
Figure Correspondence analysis:comparison
3. Correspondence analysis:comparison of
of age
age and
and academic
academic degrees.
degrees. Source:
Source: Own
Ownstudy.
study.
The age when the habilitated PhD is awarded is also characterized by a wide range as its location
The age when the habilitated PhD is awarded is also characterized by a wide range as its location
is close both to the category of people in the age range of 45–50, as well as aged 55–60, yet it was the
is close both to the category of people in the age range of 45–50, as well as aged 55–60, yet it was the
closest to the age range of 50–55. As presented in Figure 4, this academic degree is the most varied one
closest to the age range of 50–55. As presented in Figure 4, this academic degree is the most varied
in case of age when it is awarded. The age range estimated before was 42–47 years.
one in case of age when it is awarded. The age range estimated before was 42–47 years.
The title of a professor is granted to those aged 60–75, which is a significantly higher category
The title of a professor is granted to those aged 60–75, which is a significantly higher category
than the one estimated before at the average level of 50–55 years and dominating one of 60–65 years (in
than the one estimated before at the average level of 50–55 years and dominating one of 60–65 years
this age category were 35.1% of professors).
(in this age category were 35.1% of professors).
The second comparison presents the location of observed adverse effects to health after being
The second comparison presents the location of observed adverse effects to health after being
awarded subsequent academic degrees (Figure 4). Professors participating in the research in general did
awarded subsequent academic degrees (Figure 4). Professors participating in the research in general
not comment on any afflictions or diseases that they would associate with the completed professorship.
did not comment on any afflictions or diseases that they would associate with the completed
In some cases, there was an indication of cancer at a critical stage. The situation is different in the case
professorship. In some cases, there was an indication of cancer at a critical stage. The situation is
of those holding a habilitated PhD or PhD (both items are close to one another). Such afflictions as
different in the case of those holding a habilitated PhD or PhD (both items are close to one another).
mild stress, psychological afflictions, disappointment, and damages to relationships are more often
Such afflictions as mild stress, psychological afflictions, disappointment, and damages toSustainability 2020, 11, x FOR PEER REVIEW 14 of 21
Sustainability 2020, 12, 5117 14 of 21
relationships are more often noticed in case of doctors than in the case of habilitated doctors, who
also point out to these situations, but not as often.
noticed in case of doctors than in the case of habilitated doctors, who also point out to these situations,
but not as often.
Slightly different is the comparison presented in Figure 5, as this time academic degrees and
Sustainabilityafflictions
observed 2020, 11, x FOR
werePEER REVIEWwith the duration of the last employment agreement. It is evident
compared 14 of 21
that a crucial factor that influences the frequency of anxiety, irritation, stress, and external dysfunctions
relationships
in researchersare canmore often
be the noticed
stability of in case of doctors
employment. thansame
At the in the caseitof
time, is habilitated doctors,
a feature that often who
was
also point out to these situations, but not as often.
indicated as a factor that influences the satisfaction of scientific work.
Figure 4. Correspondence analysis: comparison of academic degrees and title and the observed
afflictions or diseases. Source: Own study.
Slightly different is the comparison presented in Figure 5, as this time academic degrees and
observed afflictions were compared with the duration of the last employment agreement. It is evident
that a crucial factor that influences the frequency of anxiety, irritation, stress, and external
dysfunctions inCorrespondence
researchers can be the stability of employment. At the and
same time, it is a feature that
Figure
Figure 4.4. Correspondence analysis:
analysis: comparison
comparisonofof academic
academic degrees
degrees and title
title and the observed
oftenafflictions
was indicated as a factor that influences the satisfaction of scientific work.
afflictions or diseases. Source: Own study.
or diseases. Source: Own study.
Slightly different is the comparison presented in Figure 5, as this time academic degrees and
observed afflictions were compared with the duration of the last employment agreement. It is evident
that a crucial factor that influences the frequency of anxiety, irritation, stress, and external
dysfunctions in researchers can be the stability of employment. At the same time, it is a feature that
often was indicated as a factor that influences the satisfaction of scientific work.
Figure 5. Correspondence
Figure 5. Correspondence analysis:
analysis: comparison
comparison of
of the
the duration
duration of
of the
the employment
employment agreement
agreement and
and
selected afflictions.
selected afflictions. Source:
Source: Own
Own study.
study.
5. Discussion and Conclusions
Figure 5. Correspondence analysis: comparison of the duration of the employment agreement and
selected afflictions. Source: Own study.You can also read


