Report on the follow-up to the Regional Implementation Strategy (RIS) of the Madrid International Plan of Action on Ageing (MIPAA) in The ...
←
→
Page content transcription
If your browser does not render page correctly, please read the page content below
Report on the follow-up to the Regional Implementation
 Strategy (RIS) of the Madrid International Plan of Action on
                       Ageing (MIPAA) in

                                    The Netherlands
Fourth Review and Appraisal

Dutch Ministry of Health, Welfare and Sport
Prepared by IQ healthcare, Radboudumc

Dr. Florien Kruse
Erik Wackers, MSc
Dr. Simone van Dulmen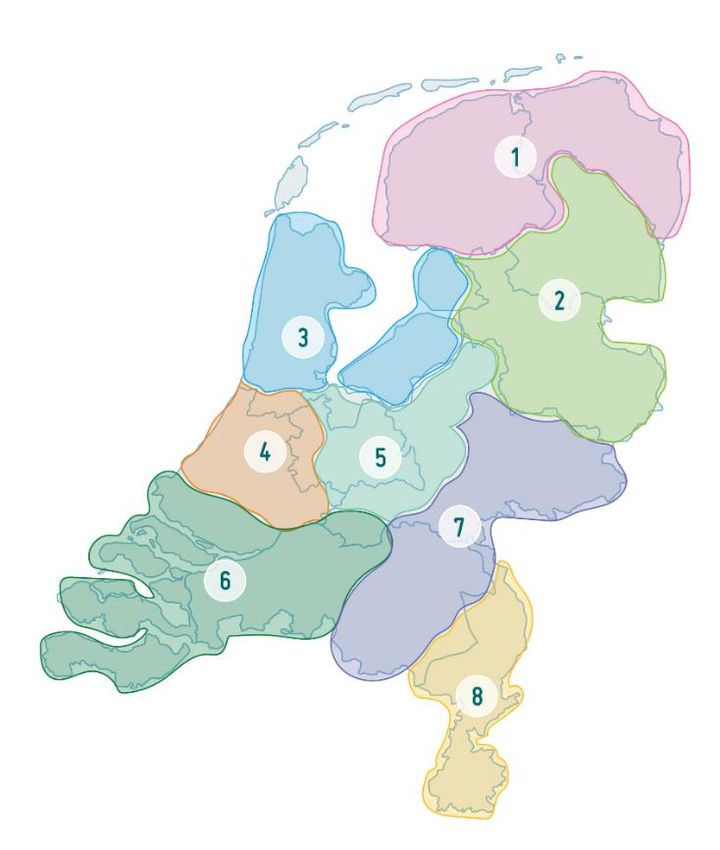
Table of contents
Abbreviation list ............................................................................................................................................... 3

Part I ................................................................................................................................................................ 4

    Executive summary ............................................................................................................................................. 4

    General information ........................................................................................................................................... 5

    National ageing situation .................................................................................................................................... 6

    Method ............................................................................................................................................................. 19

Part II: 20 Years of MIPAA/RIS ........................................................................................................................ 21

    National actions and progress in implementation of MIPAA/RIS ..................................................................... 21

    Recognizing the potential of older persons ...................................................................................................... 21

    Encouraging longer working life and ability to work ........................................................................................ 26

    Ensuring ageing with dignity ............................................................................................................................. 30

    Ensuring ageing with dignity in the last 20 years.............................................................................................. 34

Part III: Healthy and Active Ageing in a Sustainable World ............................................................................. 35

    Contribution of ageing-related policies to the implementation of the 2030 Agenda and its Sustainable
    Development Goals .......................................................................................................................................... 35

    Lessons learnt from managing the consequences and impacts for older people in emergency situations: the
    COVID-19 pandemic.......................................................................................................................................... 37

    Activities in preparation and implementation of the WHO Decade of Healthy Ageing 2020 – 2030 .............. 38

Conclusions and priorities for the future ........................................................................................................ 39

References ..................................................................................................................................................... 41

                                                                                    2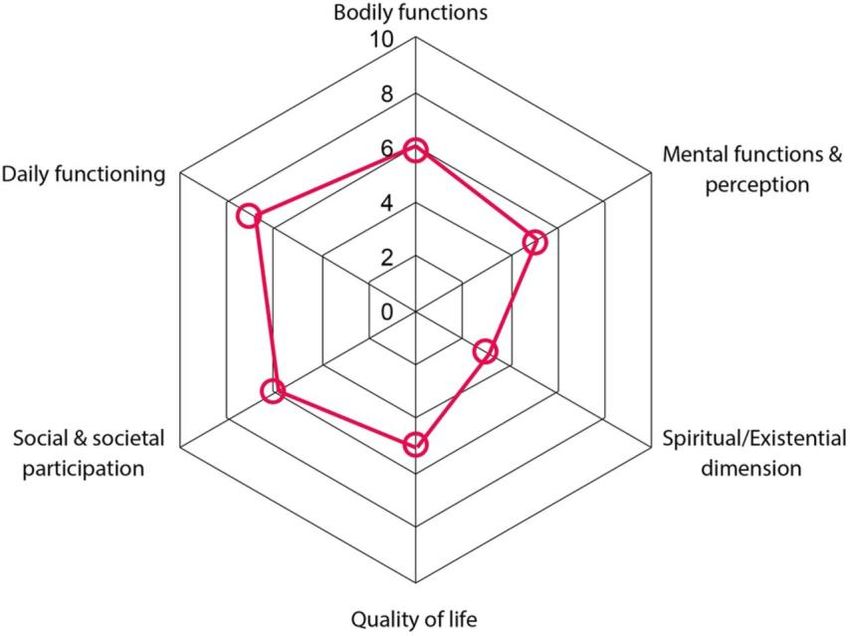
Abbreviation list
AOW        Old Age Pensioning Act [Algemene Ouderdomswet]
CBS        Statistics Netherlands [Centraal Bureau voor Statistiek]
COVID-19   Coronavirus disease of 2019
GDP        Gross Domestic Product
IGJ        Health and Youth Care Inspectorate [Inspectie Gezondheidszorg en Jeugd]
MIPAA      Madrid International Plan of Action on Ageing
NZa        Dutch Health Care Authority [Nederlandse Zorgautoriteit]
OECD       Organization for Economic Co-operation and Development
PPE        Personal Protective Equipment
RIS        Regional Implementation Strategy
RIVM       National Institute for Public Health and the Environment [Rijksinstituut voor
           Volksgezondheid en Milieu]
SCP        The Netherlands Institute for Social Research [Sociaal en Cultureel Planbureau]
SDGs       Sustainable Development Goals
UNECE      United Nations Economic Commission for Europe
WHO        World Health Organization
Wlz        Long Term Care Act [Wet langdurige zorg]
Wmo        Social Support Act [Wet maatschappelijke ondersteuning]
ZIN        National Health Care Institute [Zorginstituut Nederland]
ZonMw      The Netherlands Organization for Health Research and Development
           [Nederlandse organisatie voor gezondheidsonderzoek en zorginnovatie]
Zvw        Health Insurance Act [Zorgverzekeringswet]

                                     3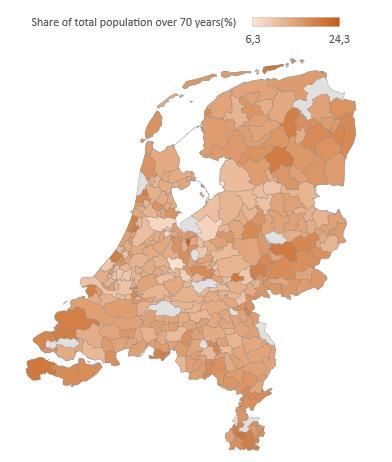
Part I
                                        Executive summary

This report presents the fourth review and appraisal of the Regional Implementation Strategy (RIS) of
the Madrid International Plan of Action on Ageing (MIPAA) for the Netherlands. It reflects on the
developments of the past five years to address the three main goals of the 2017 Lisbon Ministerial
Declaration: i) Recognizing the potential of older persons; ii) Encouraging longer working life and ability
to work; iii) Ensuring ageing with dignity. In addition, this review and appraisal describes the main
achievements in the implementation of MIPAA/RIS over the past 20 years in a nutshell. The report also
includes a brief overview of the lessons learnt from managing the consequences and impacts of the
COVID-19 pandemic for older people.
         An independent academic institute (IQ healthcare) carried out this research. The method used
for this review and appraisal includes desk research and a qualitative approach. Desk research consists
of collecting and selecting information from documents issued by the government as well as grey and
peer-reviewed literature. The qualitative approach entails 27 semi-structured interviews with various
stakeholders. These stakeholders are selected by means of purposeful sampling. The stakeholders
represent different institutions (e.g. ministerial departments, local government, academia, and
organizations representing the interests of older persons), offering a wide range of perspectives. We
also gave the stakeholders the opportunity to provide feedback on the concept version of this report.
         The main finding of this report is that the Netherlands has made significant progress in
improving the lives of older persons through different programs and structural reforms. To meet the
first goal (i.e. recognizing the potential of older persons), the Netherlands has made a shift towards
‘ageing in place’ and by promoting healthy ageing. Healthy ageing is anchored in various programs and
agreements that advance lifestyle interventions and prevention. The most significant achievement to
meet the second goal (i.e. encouraging longer working life and ability to work) is pension reform. The
reform improves the sustainability of pensions and enhances intergenerational solidarity. With respect
to the third goal (i.e. ensuring ageing with dignity), various programs have been initiated and
implemented to address this goal, including large investments and significant programs to improve the
quality of long-term care.
         Even though welfare standards are high, the Netherlands should strengthen its efforts to
improve the lives of older persons. We have made several recommendations on which the Netherlands
can focus in the future (see page 39). We highlight four of these recommendations in this executive
summary. First, the Netherlands should enhance their efforts to ensure that there is sufficient supply
of suitable housing and care for older persons. Housing and staff shortages already cause disruptions
and will likely become an even greater challenge in future. Second, a substantial disparity exists
between social groups with respect to healthy ageing. People from a low socioeconomic class have a
significantly lower life expectancy than those from a high socioeconomic class. Substantial future
efforts are required to address this vertical inequity. Third, due to developments such as digitalization,
older persons may feel increasingly excluded from society. Investments are needed to guarantee the
inclusion of older persons in society. Fourth, regional variation remains with respect to the supply of
care and support, and requires attention.
         On the whole, an integrated approach is needed to strengthen efforts to improve the lives of
older persons in the Netherlands. This calls for collaboration between different ministries; between
national and local governments; and between government and relevant stakeholders (e.g. NGOs and
interest groups).

                                                    4
General information
1. Country name: The Netherlands
2. Name and contact details of the author(s) of the report:
Florien Kruse, IQ healthcare, Radboudumc (Florien.Kruse@radboudumc.nl), Erik Wackers, IQ
healthcare, Radboudumc (Erik.Wackers@radboudumc.nl), Simone van Dulmen, IQ healthcare,
Radboudumc (Simone.vanDulmen@radboudumc.nl)
3. Name and contact details of official national focal point on ageing:
Jacqueline Hoogendam, Ministry of Health, Welfare and Sport (jj.hoogendam@minvws.nl)
4. Name, reference, and date of adoption or status of preparation of national strategy, action
plan or similar policy document on ageing (please attach relevant documents in the annex):
n/a
5National ageing situation
Demographic indicators and their projections
As in many other OECD countries, the population in the Netherlands is ageing[1]. The relative share of
persons aged 65 to 80 years has increased in the Netherlands from approximately 10% to 15% since
2000 (Figure 1). Combined with a slight increase in the relative number of persons aged over 80 years,
demographic trends show substantial growth of the ageing population. The population pyramids in
Figure 2 (in 2020) and Figure 3 (projection for 2030) indicate that the trend of ageing will not take a
turn in the upcoming decade. In fact, a large share of the Dutch population is currently between 50
and 60 years old, contributing to a further increase of the elderly share in the population in the next
ten years. The share of persons over 70 is highest in rural areas, whereas younger age groups
concentrate in urban areas (Figure 4).
The characteristics of older people have also changed over the years. In 2014, about 38% of people
aged 70 and over live alone, and 23% have no children[2]. Older persons who live alone are more likely
to require support and care[3]. In addition, the share of older persons with a migrant background will
increase. In 2020, the share of people aged 65 and over with a migrant background accounts for 14%.
This will increase to 25% in 2050[4].
The average life expectancy has more or less stabilized for both males and females in the past five
years (Figure 5). Life expectancy numbers for 2020 are outliers, which are likely caused by the COVID-
19 pandemic and its detrimental effects on the older segment of the population[5]. The life expectancy
in perceived good health, from 65 years onwards has fluctuated for females over the past five years,
returning to the level of approximately 13 years in 2020 (Figure 6). Life expectancy in perceived good
health for males has seen a steady rise in recent years, closing the gap with females (Figure 6). Life
expectancy in perceived good health show opposite trends to actual life expectancy over 2020.
However, various factors are associated to life expectancy. One factor is socioeconomic status. Persons
with a low socioeconomic status have a lower life expectancy compared to persons with a high
socioeconomic status (Figure 7). This life expectancy gap between high and low socioeconomic status
has increased in 2011-2014 compared to 2004-2007 with respectively 7.5 compared to 6.9 (Figure 7).
Recent figures on the difference between low, middle and high educated persons exhibit similar
trends[6]. The reasons behind this trend is numerous and complex, but people with a low
socioeconomic status tend to have more unhealthy lifestyles. Which brings us to another important
component behind life expectancy. A healthy diet and exercise are essential for a healthy lifestyle, and
in turn relate to extending life expectancy (also in perceived good health). However, obesity remains
a challenge in the Netherlands. Figure 8 shows that both sex and age relate to being overweight (BMI
≥ 25). Men are more often overweight than women and older persons are more often overweight
compared to the younger age groups.
Figure 9 shows absolute numbers of death for each week in each year (2016-2020). The second quarter
of 2020 demonstrates high mortality rates compared to previous years as a result of the COVID-19
pandemic. Most COVID-19 related deaths are suffered in age groups over 60. Males are more
vulnerable to COVID-19 than females, demonstrated by higher COVID-19 related deaths in males
(Figure 10).
6Annex: Demographic indicators
Figure 1. Trend on ageing over 65 years and over 80 years (% of total population)
25
20
15
10
5
0
1950
1952
1954
1956
1958
1960
1962
1964
1966
1968
1970
1972
1974
1976
1978
1980
1982
1984
1986
1988
1990
1992
1994
1996
1998
2000
2002
2004
2006
2008
2010
2012
2014
2016
2018
2020
From 65 to 80 years 80 years or over
Source: Statistics Netherlands (CBS)[7]
Figure 2. Population pyramid, the Netherlands in 2020 (% of total population)
105 years or over
100 years
95 years
90 years
85 years
80 years
75 years
70 years
65 years
60 years
55 years
50 years
45 years
40 years
35 years
30 years
25 years
20 years
15 years
10 years
5 years
0 years
-2 -1,5 -1 -0,5 0 0,5 1 1,5 2
%Male %Female
Source: Statistics Netherlands (CBS)[8]
7Figure 3. Population pyramid projection for 2030 (% of total population)
-2 -1,5 -1 -0,5 0 0,5 1 1,5 2
105 years or older
99 years
93 years
87 years
81 years
75 years
69 years
63 years
57 years
51 years
45 years
39 years
33 years
27 years
21 years
15 years
9 years
3 years
%Male %Female
Source: Statistics Netherlands (CBS)[8]
Figure 4. Regional variation in share of persons over 70 years
Source: Statistics Netherlands[9]
8Figure 5. Life expectancy from 65 years old (in years)
25
20
15
Male
Female
10
5
0
1981 1991 2001 2011 2016 2017 2018 2019 2020
Source: Statistics Netherlands (CBS)[10]
Figure 6. Life expectancy in perceived good health from 65 years old (in years)
25
20
15
Male
Female
10
5
0
1981 1991 2001 2011 2016 2017 2018 2019 2020
Source: Statistics Netherlands (CBS)[10]
9Figure 7. Average life expectancy by socioeconomic status
90
80
70
60
50
40
30
20
10
0
2004-2007 2007-2010 2011-2014
Low socioeconomic status Middle socioeconomic status High socioeconomic status
Source: RIVM 2018[11]
Figure 8. Share of persons being overweight (BMI ≥25) (2020)
70
60
50
40
30
20
10
0
18-34 year 35-49 year 50-64 year 65+ 18-34 year 35-49 year 50-64 year 65+
Men Women
Source: www.volksgezondheidenzorg.info 2021 [12]
10Figure 9. Number of deaths per year (absolute numbers per week)
6000
5000
4000 Trend 2016
Trend 2017
3000 Trend 2018
Trend 2019
2000 Trend 2020
Trend 2021
1000
0
2 4 6 8 10 12 14 16 18 20 22 24 26 28 30 32 34 36 38 40 42 44 46 48 50
Source: Statistics Netherlands (CBS)[13]
Figure 10. Share of COVID-19 deaths per age group (%)
3
2,5
2
1,5
1
0,5
0
0 3 6 9 12 15 18 21 24 27 30 33 36 39 42 45 48 51 54 57 60 63 66 69 72 75 78 81 84 87 90 93 96 99
Male (%) Female (%)
Source: Statistics Netherlands (CBS), September 2020[5]
11Key quantitative social and economic indicators
Compared to other OECD countries, the Netherlands scores well on different measures that relates to
the well-being of Dutch citizens[14]. Life satisfaction among those 65 years and over in the Netherlands
does not differ much from other age groups[15]. Also life satisfaction of older persons in the
Netherlands is higher compared to the European average[15]. In addition, the share of persons aged
over 65 years who rate their own health as fair, bad or very bad is low compared to other OECD
countries (Figure 11).
Along with an ageing population, the average working life in the Netherlands increased over the years
(Figure 12). The average age of retirement was 64.2 years in 2015 and 65.6 years in 2020. A large share
of retirees was 66 years old in 2018-2020, which is illustrated in Figure 13. These trends are paired with
improved labor participation in the age group 55–65 years old (Figure 14). The gross labor participation
rate shows people that are either employed or unemployed (i.e. persons without paid work but are
looking for work), whereas the net labor participation rate only indicates how many people are in paid
work. The net rate excludes unemployed people, and is therefore lower than gross rates. Figure 14
also shows that the gap between male and female labor participation in the age group 55–65 years old
has decreased in the past five years. Both groups have increased their labor participation, but female
participation rates have also risen compared to male rates.
Although life expectancy, average retirement age and labor participation rates are increasing, a larger
share of persons over 65 years was at risk of poverty in 2020 than in 2015 (Figure 15). These persons
are “at risk of poverty after social transfers, severely materially deprived or living in households with
very low work intensity”[16]. Social transfers include social support structures such as old-age
pensions, unemployment benefits and family-related benefits[17]. As far as our knowledge goes, the
determinants behind this rise remain uncertain. One possible factor is the increase in the share of older
persons with a migrant background as migrants face higher risks of poverty[18]. Another potential
factor that relates to poverty among older persons is home ownership. Older persons who do not own
a house face financial difficulties more often than homeowners[19, 20].
12Annex: Social and economic indicators
Figure 11. Country comparison of the share of adults aged 65 years and over rating their own health
as fair, bad, or very bad (2017 or nearest year)
Lithuania
Latvia
Portugal
Estonia
Hungary
Korea
Poland
Slovak Republic
Turkey
Czech Republic
Japan
Chile
Greece
Slovenia
Israel
France
Germany
Italy
Spain
OECD35
Austria
Luxembourg
Finland
Belgium
Denmark
Iceland
United Kingdom
Netherlands
Sweden
Switzerland
Ireland
Norway
Australia
United States
Canada
New Zealand
0 10 20 30 40 50 60 70 80 90 100
Source: OECD 2019[21]
13Figure 12. Average retirement age (in years)
66
65
64
63
62
61
60
59
58
*Preliminary statistics
Source: Statistics Netherlands (CBS)[22]
Figure 13. Relative number of pensioners per age group (%)
100%
90%
80%
70%
60%
50%
40%
30%
20%
10%
0%
59 years or younger (%) 60 years (%) 61 years (%)
62 years (%) 63 years (%) 64 years (%)
65 years (%) 66 years (%) 67 years or older (%)
*Preliminary statistics
Source: Statistics Netherlands (CBS)[22]
14Figure 14. Gross and net labor participation between 55 and 65 years (%)
85
80
75
70
65
60
55
50
45
2016 2017 2018 2019 2020
Male gross labour participation (%) Male net labour participation (%)
Female gross labour participation (%) Female net labour participation (%)
Source: Statistics Netherlands (CBS)[23]
Figure 15. At risk of poverty rate (%) for people 65 years and over
16,0
14,0
12,0
10,0
8,0
6,0
4,0
2,0
0,0
2015 2016 2017 2018 2019 2020
Females Males
Source: Eurostat[24]
15Description of social, economic and political situation
The third Review and Appraisal of MIPAA/RIS reported reaching the milestone of 17 million inhabitants
in the Netherlands[25]. As of August 2021, the number of inhabitants has surpassed 17.5 million. The
population density is relatively high compared to most other countries, with 517 inhabitants per
square kilometer as of January 2020[26]. As a result, the Netherlands is the most densely populated
nation in the European Union, after Malta.
The Dutch economy was characterized by annual growth in the period 2014-2019 (Figure 16). Due to
the COVID-19 pandemic and its subsequent measures, the Gross Domestic Product (GDP) in the
Netherlands dropped significantly in 2020. Recent figures do show recovery signs, as investments are
increasing, but household consumption is still below the levels of before the COVID-19 pandemic[27].
The total amount of health care expenses in relation to the GDP have steadily risen since 2000.
However, growth of these expenses has decelerated in the last 10 years as compared to the period
2000-2010[28]. The Netherlands rank 7th in the OECD in terms of health expenditure in relation to GDP,
as of 2019 (Figure 17).
The Netherlands has the highest long-term care expenses of all OECD countries, allocating more than
3.5% of GDP on long-term care services in 2018[29] (see Figure 18). The majority of these expenses are
in nursing homes (approximately 80%), and remaining expenses are allocated to hospitals, home care,
social providers and households[29]. (Please note that the definition of long-term care expenses differs
across OECD countries. It is therefore difficult to compare these costs across borders. A recent study
finds that the long-term costs discrepancy between the Netherlands and Denmark is much smaller
than the OECD statistics suggest[30], because Denmark does not include all its social care expenses in
its OECD statistics.)
Figure 16. Gross domestic product (%-mutation; compared to previous year)
5
4
3
2
1
0
-1
-2
-3
-4
-5
2005 2006 2007 2008 2009 2010 2011 2012 2013 2014 2015 2016 2017 2018 2019 2020
Source: Statistics Netherlands[27]
16Figure 17. Health expenditure in relation to GDP, in percentages (2019)
14,0
12,0
10,0
8,0
6,0
4,0
2,0
0,0
Iceland
Serbia
Turkey
France
Austria
Finland
EU27
Italy
Romania
Norway
Denmark
Netherlands
Bulgaria
Hungary
Latvia
Germany
Spain
Greece
Cyprus
Slovak Republic
Croatia
Poland
Malta
Czech Republic
Ireland
Slovenia
Luxembourg
Belgium
Portugal
Switzerland
Sweden
Lithuania
Estonia
United Kingdom
North Macedonia
Government/Compulsory Voluntary/Out-of-pocket
Source: OECD[31]
Figure 18. Long-term care expenditure by government and compulsory insurance schemes in relation
to GDP, in percentages (2017 or nearest year)
4,0
3,5
3,0
2,5
2,0
1,5
1,0
0,5
0,0
Iceland
Israel
Norway
Finland
France
Italy
United States
Netherlands
Denmark
Canada
Austria
Latvia
Hungary
Germany
Spain
Korea
Poland
Greece
Slovak Republic
Czech Republic
Ireland
Slovenia
Belgium
Switzerland
Luxembourg
Portugal
Lithuania
Estonia
Sweden
United Kingdom
2015 2016 2017
Source: OECD [21]
Social and economic policies in relation to the COVID-19 pandemic
The first case of COVID-19 was identified at the end of February 2020 in the Netherlands. Shortly after,
government measures were taken to prevent the spread of the virus[32]. The government instituted
an ‘intelligent lockdown’, meaning that not all outdoors activities were banned and persons without
any COVID-19 symptoms or within their household were still allowed to leave their house. Those
17suffering from symptoms were required to take a COVID-19 test and go into quarantine. Older persons
were particularly affected by the visitor ban for nursing homes, which was instituted on March 20th in
2020[32]. (This report includes a longer description of the impact of the COVID-19 pandemic on page
36.)
The government introduced several economic policies to support individuals, households and
organizations suffering financially from lockdown measures[33]. The most important measure of these
so-called ‘support- and recovery packages’ is NOW [Noodmaatregel Overbrugging voor
Werkgelegenheid]. This package consists of funds for entrepreneurs suffering at least 20% up to a
maximum of 80% of revenue loss. Up to 85% of personnel costs are covered by this government
measure[34]. The NOW package has been extended for the fourth time, until September 30, 2021[34].
Government lockdown and support measures seem to affect younger persons (15-25 years) negatively
in their employment rates, while persons in the age categories 25-45 and 45-75 are mostly unaffected
(Figure 18). The lockdown measures resulted in a reduction of temporary and part-time jobs (typically
filled by younger people) and support measures created a safety net for those in tenure jobs (typically
older persons).
Figure 18. Employment rates per age category since 2020 (Quarter 1 of 2020 is base period =100)
102
100
98
96
94
92
90
88
2020 Q1 2020 Q2 2020 Q3 2020 Q4 2021 Q1
15-25 years 25-45 years 45-75 years
Source: Statistics Netherlands[35]; inspired by “Jong tijdens corona: minder werk, meer bijstand, geen
stage en achteraan in de vaccinatierij” Mathijs Bouwman, Het Financieele Dagblad, 25 juni 2021
18Method
Several data sources were used to review and appraise the advancements in the Regional
Implementation Strategy (RIS) of MIPAA in the Netherlands. First, several publicly available statistical
data sources were used to chart key demographic, economic, social and political developments. Most
data were available through Statistics Netherlands [Centraal Bureau voor de Statistiek]. Data by
Eurostat and OECD were also used to supplement national data.
Second, academic and grey literature (e.g. government reports, working papers, policy briefs) were
used to identify policy developments for people aged 65 and over in the past five years. We searched
academic literature for evaluations using empirical evidence on policy reforms for older persons in
since 2002.
Third, dialogue sessions were organized with representatives of ministerial departments, NGOs, social
partners, academic organizations and civil society (see Table 1 for an overview). These dialogue
sessions were held online due to COVID-19 restrictions. The sessions were semi-structured and
followed three steps. First, a short introduction on MIPAA/RIS was given by the authors, explaining the
three main goals adopted in the 2017 Lisbon Ministerial Declaration. Second, stakeholders were then
asked to reflect upon these goals from their point of view, using the last five years as time frame.
Finally, stakeholders were asked to reflect on the impact of COVID-19 and the lessons learnt for
managing the consequences and impacts for older people in emergency situations.
A draft report was written after collecting data from these three sources. Subsequently, participating
stakeholders were approached to provide feedback on the draft report. This led to several corrections
and additions to the draft report. Close cooperation with the National Focal Point was maintained
throughout the process of the review and appraisal.
Older persons are traditionally defined by the United Nations and researchers as persons aged 60 and
over or 65 years and over[36]. However, a more nuanced perspective on ageing may be required to
account for international and regional differences in mortality risks, health status and socioeconomic
characteristics[36]. Therefore, in this report we refrain from defining ‘older persons’ by a certain age,
because the definition is likely to be topic- and context-dependent. The report adopts the definition of
older persons used in the relevant policies, reports or measures.
19Annex
Table 1. Overview of respondents per stakeholder and type
Stakeholder Type Number of
respondents
Ministry of Health, Welfare and Sport National government 4
Ministry of Social Affairs and Employment National government 1
Ministry of Infrastructure and Water National government 1
Management
Ministry of Economic Affairs and Climate Policy National government 2
Ministry of Education, Culture and Science National government 1
Municipality of Amsterdam Local government 1
Zorginstituut Nederland (ZiN) [National Health Governmental organization 1
Care Institute]
Rijksinstituut voor Volksgezondheid en Milieu Governmental organization 1
(RIVM) [National Institute for Public Health and
the Environment]
Sociaal en Cultureel Planbureau [Social and Governmental organization 3
Cultural Planning Office]
Vilans (Long-term care expert center) NGO 2
Member of Raad van Ouderen (RVO) [The Representative organization for 1
elderly council] older persons
Koepel Gepensioneerden Representative organization for 1
older persons
Algemene Nederlandse Bond voor Ouderen Representative organization for 1
(ANBO) older persons
KBO-PCOB Katholieke Bond van Ouderen en Representative organization for 1
Protestants Christelijke Ouderenbond older persons
Actiz (Branch association long term care Social partner/ NGO 1
providers)
Leyden Academy on Vitality and Ageing NGO/ academic organization 1
Pharos (expert center for inequalities in health NGO 1
care)
Alzheimer Nederland (Alzheimer’s NGO 2
Netherlands)
20Part II: 20 Years of MIPAA/RIS
National actions and progress in implementation of MIPAA/RIS
At the fourth Ministerial Conference on Ageing in Lisbon in 2017, the representatives of the member
States of the United Nations Economic Commission for Europe (UNECE) restated their commitments
to fulfil the Regional Implementation Strategy (RIS) of MIPAA. At the Lisbon Ministerial Declaration
[37], three main policy goals for 2022 were set:
(1) Recognizing the potential of older persons;
(2) Encouraging longer working life and ability to work;
(3) Ensuring ageing with dignity.
Part II of this report discusses the progress towards these policy goals. Relevant and important policy
developments are described for each goal. The most prominent developments are described first
within each goal. Additional and supporting information is provided in textboxes throughout the
report.
Recognizing the potential of older persons
Several developments took place in the Netherlands over the past five years to improve and optimize
the potential of older persons. This development can roughly be categorized into three categories: 1)
the long-term care reform and ‘ageing in place’; 2) facilitating healthy ageing and age-friendly
environments and housing; and 3) positive image of older persons.
The long-term care reform and ‘ageing in place’
The long-term care system in the Netherlands was drastically reformed in 2015 (as described in the
previous MIPAA/RIS review and appraisal[25, 38]). This reform supported a change towards financial
sustainability, more decentralization, and deinstitutionalization[38]. Financial sustainability was one of
the main drivers of the long-term care reform. Before the reform, long-term care costs were increasing
steadily and policymakers aimed to curb the trend. During the reform, significant cuts were made to
the long-term care budget. This raised serious concerns about the quality of care in nursing homes
and, in response, long-term care funding picked up again just two years after the reform[39].
The reform consisted of several elements. In the Social Support Act [Wmo], social care was
decentralized and became the municipalities’ responsibility – more so than before the reform. This
meant that municipalities were mandated to manage more social care tasks and, subsequently, a
higher budget. However, the cumulative total long-term and social care budget was smaller, due to
expectations of efficiency gains from decentralization. The Long-term Care Act [Wet langdurige zorg]
regulated and organized long-term care for clients with severe care needs at home or within a
residential care setting. Regional care offices remained responsible for purchasing long-term care
within their region. These offices are run by a single health insurer, typically the regional market leader.
Deinstitutionalization of the long-term care reform was part of a normative reorientation towards
reducing medicalization and towards more individual and social responsibility[38]. As a result, policies
aim to facilitate ageing in a home-setting instead of an institutional setting (‘ageing in place’). This
transition required however some fine-tuning along the way. Three policy developments that have
smoothed the transition are outlined below.
First, the ‘alliance for elderly care’ [Pact voor de Ouderenzorg] was formed in March 2018 to address
three main points of action: combating loneliness, supporting ‘ageing in place’, and improving quality
of nursing home care[40]. Through this alliance, various programs were launched, which are
mentioned in this report as well (e.g. United against Loneliness’ [Eén tegen Eenzaamheid]). The alliance
21was signed by 35 stakeholders (i.e. branch organizations, municipalities, health care providers, elderly
representative organizations, and private companies) in the field.
Second, the policy program to facilitate ‘ageing in place’ and maintaining autonomy for older persons
was initiated in 2018 [Programma langer thuis]. The government allocated €340 million in 2018 until
the end of 2021 to achieve three aims: (1) providing better support and care at home; (2) supporting
informal caregivers and volunteers; (3) facilitating more age-friendly living environments for older
persons[41].
Third, funds were also allocated to relieve the burden of informal caregivers and volunteers. A respite
care incentive [Aanjager respijtzorg] was introduced to encourage the uptake of respite care among
informal caregivers. In addition, a pilot started in ten municipalities which facilitated older persons
who receive informal care at home to stay at a nursing home temporarily (a kind of respite care). The
government supported this pilot with €1 million[42].
Facilitating healthy ageing and age-friendly environments and housing
Prevention has gained public interest in the past five years. The National Prevention Agreement
[Nationaal preventieakkoord] was introduced in 2018, supported by a large number of stakeholders in
civil society and the private sector[43]. Its main targets are reducing smoking, obesity and alcohol use
among the wider population. One prevention program, introduced as part of the National Prevention
Agreement, encourages and supports municipalities to reduce the life expectancy gap between
socioeconomic groups [GezondIn] (see Figure 7). (The Public Health Act [Wet publieke gezondheid],
introduced in 2008, had already given municipalities the responsibility for protecting and promoting
public health among older persons[44].)
Current and future generations are likely to benefit from the National Prevention Agreement, as
improving lifestyles is likely to improve healthy ageing. An early evaluation (2019) of the effects of the
National Prevention Agreement shows moderate positive results[45]. Other prevention programs are
relevant for older persons as well, such as reducing the risk of falling and the vaccination program for
the influenza virus, carried out by The National Institute for Public Health and the Environment [RIVM].
In addition, the aim of the RIVM is to establish early detection mechanisms for frailty in older
persons[46].
Box 1:
Municipality of Amsterdam: Vital & Healthy
The municipality of Amsterdam launched the policy program ‘Vital & Healthy’ [Vitaal & Gezond] for
the period of 2020-2024. The municipality of Amsterdam began to collaborate with one large health
care insurer, various health care providers and client organizations to reinforce policies across
medical and social care domains. The aim of the program is to achieve equal opportunities to live in
good health. While the program may benefit all inhabitants of Amsterdam, specific focus goes out
to elderly care, mental health, youth care and chronic care[47].
The housing market in the Netherlands has faced shortages over the past five years. The nationwide
deficit of appropriate housing is estimated at 300,000 homes in 2021[48]. The financial crisis in 2008
caused the construction of houses to stagnate, despite the continued growth of the population.
Recently, environmental restrictions have resulted in fewer permits for construction[49]. Older
persons are also affected by these trends as fewer elderly-friendly living facilities are available for the
growing share of persons aged over 65. A recent advisory report from an inter-ministerial workgroup
stresses the need to address housing challenges for vulnerable groups such as older persons by means
of an integrated approach[50].
22Age-friendly living environments were stimulated by several policy measures. A policy was released in
2019, which aimed to incentivize the development of new facilities for housing and care for older
persons[51]. The policy focused on financing initiatives of citizens or social entrepreneurs. This
consisted of three arrangements:
• Subsidy for initiating a new housing and care arrangement;
• The government is the guarantor for 2/3 of the loans up to a maximum of €200,000 in the
development phase;
• The government is guarantor for 15% of the loan of establishment costs, which allows
entrepreneurs to finance the project at a faster rate[52].
This financial stimulation program targets the development of small-scale and clustered housing
arrangements for people with low and middle income. Furthermore, municipalities are supported in
developing a vision for housing – fitting their local context. A taskforce was initiated in 2020 to further
aid this process [Taskforce Wonen en Zorg]. Several stakeholders are involved in this taskforce: the
Ministry of Health, Welfare and Sport; the Ministry of Interior and Kingdom Relations; the Association
of Dutch Municipalities (VNG); Aedes and Actiz (umbrella organizations for housing corporations and
long-term care organizations, respectively)[53]. Their aim is to facilitate municipalities in addressing
the housing deficits for elderly. In 2021, the Association of Health Insurers (ZN) joined this taskforce.
On April 8 2021, these organizations agreed to build an additional 25,000 nursing home units and an
additional 60,000 housing facilities in the next five years, and also to increase the number of adapted
housing units for older persons [Bestuurlijke afspraken Wonen en Zorg][54].
Box 2:
Bicycle mobility program elderly [Programma Doortrappen]
Cycling has a positive effect on healthy ageing, social inclusiveness and autonomy for older persons.
However, 75% of cycling accident casualties are among people aged 65 years and over[55]. The
program for bicycle mobility, initiated by the Ministry of Infrastructure and Water Management in
2018, aims to stimulate older persons to keep cycling safely. Municipalities are free to join the
program that is designed with stakeholders in the region. Approximately 150 municipalities have
joined the program. The national government has invested €100 million in improving safety of
bicycle lanes and bicycle parking for the overall population.
Positive image of older persons
Several achievements have been made to improve the representation and positive image of older
persons. An advisory body of elderly to the Ministry of Health, Welfare and Sport was established in
2018, to ensure involvement of older persons and their representatives[56]. The so-called council of
elderly [Raad van Ouderen] offers advice to the Ministry and raises attention for new policy themes
(agenda-setting). An advisory report was published by the Council of Public Health and Society – an
independent advisory body to the government and parliament – on the image of older persons within
society[57]. They noted an important precondition for optimizing the potential of older persons: the
generational awareness of the added value of older persons for society. A manifest was published and
endorsed by several political parties, elderly organizations and an elderly broadcasting organization in
2017, which aimed to improve the image and appreciation of older persons [Waardig ouder worden;
WOW][58]. The Ministry of Health, Welfare and Sport and the council of elderly launched a campaign
to further raise this awareness at the end of 2020 called ‘The value of ageing’[59].
23Participation in other campaigns
The Global Campaign to Combat Ageism is led by the World Health Organization (WHO). Ageism is
defined as ‘how we think (stereotypes), feel (prejudice) and act (discrimination) towards others or
ourselves based on age’[60]. While the Netherlands does not take part in the Global Campaign, several
policy measures are in place to combat ageism, which are described below. The Netherlands does
participate in the Open-ended Working Group on Ageing (OEWG-A).
Discrimination in general is prohibited by law (Article 1 of the constitution), and an act to ensure equal
treatment at the workplace across age groups was passed in 2004[61]. Furthermore, employers are
financially incentivized to hire older (over 56 years) and those disabled since 2018. While a policy
program was active prior to 2018 and offered a discount on social premiums for older employees, the
new arrangement allows more employers to make use of the compensation[62]. Finally, The
Netherlands Institute for Human Rights [College voor de Rechten van de Mens] actively protects and
promotes human rights since 2012[63].
Potential of older persons in the last 20 years
Three main developments characterize the shift towards recognizing the potential of older persons in
the last two decades. The first shift is an increase of older persons living autonomously at home
(‘ageing in place’). The Dutch government has both facilitated and stimulated this shift [Program
Langer Thuis]. An evaluation by the RIVM in 2020 found that of among persons over 75 living at home,
75% consider themselves in control of their life, 63% indicate they receive adequate support and care,
and 74% consider themselves competent in arranging support and care[64]. The second trend is a shift
towards healthy ageing, lifestyle interventions and prevention. The National Prevention Agreement
[Nationaal Preventieakkoord] embodies this development. The notion of positive health is illustrative
of this broader approach to health (see box 3 for a short description). Policymakers and researchers
have increased their efforts to focus on and improve positive health[65]. The third trend is the
recognition that pensioners remain a key workforce for society. For example, they contribute as
volunteers or as informal care workers.
Future actions require a persistent focus on prevention, as lifestyle diseases such as obesity are
becoming more prevalent. Whereas approximately one third of the population was overweight in the
Netherlands in the 1980s, this number has risen to approximately half of the Dutch population[66].
The National Prevention Agreement aims to reduce overweight, heavy drinking and smoking by 2040.
The National Institute for Public Health and the Environment [RIVM] has contributed to research on
prevention and closely monitors the progress of policy efforts that address prevention. Their efforts,
as well as other academic institutions, play an important role in addressing future challenges in
prevention. For example, alcohol consumption among older persons remains a challenge and deserves
future attention[67]. Furthermore, housing deficits remain an important challenge for older persons
in the upcoming years. An increased share of older persons who remain in their home-setting (‘ageing
in place’) require appropriate housing, such as housing with street-level entrance and proximity to
facilities[68]. The current housing crisis may make those efforts more challenging. The last topic that
will require attention is to continue efforts that make environments age-friendly. This requires
collaboration between different governments (national and local), ministries and sectors.
Box 3. The concept of ‘positive health’
The WHO defined health as ‘A state of complete physical, mental and social well-being and not
merely the absence of disease or infirmity’ in 1948[69]. Recent developments have led to broader
considerations of the concept of health, in which disease may coexist with health. In the
Netherlands, the concept of ‘positive health’ was introduced by Machteld Huber[70]. This concept
encompasses six dimensions of health: (1) bodily functions; (2) mental functions and perception; (3)
24spiritual/ existential dimension; (4) quality of life; (5) social and societal participation; (6) daily
functioning (Figure 19). The approach of ‘positive health’ allows for a more dynamic approach to
health, in which personal dimensions can influence the perception of health. This concept is
particularly relevant for older persons, as they often suffer from one or multiple diseases, while they
may still consider themselves healthy. Policy developments in the last 20 years have incorporated
these dimensions and taken personal circumstances into consideration.
Figure 19. Six dimensions of ‘positive’ health (fictional estimation)
Source: Huber et al., 2016[70]
25Encouraging longer working life and ability to work
As the description of the quantitative social and economic indicators in the rapport already highlighted,
the trend towards a longer working life has persisted in the Netherlands over the last five years.
Various policy reforms and programs have been implemented to support and regulate this
development. These can be categorized into three domains: 1) pension reforms; 2) lifelong
learning/development; and 3) encourages labor participation and hiring.
Pension reforms (2020)
The average retirement age has risen over the past five years in the Netherlands, as illustrated in Part
I. Early retirement schemes were phased-out after the introduction of new pension legislation in 2006.
At the same time, the age at which a person is entitled to their flat-rate state pension has increased
gradually. The so-called ‘Old Age Pensioning Act’ [Algemene Ouderdomswet; AOW] was set to increase
in retirement age according to rising life expectancy – one year increase in life expectancy results in
one year increase of retirement age. However, the pension agreement [Pensioenakkoord] has
proposed several reforms, which are described below.
As of January 2020, the retirement age for the flat-rate state pension has been adjusted for the period
up to 2025 (Table 2). The pension agreement has proposed that the retirement age after 2025 is set
to rise eight months for each additional year increase in life expectancy[71].
Table 2. Reform to flat-rate state pension effective January 2020
Year Previous retirement age New retirement age
2020 66 years and 8 months 66 years and 4 months
2021 67 years 66 years and 4 months
2022 67 years and 3 months 66 years and 7 months
2023 67 years and 3 months 66 years and 10 months
2024 67 years and 3 months 67 years
Source: Rijksoverheid[72]
Another proposal in the pension agreement is a temporary subsidy arrangement for sustainable
employability and early retirement. Sector organizations are able to apply for subsidies to increase
employee longevity. Early retirement schemes have become financially unattractive as a result of an
early retirement levy [Regeling Vervroegde Uittreding; RVU-heffing]. Until 2025, employers are
exempted from paying the levy up to a ceiling of €1847 monthly gross income[73]. This exemption
offers opportunities for early retirement in burdensome professions. Besides the waiver to pay taxes
on the flat-rate pension, a program [Maatwerkregeling Duurzame Inzetbaarheid en Eerder Uittreden
(MDIEU)] was initiated which subsidizes sustainable employability and supports employers to offer
their employees an early retirement for those who desire to do so[74, 75].
Furthermore, structural investments have been proposed for sustainable employability and lifelong
development. A policy program is developed in cooperation with the labor foundation [Stichting van
Arbeid][71]. The aim of this program is to provide structural (financial) support to the development of
policy for the labor force in achieving sustainable employability and lifelong learning. The policy
transcends individual sectors and targets all employees, employers and entrepreneurs in the
Netherlands.
Lifelong learning/ development
The Ministry of Social Affairs and Employment and the Ministry of Education, Culture and Science
support lifelong learning [Leven Lang Ontwikkelen]. Four types of subsidy are available for educational
26purposes for those who are ineligible for traditional student financing schemes[76]. First, a lifelong
learning credit is available for persons up to 57 years. Second, another credit is available for all persons
between 18 years and the retirement age [Nederland leert door]. Third, the STAP-budget [Stimulering
Arbeidsmarktpositie] is available for improvement of the personal labor market position, effective
from March 2022. This budget (up to €1000) is a replacement for the previous tax deductible for costs
related to education. Fourth, the SLIM arrangement [Stimuleringsregeling leren en ontwikkelen in
mkb-ondernemingen] was introduced, which targets small- and medium-sized enterprises. Several
ministries are involved in the SLIM arrangement. Lifelong learning is often not embedded within these
organizations.
Illiteracy or low literacy remains a concern in the Netherlands – about 2.5 million citizens (between 16
– 65 years old) experience serious difficulties with reading, writing and/or mathematics[77]. The share
of older persons that belong to this group is significantly higher compared to other age groups[78].
The government initiated a program in 2015 [Tel mee met Taal] to reduce the number of people who
experience serious difficulties with respect to writing, reading and math skills[79]. This program has
been extended to 2024[80]. This program subsidizes social activities and employers to prevent or
reduce illiteracy or low literacy. On top of the €60 million that the government spends on adult
education every year, this program [Tel mee met Taal] spends €25 million annually[80].
Encouraging labor participation and hiring of older persons
The Ministry of Social Affairs and Employment launched an action plan in 2016 for labor market
opportunities for persons aged 50 and over[81]. The program ran until 2020 and its main goals were:
1) Equalizing labor participation rates for persons aged 50 and over to those under 50; 2) Increasing
the opportunities and use of educational programs for persons aged 50 and over; 3) Reducing the odds
of long-term unemployment for persons 50 and over.
The population is ageing, which means that the share of older persons will increase over the total
(working) population. However, this can also provide opportunities. The older population could also
be considered a ‘silver economy’[82]. The green paper on ageing by the European Commission also
indicated that a longer working life may alleviate the pressure on the labor force[83]. In order to
address possible employment discrimination, the foundation ‘open hiring’ was initiated in 2016 to
promote hiring of employees irrespective of ethnicity, age or disability. The foundation closely
cooperates with the Dutch Social Security Agency (UWV), Ministry of Social Affairs and Employment,
and municipalities to develop this initiative through pilots. The concept was brought to the
Netherlands in collaboration with Greystone, a company that has successfully introduced the idea of
open hiring in the United States[84]. An evaluation in 2020 of the pilot companies showed promising
results[85].
Furthermore, an agreement to address staff shortages in the long-term care sector was signed by
several branch organizations and the Ministry of Health, Welfare and Sport in 2017[86]. The Ministry
of Health, Welfare and Sport allocated €72 million for training and education of new health care
professionals.
If regular unemployment social benefits are terminated, persons aged 60 years and over who are
unable to find employment may apply for social security, [Wet inkomensvoorzieningen oudere
werklozen; IOW]. This measure was set to expire in January 2020, but is extended until January 2024.
Gender pay and pension gap
The Netherlands has the largest part-time employment rate of all OECD countries[87]. Relatively few
women work full-time jobs (26% of the labor force in 2020[88]). Among other factors, parental-leave
27policies may influence gender inequality in both formal as informal work[89]. Until 2019, paternity
leave was limited to two working days in the Netherlands. The share of paid and unpaid work between
men and women can be equalized by reducing the parental-leave gap between mothers and
fathers[90]. Recent legislation extended paternity leave up to one working week, with the option of an
additional five weeks at 70% of salary (provided in social security). Additional parental leave legislation
was introduced as of July 2020 [Wet invoering extra geboorteverlof; WIEG][91]. Although this measure
does not affect the position of older persons immediately, this new legislation may contribute to
reducing gender inequality in (formal and informal) work, which could benefit the financial position of
women at older age in the long run.
The previous administration (2017-2021) has introduced several policy measures to improve the labor
participation in women, such as financial compensation for day-care and education for women with
low socioeconomic status, single mothers and migrant women[92]. Finally, the national government
aimed to achieve a larger share of women in high-level functions. The Netherlands Institute for Social
Research (SCP) demonstrated that more women have found their way to the top in the period 2018-
2020[93].
The last 20 years of employment of older workers
Increasing labor participation of older persons has been the most significant development in the
Netherlands with respect to reaching the second goal of the Lisbon Ministerial Declaration (see Figure
20). This trend has two components: 1) the share of persons aged 65 and over in relation to the total
population has increased; 2) within this group, the number of persons in paid work has increased over
the years[94]. Only about 9,000 persons aged over 75 were in paid work in 2003, opposed to 30,000
persons in 2020, indicating a longer (working) life.
Figure 20. Labor participation in age groups 55-65 and 65-75 (x1000)
1800
1600
1400
1200
1000
800
600
400
200
0
2003 2004 2005 2006 2007 2008 2009 2010 2011 2012 2013 2014 2015 2016 2017 2018 2019 2020
55 to 65 years 65 to 75 years
Source: Statistics Netherlands[23]
Extending working life was stimulated through a gradual increase of the eligibility age for the Old Age
Pensioning Act [Algemene Ouderdomswet; AOW] since 2013[95]. This act has been an important pillar
for social security for older persons in the Netherlands since 1957. This pension is a flat-rate state
pension which is available for all persons over 66 years and four months as of 2021 (See Table 2).
28Future actions are required to protect older persons with a low socioeconomic status. The indexation
of pensions to adjust for inflation has been limited in the last five years, except for the basic flat rate
pension scheme [AOW] which is adjusted for inflation. Although inflation rates have been low during
the pandemic, they are expected to rise as more restrictions are lifted[96]. This resulted in lower
purchasing power for pensioners since 2008. In 2017, pensioners experienced a 0.3% year-on-year
decrease in their purchasing power, whereas the total population gained purchasing power (0.5%)[97].
Finally, an extension of the working life is not feasible for those working in heavy-duty jobs. Temporary
measures were taken to financially support pensions in these jobs, but structural actions are still to be
determined.
29Ensuring ageing with dignity
The Dutch government has continued their efforts to ensure ageing with dignity. Several policy
programs have been continued or extended in this regard, and various new policy programs have been
introduced to address ageing with dignity. The following themes stand out: 1) Loneliness; 2) Quality of
care in nursing homes and beyond; 3) Networks for frail elderly; 4) Dementia; 5) End-of-life care; 6)
Digital inclusion.
Loneliness
The ‘Alliance for Elderly Care’ has identified loneliness among older persons as an emerging challenge.
Modern society has become increasingly individualistic – signified by smaller households, longer
geographical distance between parents and their children[40]. Loneliness is negatively associated with
physical and mental wellbeing: it is a strong predictor for premature death, depression, dementia and
heart failure[98]. Emotional loneliness stems from the absence of close relationships, and social
loneliness refers to the absence of having a group of contacts[99, 100]. Figure 21 demonstrates that
emotional loneliness is most prevalent among persons aged 75 or over, whereas social loneliness is
more common in age groups above 35. The national program ‘United against Loneliness’ [Eén tegen
Eenzaamheid] was launched by the Ministry of Health, Welfare and Sport in March 2018, and its aim
is twofold: (1) signaling loneliness and facilitating dialogue on the topic; (2) addressing loneliness in a
structural and sustainable fashion[101]. A total of 212 municipalities had joined the program as of
December 2020. These municipalities are inhabited by approximately one million persons aged over
75, equal to 71% of all persons aged over 75[102]. The national program supports the formation of
local coalitions of organizations to combat loneliness.
Figure 21. Social and emotional loneliness per age category
75 years and older
65 to 75 years
55 to 65 years
45 to 55 years
35 to 45 years
25 to 35 years
15 to 25 years
0 2 4 6 8 10 12 14 16
Strong social loneliness (% persons of 15 years and older)
Strong emotional loneliness (% persons of 15 years and older)
Source: Statistics Netherlands[99]
Quality of care in nursing homes and beyond
Improving the quality of care in the nursing home sector is been placed high on the political agenda
since the long-term care reform. Concerns were raised that quality of care in some nursing homes was
too low[39] – possibly due to the significant budget cuts during the long-term care reform. Several
programs were introduced to address these concerns.
30You can also read