(DTHRW) (NTWD) Darlington, Tees, Hambleton and Richmondshire and Whitby Northumberland, Tyne and Wear and Durham Local Maternity Systems ...
←
→
Page content transcription
If your browser does not render page correctly, please read the page content below
Darlington, Tees, Hambleton and
       Richmondshire and Whitby
                 (DTHRW)

Northumberland, Tyne and Wear and Durham
                 (NTWD)

          Local Maternity Systems

            Transformation Plan -
           Supporting Information

                        August 2018
        (Updated to include costings for continuity of carer pilots)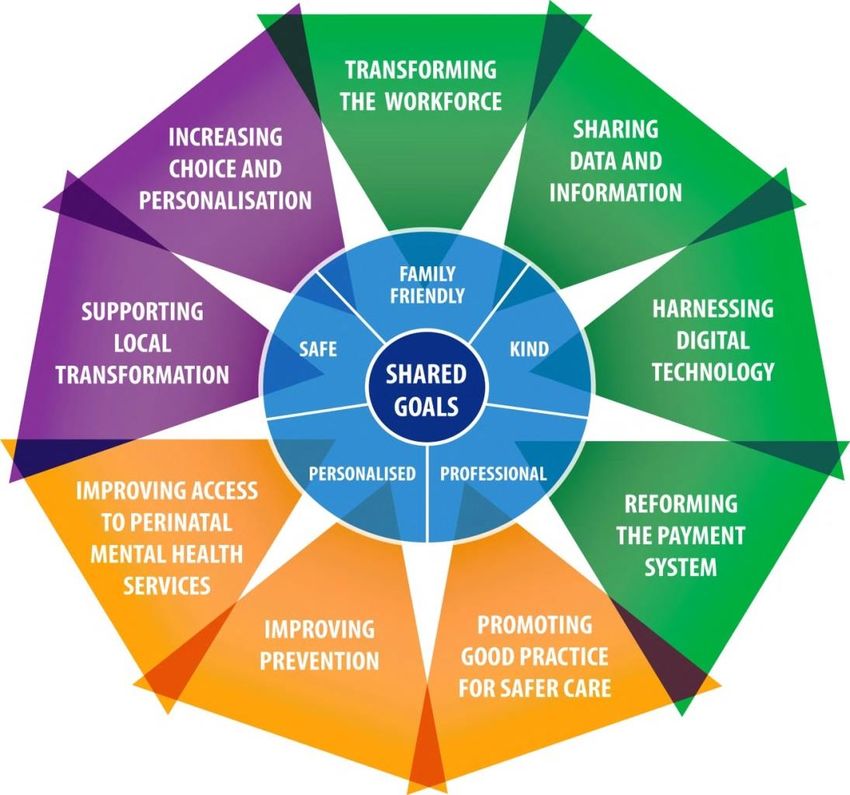
Contents
   1. Purpose of this document

   2. Better Births Vision
   Overarching Outcomes                                                     3

   3. Context

   Sustainability and Transformation Partnership (STP)                      4
   - North Cumbria and the North East (CNE) STPs/ICS                        4
   The North Cumbria and North East Local Maternity Systems                 5
   - Darlington, Tees, Hambleton and Richmondshire and Whitby               6
   - Northumberland, Tyne and Wear and Durham                               8
   Maternity Offer                                                          10
   CQC Ratings for Hospitals in North East England                          11
   Average Drive Times to an Obstetric and Midwifery-led Unit               11
   Service User Surveys                                                     12

3. Health Needs Assessment

   Population                                                               13
   Population projections                                                   14
   Pregnancy and Birth Key Indicators                                       16
   Pregnancy and Birth Trends                                               17
   Deprivation                                                              18
   % of deliveries to mothers from Black and Minority Ethnic (BME) groups   20
   Percentage of delivery episodes where the mother is aged under 18        21
   Under 18 conceptions                                                     22
   Under 18 conceptions by deprivation decile                               23
   Percentage of deliveries to women aged 35 years or above                 24
   Flu vaccinations – pregnant women                                        25
   Pertussis vaccinations – pregnant women                                  26
   Breastfeeding initiation rates                                           27
   Smoking status at time of delivery                                       28

4. Key Lines of Enquiry - Baseline and Trajectories

   Stillbirths, neonatal deaths and intrapartum brain injuries              29
   Personalised care planning                                               37
   Number of women able to choose from 3 places of birth                    38
   Continuity of carer                                                      39
   Number of women giving birth in midwifery settings                       40
   Prevention and public health                                             43
   Serious incidents                                                        44

5. How the Local Maternity System will achieve the Vision

   The Local Maternity Transformation Plan                                  48
   Co-production - Stakeholders and Partnership Working                     49
   Finance                                                                  50
   LMS Governance Structures and Delivery Mechanisms                        55
   Northern England Maternity Clinical Network                              60
   Communication and Engagement Strategy                                    64
   Glossary of Terms                                                        67

                                                                                 2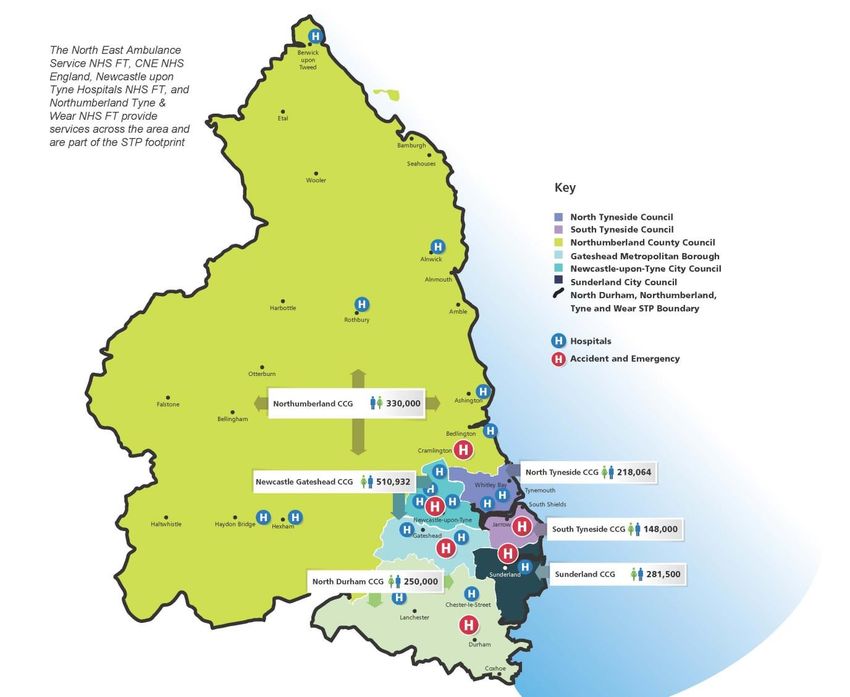
1. Purpose of this document
This document is intended to provide some of the context and rationale behind the development of
the Northumberland, Tyne and Wear and Durham (NTWD) LMS and Darlington, Tees, Hambleton
and Richmondshire (DTHRW) LMS Transformation Plans. The LMS in West, North and East
Cumbria have developed a separate but complementary plan.
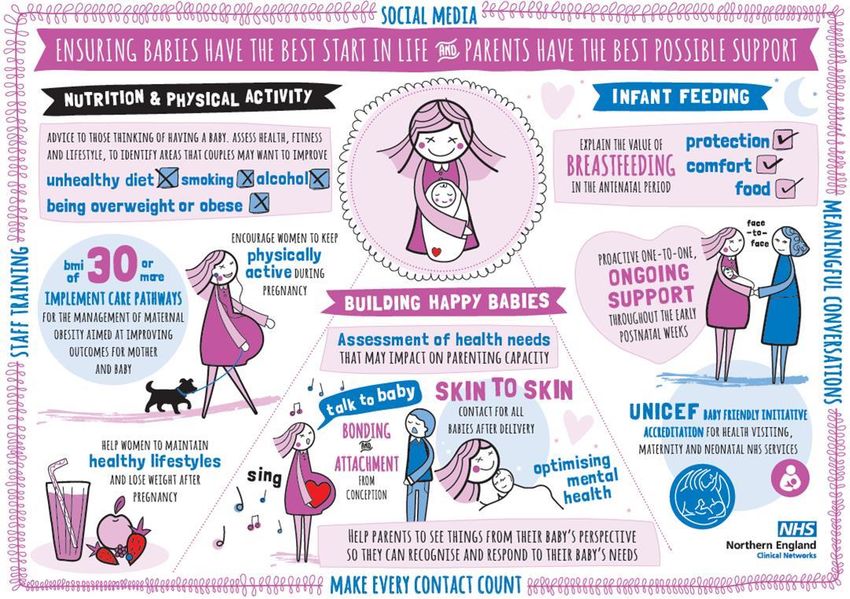
2. Better Births Vision
In February 2016, Better Births set out the Five Year Forward View for NHS maternity services in
England.
Overarching Outcomes
1. Personalised care, centred on the woman, her baby and her family, based around their needs and
their decisions, where they have genuine choice, informed by unbiased information.
2. Continuity of carer, to ensure safe care based on a relationship of mutual trust and respect in line
with the woman’s decisions.
3. Safer care, with professionals working together across boundaries to ensure rapid referral, and
access to the right care in the right place; leadership for a safety culture within and across
organisations; and investigation, honesty and learning when things go wrong.
4. Better postnatal and perinatal mental health care, to address the historic underfunding and
provision in these two vital areas, which can have a significant impact on the life chances and
wellbeing of the woman, baby and family.
5. Multi-professional working, breaking down barriers between midwives, obstetricians and other
professionals to deliver safe and personalised care for women and their babies.
6. Working across boundaries to provide and commission maternity services to support
personalisation, safety and choice, with access to specialist care whenever needed.
7. A payment system that fairly and adequately compensates providers for delivering high quality
care to all women efficiently, while supporting commissioners to commission for personalisation,
safety and choice.
8. Neonatal care - the Northern Neonatal Network will work closely and collaboratively with the Local
Maternity Systems to meet the agreed priority areas. It will also aim to ensure that all babies
receive the highest quality neonatal care in an appropriate cot as close to home as possible as
their clinical needs require.
9. Prevention – the Local Maternity Systems have agreed seven prevention ‘must dos’ - reducing
smoking and alcohol consumption in pregnancy, increase uptake of flu and pertussis vaccination
in pregnancy, improve perinatal mental health, increase breast feeding initiation and continuation,
promote healthy weight and embed the philosophy of Making Every Contact Count.
3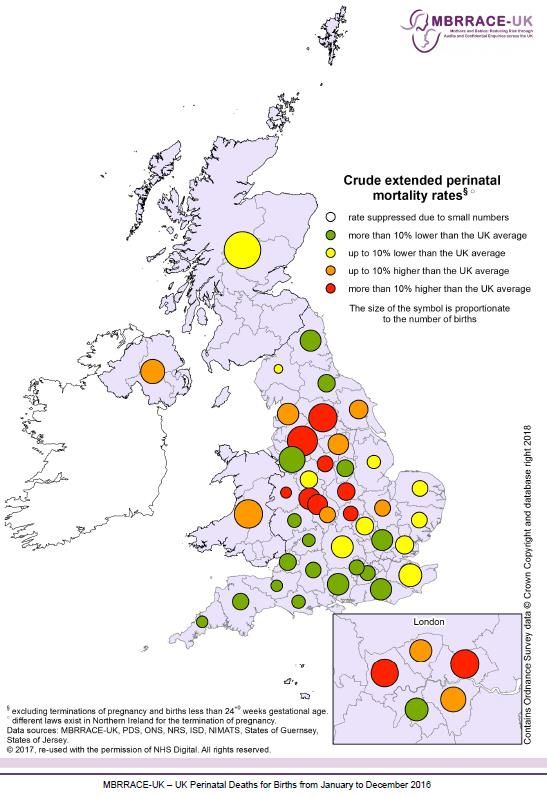
3. Context
‘Better Births’ (2016) recognised that its vision could only be delivered through transformation that is
locally led, with support at national and regional levels. It was recommended that Local Maternity
Systems were developed in alignment with Sustainability and Transformation Partnerships.
Sustainability and Transformation Partnership (STP)
Sustainability and Transformation Partnerships (STPs) were established to bring together local health
and care organisations to work together in a geographic footprint with the aim of developing a local
vision and strategy to address the challenges set out in the Five Year Forward View (5YFV) by 2020-
21.
The challenges in the 5YFV were focused on closing the following three gaps:
the health and well-being gap
the quality of care gap
the financial gap
With the publication of the planning guidance for the NHS in England in February 2018, the next
stage of development for STPs was set out – the move towards the establishment of Integrated Care
Systems (ICS).
North Cumbria and the North East (CNE) STPs / ICS
Initially three STPs were established across North Cumbria and the North East (NCNE):
Durham, Darlington and Tees including Hambleton, Richmondshire and Whitby (DDTHRW),
Northumberland, Tyne and Wear including North Durham (NTWD); and
West, North and East Cumbria (WNEC).
The initial STP plans submitted in October 2016 reflected these STP footprints and coterminous
Local Maternity Systems (LMS) were established to deliver the Better Births component of each.
As the three STPs matured it became apparent that clinical interdependencies between them, and
the common challenges and priorities across them, meant that made sense to begin work much more
closely together. Following the publication of the February 2018 planning guidance it became clear
that North Cumbria and the North East should formally aspire to become a single ICS.
North Cumbria and the North East (NCNE) now work together, supported by pan-NCNE work
programmes and pooled and co-ordinated transformation resource, as a single, aspiring ICS under a
single Senior Officer and governance structure.
Transformation work is organised on three levels within the aspiring ICS:
ICS wide
Sub-regionally - either on the prior STP footprints or on a new Integrated Care Partnership
boundary (or which there are four) defined by the reach and collaboration of the services in
question
Place-based locality working
LMS transformation now sits at the sub-regional tier of this new arrangement that is still based on the
original geographical footprints (as the best representation of patient flows and collaboration between
maternity and obstetric services). This sub-regional approach to LMS delivery is supported at an
NCNE level by the Northern England Clinical Network for Maternity Services in order to facilitate
sharing of good practice and better support the delivery of equitable services across the whole ICS
area). In addition the Clinical Network has provided programme support to the NTWD and DTHRW
LMS.
4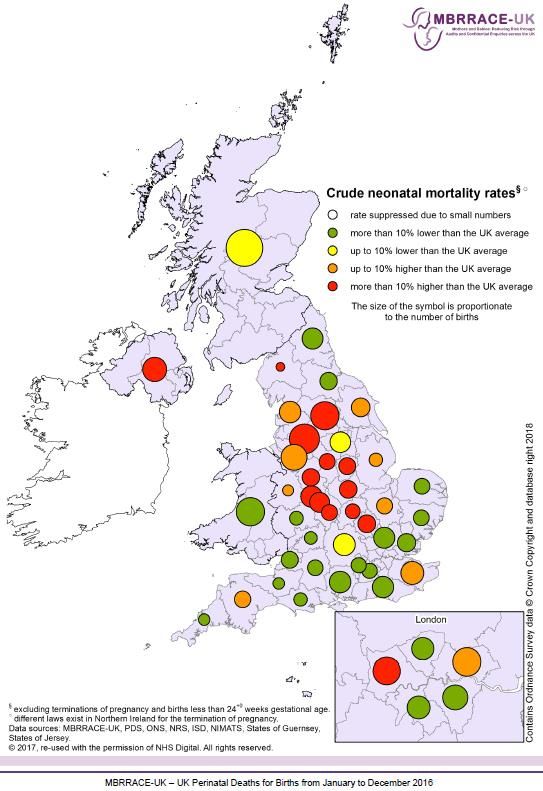
The North Cumbria and North East Local Maternity Systems
This diagram provides an overview of the geography and leadership of the three North Cumbria and
North East ICS Local Maternity Systems
Northern England Maternity
Clinical Network boundary
NCNE Local Maternity Systems and Northern England Clinical Networks
These Local Maternity Systems are responsible for:
Developing a local vision for improved maternity services and outcomes which ensures that there
is access to services for women and their babies, regardless of where they live
Helping to develop the maternity elements of the local sustainability and transformation
partnerships (STP)
Including all providers involved in the delivery of maternity and neonatal care, as well as relevant
senior clinicians, commissioners, operational managers, and primary care
Ensuring that they co-design services with service users and local communities
Putting in place the infrastructure that is needed to support services to work together effectively,
including interfacing with other services that have a role to play in supporting woman and families
before, during and after birth.
The LMS priorities are:
to implement the national maternity services review "Better Births" on behalf of the NCNE ICA
to focus on reduction of health inequalities and variations in standards of care
to encourage collaboration between providers to provide the best care, in the most appropriate
setting, closer to the home wherever possible.
to determine optimal service models based on multiple considerations including quality of care,
financial stability and workforce sustainability – as well as support for clinical work via a
functioning digital care record (e.g. Great North Care Record)
to change the focus from hospital-based services to community hubs – building services around
the family.
The LMS plans are co-produced with service users and staff to ensure they are fully informed of their
choices for care, including seamless and transparent transfer of care to specialist services across the
area when required
5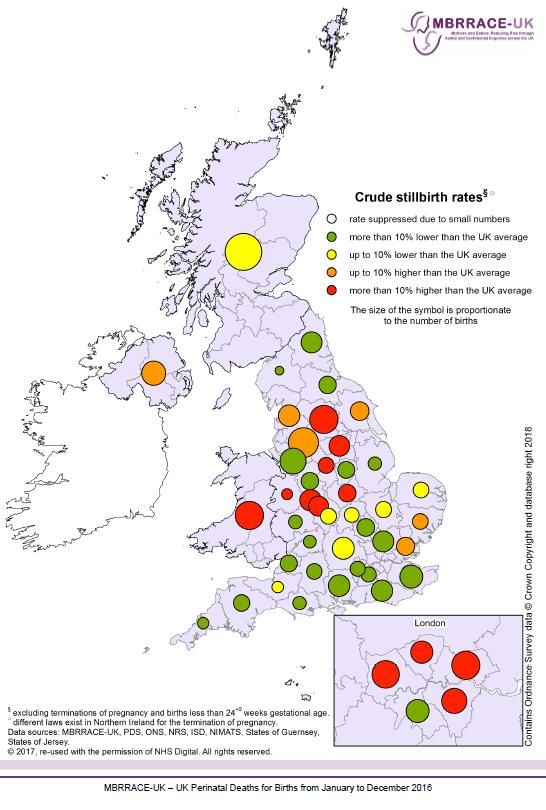
Darlington, Teesside, Hambleton, Richmondshire and Whitby
5 Clinical Commissioning Groups 1 Mental Health provider
3 Acute providers 7 Councils
2 Ambulance providers
The current service provision includes: three Consultant-led units in North Tees, South Tees and
Darlington; two free-standing Midwifery-led units; and three alongside-Midwifery-led units.
The implementation of Better Births and the creation of the Local Maternity System (LMS) will be
undertaken in alignment with the local STP, incorporating a full understanding of the needs of the
local populations.
The DTHRW LMS footprint has a total population of just over 1.1 million including almost 200,000
women of child-bearing age resulting in over 12,000 annual births.
These families are served by five Clinical Commissioning Groups (CCGs) commissioning
maternity services from three acute provider Trusts.
The three types of birth location are available across the LMS: three Consultant-led obstetric
units, two stand-alone Midwifery-led units and three alongside-Midwifery-led units. The majority of
births take place in a hospital environment with approximately 80 homebirths per annum.
Public Health England developed a ‘Maternity Health Needs Data pack’ for the LMS which has
enabled the LMS to better develop its understanding of the local population and its needs from
maternity services
o Overall birth rates are predicted to increase slightly from 12,227 annual births in 2015, to
12,626 annual births in 2020: The trend based projection rate over 20 years (2015 – 2035)
shows variation between localities from a decrease of - 9.1% in Hartlepool to an increase
of +10.5% in Middlesbrough (p14).
o The area contains a lower than UK average number of births to women of black and
minority ethnic groups and to non-UK born parents, but a significantly higher teenage
pregnancy birth rate (p20-23).
o Overall flu vaccination rates of pregnant women are significantly higher than the national
average; but variation in provision exists (p25).
o Breastfeeding initiation rates are significantly lower than the national average in all except
North Yorkshire (p27).
o Smoking status at time of delivery (2015/16 data) showed 18 % compared with the national
average of 10.6% with the national ambition being below 11% (see p28).
6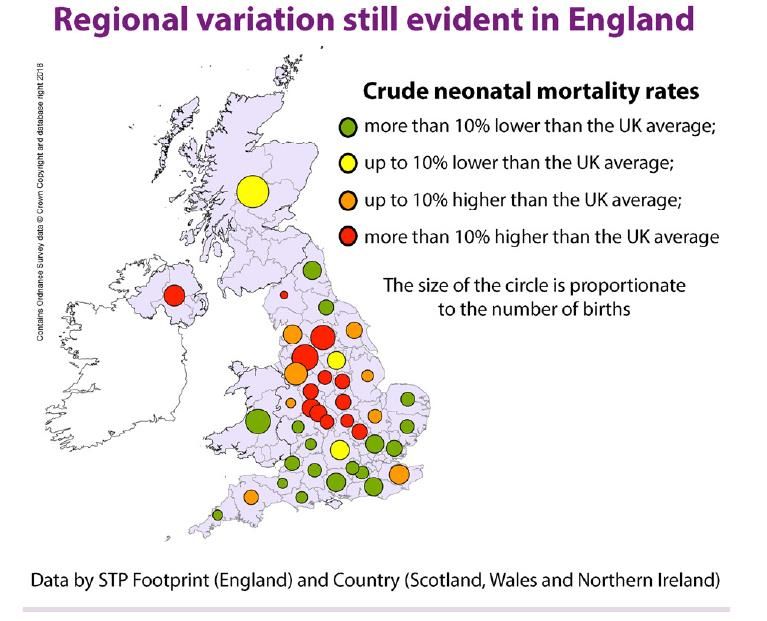
o The area has good rates of new-born screening and health visitor visits.
Rates of stillbirth, neonatal death and extended neonatal deaths within the STP as identified by
the MBRRACE report (2016) are overall up to 10% lower than the national average but there is
variation between acute providers Trusts and CCG areas
Predicted and current workforce capacity remains of concern amongst both trainee medical staff
grades resulting in on use of locum cover and expected shortfalls in the midwifery workforce
which follows national predictions
There is a financial challenge across the STP, any plans produced will be risk assessed to ensure
financial capability.
Priorities identified by Better Health Programme
The priorities and previous work of this programme feed into the CNE STP:
Improve results for patients
Care of the same standard whenever, and wherever it is provided
Services have the resources to be sustainable for the next 10-15 years
Provide services across 7 days a week where necessary
Make services easier for patients to understand and use
Improve life expectancy and quality of life
7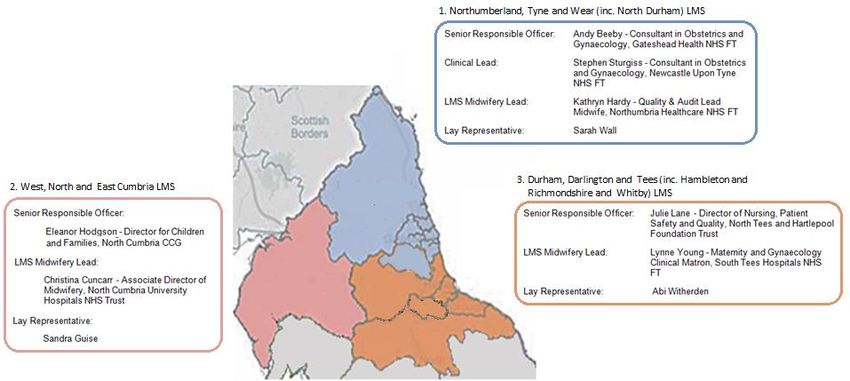
Northumberland, Tyne and Wear and Durham
The current service provision includes 6 Consultant Units in Northumbria, Newcastle,
Gateshead, Sunderland, Durham and South Tyneside, 3 free-standing Midwifery-led units
and 2 alongside-Midwifery-led units
6 Clinical Commissioning Groups 1 Mental Health provider
5 Acute providers 6 Councils
1 Ambulance provider
The current service provision includes: six Consultant-led units in Northumbria, Newcastle,
Gateshead, Sunderland, Durham and South Tyneside; three free-standing Midwifery-led units; and
six alongside-Midwifery-led units
The implementation of Better Births and the creation of the Local Maternity System (LMS) is being
undertaken in alignment with the local STP, incorporating a full understanding of the needs of the
local populations.
The NTWD LMS footprint has a total population of 1.7 million including over 300,000 women of
child-bearing age resulting in over 17,500 annual births
The area covers a mixture of very urban and isolated rural areas.
These families are served by six CCGs commissioning maternity services from six acute provider
Trusts.
The three types of birth location are available across the LMS: six Consultant-led units (with
numbers of births varying from about 6,700 to 1,700 per annum), six alongside Midwifery-led units
and three stand-alone Midwifery-led units. The majority of births take place in a hospital
environment with approximately 70 homebirths per annum.
Public Health England developed a ‘Maternity Health Needs Data pack’ for the LMS which has
enabled the LMS to better develop its understanding of the local population and its needs from
maternity services:
8
o Overall birth rates are predicted to increase slightly from 17,655 annual births in 2015, to
18,137 annual births in 2020: The trend based projection rate over 20 years (2015 – 2035)
shows variation between localities from a decrease of - 7.1% in Northumberland to an
increase of + 7.4% in County Durham (p15).
o The area contains a lower than UK average number of births to women of black and
minority ethnic groups and to non-UK born parents, but a significantly higher teenage
pregnancy birth rate (p20-23)
o Overall flu vaccination rates of pregnant women are significantly higher than the national
average; but variation in provision exists (p25).
o Breastfeeding initiation rates are significantly lower than the national average in all areas
with an overall rate of just 63.2%. The UK average is 74.3% with variations between areas
within the STP of 53%-68.4% (p27).
o Smoking status at time of delivery (2015/16 data) was significantly higher than the national
average, 15.3 % compared with the national average of 10.6% with the national ambition
being below 11% (p28).
Rates of stillbirth, neonatal death and extended neonatal deaths within the STP as identified by
the most recent MBRRACE report (2016) are overall up to 10% lower than the national average
but there is variation between providers and CCG areas
Predicted and current workforce capacity remains of concern amongst both trainee medical staff
grades resultant on use of locum cover and expected shortfalls in the midwifery workforce which
follows also national predictions
There is a financial challenge across the STP, any plans produced will be risk assessed to ensure
financial capability.
9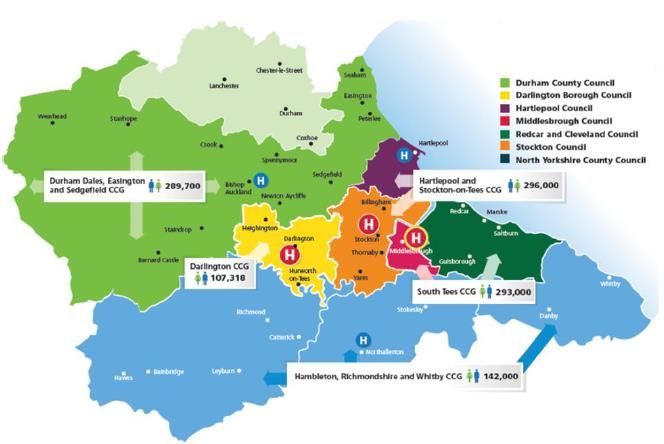
Maternity Offer
                           Northumberland      Tyne and Wear         Durham and       Teesside            Hambleton       North Cumbria
                                                                     Darlington                           Richmond
                                                                                                          and Whitby
                           Northumbria         Royal Victoria        University       University                          Cumberland
                           Specialist          Infirmary             Hospital of      Hospital of North                   Infirmary
Obstetric Consultant led

                           Emergency Care      Newcastle upon        North Durham.    Tees Stockton.                      Carlisle.
                           Hospital            Tyne.
                                                                     Darlington       James Cook                          West
                                               Sunderland Royal      Memorial         University                          Cumberland
                                               Hospital.             Hospital.        Hospital                            Hospital
                                                                                      Middlesbrough.                      Whitehaven.
                                               Queen Elizabeth
                                               Hospital
                                               Gateshead

                                               South Tyneside
                                               District Hospital.
                           Northumbria         Royal Victoria        University       University                          Cumberland
                           Specialist          Infirmary             Hospital of      Hospital North                      Infirmary
MLU Alongside/Co-located

                           Emergency Care      Newcastle upon        North Durham.    Tees Stockton.                      Carlisle.
                           Hospital            Tyne.
                                                                     Darlington       James Cook                          West
                                               Sunderland Royal      Memorial         University                          Cumberland
                                               Hospital.             Hospital.        Hospital                            Hospital
                                                                                      Middlesbrough.                      Whitehaven.
                                               Queen Elizabeth
                                               Hospital
                                               Gateshead.

                                               South Tyneside
                                               District Hospital.
                           Berwick MLU.                                               University          The Friarage.   Penrith Birthing
                                                                                      Hospital of                         Centre.
                           Hexham MLU.                                                Hartlepool.
MLU Stand- alone/
  Freestanding

                           Hillcrest Alnwick
                           MLU.

Where units have a co- located MLU provision, the birthing environment may not be physically separated. The birthing
environment may be a designated room/s or section of a labour Ward where women follow a midwifery led care pathway
Home                                    Each trust offers a home birth service
Independent                             Independent Midwifery: Provision for independent midwifery, Yorkshire Storks Midwifery collective
Midwifery                               and a number of sole traders provide services for the Northern areas.
                                        http://www.imuk.org.uk/families/find-a-midwife/

                                                                                                                                            10
Care Quality Commission (CQC) Ratings for Hospitals in North East England
The CQC Inspections for the within North East England, have been considered. The table below
details the ratings given:
Northumbria
Durham and
Sunderland
South Tees
North Tees
Gateshead
Darlington
Newcastle
Tyneside
County
South
Hospital
CQC Rating
Received(Trust)
CQC Rating
Received(Maternity
Services)
The full inspection reports can be found on the CQC website at the following link
http://www.cqc.org.uk/
CQC Ratings Key
Outstanding – the service is performing exceptionally well.
Good – the service is performing well and meeting our expectations.
Requires improvement – the service isn’t performing as well as it should and we have told the
service how it must improve.
Inadequate – the service is performing badly and we’ve taken enforcement action against the
provider of the service
No rating/under appeal/rating suspended – there are some services which we can’t rate, while
some might be under appeal from the provider. Suspended ratings are being reviewed by us and
will be published soon.
Average drive times to an Obstetric and Midwifery-led unit, 2013
Across the two LMS some residents of
Northumbria and North Cumbria have
estimated drive times of 60 minutes are more,
reflecting their geographies.
Notes
1 Some women living on the border of Wales or Scotland may have access to a
choice of services in those nations.
If so, they may be within shorter drive times than the figure key suggests.
Department of Health (2013) National Audit Office Maternity Services
11Service User Surveys
In addition to healthcare led surveys, the Maternity lay representatives for the LMS Boards provide an
invaluable role in gathering qualitative and quantitative information by engaging with local women.
The two lay representatives have recently asked local mums about their experiences of personalised
care planning. To date two data sets are available, one for DTHRW and one for NTWD, each with
100 respondents:
DHTRW 100 respondents from the South Tees area who delivered predominantly at James Cook
and North Tees recruited via a Facebook breastfeeding group:
https://www.surveymonkey.com/results/SM-H3YSL2K9L/
NTWD 100 responses from further north recruited via several different Facebook groups:
https://www.surveymonkey.com/results/SM-CZQTPNJ9L/
The questionnaire was short, taking less than 3 minutes to complete and focused on themes from the
Implementing Better Births Resource Pack explanation of what a personalised care plan should do.
The main questions include:
Whether mums knew they should have a PCP (60-70% did) and whether they think they had
one (20-30% did not).
What sort of setting in which to deliver (at least a third did not have choice).
Feelings of empowerment in making their choices.
Where antenatal and postnatal checks occurred (well over half had no choice).
Pain relief in labour as stated in the Implementing Better Births pack (around 20% did not get
information and choice).
Whether the planning worked to deliver a maternity experience that was what each woman
was expecting. The lay representative wanted to incorporate the importance of alternative
options ('Plan B') in asking this question as it is highlighted in the Implementing Better Births
pack. (Where a plan was made 20-21% found it did not work - either a situation arose for
which they had not planned or their choices were ignored).
123. Health Needs Assessment
In 2017 Public Health England provided a “Maternity Health Needs Data Pack” for each LMS across
the country to enable a better understanding of their local population and its needs from maternity
services. A small selection of some of the key data that has informed the LMS plans is included
below. This is supplemented by data collected across the Maternity Clinical Network through its
Maternity Dashboard and submissions to Each Baby Counts and Saving Babies Lives Care Bundle.
Population
DTHRW
Total population, females aged 15 – 44 and number of births
Total females
Total
aged 15-44,
Registered
2017/18 CCG boundaries registered
Population
population
(2017)
(2017)
England 58,437,363 11,525,729
[Durham,]Darlington, Teesside, Hambleton, Richmondshire and
1,134,796 199,687
Whitby
NHS Darlington CCG 107,888 19,433
NHS Durham Dales, Easington and Sedgefield CCG 291,043 49,792
NHS Hartlepool and Stockton CCG 296,498 54,638
NHS South Tees CCG 295,548 54,046
NHS Hambleton, Richmondshire and Whitby CCG 143,819 21,778
Source data: NHS Digital, 2017 and ONS births, 2015. Link: https://digital.nhs.uk/catalogue/PUB24180 and
https://www.ons.gov.uk/peoplepopulationandcommunity/birthsdeathsandmarriages/livebirths (LMS Service Packs, PHE 2017)
NTWD
Total population, females aged 15 – 44 and number of births
Total females
Total
aged 15-44,
Registered
2017/18 CCG boundaries registered
Population
population
(2017)
(2017)
England 58,437,363 11,525,729
Northumberland, Tyne and Wear and [North] Durham 1,759,803 333,276
NHS North Durham CCG 256,342 50,201
NHS Northumberland CCG 323,852 51,367
NHS South Tyneside CCG 156,612 27,661
NHS Sunderland CCG 284,161 52,089
NHS Newcastle Gateshead CCG 520,427 112,011
NHS North Tyneside CCG 218,409 39,947
Source data: NHS Digital, 2017 and ONS births, 2015 Link: https://digital.nhs.uk/catalogue/PUB24180 and
https://www.ons.gov.uk/peoplepopulationandcommunity/birthsdeathsandmarriages/livebirths (LMS Service Packs, PHE 2017
13Population projections
DTHRW - Population projections – Females 15-44
2014-based Subnational Population Projections, females aged 15-44 (CCG)
60,000 2014 2019 2024 2029 2034
0.9%
-1.4%
50,000 4.6%
40,000
Population
30,000
-7.9%
-7.6%
20,000
Values in
10,000
red show
increase or
0 decrease in
NHS Darlington CCG NHS Durham Dales, Easington NHS Hartlepool and Stockton- NHS South Tees CCG NHS Hambleton, population
and Sedgefield CCG on-Tees CCG Richmondshire and Whitby
CCG from 2014
to 2034
Source data: 2014-based Subnational population projections, ONS
Link:https://www.ons.gov.uk/peoplepopulationandcommunity/populationandmigration/populationprojections (LMS Service Packs, PHE
2017)
Overall birth rates are predicted to increase slightly from 12,227 annual births in 2015, to 12,626
annual births in 2020: The trend based projection rate over 20 years (2015 – 2035) shows variation
between localities from a decrease of 9.1% in Hartlepool to an increase of 10.5% in Middlesbrough.
DTHRW - Birth projections
7,000 2014-based Subnational Population Projections of births (LA)
2015 2020 2025 2030 2035
6,000
7.4% -1.8%
5,000
4,000
Births
3,000
4.3%
10.5% Values in
2,000
-6.7% red show
-9.1% 0.0%
increase or
1,000
decrease in
population
0 from 2014
Hartlepool Middlesbrough Redcar and Stockton-on-Tees Darlington County Durham North Yorkshire
Cleveland
to 2034
Source data: 2014-based Subnational population projections, ONS Link:
https://www.ons.gov.uk/peoplepopulationandcommunity/populationandmigration/populationprojections (LMS Service Packs, PHE 2017)
14NTWD - Population projections – Females 15-44
Values in
red show
increase or
decrease in
population
from 2014
to 2034
Source data: 2014-based Subnational population projections, ONS
Link:https://www.ons.gov.uk/peoplepopulationandcommunity/populationandmigration/populationprojections (LMS Service Packs, PHE
2017)
Overall birth rates are predicted to increase slightly from 17,655 annual births in 2015, to 18,137
annual births in 2020: The trend based projection rate over 20 years (2015 – 2035) shows variation
between localities from a decrease of 7.1% in Northumberland to an increase of 7.4% in County
Durham.
NTWD - Birth projections
7,000 2014-based Subnational Population Projections of births (LA)
2015 2020 2025 2030 2035
6,000
7.4%
5,000
4,000
0.0%
Births
-3.3%
3,000 -7.1%
0.0% 0.0%
Values in
2,000
-6.3% red show
increase or
1,000 decrease in
population
from 2014
0
County Durham Northumberland Newcastle upon North Tyneside South Tyneside Sunderland Gateshead to 2034
Tyne
Source data: 2014-based Subnational population projections, ONS Link:
https://www.ons.gov.uk/peoplepopulationandcommunity/populationandmigration/populationprojections (LMS Service Packs, PHE 2017)
15Pregnancy and Birth Key Indicators
Source: https://fingertips.phe.org.uk/profile-group/child-health/profile/child-health-
pregnancy/data#page/0/gid/1938132993/pat/6/par/E12000001/ati/102/are/E06000047
The table above provides an overview of pregnancy and birth indicators across the two LMS in the
North East. There are higher than average numbers of teenage mothers, mothers smoking at time of
delivery as well as lower breastfeeding initiation rates.
16Pregnancy and Birth Trends
Source: https://fingertips.phe.org.uk/profile-group/child-health/profile/child-health-
pregnancy/data#page/0/gid/1938132993/pat/6/par/E12000001/ati/102/are/E06000047
This table shows trends in the pregnancy and birth indicators. There average numbers of teenage
mothers is in the main decreasing or staying at the same rate, mothers smoking at time of delivery is
decreasing (getting better) in all but one of the CCGs, where it is staying as at a similar level.
However, breastfeeding initiation is decreasing (getting worse) in 4 CCGs and increasing (getting
better) in 4 CCGs.
17Deprivation DTHRW -
Proportion of STP population (2015) by
IMD (2015) decile, Durham, Darlington,
Teesside, Hambleton, Richmondshire and
Whitby
4%
9%
10%
10 - least 8%
deprived
9
7%
8
7
9%
6
5
9%
4
3
11%
2
1 - most deprived
12%
21%
Source data: IMD 2015, DCLG Link: https://www.gov.uk/government/statistics/english-indices-of-deprivation-2015 (LMS Service Packs,
PHE 2017)
“Rationale – “Deprivation covers a broad range of issues and refers to unmet needs, caused by a lack of
resources of all kinds, not just financial. The English Indices of Deprivation attempt to measure a broader
concept of multiple deprivation, made up of several distinct dimensions, or domains, of deprivation.”
The LMS includes a number of localities which are classed as the most deprived quintile in England.
21% of the population is in the most deprived decile and 4% in the least deprived decile.
18Deprivation NTWD
Proportion of STP population (2015) by
IMD (2015) decile, Northumberland, Tyne
and Wear and North Durham
8%
8%
8%
10 - least 8%
deprived
9
6%
8
7
10%
6
5
12%
4
3
2
13%
1 - most deprived
15%
13%
Source data: IMD 2015, DCLG Link: https://www.gov.uk/government/statistics/english-indices-of-deprivation-2015 (LMS Service Packs,
PHE 2017)
“Rationale – Deprivation covers a broad range of issues and refers to unmet needs caused by a lack of
resources of all kinds, not just financial. The English Indices of Deprivation attempt to measure a broader
concept of multiple deprivation, made up of several distinct dimensions, or domains, of deprivation.”
The LMS includes a small number of localities which are classed as the most deprived quintile in
England. 13% of the population is in the most deprived decile and 8% in the least deprived decile.
19Percentage of deliveries to mothers from Black and Minority Ethnic (BME) groups
DTHRW
Percentage of deliveries to mothers from Black and Minority
Ethnic (BME) groups (%), 2015/16, Durham, Darlington,
Teesside, Hambleton, Richmondshire and Whitby (CCG)
NHS South Tees CCG
NHS Durham Dales, Easington and
Sedgefield CCG
NHS Hambleton, Richmondshire and Whitby
CCG
NHS Hartlepool and Stockton-on-Tees CCG
NHS Darlington CCG
Durham, Darlington, Teesside, Hambleton,
8.3
Richmondshire and Whitby
England
0 5 10 15 20 25 30 35
The percentage number of deliveries to mothers from black and minority ethnic (BME) groups is
lower particularly in DTHRW in comparison to England at 30%. DTHRW is currently at 8.3% and
NTWD at 14.1%.
NTWD
Percentage of deliveries to mothers from Black and Minority
Ethnic (BME) groups (%), 2015/16, Northumberland, Tyne and
Wear and North Durham (CCG)
NHS Newcastle Gateshead CCG
NHS North Durham CCG
NHS Sunderland CCG
NHS North Tyneside CCG
NHS South Tyneside CCG
NHS Northumberland CCG
Northumberland, Tyne and Wear and… 14.1
England
0 5 10 15 20 25 30 35
Source data: Fingertips – Pregnancy and birth profile, 2015/16 Link: https://fingertips.phe.org.uk/profile-group/child-health/profile/child-
health-pregnancy (LMS Service Packs, PHE 2017)
20Percentage of delivery episodes where the mother is aged under 18
DTHRW
Teenage mothers (%), 2015/16, Durham, Darlington, Teesside,
Hambleton, Richmondshire and Whitby (CCG)
NHS South Tees CCG
NHS Durham Dales, Easington and Sedgefield
CCG
NHS Hartlepool and Stockton-on-Tees CCG
NHS Darlington CCG
NHS Hambleton, Richmondshire and Whitby
CCG
Durham, Darlington, Teesside, Hambleton,
1.7
Richmondshire and Whitby
England
0 0.5 1 1.5 2 2.5 3
“Rationale – Teenage pregnancy is associated with poorer outcomes for both young parents and their
children.”
The percentage of teenage mothers in the North region is somewhat higher than those in England.
Both NTWD and DTHRW have a similar position on average of 1.6%. The highest percentage of
teenage mothers delivered in NHS South Tees CCG, NHS Durham Dales, Easington and
Sedgefield CCG and Sunderland CCG.
NTWD
Teenage mothers (%), 2015/16, Northumberland, Tyne and
Wear and North Durham (CCG)
NHS Sunderland CCG
NHS South Tyneside CCG
NHS Newcastle Gateshead CCG
NHS Northumberland CCG
NHS North Durham CCG
NHS North Tyneside CCG
Northumberland, Tyne and Wear and… 1.5
England
0 0.5 1 1.5 2 2.5 3
Source data: Fingertips – Pregnancy and birth profile, 2015/16
Link: https://fingertips.phe.org.uk/profile-group/child-health/profile/child-health-pregnancy (LMS Service Packs, PHE 2017)
21Under 18 conceptions
DTHRW
“Rationale – Teenage pregnancy is associated with poorer outcomes for both young parents and their
children. This indicator can show local variation. Teenage mothers are less likely to finish their education, are
more likely to bring up their child alone and in poverty and have a higher risk of poor mental health than older
mothers. Infant mortality rates for babies born to teenage mothers are around 60% higher than for babies born
to older mothers. The children of teenage mothers have an increased risk of living in poverty and poor quality
housing and are more likely to have accidents and behavioural problems.”
In both NTWD and DTHRW under 18 conceptions in Northern England is somewhat higher than
England. NHS Hartlepool CCG and Sunderland CCG are significantly higher than England.
NTWD
Under 18 conceptions (Crude rate per 1000), 2015, Northumberland,
Tyne and Wear and North Durham (LA)
Sunderland
Gateshead
County Durham
Newcastle upon Tyne
South Tyneside
North Tyneside
Northumberland
Northumberland, Tyne and Wear and North… 26.8
England
0 5 10 15 20 25 30 35 40 45
Source data: Fingertips – Pregnancy and birth profile, 2015
Link: https://fingertips.phe.org.uk/profile-group/child-health/profile/child-health-pregnancy (LMS Service Packs, PHE 2017)
22Under 18 conceptions by deprivation decile
DTHRW
Under 18 conceptions, 2015, County & UA deprivation deciles in England
(IMD2015)
Most deprived decile (IMD2015)
Second most deprived decile (IMD2015)
Third more deprived decile (IMD2015)
Fourth more deprived decile (IMD2015)
Fifth more deprived decile (IMD2015)
Fifth less deprived decile (IMD2015)
Fourth less deprived decile (IMD2015)
Third less deprived decile (IMD2015)
Second least deprived decile (IMD2015)
Least deprived decile (IMD2015)
0 5 10 15 20 25 30 35
“Rationale – Research evidence, particularly from longitudinal studies, shows that teenage pregnancy is
associated with poorer outcomes for both young parents and their children. Most teenage pregnancies are
unplanned and around half end in an abortion. As well as it being an avoidable experience for the young
woman, abortions represent an avoidable cost to the NHS
Caveats - Conception statistics includes births and legal abortions and do not include miscarriages or illegal abortions.
The date of conception is estimated using recorded gestation for abortions and stillbirths, and assuming 38 weeks
gestation for live births. Only about 5% of under 18 conceptions are to girls aged 14 or under and to include younger age
groups in the base population would produce misleading results. The 15-17 age group is effectively treated as population
at risk.”
In both NTWD and DTHRW the majority of under 18 conceptions live in the most deprived decile.
NTWD
Under 18 conceptions, 2015, County & UA deprivation deciles in England
(IMD2015)
Most deprived decile (IMD2015)
Second most deprived decile (IMD2015)
Third more deprived decile (IMD2015)
Fourth more deprived decile (IMD2015)
Fifth more deprived decile (IMD2015)
Fifth less deprived decile (IMD2015)
Fourth less deprived decile (IMD2015)
Third less deprived decile (IMD2015)
Second least deprived decile (IMD2015)
Least deprived decile (IMD2015)
0 5 10 15 20 25 30 35
Source data: Fingertips – Pregnancy and birth profile, 2015
Link: https://fingertips.phe.org.uk/profile-group/child-health/profile/child-health-pregnancy (LMS Service Packs, PHE 2017)
23Percentage of deliveries to women aged 35 years or above
DTHRW
Percentage of deliveries to women aged 35 years or above (%),
2015/16, Durham, Darlington, Teesside, Hambleton, Richmondshire
and Whitby (LA)
North Yorkshire
Stockton-on-Tees
County Durham
Darlington
Middlesbrough
Redcar and Cleveland
Hartlepool
Durham, Darlington, Teesside, Hambleton,… 14.4
England
0 5 10 15 20 25
“Rationale – Older mothers are more likely to experience pregnancy complications such as preeclampsia,
miscarriage and complicated pregnancies which could result in use of forceps or caesarean section. Multiple
pregnancy is also more common, both naturally conceived or as a result of assisted conception. Older mothers
are however also more likely than younger mothers to start breastfeeding, and to continue for six months or
more (Infant Feeding Survey - UK, 2010. Copyright © 2012, Health and Social Care Information Centre. All
Rights Reserved).”
In DTHRW the average % of deliveries to woman ages 35 and above is 14.4% with North Yorkshire
in close comparison to England. In the NTWD region North Tyneside percentage of deliveries to
woman aged 35 years or above is similar to those in England. The majority of trusts within NTWD are
not significantly lower to those in England.
NTWD
Percentage of deliveries to women aged 35 years or above (%),
2015/16, Northumberland, Tyne and Wear and North Durham (LA)
North Tyneside
Newcastle upon Tyne
Northumberland
Gateshead
County Durham
South Tyneside
Sunderland
Northumberland, Tyne and Wear and North… 16.7
England
0 5 10 15 20 25
Source data: Fingertips – Pregnancy and birth profile, 2015/16
Link: https://fingertips.phe.org.uk/profile-group/child-health/profile/child-health-pregnancy (LMS Service Packs, PHE 2017)
24Flu vaccinations – pregnant women
DTHRW
Seasonal Flu Vaccine Uptake (GP) in all pregnant women (%), 2016/17,
Durham, Darlington, Teesside, Hambleton, Richmondshire and Whitby, (CCG)
NHS Hambleton, Richmondshire and Whitby CCG
NHS Darlington CCG
NHS Durham Dales, Easington and Sedgefield CCG
NHS South Tees CCG
NHS Hartlepool and Stockton-on-Tees CCG
Durham, Darlington, Teesside, Hambleton,
49%
Richmondshire and Whitby
England
0% 10% 20% 30% 40% 50% 60% 70%
“Rationale – This indicator provides a comparison of vaccination uptake between CCGs. There is good evidence that
pregnant women have a higher chance of developing complications if they get flu, particularly in the later stages of
pregnancy. One of the most common complications of flu is bronchitis, a chest infection that can become serious and
develop into pneumonia. If a woman has flu while she is pregnant, it could mean the baby is born prematurely or has a
low birthweight, and may even lead to stillbirth or death. Women who have had the flu vaccine while pregnant also pass
some protection on to their babies, which lasts for the first few months of their lives”.
The uptake of seasonal flu vaccine has a very successful uptake rate in comparison to England. All
CCG’s are achieving between 40%-60% uptake rate in the North Region. North Durham CCG has
quite a significant increase in uptake in comparison to CCG’s in the Northern region.
NTWD
Seasonal Flu Vaccine Uptake (GP) in all pregnant women (%), 2016/17,
Northumberland, Tyne and Wear and North Durham, (CCG)
NHS North Durham CCG
NHS Northumberland CCG
NHS Newcastle Gateshead CCG
NHS South Tyneside CCG
NHS North Tyneside CCG
NHS Sunderland CCG
Northumberland, Tyne and Wear and North Durham 50%
England
0% 10% 20% 30% 40% 50% 60% 70%
Source data: Flu Vaccination data, PHE, 2017
Link: https://www.gov.uk/government/statistics/seasonal-flu-vaccine-uptake-in-gp-patients-in-england-winter-season-2016-to-2017
(LMS Service Packs, PHE 2017)
25Pertussis vaccinations – pregnant women
DTHRW
Prenatal pertussis vaccine programme coverage (%) in pregnant women,
2016/17 average, Durham, Darlington, Teesside, Hambleton, Richmondshire
and Whitby, (CCG)
NHS Darlington CCG
NHS Hambleton, Richmondshire and Whitby CCG
NHS Durham Dales, Easington and Sedgefield CCG
NHS Hartlepool and Stockton-on-Tees CCG
NHS South Tees CCG
Durham, Darlington, Teesside, Hambleton,
73
Richmondshire and Whitby
England
0 10 20 30 40 50 60 70 80 90
“Rationale – This indicator provides a comparison of vaccination uptake between CCGs. Getting vaccinated while you're
pregnant is highly effective in protecting your baby from developing whooping cough in the first few weeks of their life.
The immunity you get from the vaccine will pass to your baby through the placenta and provide passive protection for
them until they are old enough to be routinely vaccinated against whooping cough at two months old.”
The uptake of prenatal pertussis vaccine is overall higher than in comparison to England. Newcastle
Gateshead CCG has quite a significant increase in uptake in comparison to CCG’s in the North East.
NTWD
Prenatal pertussis vaccine programme coverage (%) in pregnant women,
2016/17 average, Northumberland, Tyne and Wear and North Durham,
(CCG)
NHS Newcastle Gateshead CCG
NHS North Tyneside CCG
NHS Northumberland CCG
NHS North Durham CCG
NHS South Tyneside CCG
NHS Sunderland CCG
Northumberland, Tyne and Wear and North Durham 127
England
0 50 100 150 200 250 300
Source data: Pertussis Vaccination data, PHE, 2017
Link: https://www.gov.uk/government/publications/pertussis-immunisation-in-pregnancy-vaccine-coverage-estimates-in-england-
october-2013-to-march-2014 (LMS Service Packs, PHE 2017)
26Breastfeeding initiation rates
DTHRW
Breastfeeding initiation (%), 2014/15, Durham, Darlington, Teesside,
Hambleton, Richmondshire and Whitby (LA)
North Yorkshire
Darlington
Stockton-on-Tees
County Durham
Redcar and Cleveland
Hartlepool
Middlesbrough
Durham, Darlington, Teesside, Hambleton,… 57.1
England
0 10 20 30 40 50 60 70 80
“Rationale – Increases in breastfeeding are expected to reduce illness in young children and have health benefits for the
baby and the mother. Rates in the UK are low compared to the rest of the world. This indicator can show local variation.”
Breastfeeding initiation is lower than the England average in both LMS and the most recent data, on
the Pregnancy and birth - PHE Fingertips, provides a similar picture.
NTWD
Breastfeeding initiation (%), 2014/15, Northumberland, Tyne and
Wear and North Durham (LA)
Newcastle upon Tyne
Gateshead
North Tyneside
Northumberland
County Durham
Sunderland
South Tyneside
Northumberland, Tyne and Wear and North… 63.2
England
0 10 20 30 40 50 60 70 80
Source data: Fingertips – Pregnancy and birth profile, 2014/15
Link: https://fingertips.phe.org.uk/profile-group/child-health/profile/child-health-pregnancy (LMS Service Packs, PHE 2017)
27Smoking status at time of delivery
DTHRW
Smoking status at time of delivery (%), 2015/16, Durham,
Darlington, Teesside, Hambleton, Richmondshire and Whitby
(CCG)
NHS Durham Dales, Easington and
Sedgefield CCG
NHS South Tees CCG
NHS Hartlepool and Stockton-on-Tees CCG
NHS Darlington CCG
NHS Hambleton, Richmondshire and Whitby
CCG
Durham, Darlington, Teesside, Hambleton,
18.4
Richmondshire and Whitby
England
0 5 10 15 20 25
“Rationale – Smoking in pregnancy has well known detrimental effects for the growth and development of the
baby and health of the mother. On average, smokers have more complications during pregnancy and labour,
including bleeding during pregnancy, placental abruption and premature rupture of membranes. Smoking
during pregnancy can cause serious pregnancy-related health problems including an increased risk of
miscarriage, premature birth, stillbirth, low birth-weight and sudden unexpected death in infancy.”
Smoking status at delivery across both DTHRW and NTWD is higher than the England average.
Whilst rates are decreasing, see p19, this remains a high priority for both LMS
NTWD
Smoking status at time of delivery (%), 2015/16,
Northumberland, Tyne and Wear and North Durham (CCG)
NHS South Tyneside CCG
NHS Sunderland CCG
NHS North Durham CCG
NHS Northumberland CCG
NHS Newcastle Gateshead CCG
NHS North Tyneside CCG
Northumberland, Tyne and Wear and… 15.3
England
0 5 10 15 20 25
Source data: Fingertips – Pregnancy and birth profile, 2015/16
Link: https://fingertips.phe.org.uk/profile-group/child-health/profile/child-health-pregnancy
284. Key Lines of Enquiry: Baseline and Trajectories
Birth projections
Number of Births
Number of births and projection for each year to 2020/2021
LMS 2015 baseline
(Office for
2018/19 2019/20 2020/21
National
Statistics ONS)
Darlington, Tees, Hambleton
12,227 12,549 12,626 12,626
Richmondshire and Whitby
Northumberland, Tyne and
17,655 18,091 18,237 18,137
Wear and [North] Durham
(Source data: NHS Digital, 2017 and ONS births, 2015Link: https://digital.nhs.uk/catalogue/PUB24180 and
https://www.ons.gov.uk/peoplepopulationandcommunity/birthsdeathsandmarriages/livebirths. Projections, (PHE 2018)
The definitions used to develop the ambitions for the key lines of enquiry are those provided in
“Measuring levels of ambition at LMS level for Key Deliverables (Maternity Transformation
Programme Board November, 2017).
Still Births and Neonatal Deaths and Intrapartum Brain Injuries
Key Lines of Enquiry
A. Are there clear and credible plans to improve the safety of maternity care so that by 2020/21 all
services have made significant progress towards the “halve it” ambition of halving rates of still
birth and neonatal death, maternal death and brain injuries during birth by 50% by 2030? (This
should include an assessment of the current position and a clear improvement trajectory)
Stillbirths and neonatal deaths (rate per 1000
Intrapartum brain injuries
LMS births)
Local
baseline
2015
Trajector Trajectory Trajectory (Each Trajector Trajector Trajector
baseline
y March March March Baby y March y March y March
(MBRRAC
2019 2020 2021 Counts 2019 2020 2021
E)
reported
cases*)
Darlington,
Tees,
2015 5
Hambleton 5.1 (5% 4.9 (10% 4.6 (15% 5% 10% 15%
5.4 2016 9
and reduction) reduction) reduction) reduction reduction reduction
2017 7
Richmond
shire
Northumbe
rland, Tyne 2015 19
4.4 (5% 4.1 (10% 3.9 (15% 5% 10% 15%
and Wear 4.6 2016 23
reduction) reduction) reduction) reduction reduction reduction
and North 2017 15
Durham
(*National Neonatal Research Database NNRD not available)
29Definition: The crude rate of still births and neonatal deaths per 1,000 total births in the table above
uses the MBRRACE definitions. “MBRRACE exclude any stillbirths that are a consequence of late
(post 24 weeks) termination of pregnancy due to medical reasons and any neonatal deaths
associated with a live birth that occurs prior to 24 weeks gestation” The 2015 MBBRACE data was
provided to each Local Maternity System with the expectation that “[g]oing forwards, the annual
MBRRACE reports are used to measure progress against Local Maternity System ambitions”
“The national ambition is for there to be a 50% reduction in stillbirth and neonatal mortality rates by
2030 (with an interim milestone of a 20% reduction by 2020) for which DH will be using 2010 ONS
data as the baseline. However, the consistent clinical advice from NHS England with regard to the
CCG Improvement and Assessment Framework is to use MBRRACE data. Therefore, the 2015
MBRRACE data has been used as the baseline for the purposes of Local Maternity System plans /
levels of ambition. Consequently, the level of reduction required to meet the national ambition will be
less than the headline figure – on average we expect a 10% reduction in stillbirths and neonatal
death rates by 2020 will be sufficient, although we would encourage Local Maternity Systems to go
further where possible. Given the variation in stillbirth and neonatal death rates that exists currently [
] it is recognised that those Local Maternity Systems with the highest rates have the greatest scope
for improvement and therefore should be planning for a larger reduction than those with the lowest
rates.”
(Maternity Transformation Programme Board, November, 2017, p4-5).
NTWD and DTHRW LMS ambitions are in line with the national ambitions.
At the time of setting trajectories, the most the most recent stillbirth rate (2015) in England was 4.4
per 1,000 total births, down from 4.6 in 2014. There has been a general downward trend in the
stillbirth rate since 2005 with a decrease of 18.5% over the last 10 years. Despite this, England has
higher neonatal mortality and stillbirth rates than many other high income countries. There is also a
wide variation in stillbirth rates between different regions’ across England.
According to the recent MBRRACE-UK report (2016) the two North East LMS have:
crude still birth rates that are 10% lower than the England average
stabilised and adjusted still birth rates that are up to 10% lower than the UK average
crude neonatal mortality rates that are more than 10% lower than the UK average
stabilised and adjusted still neonatal mortality rates that are up to 10% lower than the UK average
crude extended perinatal mortality rates that are more than 10% lower than the UK average
stabilised and adjusted perinatal mortality rates that are up to 10% lower than the UK average
The following four tables are sourced from the following report:
3031
Crude stillbirth rates by Sustainability and Transformation Partnership (England) and county
of residence (Scotland, Wales and Northern Ireland) based on postcode of mother’s residence
at time of delivery: United Kingdom, for births in 2016.

                                                                                          32
Crude neonatal mortality rates by Sustainability and Transformation Partnership (England)
and county of residence (Scotland, Wales and Northern Ireland) based on postcode of
mother’s residence at time of delivery: United Kingdom, for births in 2016.
33Crude extended perinatal mortality rates by Sustainability and Transformation Partnership
(England) and county of residence (Scotland, Wales and Northern Ireland) based on postcode
of mother’s residence at time of delivery: United Kingdom, for births in 2016.
34Activity to reduce stillbirths - The Saving Babies’ Lives (SBL) Care Bundle
There is a need to both reduce the stillbirth rate overall, in line with other high income countries, and
to close the gap between regions at a national level.
The LMS and the Northern England Maternity Clinical Network are working, individually and
collectively, to reduce the stillbirth rate via the adoption of the Saving Babies Lives (SBL) care bundle
which includes four elements:
Element 1 - Reducing smoking in pregnancy
Element 2 - Detecting fetal growth restriction
Element 3 - Raising awareness of reduced fetal movement
Element 4 - Improving effective fetal monitoring during labour
The Saving Babies’ Lives Care Bundle Findings Survey 8
Northern
England
Providers Northern
carrying out England
improvement Providers National
activities National Benchmark at 100% Benchmark
Element 1: Smoking in pregnancy 100% 99% 75% 68%
Element 2: Detecting FGR 100% 96% 25% 33%
Element 3: Reduced fetal movement 100% 100% 75% 53%
Element 4: CTG monitoring 100% 100% 100% 58%
All elements 100% 25% 25% 13%
NHS England, December 2017 8 out of 9 providers responded
NHS England conducts quarterly surveys to monitor progress of the SBL care bundle by acute
provider trust and significant improvements have been made across the LMS in each of the
elements: 1, 3 and 4.
As part of the Maternity Clinical Network dashboard, stillbirth and neonatal mortality rates are
collected and monitored on a quarterly basis from each provider trust. This information is shared at
the Maternity Network Clinical Advisory group for interpretation and analysis.
Whilst progress has been made, there is still significant improvement required to reach full
compliance and this is reflected in the LMS Transformation plans, particularly in the prevention and
safety sections.
The LMS and the Maternity Network will be working towards the expectation (NHS planning
guidance) that the Saving Babies Lives Care Bundle will be fully implemented by March 2019.
The element requiring most improvement is element 2, detecting fetal growth restriction, specifically
having sufficient sonography to implement national screening algorithms and compliance with the
need to audit detection rates across the entire Network area.
Each Baby Counts – Network Data
Intrapartum
Year Neonatal Death Brain Injury
Stillbirth
2015 2 9 24
Total numbers for North East 2016 2 12 32
2017 2 8 22
This table shows the numbers of cases that have been submitted to the Each Baby Counts national
team from Northern England acute provider trusts since 2015. These numbers, alongside MBRRACE
35data, will be used to inform the LMS baseline position, and how we assess our progress towards the
2020 and 2030 targets.
Intrapartum Brain Injuries
“This refers to the number of infants admitted to a neonatal unit with a number of defined conditions.
The data source for estimating the number and rates of brain injuries based on the above definition is
the National Neonatal Research Database (NNRD), a summary of electronic patient admissions to
neonatal units in England, Wales and Scotland”
(Maternity Transformation Programme Board, November, 2017).
Due to the data source not yet being available the LMS were advised to await publication prior to
developing their levels of ambition.
In the interim, crude numbers collected locally for Each Baby Counts submissions have been
included above.
Maternal Deaths
Previously, all maternal deaths were reported to the Local Supervisory Authority, which ceased to
exist in 2016. There is currently no formal process for collation of these cases and identification of
provider trust level data.
Maternal deaths are included in the small list of cases that the Network, Acute Provider Trusts and
LMS Boards have agreed should have an external expert clinician present at any case review. This
process is managed via the RCA terms of reference and learning from these cases feedback through
the Maternity Patient Safety Learning Network for wider sharing of good practice, lessons learnt and
for identification of any shared actions required to improve and standardise care. All maternal deaths
will eventually be reviewed by the external HSIB process and the Network is fully engaged with the
progress and will assist with roll out in our area as appropriate.
The Network has linked with other clinical networks and understands national work around learning
from deaths. The Maternal Medicine Group will provide a forum for discussing national reports and
recommendations and maintaining an overview of local death cases and themes.
36Personalised Care Planning
Key Lines of Enquiry
D. Are there clear and credible plans to roll out personalised care planning as envisaged
in section 7.3.2 of the LMS resource pack?
LMS Number of personalised care plans
Trajectory Trajectory Trajectory
Local baseline
March 2019 March 2020 March 2021
Darlington, Tees,
Hambleton and 0% (0) 25% (3,057) 33% (4,035) 40% (4,891)
Richmondshire
Northumberland, Tyne
and Wear and North 0% (0) 25% (4,414) 33% (5,826) 40% (7,062)
Durham
At present, all North East provider trusts offer personalised care plans to women, according to the
definition in Better Births resource pack (March, 2017). In particular this means that they should:
“Record
- What is important to the woman and her family
- The health needs of the woman and her baby
- The decisions she makes about the care and support she receives.
Cover the antenatal, intrapartum and postnatal phases of care.
Be based on an ongoing dialogue with her midwife and, where appropriate, obstetrician.
Be kept up to date as the pregnancy progresses and in line with assessments around risk and the
mother’s and baby’s health and wellbeing.
Includes strategies to help each woman manage her own health”
However, it is acknowledged that personalised care plans are likely to be variable across providers –
and even within the same organisation, and for example there might be occasions when not every
element of the documentation is complete.
No national data is currently available on personalised care plans however NHS Digital have been
asked to include this in the pending update to the MSDS, but this is likely to take at least another 18
months before the data starts flowing.
As the LMS do not currently have a way to demonstrate that personalised care plans meet the
definition above, the baseline is considered as 0%. However having reviewed the personalised care
sections within hand held maternity notes, every provider demonstrates opportunity for choice
conversation and birth planning.
Activity to improve personalised care planning:
LMS will follow the actions outlined in the LMS Transformation Plan to achieve 25% of woman having
a personalised care plan by end of 2019; 33% by 2020; 40% by 2021 and 100% in 2025. These level
of ambitions refer to the numbers of women who will have all elements of personalised care plan
completed.
Lay representatives are engaging with women to understand their perception of personalised care
plans.
Maternity choice digital booklet will be made available to all women across all three Local Maternity
Systems in Northern England, outlining the maternity offer across the 3 LMS and providing
opportunities to discuss and document their personalised care choices.
37You can also read