Time-Resolved Macromolecular Crystallography at Pulsed X-ray Sources - MDPI
←
→
Page content transcription
If your browser does not render page correctly, please read the page content below
International Journal of
           Molecular Sciences

Review
Time-Resolved Macromolecular Crystallography at
Pulsed X-ray Sources
Marius Schmidt
 Physics Department, University of Wisconsin-Milwaukee, Milwaukee, WI 53211, USA; m-schmidt@uwm.edu;
 Tel.: +1-414-229-4338

 Received: 27 February 2019; Accepted: 18 March 2019; Published: 20 March 2019

 Abstract: The focus of structural biology is shifting from the determination of static structures to the
 investigation of dynamical aspects of macromolecular function. With time-resolved macromolecular
 crystallography (TRX), intermediates that form and decay during the macromolecular reaction can be
 investigated, as well as their reaction dynamics. Time-resolved crystallographic methods were initially
 developed at synchrotrons. However, about a decade ago, extremely brilliant, femtosecond-pulsed
 X-ray sources, the free electron lasers for hard X-rays, became available to a wider community.
 TRX is now possible with femtosecond temporal resolution. This review provides an overview of
 methodological aspects of TRX, and at the same time, aims to outline the frontiers of this method at
 modern pulsed X-ray sources.

 Keywords: time-resolved crystallography; serial femtosecond crystallography; Monte Carlo
 integration; beta-lactamase; bacterial phytochromes

1. Introduction
     Time-resolved macromolecular crystallography (TRX) unifies structure determination with
reaction dynamics. Structures that evolve along the reaction coordinate can be determined with
near atomic resolution in concert with the kinetic mechanism using the same set of crystallographic
data. In favorable cases, no other information is required. Ever since the first protein structure was
determined, it has been the goal of structural biologists to observe how biological macromolecules
perform their function in real time. Among their many functions, which range from ligand binding
to signal transduction, catalytic activity is most important. TRX has come a long way from early
approaches at second-generation synchrotron light sources in the 1980s [1–3] to experiments at
fourth generation X-ray sources that feature femtosecond (fs)-duration and extremely brilliant X-ray
pulses [4–6]. At synchrotron light sources, the polychromatic Laue method [7] is mostly used.
The broad bandwidth of the ‘pink’ X-rays allows the instantaneous collection of integrated reflection
intensities. This is required as with the traditional rotation method [8], the time required to rotate
the reflections through the Ewald sphere is too long to provide the required fast time-resolution.
Complex software solutions needed to be developed to process the complicated, weak, and spatially
overlapping macromolecular Laue data [9,10]. Lately, free electron lasers for hard X-rays (XFELs) have
become available, which has propelled TRX to a new level. The enormous X-ray pulse intensities at
these machines makes it possible to interrogate a tiny crystal with a single X-ray pulse that lasts only
femtoseconds. This opens the previously unreachable ultrafast time scales to crystallography. As the
XFEL pulses are quasi-monochromatic, new approaches to recover the integrated X-ray intensities
from highly partial X-ray data were required. The integrated intensities are assembled from hundreds
to thousands of observations for each individual reflection gathered from a large number (millions)
of diffraction patterns. These patterns were collected from trillions of tiny crystals that were injected
in serial fashion into the X-ray beam. This approach, called Monte-Carlo integration [11,12], enabled

Int. J. Mol. Sci. 2019, 20, 1401; doi:10.3390/ijms20061401                       www.mdpi.com/journal/ijms
Int. J. Mol. Sci. 2019, 20, 1401                                                                     2 of 23

the collection of complete datasets of highly accurate reflection intensities suitable for de novo X-ray
structure determination [13] and TRX experiments.

2. Synchrotron Light Sources
     Synchrotron X-ray sources feature sub-ns X-ray pulses (around 100 ps) that are well suited for TRX
experiments. Undulator sources produce intense, hard X-ray radiation which can be tuned to around
12 keV (λ~1 Å). Near atomic resolution with crystals much smaller than 50 µm is feasible even at room
temperatures [14]. Undulator radiation typically carries a bandwidth of a few percent (2–5%) between
200 eV and 500 eV. At third-generation synchrotrons such as the Advanced Photon Source (APS) at the
Argonne National Laboratory in Lemont, IL, the number of photons per 100-ps pulse is on the order of
5 × 10¹⁰ [15] in a 5% bandwidth. For exploiting this type of X-ray radiation, the Laue method [7] is
employed. The advantage is that a substantial number of reflections (2–10% of reciprocal space) are
excited simultaneously, and the integrated reflection intensity is collected (almost) instantaneously [16].
Since Laue reflection intensities can be scaled together by making use of the known spectral form of the
incident X-ray radiation, only a few diffraction patterns, on the order of 50, are required for a complete
dataset. Once the pink beam is monochromatized to typical values of about 0.01% bandwidth, (i) the
overwhelming majority (>99%) of X-ray photons are disregarded and (ii) largely partial reflections
are collected. Reflection intensities cannot be scaled together unless the crystal is rotated to collect
the integrated reflection intensity. When the time resolution is pushed to the single-pulse limit, the
crystal is effectively fixed during the pulse duration; rotations and translations are frozen in space.
Each diffraction pattern is either a Laue pattern or a monochromatic still, depending on the X-ray
bandwidth employed. These are some of the constraints under which a TRX experiment must be
designed. Complete datasets at synchrotrons consists of a small number of diffraction patterns, each
produced from multiple X-ray pulses. They require relatively large crystals and multiple crystal
settings. These requirements make a TRX experiment very tricky; newest developments attempt to
overcome these limitations. This review covers some of the most recent advances.

3. Free Electron Lasers
     The free electron lasers for hard X-rays (XFELs) changed the way TRX experiments were
conducted. XFELs feature femtosecond X-ray pulses with 1012 –1013 hard X-ray photons (>9 keV)
per pulse. These photons come within a quasi-monochromatic bandwidth of about 0.1%. Only those
reflections that are lying on the Ewald sphere, and thus in reflection position, are excited by all X-ray
photons available in the beam; the rest do not contribute to the diffraction pattern. The number of
photons per 0.1% bandwidth (bw) in a single X-ray pulse is more than three orders of magnitude
higher at XFELs (>1012 photons/0.1% bw) than at the synchrotron (5 × 10¹⁰ photons/5% bw or
109 photons/0.1% bw). Accordingly, crystals smaller by three orders of magnitude might be probed
by a single pulse. In addition, the laser-like properties of the XFEL allow loss-free focusing of the
X-ray beam on small, nanometer-sized spots. As a result, sub-micrometer-sized crystals diffract
well and produce high-resolution diffraction patterns from a single X-ray pulse [17,18]. However,
after just one X-ray pulse, the acceptable X-ray dose deposited in the tiny crystal is exceeded by
several order of magnitudes [19] and the crystal suffers substantial radiation damage. The ultrashort,
femtosecond-long X-ray pulse ensures that the diffraction pattern is collected before the crystal is
destroyed by X-ray damage [20]. The crystal is discarded and replenished by a new, pristine one.
This led to the development of serial femtosecond (nano) crystallography (SFX) [17], where a large
number of small crystals are injected one by one into the X-ray beam in random orientation. For this,
a dense crystalline slurry is pumped through an injector nozzle device. The archetypical device
is called a ‘gas dynamic virtual nozzle’ (GDVN) [21] that forms a jet of about 5 µm in diameter.
The crystals move in the jet with a speed of about 10 m/s until they are interrogated by the X-ray pulse.
Reflections from each microcrystal are highly partial due to the monochromaticity of the X-ray beam.
Averaging over a large number of observations (typically on the order of 500 for each reflection) is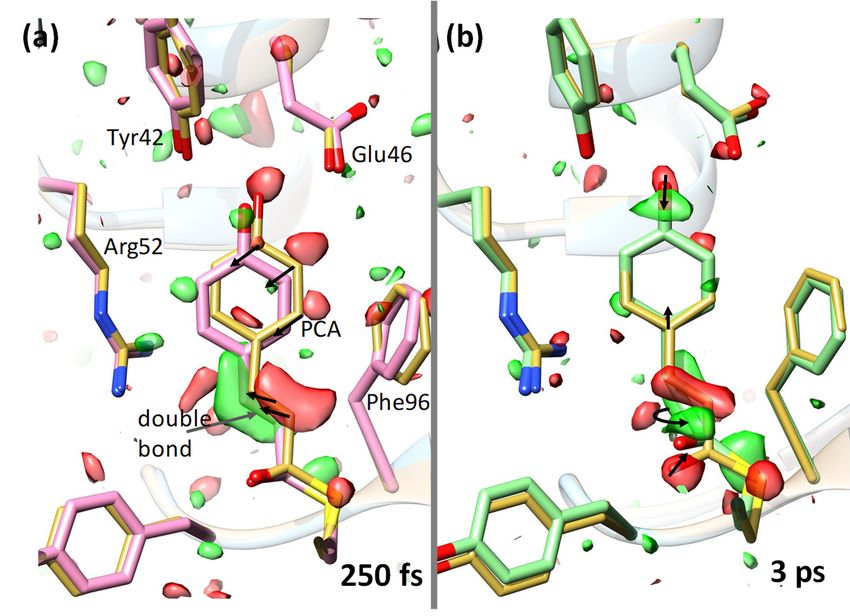
Int. J. Mol. Sci. 2019, 20, 1401                                                                    3 of 23

required to obtain the integrated reflection intensity. This necessitates the collection of a large number
(on the order of 40,000) diffraction patterns containing Bragg reflections, which need to be sorted out
from a much larger number (a few million) of blank patterns that contain no reflections [22]. Since each
and every microcrystal arrives at the X-ray interaction region in random orientation, each diffraction
pattern needs to be indexed anew [23]. Indexing rates were initially low, but have increased to 80% and
higher due to software sophistication and advances in optimizing detector geometries. The number of
microcrystals required for a complete dataset also depends on the pulse repetition rate of the X-ray
light source. For example, the Linac Coherent Light Source (LCLS) located at the SLAC National
Accelerator Laboratory in Menlo Park, CA, features a 120-Hz repetition rate. The use of 8-ms gaps
between the X-ray pulses allows a large number of microcrystals to pass by without being interrogated
by X-rays. The jet volume passing by in 8 ms is about 1.6 × 10⁻⁶ mL, given the jet diameter of 5 µm
and speed of 10 m/s mentioned above. Assuming a crystal density of 1011 /mL, 160,000 crystals will
pass by, and only one is interrogated by the X-ray pulse. Moreover, the probability that an X-ray
beam of 1-µm diameter intersects a 1-µm crystal in the jet is low, on the order of 5%, even at high
crystal volume densities. As a result, for a single diffraction pattern with Bragg reflections, about
3 million microcrystals are required. To obtain 50,000 patterns of which 40,000 can be indexed for a
dataset, therefore, on the order of 150 billion (1.5 × 10¹¹ ) microcrystals are needed, which is actually
1.5 mL of the dense crystalline slurry mentioned. In reality, this number is higher due to experimental
challenges, and lies on the order of 5 mL, which contains about 100 mg of protein and half a trillion
(0.5 × 10¹² ) microcrystals.
     To reduce the number of crystals required for a dataset, two strategies among many are
immediately conceivable: (i) the jet speed can be reduced so that a smaller volume of dense crystalline
slurry passes by, and (ii) the pulse repetition rate of the XFELs can be increased. Both strategies
are successfully pursued. A device that produces a much slower jet was developed [24] that allows
tightly spaced volumes to be interrogated by the low repetition rates of most XFELs. The device
slowly (at nL/min speeds) extrudes a viscous material containing microcrystals. This drives crystal
consumption down to less than one milligram, even at the LCLS with its 120-Hz pulse repetition.
The first material, which was used to form the viscous jet, was a lipid that formed a lipidic cubic
phase. The lipidic cubic phase has a viscosity comparable to toothpaste. Therefore, the injector device
has been also called the ‘toothpaste’ injector. The ‘toothpaste’ injector was very successfully used for
many membrane proteins, including the rhodopsins [25,26] and GPCRs [27,28]. At the Japanese XFEL,
the Spring-8 Ångstrøm Compact X-ray LAser (SACLA), an injector system was developed that uses
various viscous materials such as nuclear-grade grease (superlube) as jet material [29,30]. Crystals are
extruded into the 30-Hz repetition rate X-ray pulses at SACLA. This method has been successfully
used for soluble [31,32] and membrane protein crystals [26,33]. Other slow injectors rely on electric
fields to produce a finely spun liquid jet [34].
     High X-ray pulse repetition rates necessitate closely spaced electron bunches in the linear
accelerator (LINAC). The displacement currents required to generate the electric fields to accelerate
these bunches in the LINAC are substantial, which limit pulse repetition rates with warm copper
technology. At cryogenic (liquid helium) temperatures, superconducting technology can provide
repetition rates of up to MHz. The first superconducting XFEL is the European XFEL (EuXFEL) in
Hamburg, Germany. The EuXFEL is designed to provide 10 pulse trains per second, where each
pulse train ultimately consists of up to 2700 X-ray pulses at a repetition rate of 4.5 MHz (with 200 ns
between the pulses within the train). After a gap of about 99.5 ms, the pulse train repeats. As a result,
the EuXFEL will produce 27,000 pulses per second, which is more than two orders of magnitude
faster than the LCLS. However, the X-ray camera that collects the Bragg patterns must operate at a
MHz rate in order to separate the diffraction patterns produced by the individual pulses in the pulse
trains. An appropriate camera, called the adaptive gain integrating pixel detector (AGIPD), has been
developed that is capable of collecting diffraction patterns with a 4.5-MHz frame rate [35]. It has
been shown that MHz data collection is possible with the AGIPD and specially designed GVDNs that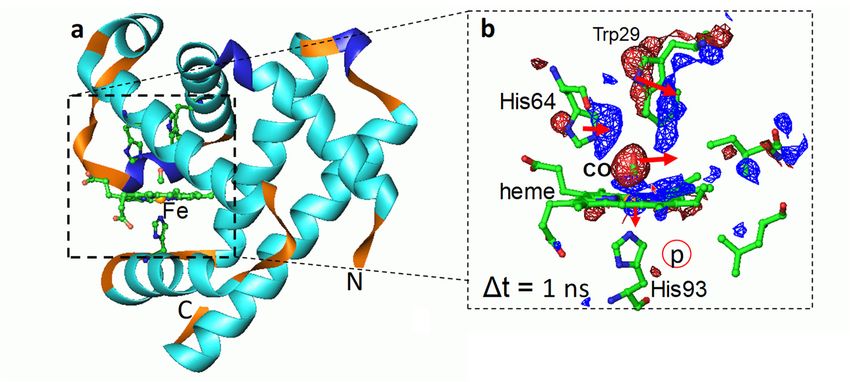
Int. J. Mol. Sci. 2019, 20, 1401                                                                     4 of 23

produce jets with 30–100 m/s velocity [36,37]. At this velocity, subsequent pristine jet volumes are not,
or only insignificantly, affected by X-ray pulses intersecting the jet further downstream. Still, there are
99.4-ms gaps between the pulse trains. As a result, about 100 million crystals per second pass by and
are not interrogated by X-rays. However, if specifications are fully adhered to (27,000 X-ray pulses/s),
the collection of a dataset will only take about 40 s (again assuming 40,000 indexed patterns with a hit
rate of 5% and an indexing rate of 80%). Note that the hit rate is only dependent on the crystal density
in the jet and does not change despite the faster X-ray repetition rate. Consequently, only 4 billion
microcrystals will be required for a dataset at the EuXFEL, as opposed to 150 billion at the LCLS. This jet
also produces substantial waste during the 99.4-ms breaks between the pulse trains. A ‘jet-on-demand’
that only delivers crystals during the approximately half-millisecond-long X-ray pulse trains would
reduce this waste by more than two orders of magnitude. Superconducting XFELs such as the
LCLS-II with constant repetition rates (from a few kHz up to 1 MHz) would certainly reduce sample
consumption even more and speed up data collection enormously. As the gaps between the X-ray
pulses are 10 µs at 100 kHz, a high-speed jet would not be necessary. With conventional jet velocities of
about 10 m/s, 100 µm of jet material between the X-ray pulses would ensure that the next, fresh crystal
is not affected by a previous X-ray pulse [36–39]. A sample reduction by a factor of 50 relative to the
EuXFEL and almost a factor of 1000 relative to the LCLS operating at 120 Hz can be expected. Rather
than consuming more than 100 mg of sample at the LCLS, as required today, less than 0.1 mg will be
only required per dataset. At 100 kHz, the collection of a complete dataset will only take 10 s (assuming
5% hit rate and 80% indexing rate), and it should be possible to collect hundreds of datasets per hour.
Since time-resolved experiments require comprehensive time-series of time-resolved X-ray data that
may consist of a large number of complete datasets, high-repetition-rate XFELs such as the EuXFEL or
upgrades to the LCLS are indispensable. Any low-repetition-rate method used to deliver crystals, such
as the viscous (‘toothpaste’) jet, the fixed target [40], or providing drops on demand [41], cannot be
used at high-repetition-rate XFELs unless they can be modified to cope with the enormous repetition
rates. It is possible that droplets of liquid and/or viscous material could be injected directly into the
X-ray interaction region with high repetition rates using fast and precise instrumentation. This will
allow the interrogation of soluble protein and membrane protein microcrystals alike. Then, the dream
of following a biomolecular reaction with closely spaced time-delays would become a reality. Methods
and concepts to analyze these data were initially developed using synchrotron TRX data [42–44], and
could be also applied to XFEL data as shown previously [5]. However, on the ultrafast time-scale an
interpretation by conventional, thermal bath-driven chemical kinetics as described in textbooks [45] is
not applicable. Reactions proceed on excited-state potential energy surfaces (ES-PES) and are driven
by electrostatic interactions [46]. Transitions to the ground-state potential energy surface (GS-PES) may
occur through conical intersections [46]. The description of the dynamics on the ultrafast time scale as
well as the characterization of functional modes and structures near the conical intersection now is an
important goal of TRX. In this review, TRX experiments using low-repetition-rate XFEL sources are
covered. They, for the first time, allow insight into biomolecular reactions with versatility and speed
that has been impossible before.

4. Reaction Initiation
     Despite the larger protein consumption, macromolecular reactions can be investigated with
time-resolved serial crystallography (TR-SX) at the synchrotron [47] or with TR-SFX at the
XFEL [4]. In fact, the serial crystallography approach seems to be predestined for these applications.
When a reaction is started in the microcrystals upstream of the X-ray interrogation zone (see Figure 1),
a time-resolved dataset is collected without additional complications. The challenge is to provide
a versatile system to start reactions in crystals. This is most straightforward when the reaction can
be initiated by light in and near the visible range. This requires (i) the presence of a light-sensitive
compound, a chromophore, and (ii) that absorption of light is functional and triggers a biologically
meaningful reaction. Examples are provided further below. The chromophore is activated by an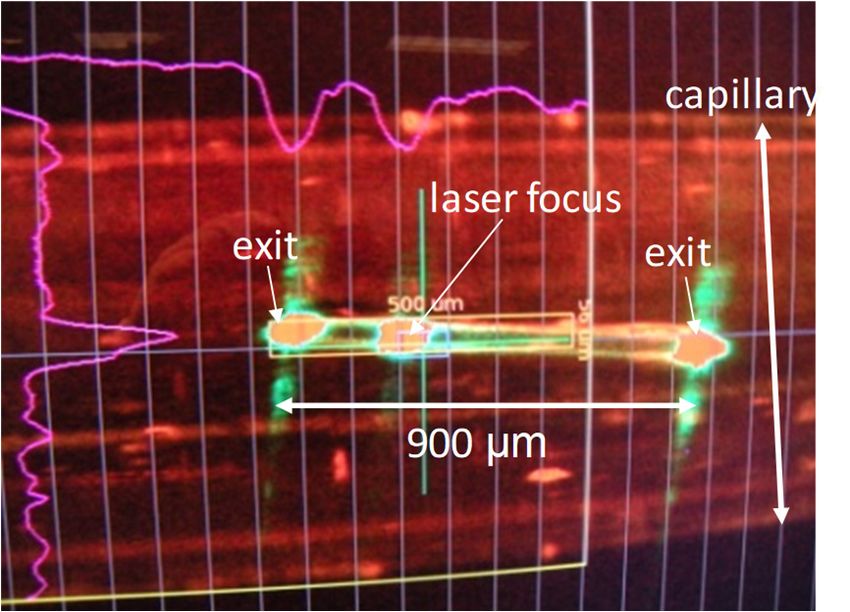
Int. J. Mol. Sci. 2019, 20, 1401 5 of 23
intense, short or ultrashort optical laser flash, which generates a response of the biomolecule on
various time scales. The laser flash is synchronized to the accelerator radio frequency of the pulsed
Int. J. Mol.
X-ray Sci. 2019,
source. This20,way,
x FOR PEER
the time delay ∆t between laser and X-ray pulses (Figure 1) can be selected
REVIEW 5 of
and23
adjusted. When time delays are substantially shorter than the 100-ps pulse duration of the synchrotron,
required.
XFELs are A complication
required. arises caused
A complication bycaused
arises the substantial temporal temporal
by the substantial jitter of the XFEL
jitter beam
of the XFELwhich
beam is
aroundis300
which fs [48].
around 300Iffsthe biological
[48]. reaction isreaction
If the biological to be observed on the femtosecond
is to be observed time scale,time
on the femtosecond the
temporal differences between laser and X‐ray pulses must be measured on a
scale, the temporal differences between laser and X-ray pulses must be measured on a shot-by-shot shot‐by‐shot basis using
a timing
basis using tool [5,6,49,50].
a timing This enhances
tool [5,6,49,50]. Thisthe time resolution
enhances substantially
the time resolution beyond the
substantially jitter. Another,
beyond the jitter.
Another, more general method to trigger reactions in light-insensitive biomolecules and is
more general method to trigger reactions in light‐insensitive biomolecules and enzymes described
enzymes is
later on. The
described laterresult
on. Theof aresult
successful TRX experiment
of a successful is one or more
TRX experiment is onecomplete datasets ofdatasets
or more complete reflection
of
intensitiesintensities
reflection collected collected
after light activation
after and a complete
light activation reference
and a complete datasetdataset
reference collected in theindark
collected the
(Figure 1).
dark (Figure 1).
laser xray
t
t (ns, fs) dark t (ns,fs)
120 Hz
60 Hz
Figure 1. A
Figure 1. A time-resolved
time‐resolved macromolecular
macromolecular crystallography
crystallography (TRX) (TRX) experiment
experiment with
with the
the pump–probe
pump–probe
method.
method. The pump laser pulse (blue bar) starts the reaction, and the ultrashort X‐ray pulse (red
The pump laser pulse (blue bar) starts the reaction, and the ultrashort X-ray pulse (red bar)
bar)
probes of the reaction after a time delay, ∆t.
probes the progress of the reaction after a time delay, ∆t. Here, X‐ray data collection in the dark as
the progress Here, X-ray data collection in the dark as the
the
reference
referenceisisinterleaved
interleavedwith
withdata
datacollection
collectionafter
afterlaser
laserlight
lightactivation.
activation. The
TheX-ray data
X‐ray collection
data rate
collection is
rate
120 Hz,Hz,
is 120 as as
available at the
available LCLS,
at the andand
LCLS, thethe
laser repetition
laser repetitionraterate
is 60
is Hz in this
60 Hz example.
in this example.
5. Data Collection and Structure Determination
5. Data Collection and Structure Determination
During X-ray exposure, a crystal diffraction pattern is collected by the detector. Commercially
During X‐ray exposure, a crystal diffraction pattern is collected by the detector. Commercially
available detectors installed at synchrotrons output a file format that typically consists of a header
available detectors installed at synchrotrons output a file format that typically consists of a header
that includes information such as pixel size, pixel numbers in x and y dimensions, detector distance
that includes information such as pixel size, pixel numbers in x and y dimensions, detector distance
from the crystal, beam center, etc., followed by the raw data as a byte stream. Data analysis follows
from the crystal, beam center, etc., followed by the raw data as a byte stream. Data analysis follows
established procedure [16,51]. Detectors available at XFELs such as the CSPAD [52] or the AGIPD [35]
established procedure [16,51]. Detectors available at XFELs such as the CSPAD [52] or the AGIPD
stream the content of multiple active detector panels individually. This information needs to be
[35] stream the content of multiple active detector panels individually. This information needs to be
gathered and stored in a user-accessible form. In addition to the detector image, additional information
gathered and stored in a user‐accessible form. In addition to the detector image, additional
is collected, such as the spectral traces of the timing tool to determine the relative laser pulse to X-ray
information is collected, such as the spectral traces of the timing tool to determine the relative laser
pulse delays [49,50,53]. All the data are concentrated on a per-event (exposure) basis in files based on
pulse to X‐ray pulse delays [49,50,53]. All the data are concentrated on a per‐event (exposure) basis
the hierarchical data format (HDF). Diffraction patterns containing Bragg reflections are identified in
in files based on the hierarchical data format (HDF). Diffraction patterns containing Bragg reflections
the stream of detector data using a hit-finder such as the popular Cheetah software [22]. Since the
are identified in the stream of detector data using a hit‐finder such as the popular Cheetah software
diffraction patterns arise from microcrystals in random orientation, each pattern needs to be indexed
[22]. Since the diffraction patterns arise from microcrystals in random orientation, each pattern needs
anew, after which the highly partial reflection intensity can be extracted. This requires specialized
to be indexed anew, after which the highly partial reflection intensity can be extracted. This requires
software, such as CrystFEL [23,54], designed to index and analyze still exposures. After averaging a
specialized software, such as CrystFEL [23,54], designed to index and analyze still exposures. After
large number of observations for each reflection, a complete dataset covering 3D reciprocal space is
averaging a large number of observations for each reflection, a complete dataset covering 3D
obtained. This method of data processing has been named, based on the random nature of the crystal
reciprocal space is obtained. This method of data processing has been named, based on the random
orientation, Monte-Carlo integration [11].
nature of the crystal orientation, Monte‐Carlo integration [11].
5.1. Twinning
5.1. Twinning
With the serial approach, a complete dataset generated is composed of observations from a large
numberWith
of the serial crystallites.
different approach, a This
complete
leads dataset generatedcomplication:
to an additional is composed In
of some
observations from asome
space groups, large
number of different crystallites. This leads to an additional complication: In some space groups,
of the cell axes are identical in lengths. The indexing algorithm assigns cell axes randomly from some
of the cell axes are identical in lengths. The indexing algorithm assigns cell axes randomly from
crystallite to crystallite. A consistent indexing convention cannot be maintained. This may lead to an
indexing ambiguity. Even when the cell axis lengths are not identical, such as in monoclinic space
groups, some of the axes can have almost the same lengths, or there may a diagonal that by chance is
of similar length compared to another cell axis. An example is sperm whale myoglobin crystallized
in space group P21 with room temperature unit cell parameters a = 64.5 Å, b = 30.9 Å, and c = 34.8 Å,
Int. J. Mol. Sci. 2019, 20, 1401                                                                       6 of 23

crystallite to crystallite. A consistent indexing convention cannot be maintained. This may lead to an
indexing ambiguity. Even when the cell axis lengths are not identical, such as in monoclinic space
groups, some of the axes can have almost the same lengths, or there may a diagonal that by chance is
of similar length compared to another cell axis. An example is sperm whale myoglobin crystallized in
space group P21 with room temperature unit cell parameters a = 64.5 Å, b = 30.9 Å, and c = 34.8 Å,
β = 105.8◦ . The short diagonal d of the parallelepiped spanned by a and c is 64.4 Å: essentially the
length of a. Also, the angle between the diagonal d and cell constant c is 105.6◦ , which is essentially β.
Accordingly, when indexing, either the true cell constant or the diagonal will be randomly assigned
to be cell constant a. As should be obvious, the intensities of reflections with like indices in the same
pattern indexed with either one or the other indexing convention do not match. This twofold indexing
ambiguity can be resolved by correlating intensities of reflections with like indices in two patterns
and altering the indices in one of the patterns when the correlation is low [55]. For the above example
of myoglobin, the operator h + l, −k, −l needs to be applied (see also [6]). It should be mentioned
that the indexing ambiguity for myoglobin cannot result in a merohedrically twinned macroscopic
crystal. For this to occur, the ambiguous cell axes must be exact. An example is space group P63 ,
where axes a and b have exactly the same length [4]. There exists the indexing ambiguity h,k,l and
k,h,l (minus signs are not necessary in P63 due to symmetry). Under these conditions, (merohedrally)
twinned macroscopic crystals might also exist [56]. In other, hopefully rare cases, the inability to
distinguish cell axes with almost the same lengths might generate severe problems, especially at low
resolution, with highly mosaic crystals containing big macromolecular complexes. Software to process
SFX data therefore needs to provide a reliable mechanism to solve the indexing ambiguity (see [55]
and http://www.desy.de/~{}twhite/crystfel/manual-ambigator.html).

5.2. Difference Maps
      When the indexing ambiguity is solved and the partial intensities are scaled and merged, the
integrated intensities can be converted to amplitudes with standard methods [57]. A reference dataset,
F(ref ), and a time-resolved dataset, F(t), are obtained this way. It is imperative to scale the time-resolved
amplitudes as accurately as possible to the dark (reference) amplitudes. The program ‘scaleit’
available within the CCP4 suite of programs [57] is particularly useful [4]. Difference amplitudes
∆F = F (t) − F (re f ) are then determined. If the unit cell parameters do not change, isomorphous
difference maps are calculated from the ∆F and phases from the reference model. Atomic displacements
caused by structural changes are identified by pairs of positive and negative difference electron
density features. Valid negative features are always on top of atoms of the reference structure.
Chemically meaningful positive features must be interpreted with a new structure. To find this
(unknown) structure can be difficult, since positive difference electron density features and negative
features tend to cancel out. In addition, population transfer from the resting state into the reaction
is usually quite small: on the order of 5–20% [58]. Especially when the structural changes are small,
the void between the features is confusing, and the atoms tend to be shifted too much towards the
positive features. Fortunately, there exists a way to produce a conventional map where the population
transfer is extrapolated to 100% [59]. A factor N of the measured difference, ∆F(obs), is added to
calculated structure factors, F(calc), determined from the reference state model to obtain extrapolated
structure factors, F (ext) = N ·∆F (obs) + F (calc), from which a conventional map can be calculated.
When a larger fraction of molecules has been activated in the crystal, N is small: on the order of 2–5 [4].
Even when the fractional concentration of activated molecules (FCM) is small, this method is successful.
Then, however, N is large [60]. The resulting extrapolated map is noisy due to errors caused by the
difference Fourier approximation [61] and due to experimental noise in the (then) small difference
amplitudes. N can be estimated (Nest ) even in the presence of low FCM by subsequently adding more
of the ∆F to the dark structure factors and inspecting the resulting extrapolated map at positions
where there is strong negative difference density in the difference map. This can be conveniently done
by carving out a spherical volume from the extrapolated map positioned at locations that display
Int. J. Mol. Sci. 2019, 20, 1401 7 of 23
strong difference electron density. The negative (extrapolated) density found within the spherical
volume is summed up below a threshold [43,60], and the result (Σs ) is plotted as a function of N.
The appropriate Nest is found at the point where Σs starts to diverge [62]. Molecular model(s) (Mint )
can be found which interpret the extrapolated electron density. Mint is fit into the extrapolated map by
a real space refinement in an appropriate program, such as coot [63], and conventionally refined against
the extrapolated amplitudes. In the case of high Nest values, quality factors (Rcryst /Rfree ) obtained after
the refinement are poor. Nevertheless, a valid Mint is obtained that can be tested against the observed
difference data. For this, structure factors are calculated, each from the refined Mint and the reference
structure. From these, difference structure factors are obtained from which a calculated difference map
is computed. The calculated difference map can then be compared to the observed difference map.
The agreement between the observed and calculated difference maps is inspected, for example, by
using an appropriate correlation coefficient, and may be optimized by repeating the analysis with
slightly varying factors Nest and/or different models. Once the best Mint is found, phases for the ∆F are
available [43,60] and phased extrapolated structure factors can be determined. A refinement against
the phased extrapolated amplitudes usually results in acceptable R factors [4,5,43,58,60]. However, the
quality of Mint should be primarily based on the similarity (the correlation) between the calculated
difference map and the observed difference map. Ideally, Mint explains all difference features, and
even spurious (positive) difference electron density values are interpreted correctly. This is even more
important when the FCM is small and, correspondingly, Nest is large.
When the unit cell parameter changes substantially during the reaction, isomorphous difference
maps cannot be calculated. Then, ‘omit’ difference maps must be calculated using data obtained after
reaction initiation only (see, e.g., [64]). For this, a structural model with the region of interest removed
(omitted) is refined against the light data, preferentially with simulated annealing to minimize phase
bias. Structure factors F(omit) are calculated from the model. The omit difference map is then calculated
from the amplitudes ∆F = F (t) − F (omit), and phases from the refined (omit) model. Extrapolated
structure factors, F(ext), as well as extrapolated maps to guide structural interpretation, may also be
calculated if needed: F (ext) = F (omit) + N ·[ F (t) − F (omit)].
5.3. Analysis of Time Series
The ultimate goal of time-resolved crystallography is the determination of the dynamics of the
crystalline ensemble from the beginning to the end of a reaction. Chemical kinetics is governed by rate
coefficients and chemical kinetic mechanisms that need to be extracted from a comprehensive time
series of X-ray data. Approaches based on a component analysis, specifically on the singular value
decomposition (SVD), have been developed [42] and successfully applied to synchrotron [58,65–69] and
XFEL [5] data. Most importantly, mixtures that inevitably occur during chemical kinetics are separated
into pure constituents. For more details, the reader is referred to specialized reviews [43,44,70].
The SVD-based analysis then provides a comprehensive view of the reaction. A compatible chemical
kinetic mechanism, the rate coefficients of this mechanism, and the time-dependent concentrations of
the intermediate states as well as the time-independent structures of the intermediate states that
are populated during the reaction [43] can be determined. Even barriers of activation may be
extracted purely from the time-resolved X-ray data [58]. On ultrafast time scales, the description
according to chemical kinetics breaks down. Rather than driven by the heat bath, the dynamics is
governed by electrostatic interactions on the excited- and ground-state potential energy surfaces (see
below). The crystalline ensemble moves in synchrony, since the individual molecules do not have the
time to kinetically dephase. Protein quakes [71,72] and collective motions [5,6] become observable.
Closely spaced time delays are required on these time scales, and new analysis methods must be
developed [73].Int. J. Mol. Sci. 2019, 20, 1401 8 of 23
6. The Blue-Light Receptor Photoactive Yellow Protein
Ever since its discovery [74], the photoactive yellow protein (PYP) was used to motivate
innovations in TRX. Numerous publications in high-ranking journals testify to the importance of
this small protein [4,5,59,67,75–77]. By absorbing at a wavelength of 460 nm (in the blue region), it
senses blue light and it is thought to be responsible for the negative phototaxis [78] of the bacterium
(Halorhodospira halophila) in which it was originally identified. The central chromophore in PYP is
photoactive. It isomerizes from trans to cis configuration [79], which initiates conformational changes
of the protein. After the chromophore isomerization, PYP transitions through a photocycle with
several intermediates that acquire subsequent global, but distinct, conformations. Synchrotron-based
TR crystallography elucidated the photocycle to almost completion [58,65,67,69,77]. However, the
trans-to-cis photoreaction remained obscure because it is much faster than the pulse duration of X-ray
pulses available at synchrotrons. As one of the earliest experiments at the LCLS, an experiment to
probe this initial reaction of the PYP photocycle was conducted with macroscopically large (40-µm
diameter, ~1-mm long) crystals (Figure 2). This experiment did not produce datasets of sufficient
quality to obtain a time-resolved signal [80]. An international consortium of researchers tackled the
problem successfully with microcrystals at the CXI instrument of the LCLS [4]. They produced, for
the first time for any biological macromolecule, a time-resolved difference electron density (DED)
map at the XFEL. The quality of the DED was unprecedented and fully unexpected. At a 1-µs time
delay, the DED map showed difference features on the order of 20 times above the noise, which had
never observed for PYP at synchrotrons. This experiment then opened the door wide to advance to
the femtosecond time range. An experiment with fs time resolution was conducted again at the CXI
instrument; this time, however, with the reaction initiated by a femtosecond laser [5]. For the first time,
the chemically all- important trans-to-cis isomerization was seen in real time by observing how electron
density clouds shift (Figure 3). Quantum mechanical molecular dynamics simulations show that after
light absorption, the PYP is lifted to the electronic excited-state potential energy surface (ES-PES).
However, the chromophore configuration is still trans on the ES-PES (Figure 3a). The experiment
showed, for the first time, macromolecular relaxations on an ES-PES. All other TR-crystallographic
experiments to this date featured PYP on the electronic ground state (GS)-PES, where the reaction is
driven by the thermal bath. The trans-to-cis isomerization happens at about 600 fs at the seam between
the ES-PES and the GS-PES: the so-called conical intersection. The transition through the conical
intersection, as well as the initial relaxation on the GS-PES, was also time-resolved in this experiment.
In contrast to conventional chemical kinetics, which is governed by rate coefficients and temperature,
the ultrafast relaxations on ES-PES and GS-PES are likely not temperature-dependent. The relaxations
are driven by electronic interactions and related structural relaxations after instantaneously accessing
the ES-PES. After the transition through the conical intersection, electronic relaxations commence on
the GS-PES. The initial events are governed by extreme acceleration of chromophore atoms on the order
of 1014 m/s2 . Some of the chromophore atoms reach the speed of sound after 100 fs and collide with
the rigid (on this time scale) protein matrix [5]. Most likely, there exist functional modes in the protein
which might be excited by this collision. They may facilitate a swift rotation about the chromophore
tail’s double bond (Figure 3a) and enhance population transfer into the photocycle. The characteristic
time of the relaxation through the conical intersection (~600 fs) and the relatively high primary yield
(20%) for photocycle excitation [81] are testimony for this. Eight hundred femtoseconds after excitation,
the chromophore is in a very twisted near-cis configuration, which relaxes further. The structure at the
3-ps time delay (Figure 3b) is already very similar to the synchrotron-derived structures 100 ps after
photon absorption [67,77]. The PYP will continue to drive new experiments and support new ideas.
For example, laser pulse shaping techniques [81,82] might be able to control molecules on the ES-PES
and steer the transition into the photocycle. High-repetition-rate XFELs are required to collect the
necessary X-ray data, which should cover closely spaced time delays in high-dimensional parameter
space. New attosecond-pulsed X-ray sources will explore, time-resolve, and remove the notion of
instantaneousness from the chromophore excitation itself.Int. J. Mol. Sci. 2019, 20, 1401 9 of 23
Int.Int.
J. Mol. Sci.Sci.
J. Mol. 2019, 20,20,
2019, x FOR PEER
x FOR REVIEW
PEER REVIEW 9 of 23 23
9 of
Figure
Figure Figure 2. 2.
Screenshot
2. Screenshot of aofphotoactive
Screenshot a photoactive
of a photoactive yellow
yellowyellow protein
proteinprotein(PYP)
(PYP) crystal
crystal
(PYP) (pale
(pale
crystal yellow)
yellow)
(pale displayed
displayed
yellow) onon
displayed a a
a on
monitor
monitor
at the monitor at the
XPP instrument XPP instrument
at the XPPof of the
the LCLSofduring
instrument LCLS
the LCLS during
laser laser illumination.
illumination.
during The crystal
The crystal
laser illumination. of size
of size
The crystal 900
of 900 × 40
× 40
size 900 × ×4040µm3
×
× 40 40
μm 3 is kept in a glass capillary. It is illuminated by a femtosecond laser pulse (laser focus). The crystal
is keptμmin ais glass
3 kept incapillary. It is illuminated
a glass capillary. by abyfemtosecond
It is illuminated a femtosecondlaserlaserpulse (laserfocus).
pulse (laser focus).
TheThe crystal
crystal
apparently
apparently actsacts
apparently as as
acts a waveguide,
as a waveguide,
a waveguide, with
withwiththethe
the laser light
laser
laser exiting
light
light atat
exiting
exiting both
at ends.
both
both ends.
ends.
Figure 3. Ultrafast
Figure 3. 3. structural
Ultrafast structuralchanges
changes in the
in inchromophore
the chromophore pocket
pocketof of
PYP PYP[5][5]
Green represents
Green represents a positive
a a
Figure Ultrafast structural changes the chromophore pocket of PYP [5] Green represents
difference
positive electron
differencedensity
electronand red
densitya negative
and red difference
a negative electron
difference density
electron (on the
density3/-3
(on σ contour
the 3/‐3 σ level).
positive difference electron density and red a negative difference electron density (on the 3/‐3 σ
Yellow structure
contour level).represents
Yellow a reference
structure (dark
represents state) structure.
a reference (dark The
state)p-coumaric
structure. acid
The (PCA)
p‐coumaric chromophore
acid
contour level). Yellow structure represents a reference (dark state) structure. The p‐coumaric acid
as well (PCA) chromophore as well as some nearby residues are marked. (a) 250 fs after laser excitation (pink the
(PCA) as some
chromophorenearby as residues
well as someare marked.
nearby (a)
residues 250
are fs after
marked. laser
(a) 250 excitation
fs after laser(pink structure);
excitation (pink
structure);
chromophore
structure); thethe
chromophore
configuration
chromophore configuration
is still trans. Larger
configuration is is
still trans.
structural
still Larger
trans.changes
Largerstructural
are denoted
structural changes areare
denoted
by arrows.
changes (b) 3by
denoted psbyafter
laserarrows. (b)(b)
excitation
arrows. 3(green
ps after
3 ps laser excitation
structure);
after laser (green
the structure
excitation (green structure);
structure); thethe
structure
is cis. Isomerization
structure is cis.cis.
occurred
is Isomerization
about theoccurred
Isomerization double
occurred bond
about
(curved aboutthethe
arrow) double
at thebond
double bond(curved
chromophore
(curved arrow)
tail.
arrow) at at
Somethethechromophore
structural tail.
changes
chromophore Some
tail.are
Some structural
also shownchanges
structural by areare
arrows.
changes also
also
shown byby
shown arrows.
arrows.
7. Transition Metal-Containing Proteins
7. 7.
Transition Metal‐Containing
Transition Proteins
Metal‐Containing Proteins
Myoglobin (Mb) is a paradigm of a biological macromolecule for biophysicists. It is sufficiently
Myoglobin
Myoglobin (Mb)
(Mb)is is
a paradigm
atoparadigm of of
a biological
a biologicalmacromolecule
macromolecule forfor
biophysicists.
biophysicists. It is sufficiently
It is sufficiently
complex, yet small enough reveal important properties of proteins under controlled conditions.
complex,
complex, yetyet
small
smallenough
enough to toreveal
reveal important
important properties
properties of of
proteins
proteins under
under controlled
controlled conditions.
conditions.
Mb contains a central pigment called heme, which is a protoporphyrin (IX) molecule that coordinates
Mb Mb contains
containsa central pigment
a central pigment called
calledheme,
heme, which
whichis aisprotoporphyrin
a protoporphyrin (IX)
(IX)molecule
molecule that coordinates
to atosingle
a singleiron
iron atom
atom (Figure
(Figure 4).4). If carbon
If carbon monoxide
monoxide (CO) is(CO)
added istoadded
Mb, to
it bindsMb,to toit that
the binds
iron,
coordinates
to the iron,
forming
to a single iron atom (Figure 4). If carbon monoxide (CO) is added to Mb, it binds the iron, forming
forming
Mb–CO. Mb–CO. Once the CO is flushed away from Mb, early protein relaxations and those related
Mb–CO.Once OncethetheCO COis isflushed
flushedaway awayfrom fromMb,
Mb,early earlyprotein
proteinrelaxations
relaxationsand andthose
thoserelated
relatedto to
to subsequent
subsequent
subsequent
geminate
geminate
geminate
rebinding
rebinding
rebinding cancan
canbebebe observed
observed
observedwith
with
with time-resolved
time‐resolved
time‐resolved methods. methods.
methods. Ligand
Ligand
Ligand
migration
migration
migration
and
and
and protein
protein conformational
conformational substates
substates were were
all all discovered
discovered with the with
help the
of help
this of
molecule
protein conformational substates were all discovered with the help of this molecule [66,83–88]. Figure this molecule
[66,83–88]. [66,83–88].
Figure
Figure 4 shows results from an earlier TR crystallographic study on the L29W mutant of Mb [66].
Already within 1 ns after the CO is flashed away, substantial protein relaxation has occurred, the distal
histidine has swung into the heme plane, the CO has migrated away from the heme, and the hemeInt. J. Mol. Sci. 2019, 20, x FOR PEER REVIEW 10 of 23
Int. J. Mol. Sci. 2019,
4 shows 20, 1401
results 10 of 23
from an earlier TR crystallographic study on the L29W mutant of Mb [66]. Already
within 1 ns after the CO is flashed away, substantial protein relaxation has occurred, the distal
histidine has swung into the heme plane, the CO has migrated away from the heme, and the heme
itself is substantially domed with the heme-iron displaced out of the heme plane. The earliest phases
itself is substantially domed with the heme‐iron displaced out of the heme plane. The earliest phases
of this
ofreaction were
this reaction then
were investigated
then investigatedon onfemtosecond timescales
femtosecond time scalesatat
thethe XFEL
XFEL [6].[6].
TheThe trajectory
trajectory of of
the COthetoCOitstoinitial docking
its initial site site
docking could be revealed,
could be revealed,as as
well asas
well initial
initialprotein
proteinrelaxations,
relaxations, extending
extending and
confirming earlier results
and confirming earlierfrom synchrotron-based
results TR LaueTR
from synchrotron‐based crystallography [66,85,87,88]
Laue crystallography and providing
[66,85,87,88] and
a solid structural
providing basestructural
a solid for ultrafast
base spectroscopic findings [89,90].
for ultrafast spectroscopic findings [89,90].
FigureFigure 4. Time‐resolved
4. Time-resolved crystallographicphotoflash
crystallographic photoflash experiment
experimentonon thethe
L29W
L29Wmutant of Mb–CO
mutant [66]. [66].
of Mb–CO
(a) Overall
(a) Overall structure
structure of Mb
of Mb
L29W–CO in the dark. Dashed box: heme pocket. Some important residues
L29W –CO in the dark. Dashed box: heme pocket. Some important residues
are displayed.
are displayed. TheThe
hemeheme iron
iron is is shownasasaayellow
shown yellow sphere.
sphere.(b)
(b)Close‐up
Close-up of of
thethe
heme pocket
heme 1 ns after
pocket 1 ns after
an intense optical laser flash to start photodissociation of the CO from the heme. t. The heme and
an intense optical laser flash to start photodissociation of the CO from the heme. t. The heme and
important residues are marked. Red: negative difference electron density; blue: positive difference
important residues are marked. Red: negative difference electron density; blue: positive difference
electron density (−/+ 3 σ contour levels, respectively). Red arrows show structural relaxations at this
electron density (−/+ 3 σ contour levels, respectively). Red arrows show structural relaxations at this
time delay. In this mutant, the Trp29 transiently occludes the primary docking site of the CO. CO is
time found
delay.atIntime
thisdelays
mutant, the
>1 μs onTrp29 transiently
the proximal occludes
side of the hemethe primaryp).
(red‐circled docking site of the CO. CO is
found at time delays >1 µs on the proximal side of the heme (red-circled p).
Transition metals are ubiquitous in biology. Iron is probably most abundant, but other metals
Transition
such as copper metals are ubiquitous
and manganese in found
are also biology. Iron is probably
in important proteins and most abundant,
enzymes. but other
Examples includemetals
such the
as copper and manganese
heme‐containing are alsonitrite
cytochrome‐c found in important
reductase [91,92],proteins and enzymes.
the manganese‐ Examples include
and iron‐containing
the heme-containing cytochrome-c
photosystem II [33,93,94], nitrite
the terminal reductase
oxidase [91,92], the
in the respiratory chain manganese-
(copper and andiron) iron-containing
[95], as well
as various superoxide dismutases (with iron, manganese, copper,
photosystem II [33,93,94], the terminal oxidase in the respiratory chain (copper and or other metals in their active sites)
iron) [95], as
[96,97]. There are many more metalloproteins [98]. Most of them catalyze
well as various superoxide dismutases (with iron, manganese, copper, or other metals in their active reactions of biologically
sites)and biomedically high importance, which merits investigation of their catalytic mechanism. Care has
[96,97]. There are many more metalloproteins [98]. Most of them catalyze reactions of biologically
to be taken that the transition metal is not photoreduced during X‐ray structure analysis [99].
and biomedically high importance, which merits investigation of their catalytic mechanism. Care has to
Otherwise, the change of the oxidation state might lead to rapid structural changes that may be
be taken that the transition metal is not photoreduced during X-ray structure analysis [99]. Otherwise,
significant, even during the ultrafast fs X‐ray pulses at XFELs [19,100]. Although the diffraction‐
the change of the oxidation
before‐destruction state
principle might
[17] leadthat
suggests to atomic
rapid structural
displacements changes
caused that may be significant,
by radiation damage can even
during the ultrafast
be neglected, fsexist
there X-ray pulses
cases, suchat asXFELs [19,100].II,Although
in photosystem where rapid the diffraction-before-destruction
configurational changes could
principle
affect[17] suggests thatof atomic
the interpretation catalyticdisplacements caused byInradiation
mechanisms [33,101–103]. other cases,damage can be neglected,
where conformational
changes are large, small effects due to radiation damage might
there exist cases, such as in photosystem II, where rapid configurational changes could play a smaller role. In TR‐SFX,affectthe the
crystal is discarded after each X‐ray pulse and the next crystal is new
interpretation of catalytic mechanisms [33,101–103]. In other cases, where conformational changes and pristine. As a result, a
reaction initiated in these crystals is completely unaffected by radiation
are large, small effects due to radiation damage might play a smaller role. In TR-SFX, the crystal damage until it is probed.
This is in contrast to the synchrotron, where radiation damage of a crystal by multiple X‐ray pulses
is discarded after each X-ray pulse and the next crystal is new and pristine. As a result, a reaction
(or by a longer X‐ray pulse) might also impair the kinetics [62]. However, also at the synchrotron, the
initiated in these crystals is completely unaffected by radiation damage until it is probed. This is
feasibility of serial macromolecular crystallography has been shown with monochromatic and pink
in contrast to the synchrotron, where radiation damage of a crystal by multiple X-ray pulses (or
beams [47,104–106]. Such an approach would also provide a clean, essentially X‐ray‐damage‐free
by a longer X-ray
description pulse)
of the might
progress of also impair the kinetics
a macromolecular reaction.[62].
Still, However,
the initiationalso at the synchrotron,
of reactions in crystals, the
feasibility of serial macromolecular crystallography has been shown with monochromatic and pink
beams [47,104–106]. Such an approach would also provide a clean, essentially X-ray-damage-free
description of the progress of a macromolecular reaction. Still, the initiation of reactions in crystals,
especially in enzyme crystals, remains a challenge. Methods to start reactions by laser pulses are fairly
established, but most proteins and especially enzymes are not light-sensitive. Even if they contain a
light-sensitive cofactor, its illumination with light would likely not be functional and would not triggerInt. J. Mol. Sci. 2019, 20, 1401 11 of 23
an enzymatic reaction. Apart from inactive caged substrates that could be soaked into enzyme crystals
and activated by laser pulses [107–109], there are only a few examples where light absorption actually
may be used to control enzymatic activity. Some such examples are mentioned below. Other examples
include enzymes that are engineered to be coupled to light-sensitive domains or moieties whose light
activation would change the enzymatic activity [110,111].
8. Enzymes
Enzymes are biocatalysts; they perpetuate the catalytic functions of life, and thus, they must
work properly and their functions must be regulated. If their functions are compromised, severe
diseases may result. Enzymatic reactions decide the fate of an organism. Cancer, for example, often
results from out-of-control enzymatic function, as comprehensively described in textbooks [112].
On the other hand, pathogens causing infectious diseases can be destroyed by targeting their essential
enzymes. Hence, it is of utmost importance to investigate enzymatic activity, understand catalytic
mechanisms, and explore opportunities to control their function. The “holy grail” of TRX is therefore
the ability to investigate reactions and interactions of enzymes with their specific substrates in real
time. At synchrotrons, these experiments are complex because a number of X-ray exposures (detector
readouts) from a single macroscopic crystal are usually required to produce a complete dataset.
This may require flow cells or other means [113,114] to load the crystal with substrate and remove
product after each exposure. To initiate the enzymatic reaction in the crystals, inactive, caged substrates
may be required that first need to diffuse into the crystals, and are subsequently activated by laser
pulses [107]. Crystals of many proteins, especially biomedically important ones, tend to scatter weakly
and exhibit large mosaicities. Both may impair the quality of the (monochromatic and especially Laue)
diffraction patterns collected at synchrotrons. Despite these demanding requirements, a number of
studies have been successfully conducted [3,16,115,116]. However, a transformative step forward
would be the elimination of experimental difficulties to the point such that routine investigations
become generally feasible on all sorts of biomacromolecular reactions. Serial crystallography with
microcrystals offers a practicable approach. Since the crystals are so small, they can be mixed with
substrate quickly and exposed one-by-one to the X-ray beam at a time ∆t after mixing. No flow cells
are required this way. A successful application of this approach has been demonstrated recently [64]
and is described below.
The first enzyme structure to be solved was that of lysozyme in 1965 [117]. Lysozyme catalyzes
the hydrolytic separation of 1,4-beta-links between N-acetylmuramic acid and N-acetyl-D-glucosamine
of bacterial cell walls; hence, it has antimicrobial activity. In chicken egg whites and human nose
mucus, lysozyme is the first line of defense against bacterial infections. Ever since, researchers
have been wondering how this enzyme performs its catalytic function. The static structure reveals
clues, such as the structure of the catalytic cleft and the positions of catalytically important amino
acid residues. However, as the X-ray structure is static, the precise catalytic mechanism is difficult to
determine. Even more important than lysozyme in the fight against infectious diseases are the so-called
penicillin-binding proteins (Figure 5a). These enzymes catalyze the linkage of N-acetylmuramic
acid to N-acetyl-D-glucosamine to form the cell wall in the bacteria, a reaction just opposite to
the lysozyme reaction. β-lactam antibiotics such as penicillins and chemically similar compounds
such as the cephalosporins irreversibly inhibit the penicillin-binding protein [118]. Once blocked by
these compounds, the enzyme is not able to maintain the integrity of the cell wall and the bacteria
perish. Unfortunately, resistance against antibiotics is rampant. β-lactamases are found among a
disturbingly large number of possible resistance mechanisms [119–121]. These enzymes modify
penicillin and related compounds by opening the peculiar, relatively unstable β-lactam ring of these
compounds. Some β-lactamases are strikingly similar to the catalytic domain of the penicillin-binding
proteins (Figure 5a). Even the catalytic clefts are essentially identical (Figure 5b). In contrast to
the penicillin-binding protein, which is irreversibly and covalently modified by the antibiotic, the
β-lactamases bind the antibiotic, catalyze the ring opening, and are finally able to hydrolyze and releaseYou can also read