Development of an assessment tool to enhance order process performance for an e-tail fashion company
←
→
Page content transcription
If your browser does not render page correctly, please read the page content below
Development of an assessment tool to enhance
   order process performance for an e-tail
             fashion company

                Maria João Coelho Santos

                    Master’s Dissertation
             Supervisor at FEUP: Prof. Isabel Horta
              Supervisor at Farfetch: Nuno Borges

      Integrated Master in Mechanical Engineering

                          2018-06-26
Resumo

    Nos últimos anos, verificou-se um crescimento abrupto na indústria de comércio eletrónico
diretamente proporcional à competitividade a ele inerente. A rápida expansão deste mercado,
levou ao aumento da complexidade dos processos, obrigando as empresas a reinventar as suas
estrategias de forma a fortalecer o seu crescimento.
    No entanto, o aumento da complexidade e do número de processos, num curto período de
tempo, dificulta estruturação e consequentemente afetando a consistencia dos mesmos. Desta
forma, existe uma necessidade crescente em melhorar os processos, redesenhando-os. A Farfetch,
empresa onde o presente projeto foi realizado, faz parte da indústria de comércio electrónico, no
setor de moda de luxo. O ritmo elevado de crescimento teve como consequencia o aumento das
vendas. Como tal, tornou-se imperativo usar os dados e as ferramentas disponíveis para otimizar
e simplificar os processos da empresa.
    A presente dissertação visa desenvolver uma ferramenta de avaliação para melhorar o desem-
penho do processo de encomendas. Durante o processo de encomedas, ocorrem imprevistos que
podem impactar o desempenho de uma loja tais como atrasos da transportadora, artigos danifica-
dos ou até mesmo preços mal cobrados. Assim, essas questões devem ser avaliadas e validadas, de
acordo com regras pré-definidas. O processo em questão era executado manualmente e de forma
destruturada. Como resultado, existiram várias oportunidades de optimização do processo, per-
mitindo não só a sua automatização como tambem melhorar o desempenho da equipa responsável.
A ferramenta foi desenvolvida com base na metodologia Business Process Management (BPM),
permitindo uma avaliação completamente autónoma e eficiente do processo. Posteriormente, as
ferramentas de visualização de dados foram desenvolvidas usando o software Tableau, refletindo
os resultados da ferramenta e monitorizando todo o processo.
    O modelo desenvolvido aumentou a visibilidade do processo, permitindo a rápida identificação
de problemas através da constante monitorização de todas as váriaveis dependentes deste. A eficá-
cia da ferramenta de avaliação desenvolvida foi corroborada pelas poupanças obtidas, não apenas
a nível monetário, mas também operacional, permitindo o planeamento estratégico do processo e
o alinhamento global das operações.

                                                i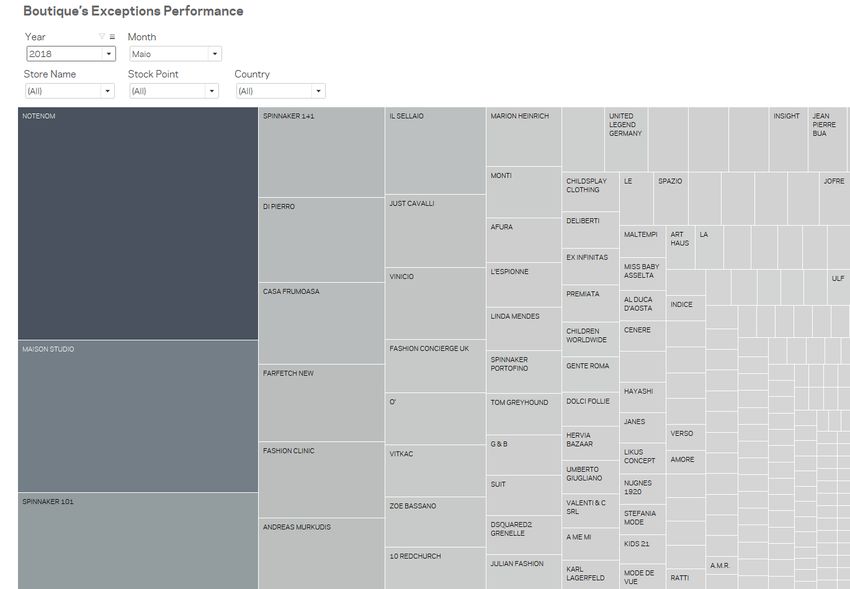
Abstract

    In the last years, there has been an abrupt growth of the e-commerce industry, which is di-
rectly proporcional to the market growth. This quick expansion increased process complexity, as
companies are constantly reinventing strategies in order to strengthen their growth.
    Increasing the complexity and number of processes in a short period of time makes it difficult
to structure processes and impacts their consistency. Thus, there is an emerging need to improve
processes, by redesigning them.
    Farfetch, the company where the present dissertation was carried out, is part of the e-commerce
industry in the luxury fashion sector. As a consequence of the accelerated growth pace, there was
a significant increase in sales. As such, it became imperative to use the data and the tools available
to optimize and simplify the company’s processes.
    The present dissertation aims to develop an assessment tool to enhance ordering process per-
formance. During the ordering process, there are unforeseen occurrences that can affect the per-
formance of a boutique such as courier’s delays, faulty items or even wrong prices. These issues
must be evaluated and further validated, according to pre-established rules. The process was com-
pletely manual and without any structured standard. Therefore, there were several opportunities to
improve and automate it, and consequently to improve the performance of the responsible team.
The tool was developed based on the Business Process Management (BPM) methodology allowing
a completely autonomous and efficient evaluation of the process. Afterwards, data visualization
tools were developed using Tableau software, reflecting the tool outcomes and monitoring the
whole process.
    The developed model brought a clear visibility to the process, allowing the quick identification
of issues through the constant monitoring of all the inherent variables. The effectiveness of the
evaluation developed tool was corroborated by the savings achieved, not only at the monetary but
also at the operational level, allowing for strategic process’ planning and the overall alignment of
operations.

                                                  ii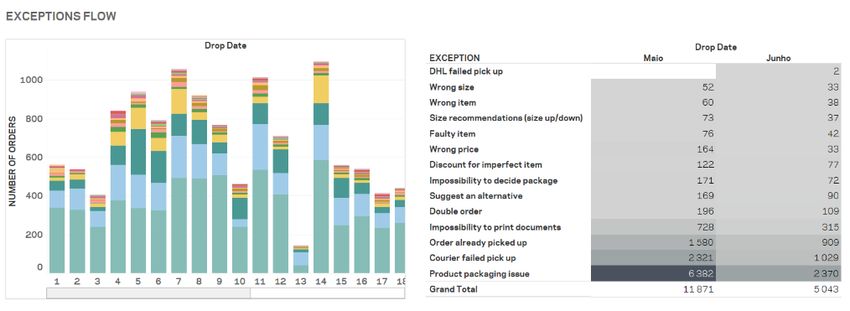
Acknowledgments

    After 5 academic years, a journey full of mixed emotions is coming to the end. The present
dissertation is dedicated to all the ones that cross my path, and somehow supported me and helped
me to achieve my goals.
   To my parents and sister for all the love, support, and care.
    To my grandmother for all food cooked with love that saved me thousands of times. To my
faculty friends for sharing the best time of my life with me, since the best to the worst moments.
   To all the professors that, in a certain way, shaped my path over here.
    To my supervisor at FEUP, Prof. Isabel Horta, for all the shared suggestions during this dis-
sertation.
   To Gonçalo, Magda, Miguel, and Kathleen for all advice during the developed project.
   To Supply team for all the support.
   To Farfetch for giving me the opportunity to develop my dissertation in such an incredible
company.

                                                iii
"Once you stop learning, you start dying."
Albert Einstein
ivContents
1 Introduction 1
1.1 Farfetch . . . . . . . . . . . . . . . . . . . . . . . . . . . . . . . . . . . . . . . 1
1.2 Global Operations Department . . . . . . . . . . . . . . . . . . . . . . . . . . . 2
1.3 Project Scope . . . . . . . . . . . . . . . . . . . . . . . . . . . . . . . . . . . . 4
1.4 Project Goals . . . . . . . . . . . . . . . . . . . . . . . . . . . . . . . . . . . . 4
1.5 Methodology . . . . . . . . . . . . . . . . . . . . . . . . . . . . . . . . . . . . 5
1.6 Dissertation’s Structure . . . . . . . . . . . . . . . . . . . . . . . . . . . . . . . 5
2 Literature Review 7
2.1 E-commerce scope in luxury fashion industry . . . . . . . . . . . . . . . . . . . 7
2.2 Business Process Management . . . . . . . . . . . . . . . . . . . . . . . . . . . 8
2.3 Business Process Modeling . . . . . . . . . . . . . . . . . . . . . . . . . . . . . 10
2.4 Data Visualization . . . . . . . . . . . . . . . . . . . . . . . . . . . . . . . . . 11
3 Problem Description 13
3.1 Company’s Interfaces . . . . . . . . . . . . . . . . . . . . . . . . . . . . . . . . 13
3.2 Ordering Process . . . . . . . . . . . . . . . . . . . . . . . . . . . . . . . . . . 14
3.3 Key Performance Indicator (KPI’s) . . . . . . . . . . . . . . . . . . . . . . . . . 17
3.3.1 Speed of Sending (SoS) . . . . . . . . . . . . . . . . . . . . . . . . . . 17
3.3.2 No Stock . . . . . . . . . . . . . . . . . . . . . . . . . . . . . . . . . . 18
3.3.3 Net Promoter Score (NPS) . . . . . . . . . . . . . . . . . . . . . . . . . 18
3.3.4 Service 3.0 . . . . . . . . . . . . . . . . . . . . . . . . . . . . . . . . . 19
3.3.5 Exceptions . . . . . . . . . . . . . . . . . . . . . . . . . . . . . . . . . 20
4 Proposed Solutions 24
4.1 Exceptions Process Mapping . . . . . . . . . . . . . . . . . . . . . . . . . . . . 24
4.1.1 Delivery Exceptions . . . . . . . . . . . . . . . . . . . . . . . . . . . . 26
4.1.2 Zendesk Exceptions . . . . . . . . . . . . . . . . . . . . . . . . . . . . 31
vCONTENTS vi
4.2 Redesigned Process’s Implementation . . . . . . . . . . . . . . . . . . . . . . . 32
4.2.1 Zendesk Combo Box . . . . . . . . . . . . . . . . . . . . . . . . . . . . 32
4.2.2 Gathering Information . . . . . . . . . . . . . . . . . . . . . . . . . . . 33
4.2.3 Exceptions’ Model Automatization . . . . . . . . . . . . . . . . . . . . 35
5 Final Outcomes 38
5.1 Exceptions Management Tool . . . . . . . . . . . . . . . . . . . . . . . . . . . 38
5.1.1 Tool Tracking Metrics . . . . . . . . . . . . . . . . . . . . . . . . . . . 40
5.2 Dashboards . . . . . . . . . . . . . . . . . . . . . . . . . . . . . . . . . . . . . 42
5.3 Proof of concept . . . . . . . . . . . . . . . . . . . . . . . . . . . . . . . . . . 48
6 Conclusions and Future Work 53
Appendix A Mapping 57
A.1 Courier Failed Pickup . . . . . . . . . . . . . . . . . . . . . . . . . . . . . . . . 57
A.2 Order Already Picked Up . . . . . . . . . . . . . . . . . . . . . . . . . . . . . . 61
A.3 Zendesk . . . . . . . . . . . . . . . . . . . . . . . . . . . . . . . . . . . . . . . 63
Appendix B Queries 65
B.1 Exceptions’ Main Query . . . . . . . . . . . . . . . . . . . . . . . . . . . . . . 65
B.2 SoS Query . . . . . . . . . . . . . . . . . . . . . . . . . . . . . . . . . . . . . . 66Acronyms and Symbols
AWB Air Waybill
BPM Business Process Management
BPMN Business Process Management Notation
CFP Courier Failed Pickup
CS Partner Service
DO Double Order
FI Faulty Item
IPD Impossibility to Print Documents
IDP Impossibility to Decide Packaging
IT Information Technology
KPI Key Performance Indicator
NPS Net Promoter Score
NS No Stock
OA Order Already Picked Up
PPI Product Packaging Issue
PS Partner Service
SA Suggest Alternative
SR Size Recommendation
SLA Service Level Agreement
SoS Speed of Sending
UML Unified Modeling Language
VBA Visual Basic For Applications
WI Wrong Item
WP Wrong Price
WS Wrong Size
viiList of Figures
1.1 Farfetch’s Structure . . . . . . . . . . . . . . . . . . . . . . . . . . . . . . . . . 2
1.2 Global Operations Structure . . . . . . . . . . . . . . . . . . . . . . . . . . . . 3
1.3 Project Methodology . . . . . . . . . . . . . . . . . . . . . . . . . . . . . . . . 5
2.1 Business Process Management Life-Cycle. (Dumas et al., 2013) . . . . . . . . . 8
2.2 Pool and Lane . . . . . . . . . . . . . . . . . . . . . . . . . . . . . . . . . . . . 11
3.1 Ordering Process Overview . . . . . . . . . . . . . . . . . . . . . . . . . . . . . 14
3.2 Steps of Ordering Process . . . . . . . . . . . . . . . . . . . . . . . . . . . . . . 14
3.3 Step1-Check Stock . . . . . . . . . . . . . . . . . . . . . . . . . . . . . . . . . 15
3.4 Step2-Approve Payment . . . . . . . . . . . . . . . . . . . . . . . . . . . . . . 15
3.5 Step3-Decide Packaging . . . . . . . . . . . . . . . . . . . . . . . . . . . . . . 16
3.6 Exceptions Process Flow . . . . . . . . . . . . . . . . . . . . . . . . . . . . . . 20
3.7 SALES Exception Management . . . . . . . . . . . . . . . . . . . . . . . . . . 20
3.8 Pareto Exceptions’ Chart . . . . . . . . . . . . . . . . . . . . . . . . . . . . . . 22
3.9 % of Exceptions in Boutiques Orders Volume . . . . . . . . . . . . . . . . . . . 23
4.1 Courier Failed Pick Up . . . . . . . . . . . . . . . . . . . . . . . . . . . . . . . 27
4.2 Order Already Picked Up . . . . . . . . . . . . . . . . . . . . . . . . . . . . . . 29
4.3 "Farfetch’s Fault ?" field in PS Zendesk . . . . . . . . . . . . . . . . . . . . . . 32
4.4 Exceptions Query Diagram . . . . . . . . . . . . . . . . . . . . . . . . . . . . . 34
5.1 Exceptions Tool Main Menu . . . . . . . . . . . . . . . . . . . . . . . . . . . . 38
5.2 Exceptions’ Management Menu . . . . . . . . . . . . . . . . . . . . . . . . . . 39
5.3 Tool Automatization Evolution . . . . . . . . . . . . . . . . . . . . . . . . . . 41
5.4 Cost and Time Savings . . . . . . . . . . . . . . . . . . . . . . . . . . . . . . . 41
5.5 Workforce Allocation . . . . . . . . . . . . . . . . . . . . . . . . . . . . . . . . 42
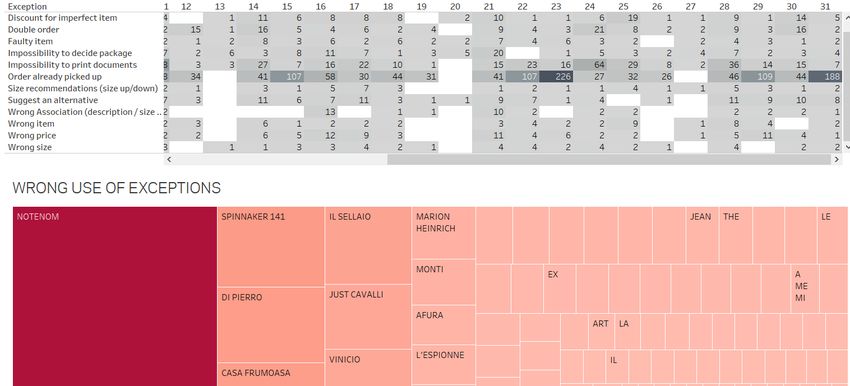
5.6 Exceptions Management: Workload and Flow I . . . . . . . . . . . . . . . . . . 44
viiiLIST OF FIGURES ix 5.7 Exceptions Management: Workload and Flow II . . . . . . . . . . . . . . . . . . 44 5.8 Boutique’s Exceptions Performance I . . . . . . . . . . . . . . . . . . . . . . . 45 5.9 Boutiques’ Exceptions Performance II . . . . . . . . . . . . . . . . . . . . . . . 46 5.10 Boutique’s Exceptions Performance III . . . . . . . . . . . . . . . . . . . . . . . 47 5.11 Tool’s Performance Monitoring . . . . . . . . . . . . . . . . . . . . . . . . . . . 48 5.12 Exceptions’ Forecast . . . . . . . . . . . . . . . . . . . . . . . . . . . . . . . . 49 5.13 Estimated Savings after tool implementation . . . . . . . . . . . . . . . . . . . . 50 A.1 Courier Failed Pickup AS-IS . . . . . . . . . . . . . . . . . . . . . . . . . . . . 58 A.2 Courier Failed Pickup TO-BE . . . . . . . . . . . . . . . . . . . . . . . . . . . 59 A.3 Courier Failed Pickup TO-BE - Sub-process . . . . . . . . . . . . . . . . . . . . 60 A.4 Order Already Picked Up AS-IS . . . . . . . . . . . . . . . . . . . . . . . . . . 61 A.5 Order Already Picked Up TO-BE . . . . . . . . . . . . . . . . . . . . . . . . . . 62 A.6 Zendesk AS-IS . . . . . . . . . . . . . . . . . . . . . . . . . . . . . . . . . . . 63 A.7 Zendesk TO-BE . . . . . . . . . . . . . . . . . . . . . . . . . . . . . . . . . . . 64
List of Tables

 3.1   Rules of SoS according to Service 3.0 . . . . . . . . . . . . . . . . . . . . . . .     19
 3.2   Rules of NS according to Service 3.0 . . . . . . . . . . . . . . . . . . . . . . . .    19
 3.3   Exceptions’ Description . . . . . . . . . . . . . . . . . . . . . . . . . . . . . . .   21

 4.1   Courier Failed Pickup metrics’ recalculation . . . . . . . . . . . . . . . . . . . .    28
 4.2   "Order Already Pickup" metrics’ recalculation . . . . . . . . . . . . . . . . . . .     30
 4.3   "Zendesk Exceptions’" metrics’ recalculation . . . . . . . . . . . . . . . . . . .      32
 4.4   Courier Failed Pickup Outputs’ . . . . . . . . . . . . . . . . . . . . . . . . . . .    36
 4.5   Order Already Picked Up Outputs’ . . . . . . . . . . . . . . . . . . . . . . . . .      36
 4.6   Zendesk Outputs’ . . . . . . . . . . . . . . . . . . . . . . . . . . . . . . . . . .    37

 5.1   Forecast Assumptions . . . . . . . . . . . . . . . . . . . . . . . . . . . . . . . .    50

                                               x
Chapter 1
Introduction
Online sales have been positioning themselves in the global retail world expecting an increase
from 10.2% (2017) to 17,5% (2021), according to Statista (2018).
Representing 8% of the global online sales (Borland et al. (2018)), luxury goods are the core
of Farfetch business. This market is constantly growing being expected an arise of 12 % in global
luxury goods sales until 2025, hence, reaching 1/5 of the global luxury goods sales (Borland et al.
(2018)) and so is Farfetch. However, the meaningful growth brings complexity and new demands.
At this point, it is crucial not only to structure the business, but also to ensure its scalability.
Therefore, the processes must be readjusted to the needs of the business having a growth need for
automatization.
This present project aims the standardization and further automatization of Exceptions’ pro-
cess , an internal company’s process. Through the development of a dynamic tool for the im-
provement of the Exceptions’ process and also to control and decrease the workload of the Supply
Team.
1.1 Farfetch
Farfetch.com is a global online marketplace that bridges the physical gap between its part-
ners, around 1200 boutiques and 10 brands of luxury fashion, and its potential customers around
the globe in one platform. Founded in London, where it still has its headquarters, the company
was launched in 2008 by José Neves and has been spreading strategic offices around the globe.
Currently, Farfetch has around 2000 employees scattered across the 12 offices: Oporto, London,
Guimarães, Lisbon, Hong Kong, Shanghai, Los Angeles, New York, Dubai, Moscow, São Paulo
and Tokyo.
The motto of the company is to revolutionize the way the world shops for luxury goods through
the most creative, exciting and diverse customer experience. The differentiating factor amongst
the other e-commerce players is its business model. By controlling the process – from content
1Introduction 2
creation, until the item reaches customers’ house - by assuring the post-sales customer service and
by displaying one of the widest variety of products in the market.
All the online items are held by the partners and later packaged and shipped from the respective
boutique, or warehouse using third part logistics (3PL) partners, therefore, Farfetch does not store
inventory. This competitive advantage brings with it a lot of complexity and challenges to the
business. Not only, it does exposes the company to the risk of stock out and create a dependency
on the partner’s performance to ship the orders on time, but it also increases the complexity of
delivery. Nevertheless, it eliminates the holding costs, providing the company flexibility to scale
and focus its workforce on improving all the supply-chain performance and logistic process.
There are 7 different departments working to assure the feasibility of the business in Farfetch
Portugal, shown in figure 1.1: Merchandising, Account Management, Technology, Finance, Office
Operations, Human Resources and Operations.
Figure 1.1: Farfetch’s Structure
Merchandising and Account Management work daily with boutiques providing them the best
support, not only to ensure their competitiveness and growing sales, but also to help them with
operational issues. The sales forecast and the definition of the best product assortments is Mer-
chandising responsibility while Account Management aims to optimize plans according to the
boutique’s needs.
The Technology department ensures the support of the back office (internal tools) and front
office (website) by developing and improving the company’s platforms, while Finance controls
the company’s cash flows. Office Operations and Human Resources are responsible for managing
the office and for recruiting new people, respectively.
Finally, the Global Operations department, where this thesis was developed, is responsible for
all operational tasks through the order and sales processes. In section 1.2 , this department will
be analyzed in detail, explaining how it is divided and what the responsibilities of each of those
teams are.
1.2 Global Operations Department
All the tasks related with daily e-commerce activities are responsibility of the Global Opera-
tions Department.1.2 Global Operations Department 3
This department works hard to create standards that allow the company to deliver a consistent
service while providing a luxurious experience. It is divided into 6 teams, as represented in the
following figure 1.2: E-commerce Operations, Supply and Retail Logistics, Customer Excellence,
Procurement, Operations Strategy and Creative Operations. These teams are structured, scalable
and able to manage large volumes of orders and data.
Figure 1.2: Global Operations Structure
Customer Excellence connects the company with partners and customers through Partner Ser-
vices (PS) and Customer Service (CS) teams. Customer Service provides all customer support
to guarantee customers’ pre and post- order journeys satisfaction. CS has the challenging task to
drive revenue through customer contacts. The goal is to make sure that the customer will shop
again through the website by inspiring confidence. PS supports boutiques on operational issues
and recommends strategic plans. The scheduling, planning and managing PS and CS performances
are responsibilities of the Workforce Management team.
Creative Operations explores innovative ways to accelerate product online, improves the effi-
ciency of the company product process and ensures the excellent service level to partners. This
team photographs each item, controls its quality and identifies their materials and designation
ensuring their availibity online.
Operations Strategy and Procurement are transversal to all the previous teams, working on the
continuous improvement of processes along with all operations’ teams and purchasing software
and material to support teams, respectively.
Supply and Retail logistics are accountable for controlling the service level provided for the
partners and for measuring their KPI’s. Operations Solutions helps partners to set up their ware-
house’s layout and advises them with the best practices to achieve the targets. Supply Operations is
the specific team where this project was developed. This team controls and measures the partners
KPI’s working alongside PS and CS teams and it is responsible for stock packaging management.
Furthermore, the Supply Operations team is involved in all areas related to process improvement,
providing to the Technology Department all the requirements for developing new back office tools,
to facilitate and support operational teams.Introduction 4
1.3 Project Scope
With Farfetch’s the continuous growth of and consequently its orders, it is extremely important
to assure the proper flow of the supply chain, which can lightly impact the customer satisfaction
and experience. As a result, the company’s process performance is increasingly demanding, re-
quiring redesigned processes to guarantee a healthy company growth.
Since an item is ordered, the order is processed on the website and automatically synchronized
with an intern platform, where the ordering process begins. During this, some issues can occur,
forcing the company to work with partners to solve them, avoiding further consequences. These
issues correspond to exceptions in the order process. Exceptions represent deviations that happen
throughout the process, which can change the normal path service. Internally, from the operational
point of view, exceptions are a set of options available on the back office platform that allow
boutiques to alert the responsible teams whenever an unforeseen situation prevents them from
completing the ordering process. There are 13 different exceptions that boutiques can report and
that will be further explored on chapter 3, section 3.3.5 .
Evidently, it is important to measure the performance of each partner, according to the com-
pany’s service incentive, to assure the highest standards of customer experience. However, creating
exceptions can have a negative impact on the boutique’s performance. Thus, to avoid harming the
company’s partners, the Supply Operations team evaluates the time used to solve the situation and
assesses whether it should be accounted for each boutique performance calculation or not.
Currently, the performance validation needs information from several sources and has a low
level of automatization. All the process is done manually, with about 9000 exceptions per month
arriving to the system and being handled one by one by the team. Afterwards, each exception is
submitted for further financial analysis.
The purpose of this project is to redesign the exceptions’ analysis process, building a tool ca-
pable of retrieving information from all sources and automatically analyze each exception through
a dedicated model. It aims to increase the team responsiveness, the process accuracy and visi-
bility through standardization, in addition to generating new reports and metrics to support the
redesigned process.
1.4 Project Goals
The present dissertation has the intent to develop a tool with an appropriate model to automa-
tize a current manual process in Farfetch. To do so, the following goals were established:
• Modeling and optimizing the exceptions’ process;
• Automatizing the process, increasing the process accuracy and supporting the team decision
making and also allowing the reduction of the supply chain team’s workforce;1.5 Methodology 5
• Building dashboards to monitor the process and the tool’s outcomes in order to assess the
partner’s behavior when creating exceptions enabling easier identification of patterns and
issues.
1.5 Methodology
Considering the previously objectives, it is important to define a methodology that will drive
the project to achieve the final goal. The 5 phases of the project will flow as it shows in figure 1.3:
Figure 1.3: Project Methodology
First, it is important to perceive the company’s business model, as well as understanding its
most significant KPI’s. After this, it is crucial to identify and deeply understand the current situ-
ation that comes along with the problem that triggered this project. Exception process mapping,
standards identification and KPI’s analysis are the tasks that will be ensured on 2nd phase.
The 3rd phase - Model Projection - is the main phase of this methodology, as the guidelines
will be established for further testing and implementation. It is expected an analysis of the current
processes, highlighting improvement opportunities and their re-design. Besides that, building
an optimized tool to fulfill the range of requirements is extremely important, which will imply
continuous and cyclic iterations until the guidelines fit the most of all the requirements gathered.
The tool’s development will take place on stage 4, following the previously established guide-
lines.
Lastly, an analysis of the tool’s outputs is performed and exhibited in dashboards that will
allow to monitor, not only the process and the tool performance but also the partners’ performance
in exceptions’ process.
1.6 Dissertation’s Structure
The content of the present dissertation is divided into 6 chapters. Chapter 2 presents a literature
review that combines the relevant subjects on the project development, including the e-commerce
scope in luxury fashion industry, the Business Process Management and Modelling methodology
and data visualization techniques.
Chapter 3, consists on a clarified view of the current handled processes and KPI’s, pointing
out its limitations, according with the scope of this project.Introduction 6 Chapter 4 covers the design of the current exceptions process, the respective re-design and also the development of the solutions to the tool. Regarding the chapter 5, it focuses on results achieved with the implemented solution, pre- senting the final tool and the developed dashboards to support the process. Lastly, the chapter 6 highlights the results of the project implementation and future work con- siderations to the resulting improvements.
Chapter 2

Literature Review

2.1      E-commerce scope in luxury fashion industry

    The connection amongst trade and technology has subsisted and perpetuated for a long time.
These days, the web has turned into an irreplaceable segment of individuals’ lives (Jai et al., 2013),
playing a powerful role in modern business (Okonkwo, 2009).

    However, “There was no love at first sight between luxury and digital”, quoting Heine and
Berghaus (2014). It may not be evident why e-commerce was not embraced right away by luxury
industry (Okonkwo, 2009). Nevertheless, it can be explained by the very core of luxury industry:
exclusivity (Okonkwo, 2007) and controlled retail distribution to keep up a premium status (Keller,
2009).

    Breaking a lot of paradigms and taking the risk of overexposure, while maintaining a fragile
perception of the restricted offer (Okonkwo, 2009), the percentage of luxury goods online in-
creased to 8% in 2016. Although, it is predicted that this number increases to 25% until 2025
(Borland et al., 2018).

    More and more E-tail -electronic retailing- business becomes a customer-to-customer (C2C)
reality, where buyers can, in one click, access a wide assortment of luxury goods, sharing their lux-
ury e-commerce experience with other consumers around the globe. The increase in online luxury
sales and digital influence generates demanding consumers, forcing this e-commerce segment to
reinvent itself and to adapt their strategies and approaches to the newest channels of communica-
tion (Borland et al., 2018).

    Nowadays, customers desire for multichannel deliveries, expecting an intimate service com-
bined with a personalized experience (Kate McCarthy and Su., 2017). Big data and machine
learning are creating opportunities to step up the relationship with each customer, thus taking their
experience to the next level. Advanced analytics not only enable fast answer to changes on demand
and to customer preferences but also highlight opportunities to incorporate tailored and authentic
services for every customer and occasion(Borland et al., 2018).

                                                  7
Literature Review 8
Therefore, the luxury fashion industry should be, increasingly, aware of the continuous trans-
formations on digital e-commerce, leveraged by advanced analytics in order to create chain value
and empowering scalability businesses (Borland et al., 2018).
2.2 Business Process Management
Around the world, the constant economic, technologic and digital changes are affecting the
way companies structure their businesses. More and more, companies are adopting process-
oriented strategies to support the integration of their operations in the global business (Willaert
et al., 2007).
A process is defined as a sequence of aligned activities and interactions carried out within an
organization, with the purpose of producing a specific product or service. According to available
resources and required information, a process can be characterized by its functional, behavioral,
organizational and informational character (Bal, 1998).
Business Process Management (BPM) is a holistic approach that allows companies to struc-
ture their operations through their modeling, monitoring and analysis, highlighting opportunities
for further improvements (Zacarias et al., 2017). Bridging the gap of knowledge-base between
technical and business people, BPM enables process re-engineering through the implementation
of continuous improvements, empowering the process optimization (Kluza and Nalepa, 2017).
Hereupon, BPM follows an iterative cycle as figure 2.1 shows and it will be explained bellow
(Dumas et al., 2013).
Figure 2.1: Business Process Management Life-Cycle. (Dumas et al., 2013)
The first step of BPM cycle is about problem identification. It comprises not only the relevant
processes’ problems identification but also a deep understanding of their scope. Then, linking the
relations between the processes, it is possible to set up the process architecture, hence having an
overview of all process. During this step, it is also crucial to measure the main outputs of the
process, by defining performance metrics. Only by measuring the main performance indicators it2.2 Business Process Management 9
is possible to control the overall process’ performance and to understand the impact of BPM in
the process. Depending on the process, these measures can comprise costs, lead time, work time
or even error rates. The potential outputs can also be measured in the process analysis phase.
Once the global process architecture is structured, it is possible to start the process discovery
phase, covering the documentation of the relevant steps. One of the main critical tasks of BPM is
to collect the information and knowledge-base to model the process flow and to define its rules.
According to Friedrich et al. , it represents 60% of the time spent on process management projects
(Friedrich et al., 2011). Then, business analysts leverage the know-how in the business process
modeling to organize all the information gathered in one single process. Business Process Model-
ing is defined, by Boukadi et al. (2009), as a graphical approach of the process business flow and
it will be analyzed in next the chapter 3. So, by analyzing the current processes and using business
process modeling approaches, business analysts are able to model an AS-IS model, reflecting the
picture given by the workers about how the process is currently done.
The third step of the BPM cycle consists of a deep analysis of the AS-IS model, highlighting
non-valuable actions, weaknesses, bottlenecks, and opportunities to improve the current processes
within companies. To do so, the business analyst must keep in mind the impact of the changes
in the process, swinging with the expectable performance measure. Usually, the issues are doc-
umented according to their impact and the effort to solve them, prioritizing the ones with most
impact and effort. After setting the modifications in the process, its re-design phase takes place.
This following phase is focused on redesigning and remodeling the current process, with the aim
to visualize a future improved scenario, designated as TO-BE model. As interactive process anal-
ysis and re-design may be, all the proposed changes that might come up while re-designing the
process must be analyzed before moving on to the next step.
After the process re-design, the next step embraces the TO-BE model implementation. During
this phase, there are two distinct tasks to perform: organizational change management and process’
automation. On the one hand, there is always a strong resistance to change. To contradict this,
it must be clarified the process’ changes, to train process’ stakeholders, according to the new
paradigm, and to explain them the benefits of the process’ implementation. Despite this being
a hard task, stakeholders have a key role in the implementation phase, once they are the ones
that are constantly testing the new processes and can identify easily its deficiencies. On the other
hand, process’ automation involves the implementation or configuration of IT systems in order to
support the TO-BE process. The IT tool should be intuitive, assisting the users to easily perform
tasks.
After the implementation phase, the process monitoring and controlling phase take place.
There is always room for improvement, so this phase helps analysts to detect outliers that are
not expected, according to the requirements. Then, the BPM cycle starts again to perform the
accurate adjustments.Literature Review 10
2.3 Business Process Modeling
As it was stated in the previous chapter 2.3, business process modeling is a graphical and
visual approach that supports and accelerates software development, upholding the management
improving decisions and analysis. The models must use an intuitive notation (Fjeldstad and Snow,
2017) being usually represented by maps, which are easily understandable to the stakeholders.
These maps should show how the process flows, representing inputs and outputs, linking tasks and
assigning people involved in them. Furthermore, it enables the process standardization, helping to
reduce the process variability (von Rosing et al., 2015).
Process modeling can have various levels of detail. However, it should follow a top-down
approach, by starting to map the process from a macro to a more detailed level (Anjard, 1996).
There is a wide range of notations used in process modeling such as a flowchart, functional
flow block, Unified Modeling Language (UML) and Business Process Model and Notations (BPMN)
(Saini and Thiry, 2017). Considering the scope of this dissertation it will be emphasized the BPMN
notation.
BPMN is a standard and intuitive notation based on flowchart techniques bridging the com-
munication lack between business process and business implementation. This notation has four
basic categories: flow objects, that comprises events activities and gateways, connecting objects,
swimlanes, and artifacts. Bellow, it will be exposed the main elements of BPMN as also their
description and notation:
• Events - Represents a specif moment that occurs during the business process. It can be a
start, ending or intermediate event.
• Activities - Set of atomic or composed tasks carried out in a business process such as tasks,
sub-processes and call activities. On one hand, the tasks represent atomic activities repre-
senting a single unit of work. On the other hand, the sub-process represents a composed
activity within a process that has a lower level process associated, and the call activity is a
notation to reuse an activity within the process, or even in another process.
• Gateways - Used to control the logic flow, converging and diverging paths within the pro-
cess. The most used are exclusive, inclusive and parallel. Exclusive is used to indicate
alternative paths that can be followed. While, inclusive is used to create alternative paths
based on a condition. It can be activated one or more conditions based on the process,
however, the activated activities must be completed before merging. Finally parallel gate-
ways are used to create alternative paths, however, all of them should be completed before
merging.
• Connecting Objects - Used to guide the flow of the process by connecting the flow objects.
There are 4 types of connecting objects: Sequence Flow, Message Flow, Association and
Data Association. Sequence Flow guides the process by following the order of the activities,
while Message Flow represents the exchanged messages between stakeholders. Otherwise,2.4 Data Visualization 11
Artifacts are used to associate artifacts to flow objects. Finally, Data Association associates
data with flow objects, in order to show the inputs and outputs of the activities.
• Swimlane - It contains elements named pool and lane, figure 2.2 which represent actors and
their roles in a business process, respectively.
Figure 2.2: Pool and Lane
• Artifacts - Additional standardized information needed to understand and complete the
process. It could be a annotation used to provide additional information and relevant notes
of the process or data objects that represent data, singular and collections of objects, used
in activities such as output or input. Group is another artifact that can be used to group
activities that do not influence the process flow.
2.4 Data Visualization
BPM is divided into 6 phases, as it was presented in the previous chapter 2.3, where the last
one is monitoring and controlling. Monitoring is a crucial phase in BPM life-cycle, allowing
companies to measure the results of their goals considering their growing awareness regarding
process performance (Weske, 2012). Therefore, it is needed to proceed with the creation of metrics
that help to translate the process performance.
In order to monitor processes attending to the respectively established metrics, it is needed
to develop reporting methods that directly extract data, displaying it in a clear and intuitive way.
The most used tool for monitoring the process performance across companies is the dashboard.
(Peral et al., 2017). A dashboard, according to Eckerson (2010) is a strategic management system
that reflects the company’s strategy results through performance metrics, which allow real-time
monitoring and works as an enabler to potentialize stakeholder’s proactive decisions, actions to
improve and automatize processes. Defined as performance a management tool, by Yigitbasioglu
and Velcu (2012), dashboards collect and organize data from a wide range of sources which allows
the representation of process metrics in a summarized way, allowing the user not only to easily
point out process anomalies but also to explore their limitations.
While structuring a dashboard, its visual and functional design features must be aligned, bal-
ancing data complexity with visual representation, in order to organize information in a more
usable way. Thus, visual features are linked to how efficiently the information will be perceived
by the user and how effectively it will be used in decision making. On the other hand, functionalLiterature Review 12
features refer to dashboards functionalities such as filtering capabilities (Yigitbasioglu and Velcu,
2012).
Likewise, data visualization covers a wide range of areas, embracing a lot of data and insights
from distinct fields. Hence, Fry (2007) suggests to divide the data visualization process into 7
stages: acquire, parse, filter, mine, represent, refine and interact.
• Acquire the data;
• Parse and structure the acquired data;
• Filter the relevant information;
• Mine the information by applying statistical and graphical methods to easily detect patterns;
• Refine, by engaging the information in a more visual way.
• Interact, by selecting methods enabling an intuitive manipulation of data and visible fea-
tures.
Suitable data visualization provides a consistent analysis of the relationships between the ana-
lyzed data. The advantage of graphical representations over text-based reports is the capability to
expose patterns and trends and spot potential issues. Contrarily, text-based reports do not present
the information in a visual way, hiding the patterns and out-liers (Eckerson and Hammond, 2011).
Summing up, data visualization is a powerful tool that improves company processes and en-
gagement. It supports upper-level management decisions by understanding cross functional ca-
pabilities that lead the company to profitable growth (Wind, 2005) and allocates the resources by
strategically pinpointing continuous improvement opportunities (Lou et al., 2016).Chapter 3
Problem Description
As previously mentioned in chapter 1, section 1.5 , the initial phase of the project’s method-
ology focuses, not only on a business overview, but also on a general understanding of the main
KPI’s, highlighting the supply chain processes’ flow and KPI’s directly connected with the project
of this dissertation. Therefore, to follow the stated methodology, it will be adopted an approach
based on the BPM method. This chapter will cover the first step of BPM approach, “Process
Identification”.
3.1 Company’s Interfaces
Almost all processes involved in this project are aided by one or more intern platforms, so it is
important to know them and their applicability. There are three main platforms: STORM, SALES,
and Zendesk.
STORM is a web-based application integrated with the boutiques’ system that allows them to
control the ordering flow, manage daily tasks (such as ordering process, stock management, and
returns) and report current issues.
On the other hand, SALES is only managed and used by Farfetch Teams. This web-based
application contains all the information about the ordering process, production process, delivery
scheduling and all the detailed information about boutiques. Furthermore, it is also on SALES
that exceptions are managed and where there is almost all information needed to evaluate them.
Moreover, these two platforms run slowly, increasing the team’s answering times and preju-
dicing their performance. This constitutes a problem that with new upgrades and by automatizing
some of the processes might be solved.
At last, Zendesk is the official communication tool for Farfetch’s Customer Service. It is an
interface that allows not only external communication - between boutiques and Farfetch teams or
customers-, but also enables internal communication.
13Problem Description 14
There are 3 different Zendesk platforms: Delivery Zendesk, Partner Service Zendesk, and Cus-
tomer Service Zendesk. The communication is established creating messages - tickets in Zendesk
glossary -, assigning them to agents that have the task to inform boutiques, solve the ticket or even
communicate with the customer if it is required. The tickets are managed first in first out (FIFO)
by the teams and all the company’s communications are done through them.
3.2 Ordering Process
As a marketplace, Farfetch links the customer to the boutique. Once the item is purchased on
the company’s website, the order is placed on STORM and, consequently, the ordering process
starts, flowing as it shows in next figure 3.1.
Figure 3.1: Ordering Process Overview
Currently, the ordering process is divided into 6 steps, as shown in figure 3.2: Check Stock,
Approve Payment, Decide Packaging, Create Shipping Label (Air WayBill), Ready to send and
Send. Therefore, even process numbers are company teams’ responsibility, whereas odd numbers
are boutiques’ responsibility.
Figure 3.2: Steps of Ordering Process
The ordering steps will be explained in detail below:
Step 1 - Check Stock
The first step starts when the order is placed on STORM until the item availability is confirmed
by the boutique, as shown on figure 3.3. For this reason, it is important to alert the partners to the
importance of checking the exact stock to avoid compromising the continuity of the ordering flow.
Most of the company’s partners are boutiques that, besides selling their luxury goods online, also
sell them physically - in other words, offline. Despite keeping track of the boutique’s stock level,
the system synchronization is not done instantaneously. This means that offline shopping can3.2 Ordering Process 15
happen between the moment that the order is placed on STORM and the moment that the online
update of stock is done.
This is called a “no stock“ situation. Intending to solve it, the system will look for the item in
another boutique, swapping it without the customer noticing, hence creating a new order and can-
celing the previous one. However, Boutiques can also suggest an alternative item to the customer
avoiding the “no stock” situation.
Figure 3.3: Step1-Check Stock
Step 2 - Approve Payment
Parallel to the first step occurs the second one -Approve Payment-, the responsibility of the
Fraud Team, represented on figure 3.4. Moreover, 95 % the orders are approved before Step 1
is completed. According to their behavior regarding the payment system, customers are distin-
Figure 3.4: Step2-Approve Payment
guished generating two lists: Black List and White List. On the one hand, White List Customers
are those who have a confirmed, secure and reliable payment source (among other aspects). On
the other hand, Black List Customers are those who cause problems with the payment process,
usually with a distrustful payment source. This means Farfetch has an updated report of the previ-
ous customers and can immediately and automatically reject or accept an order by consulting the
previously mentioned lists.
Beyond the orders from Black and White List Customers, that are automatically accepted or
rejected by the system, the Fraud Team also needs to deeply analyze the new customer’s order
origin, the payment source, and other relevant aspects in order to prevent a potential fraud. As aProblem Description 16
result of crossing the data with previous payments to identify standards and possibilities of being
fraudulent payments, some payments are directly rejected or accepted. In some cases, it can be
necessary to directly contact the customer to request a Proof of Billing by phone.
When the order is not reliable, the fraud analysts cancel the order, reporting the reason for
cancellation and adding the suspect to the Black List.
Step 3 - Decide Packaging
In Step 3, boutiques have the responsibility to match the proper packaging to the item ordered,
selecting it on STORM, as it shown on figure 3.5. During this step, Boutiques should package
the item according to the selected packaging, adding customized details such as a handwritten
postcard or a luxury wrapping paper, thus guaranteeing a luxurious customer experience.
Farfetch advises the boutiques about the better packaging for each item, however, boutiques
may set a new box if it is required. All boxes are designed by the company, but boutiques are re-
sponsible for managing and ordering their own packaging stock since it is provided by an external
company.
Figure 3.5: Step3-Decide Packaging
Step 4 - Air WayBill (AWB)
The shipping label and the AWB are created in Step 4 and it is automatic unless there is any
problem with the shipping information or legal restrictions that have to be handled by the Delivery
team. Usually, 95% of the orders take less than 2 hours to pass Step 4.
Step 5 - Send Parcel
As the shipping label is ready, the order is pushed forward to Step 5 to be collected by the
courier. When the boutiques have a considerable amount of orders per day, they are assigned a
daily pick up service. However, some boutiques do not have enough orders to justify daily pick
up, so the system books the pickup automatically, usually for the next day. Once the courier scans
the package, the order is moved to Step 6.
Step 6 - Sent
From the moment the courier scans the parcel, until it is received by the final customer, the
order is in transit, on Step 6. Once the parcel is scanned, the company sends a confirmation
email to the customer, distinguishing the time spent to process the order by the boutique and the
estimated time that will be spent by the courier to deliver the order.3.3 Key Performance Indicator (KPI’s) 17
3.3 Key Performance Indicator (KPI’s)
After understanding all the ordering process’ steps, it is also important to identify the KPI’s
that define the partner’s performance. The Speed of Sending (SoS) and No Stock (NS) are the
measured performance KPI’s and have, naturally, a direct impact on the customer’s experience.
Furthermore, it is likewise to refer Net Promoter Score (NPS), the KPI that measures the cus-
tomer’s satisfaction and that is transversal to the whole company. Keeping those KPI’s in mind,
internal goals were established monthly and will be further explained below.
3.3.1 Speed of Sending (SoS)
The Speed of Sending (SoS) is a Key Performance Indicators (KPI) that measures the time
elapsed since an order is forwarded to the boutique until the courier collects the package. Taking
into consideration the ordering process, there are two types of SoS: Speed of Sending Gross and
Speed of Sending Net. The Gross SoS represents the total time, counting from the moment an
order is placed by the customer, until the time the order is collected by the courier’s company,
as equation 3.1 shows. It takes into consideration all the time spent during the first 5 steps of
the ordering process, even the ones that are not controlled by boutiques. Moreover, it does not
take in consideration weekends and holidays. Considering that boutiques, generally, only work
from Monday to Saturday and courier companies just until Friday, this metric becomes an unfair
performance indicator.
Gross SoS = Scan Courier Date − Order Creation Date (3.1)
Consequently, the company developed the Net SoS KPI, represented on equation 3.2, that
excludes from Gross SoS the time spent on actions that boutiques do not control, i.e payment
verification (step 2) , AWB details confirmation (step4), weekends, holidays and occasions where
the order may be held by external boutiques factors.
Net SoS = [Time spent on 1 + Time Spent on step3 + Time Spent on step5]
(3.2)
−[Time Spent on Weekends + Time Spent on Holidays + Time Spent on Hold]
Therefore, Net SoS KPI is the most accurate way to measure the boutique’s performance. Inter-
nally, it is represented as a percentage (%) of the orders shipped in less than two days, constituting
the Service Level Agreement Speed of Sending Net (SLA SoS), as seen on next equation 3.3.
Total Number o f Orders with SoS < 2
SLA SoS = (3.3)
Total Number o f Sent Orders
Besides preserving the excellence standards of the company, a good SLA is also a competitiveProblem Description 18
advantage against other boutiques. Accounting that the same item may exist in more than one
boutique, the company defines rules that prioritize which item will appear first on website.
3.3.2 No Stock
Another metric related to partner’s performance is the No Stock (NS). It represents the per-
centage of items canceled by boutiques due to a lack of stock on a total of items sold by the month.
This metric has a big negative impact on customer experience, meaning a lot of times a lost sale.
For this reason, the company is highly demanding on this KPI.
Like SoS, there are also Gross No Stock and Net No stock. No Stock Gross is calculated based
on all items canceled and the alternative suggestions accepted by the customer when the boutique
declares no stock and suggests an item. On the other hand, Net No Stock is calculated only on
items canceled. For instance, if one boutique sold 100 items, with 3 of them canceled by a no
stock reason and 2 alternative suggestions were accepted by the customer: Gross NS=5% and Net
NS = 3%. The calculations are shown below on equations 3.4 and 3.5.
Number o f canceled items + Alternative Suggestions Accepted 2 + 3
Gross NS = = = 5%
Total Number o f Sent Orders 100
(3.4)
Number o f canceled items 3
Net NS = = = 3% (3.5)
Total Number o f Sent Orders 100
3.3.3 Net Promoter Score (NPS)
Once the order is delivered, the customer receives a short quiz about the purchased item and
the service provided.
This quiz consists of five questions where the customer can evaluate his/her experience. There
are three questions directly related to the service provider, classifying the service provided by the
boutique, order packaging and the speed of the delivery, each being evaluated up to 5 points.
The remaining questions are related to the customer feedback about the company and the bou-
tique that provided the service. In contrast with the previous ones, the customer must classify the
answer up to 10 points. The answers are scored in three groups: Detractor (0-6 points), Passive
(7-8 points), Promoter (9-10 points), assuming that detractors will not purchase again and promot-
ers will recommend Farfetch. NPS measures the difference between the number of promoters and
detractors, as expressed on equation 3.6.
Number o f promoters − Number o f Detractors
NPS = (3.6)
Total Number o f Quiz Answered3.3 Key Performance Indicator (KPI’s) 19
3.3.4 Service 3.0
As competition gets fierce and customers even more demanding, the company needs to ensure
that standard services are scalable and maintained.
Service 3.0 is an incentives and penalties operational excellence program designed for achiev-
ing higher service levels and taking customer service to the next level. Besides, it aims to speed up
the ordering process, forcing boutiques to improve their performance and processes. As a result,
the service considers the SoS, NS, wrong item rule and returns of each boutique, monthly.
Incentives and penalties are managed as a result of the boutique’s KPI’s performances. The
ranges of incentive defined by the company, according to the KPI, can be seen in 3.1 and 3.2,
respectively.
Table 3.1: Rules of SoS according to Service 3.0
Net SoS = 4,5 fetch.
Neutral 12 [days] porting the shipping cost of that order
to the customer.
a On post-purchase survey customer rates the packaging and boutique must achieve the higher classification.(0/5)
Table 3.2: Rules of NS according to Service 3.0
Farfetch waives the monthly Free Re-
turn Fee [1 % of the total sales of
No StockProblem Description 20
3.3.5 Exceptions
Exceptions are a set of options available on STORM that are not only are used for boutiques
to report unexpected situations that occur during the ordering process, but also to avoid penalties
on the speed of sending. Currently, 3% of the total number of orders have at least one exception.
Consequently, operations teams are pressured to work fast to solve them, to minimize the impact
on the customer’s experience.
To cover all unexpected situations, there are 13 exceptions distributed for the 3 steps controlled
by partners. The description of each exception and respective steps are presented on table 3.3,
placed in the end of the present sub-chapter.
The general exceptions’ process flow is represented in figure 3.6.
Figure 3.6: Exceptions Process Flow
Since the order is placed on STORM and according to each the situation, the boutique must
create an exception. This exception represents a doubt or a potential issue that will be later solved
by the respective responsible team: Partner Service, Customer Service or Delivery. After this, the
order is ready to be pushed one step forward to step 6, where it is collected by the courier company.
As the Net SoS KPI does not consider the time spent on problem resolution, the Supply Team
must recalculate it, discounting the time spent on solving it, changing the range of the perfor-
mance of each order, according to Service 3.0 rules. However, not all cases are meaningful and
trustworthy. Therefore, each order must be analyzed by the Supply Team, who has the hard and
ambiguous task to validate each created exception and to assign the root cause of the problem to
the company or respective boutique. Whenever the fault is held by the company, the time spent on
the exception resolution that prevents boutiques to move the order flow forward is calculated by
a Supply Chain team member, demanding the SoS recalculation. Aftewards, the right range must
be assigned, according to service 3.0 : positive, negative, or neutral, as shown on figure 3.7.
Figure 3.7: SALES Exception Management
Despite changing the range, the boutique SLA SoS is never changed by the exception decision.3.3 Key Performance Indicator (KPI’s) 21
Table 3.3: Exceptions’ Description
Exception Description Steps
It should be used whenever boutiques receive a new order that contains Step1
Double Order (DO) exactly the same items as a previously placed one, in some minutes
time. Step3
It enables boutiques to suggest an alternative item in case of no stock,
thus avoiding the cancellation for no stock. However, the algorithm
Suggest an Alternative
always looks first for the required item in another boutique before sug- Step1
(SA)
gesting an alternative to the customer. The difference between the sug-
gested item and the selected one should be cover by the boutique.
Boutiques should use wrong item exception whenever the photo or de- Step1
Wrong Item (WI) scription does not match with the item ordered. Consequently, bou-
tiques can offer a discount or suggest an alternative to the customer. Step3
Step1
Boutiques should use this exception whenever the tagged price is not
Wrong price (WP)
right or in case of any doubt about the taxes and duties applied.
Step3
Boutiques should create this exception if the ordered item has a small
defect, it is missing the tag, there is a small damage on the box or any Step1
Discount for imperfect
other possible defect. In this case, it is required a detailed description
item (DII)
of the defect and a photo that proves the reliability of the item and the Step3
discount to offer.
Boutiques should use this exception whenever the item is not up to lux-
Step1
ury standards. Consequently, it has to provide an estimated time to ship
Faulty item (FI)
the new item or suggest an alternative if the customer rejects the ship-
Step3
ping delay.
There are some items that don’t fit the true to tagged size (for example,
a specific brand might consider a medium size what the majority of the Step1
Size recommendation
other brands consider that same size a small). For this reason, boutiques
(SR)
should report the situation alerting and advising the customer to a better Step3
matching size.
Wrong size and size recommendation don’t report the same issue.
Wrong size should be used every time the ordered item size scale is Step1
Wrong Size (WS) different from the one used by the boutique.For example, a 34 size in
Europe corresponds to a 6 Size in the UK, although boutiques may not Step3
be aware of this conversation scale.
Product Packaging issue
It must be created every time boutiques ran out of packaging materials. Step3
(PPI)
Impossibility to decide This exception should be used to report STORM problems during the
Step3
packaging (IDP) validation of step 3, preventing the selection of proper packaging.
This exception should be used to report STORM problems during Step
Impossibility to print
5, in cases that boutiques have to wait for paperwork or if invoice infor- Step5
Documents (IPD)
mation is eligible.
Boutiques should report this situation when the order was already
Order Already Picked up picked up, but it still appears on STORM. However, they should wait
Step5
(OAP) until the next day in case of possible scan delay synchronization on the
courier’s side. Otherwise, it should be reported.
Boutiques must report whenever the courier does not collect the order
on the expected date. For this, boutiques should be aware of their col-
lecting system, having two possibilities: manual or daily. The differ-
Courier Failed Pick up -
ence between the two is that a daily pick up happens everyday, while a
DHL/UPS Failed Pick up Step5
manual pick up must be scheduled for at least one day after the order is
(CFP)
received. This means that, in a manual collecting system, the boutique
must always be aware of the expected collecting date before reporting
the exception.You can also read