State of the Climate in Latin America and the Caribbean 2020 - WMO-No. 1272
←
→
Page content transcription
If your browser does not render page correctly, please read the page content below
State of the Climate
                        in Latin America
                        and the Caribbean
                        2020
WEATHER CLIMATE WATER

                                               WMO-No. 1272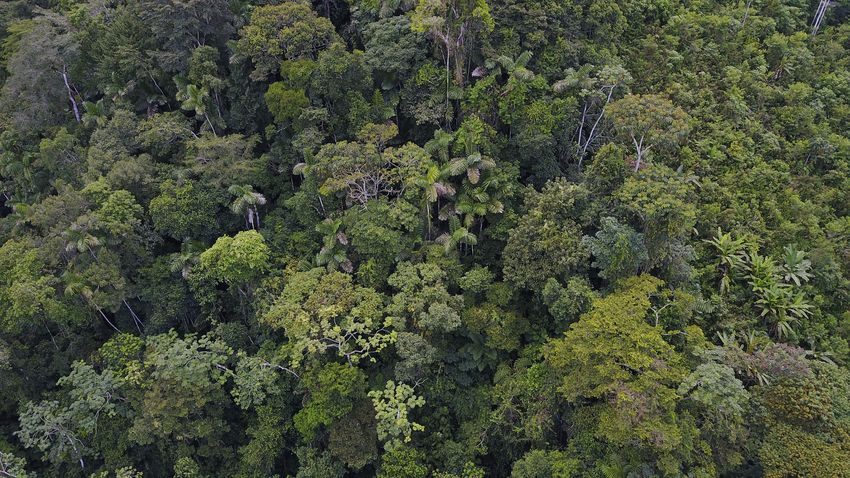
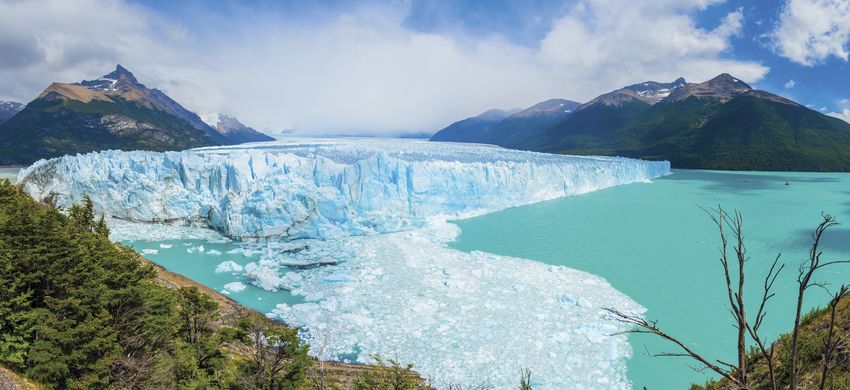
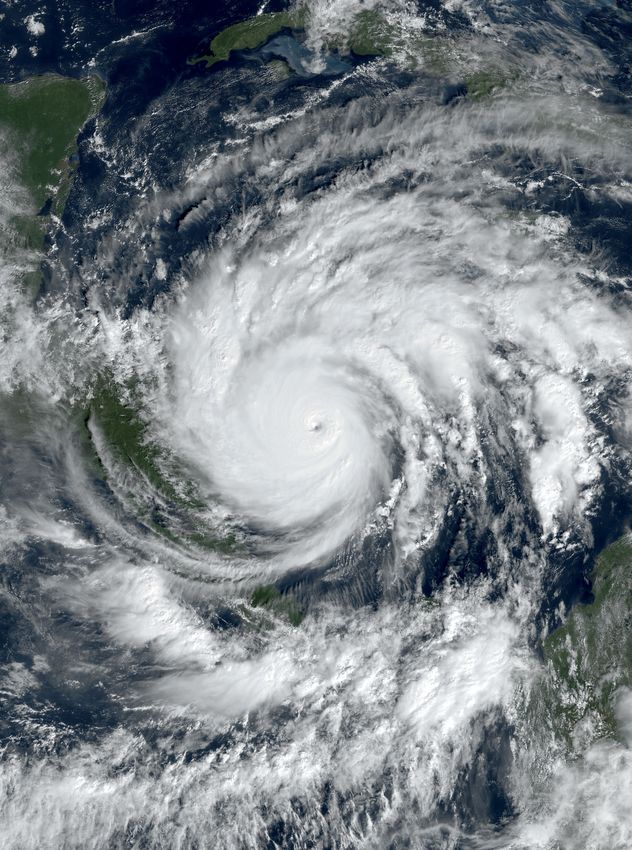
WMO-No. 1272
© World Meteorological Organization, 2021

The right of publication in print, electronic and any other form and in any language is reserved by WMO.
Short extracts from WMO publications may be reproduced without authorization, provided that the complete source
is clearly indicated. Editorial correspondence and requests to publish, reproduce or translate this publication in
part or in whole should be addressed to:

Chair, Publications Board
World Meteorological Organization (WMO)
7 bis, avenue de la Paix                                              Tel.: +41 (0) 22 730 84 03
P.O. Box 2300                                                         Fax: +41 (0) 22 730 81 17
CH-1211 Geneva 2, Switzerland                                         Email: publications@wmo.int

ISBN 978-92-63-11272-9

Cover illustration: Mangroves in Los Haitises National Park (Dominican Republic): Anton Bielousov; Wildfires Brazil: Christian Braga;
Hurricane Iota: NOAA; Perito Moreno Glacier in Argentina: AdobeStock (264550963)

NOTE

The designations employed in WMO publications and the presentation of material in this publication do not imply the expression of any opinion
whatsoever on the part of WMO concerning the legal status of any country, territory, city or area, or of its authorities, or concerning the delimitation
of its frontiers or boundaries.

The mention of specific companies or products does not imply that they are endorsed or recommended by WMO in preference to others of a similar
nature which are not mentioned or advertised.

The findings, interpretations and conclusions expressed in WMO publications with named authors are those of the authors alone and do not necessarily
reflect those of WMO or its Members.

 B
Contents
Key Messages .  .  .  .  .  .  .  .  .  .  .  .  .  .  .  .  .  .  .  .  .  .  .  .  .  .  .  .  .  .  .  .  .  .  .  .  .  .  .  .  .  .  . 2

Foreword .  .  .  .  .  .  .  .  .  .  .  .  .  .  .  .  .  .  .  .  .  .  .  .  .  .  .  .  .  .  .  .  .  .  .  .  .  .  .  .  .  .  .  .  .  .3

Overview .  .  .  .  .  .  .  .  .  .  .  .  .  .  .  .  .  .  .  .  .  .  .  .  .  .  .  .  .  .  .  .  .  .  .  .  .  .  .  .  .  .  .  .  .  .4

Global Climate Context in 2020  .  .  .  .  .  .  .  .  .  .  .  .  .  .  .  .  .  .  .  .  .  .  .  .  .  .  .  .  .  .  .  .  . 5
    Temperature  .  .  .  .  .  .  .  .  .  .  .  .  .  .  .  .  .  .  .  .  .  .  .  .  .  .  .  .  .  .  .  .  .  .  .  .  .  .  .  .  .  . 5
    Greenhouse gas concentrations .  .  .  .  .  .  .  .  .  .  .  .  .  .  .  .  .  .  .  .  .  .  .  .  .  .  .  .  .  .  .  .5

Latin America and the Caribbean  .  .  .  .  .  .  .  .  .  .  .  .  .  .  .  .  .  .  .  .  .  .  .  .  .  .  .  .  .  .  .  . 6
    Temperature  .  .  .  .  .  .  .  .  .  .  .  .  .  .  .  .  .  .  .  .  .  .  .  .  .  .  .  .  .  .  .  .  .  .  .  .  .  .  .  .  .  . 6
    Precipitation .  .  .  .  .  .  .  .  .  .  .  .  .  .  .  .  .  .  .  .  .  .  .  .  .  .  .  .  .  .  .  .  .  .  .  .  .  .  .  .  .  .  .8
    Glaciers  .  .  .  .  .  .  .  .  .  .  .  .  .  .  .  .  .  .  .  .  .  .  .  .  .  .  .  .  .  .  .  .  .  .  .  .  .  .  .  .  .  .  .  . 10
    Ocean  .  .  .  .  .  .  .  .  .  .  .  .  .  .  .  .  .  .  .  .  .  .  .  .  .  .  .  .  .  .  .  .  .  .  .  .  .  .  .  .  .  .  .  .  .  11
    Key climate drivers .  .  .  .  .  .  .  .  .  .  .  .  .  .  .  .  .  .  .  .  .  .  .  .  .  .  .  .  .  .  .  .  .  .  .  .  .  . 14

Extreme events  .  .  .  .  .  .  .  .  .  .  .  .  .  .  .  .  .  .  .  .  .  .  .  .  .  .  .  .  .  .  .  .  .  .  .  .  .  .  .  .  . 15
    Tropical cyclones .  .  .  .  .  .  .  .  .  .  .  .  .  .  .  .  .  .  .  .  .  .  .  .  .  .  .  .  .  .  .  .  .  .  .  .  .  .  . 15
    Drought  .  .  .  .  .  .  .  .  .  .  .  .  .  .  .  .  .  .  .  .  .  .  .  .  .  .  .  .  .  .  .  .  .  .  .  .  .  .  .  .  .  .  .  . 15
    Heatwaves and wildfires .  .  .  .  .  .  .  .  .  .  .  .  .  .  .  .  .  .  .  .  .  .  .  .  .  .  .  .  .  .  .  .  .  .  . 18
    Cold waves .  .  .  .  .  .  .  .  .  .  .  .  .  .  .  .  .  .  .  .  .  .  .  .  .  .  .  .  .  .  .  .  .  .  .  .  .  .  .  .  .  . 20
    Heavy precipitation and associated flooding  .  .  .  .  .  .  .  .  .  .  .  .  .  .  .  .  .  .  .  .  .  .  . 20

Climate-related Impacts and Risks  .  .  .  .  .  .  .  .  .  .  .  .  .  .  .  .  .  .  .  .  .  .  .  .  .  .  .  .  .  . 21
    Impacts on sectors .  .  .  .  .  .  .  .  .  .  .  .  .  .  .  .  .  .  .  .  .  .  .  .  .  .  .  .  .  .  .  .  .  .  .  .  .  . 21
    Impacts on agriculture and water resources .  .  .  .  .  .  .  .  .  .  .  .  .  .  .  .  .  .  .  .  .  .  .  . 21
    Impacts on forest and ecosystem services .  .  .  .  .  .  .  .  .  .  .  .  .  .  .  .  .  .  .  .  .  .  .  .  . 22
    Impacts on socioeconomic development, infrastructure and displacement  .  .  .  .  .  . 23
    Impacts on low-lying zones and small islands .  .  .  .  .  .  .  .  .  .  .  .  .  .  .  .  .  .  .  .  .  .  . 25
    Ocean acidification and impacts on coral reefs .  .  .  .  .  .  .  .  .  .  .  .  .  .  .  .  .  .  .  .  .  . 25
    Risks associated with extreme events  .  .  .  .  .  .  .  .  .  .  .  .  .  .  .  .  .  .  .  .  .  .  .  .  .  .  . 26

Enhancing climate resilience and adaptation policies .  .  .  .  .  .  .  .  .  .  .  .  .  .  .  .  .  .  .  . 29
    Ecosystem-based adaptation  .  .  .  .  .  .  .  .  .  .  .  .  .  .  .  .  .  .  .  .  .  .  .  .  .  .  .  .  .  .  .  . 29
    Improving multi-hazard risk-information systems and climate services .  .  .  .  .  .  .  .  . 29

Further reading  .  .  .  .  .  .  .  .  .  .  .  .  .  .  .  .  .  .  .  .  .  .  .  .  .  .  .  .  .  .  .  .  .  .  .  .  .  .  .  .  . 31

List of contributors  .  .  .  .  .  .  .  .  .  .  .  .  .  .  .  .  .  .  .  .  .  .  .  .  .  .  .  .  .  .  .  .  .  .  .  .  .  .  . 32

                                                                                                                                                       1
Key Messages
    The year 2020 was one of the three warmest        Hurricanes Eta and Iota reached category
    years on record for Mexico/Central America        4 intensity and made landfall in the same
    and the Caribbean, and the second warmest         region in quick succession; they followed
    year for South America. Temperatures were         identical paths across Nicaragua and
    1.0 °C, 0.8 °C and 0.6 °C above the 1981–2010     Honduras, affecting the same areas and
    average, respectively.                            exacerbating related impacts.

    In the Chilean and Argentine Andes, glaciers      Marine life, coastal ecosystems and the
    have been retreating during the last decades.     human communities that depend on them,
    Ice mass loss has accelerated since 2010,         particularly in Small Island Developing
    in line with an increase in seasonal and annual   States, are facing increasing threats from
    temperatures and a significant reduction          ocean acidification, sea-level rise, warming
    in annual precipitation in the region.            oceans, and more intense and frequent
                                                      tropical storms.
    The intense drought in southern Amazonia
    and the Pantanal was the worst in the past        Adaptation measures, par ticularly
    60 years, and 2020 surpassed 2019 to become       multi-hazard early warning systems, are
    the most active fire year in the southern         underdeveloped in the Latin America and the
    Amazon.                                           Caribbean region. Support from governments
                                                      and the science and technology community
    Widespread drought across the Latin               is critical to strengthening their development,
    America and the Caribbean region has had          as well as to improving data collection and
    significant impact on inland shipping routes,     storage and firmly integrating disaster risk
    crop yields and food production, leading to       information into development planning.
    worsening food insecurity in many areas.          Strong financial support is fundamental
    Precipitation deficits are particularly adverse   to achieving this outcome.
    in the Caribbean region, which presents high
    vulnerability to drought and has several of
    its territories on the global list of the most
    water-stressed countries, with less than
    1 000 m3 freshwater resources per capita.

2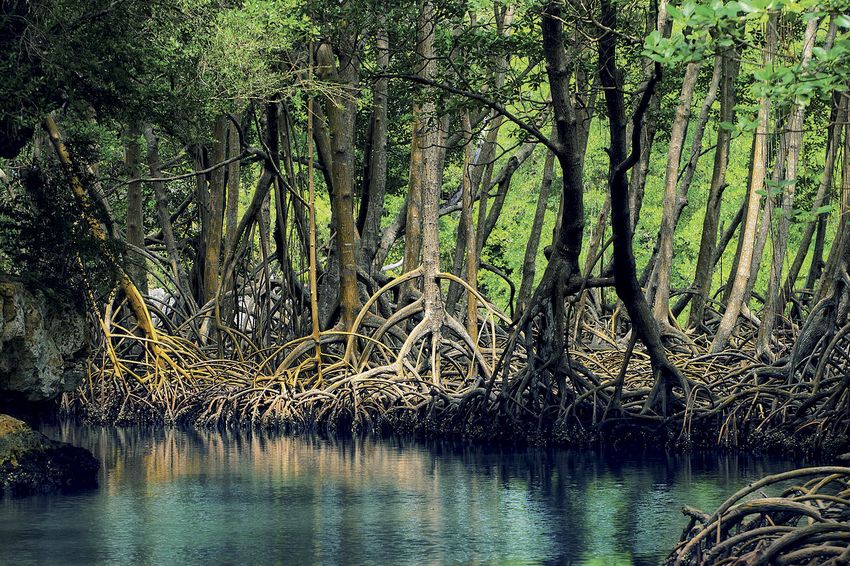
Foreword

The State of the Climate (SoC) in Latin America      report, which primarily affected the region
and the Caribbean (LAC) report for 2020 is the       in 2020, with impacts to most vulnerable
first report of its kind to be released, under the   communities, among which are the Small
auspices of the WMO Regional Association of          Islands Development Countries.
South America and the Regional Association
of North America Central America and the             Based on the existing research and studies
Caribbean. It focuses on a set of up-to-date         provided by various institutions in the re-
key climate indicators, climate trends, and          gion, the report made also an emphasis on
extreme weather and climate events which             enhancing climate resilience through iden-
were recorded in 2020. The report aims at            tified pathways, such as ecosystem-based
providing science-based knowledge that can           responses and enhancing climate services
contribute to informing decision making in           and multi-hazard early warning among other
climate change mitigation and adaptation.            areas of improvement.

Increasing temperatures, glaciers retreat,           I take this opportunity to congratulate all
sea level rise, ocean acidification, coral reefs     individuals and institutions who contributed
bleaching, land and marine heatwaves, in-            to this report and thank sister United Nations
tense tropical cyclones, floods, droughts,           agencies for joining efforts and delivering
and wildfires have been highlighted in this          this highly informative report.

                                                                      (P. Taalas)
                                                                  Secretary-General

                                                                                                      3
Overview
State of the Climate in Latin America and reference period. National and international
the Caribbean 2020 represents the first institutions provided additional information
multi-a gency ef for t involving National and data. In some cases, auxiliary informa-
Meteorological and Hydrological Services tion was obtained from local and national
(NMHSs), WMO Regional Climate Centres news from newspapers, websites and social
(RCCs), research institutions, and international networks.
and regional organizations. A multidiscipli-
nary group of 40 experts developed and High-impact events affecting the region in
reviewed this report through an interactive 2020 were associated with loss of or damage
process coordinated by the WMO Offices to vital infrastructures of communities and
for Regional Association III and Regional populations. Notable impacts included water
Association IV. and energy-related shortages, displacement,
and compromised population safety, health
This report provides a snapshot of climate and livelihoods. Towards the end of 2020,
trends, variability, observed high-impact intense rainfall events brought landslides,
weather and climate events, and associated floods and flash floods to rural and urban areas
risks and impacts in key sensitive sectors for in Central and South America. A weak North
the period January–December 2020. It is the American monsoon and colder-than-normal
result of a collaboration among countries, pre- sea-surface temperatures along the eastern
senting information from various independent Pacific associated with La Niña resulted in
sources to assess weather, hydrology and drought in Mexico. The devastation that
climate conditions in the region. It includes resulted from Hurricanes Eta and Iota in
transboundary analyses, including of the Guatemala, Honduras, Nicaragua and Costa
drought in the South American Pantanal and Rica, and the intense drought and unusual
of the intense hurricane season in Central fire season in the Pantanal region of Brazil,
America and the Caribbean and associated the Plurinational State of Bolivia, Paraguay
impacts. In addition, the report identifies and Argentina, demonstrate the critical need
areas for improvement in the management for operational and scientific collaboration,
of hydrometeorological risks and data, and and for continuous data exchange, in order
knowledge gaps. to better characterize those phenomena and
their impacts. These impacts were exacer-
The findings presented in this report are based bated by the COVID-19 outbreak. From the
on a standard methodology for assessing various analyses provided in this report, it is
the physical aspects of the climate system, evident that urgent efforts should be pursued
drawing on data from 1 700 meteorological to enhance resilience through appropriate
stations in Mexico, Central America and the prevention and risk-management measures.
Caribbean, and from gridded data for South These include strengthening multi-hazard
America. The data were compiled through early warning systems (MHEWSs), through
a joint effort by WMO RCCs. Anomalies and enhanced synergy among various stakehold-
percentages were derived for air temperature ers at the national and international levels,
and rainfall data relative to the 1981–2010 to save lives and protect property.
4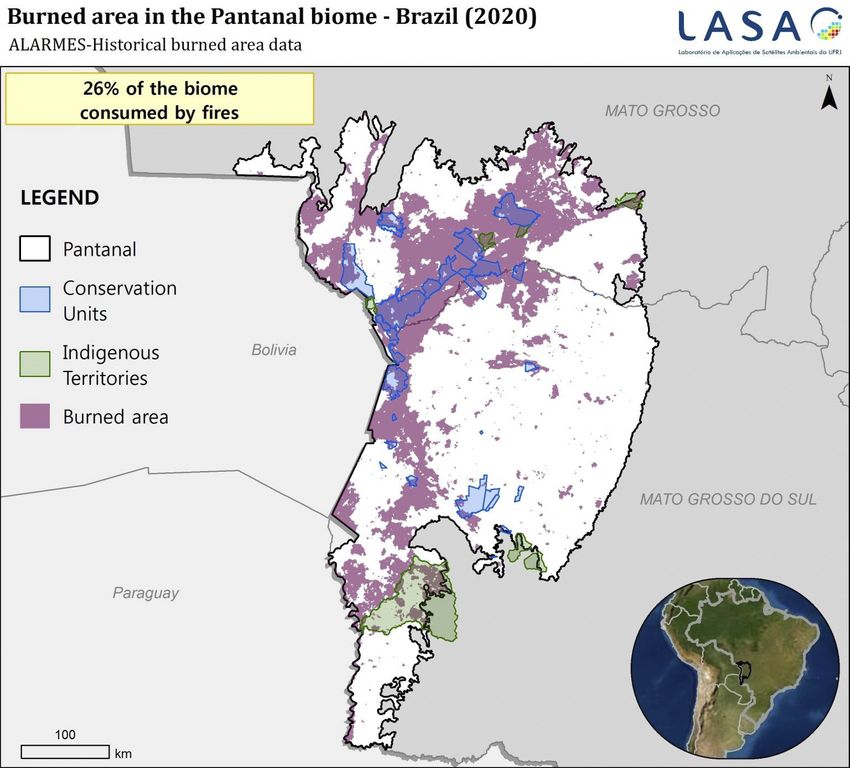
Global Climate Context in 2020
TEMPERATURE
HadCRUT analysis
The global mean temperature in 2020 was one 1.2 NOAAGlobalTemp
of the three warmest since the observation 1.0 GISTEMP
ERA5
period. The past six years, including 2020, 0.8 JRA-55
have been the six warmest years on record 0.6
(Figure 1). Rising temperatures contribute to
°C
0.4
ocean thermal expansion, the increased melt-
ing of ice sheets in Greenland and Antarctica, 0.2
mountain glacier melt and changes in ocean 0.0
circulation, which in turn contribute to rising –0.2
global mean sea level. Such changes in these
1850 1875 1900 1925 1950 1975 2000 2025
and other climate indicators are largely driven Year © Crown Copyright. Source: Met Office
by accumulating greenhouse gases in the
atmosphere.
Figure 1. Global annual
in response to COVID-191,2,3,4, the resulting
mean temperature
likely slight decrease in the annual growth difference from
rate of carbon dioxide (CO2) concentration pre-industrial conditions
GREENHOUSE GAS (1850–1900) for five
CONCENTRATIONS in the atmosphere will be practically indis- global temperature
tinguishable from the natural interannual data sets. For further
Globally, atmospheric concentrations of variability driven largely by the terrestrial explanation and details
of the data sets, see
greenhouse gases reflect a balance between biosphere. Real-time data from specific lo-
WMO, State of the
emissions (from both human activities and cations, including Mauna Loa (Hawaii) and
Global Climate 2020
natural sources) and sinks in the biosphere Cape Grim (Tasmania), indicate that levels of (WMO-No. 1264).
and ocean. Despite a temporary reduction in CO2, methane (CH4) and nitrous oxide (N2O) Source: Met Office,
emissions in 2020 related to measures taken continued to increase in 2020 (Figure 2). United Kingdom
420 1900 335
Figure 2. Top row:
410
1850
330 Globally averaged
400 mole fraction (measure
N2O mole fraction (ppb)
325
CO2 mole fraction (ppm)
CH4 mole fraction (ppb)
1800
390 of concentration),
320
380 1750 from 1984 to 2019,
370
315
of CO 2 in parts per
1700
310 million (left), CH 4 in
360
1650
305
parts per billion (centre)
350
and N 2 O in parts per
1600 300
340
1985 1990 1995 2000 2005 2010 2015 2020 1985 1990 1995 2000 2005 2010 2015 2020 1985 1990 1995 2000 2005 2010 2015 2020 billion (right). The red
Year Year Year
line is the monthly mean
4.0 20 2.0
mole fraction with the
seasonal variations
15
3.0 1.5 removed; the blue
N2O growth rate (ppb/yr)
CO2 growth rate (ppm/yr)
CH4 growth rate (ppb/yr)
10
dots and line show
2.0 1.0 the monthly averages.
5 Bottom row: The growth
rates representing
1.0 0.5
0 increases in successive
annual means of mole
0.0
0.0
1985 1990 1995 2000 2005 2010 2015 2020
–5
1985 1990 1995 2000 2005 2010 2015 2020 1985 1990 1995 2000 2005 2010 2015 2020 fractions are shown
Year Year Year
as grey columns for
CO 2 in parts per million
1
Liu, Z. et al., 2020: Near-real-time monitoring of global CO 2 emissions reveals the effects of the COVID-19 pandemic. per year (left), CH 4 in
Nature Communications, 11(1): 5172, https://doi.org/10.1038/s41467-020-18922-7. parts per billion per
2
Le Quéré, C. et al., 2020: Temporary reduction in daily global CO 2 emissions during the COVID-19 forced confinement. year (centre) and N 2 O in
Nature Climate Change, 10: 647–653, https://www.nature.com/articles/s41558-020-0797-x. parts per billion per year
(right).
3
Friedlingstein, P. et al., 2020: Global Carbon Budget 2020. Earth System Science Data, 12(4): 3269–3340, https://doi.
org/10.5194/essd-12-3269-2020. Source: WMO Global
Atmosphere Watch
4
Global Carbon Project, 2020: An annual update of the global carbon budget and trends, https://www.
globalcarbonproject.org/carbonbudget.
5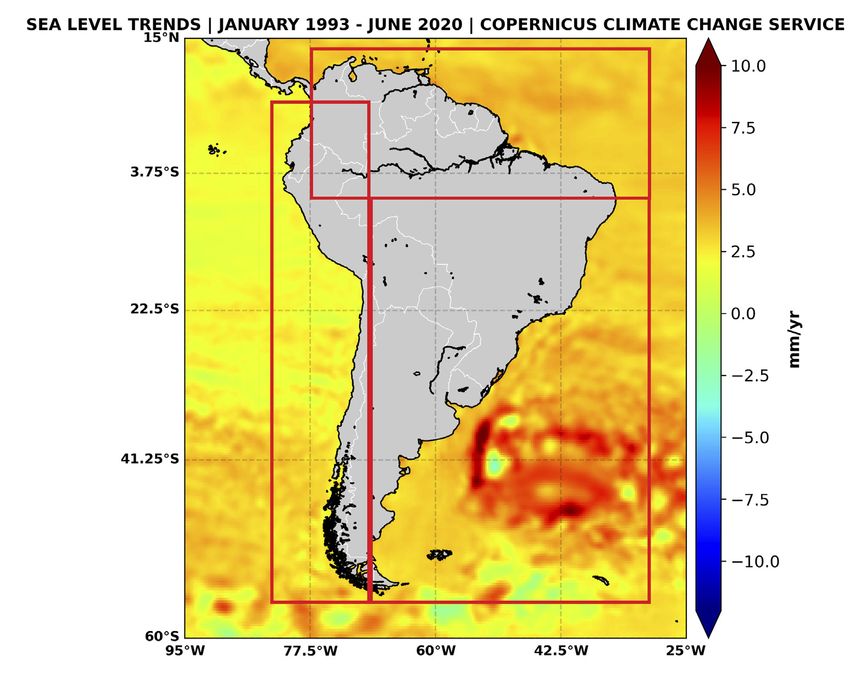
Latin America and the Caribbean
TEMPERATURE southern half of the Lesser Antilles (Caribbean
Climate Outlook Forum). Throughout 2020,
The year 2020 was one of the three warmest monthly mean temperatures were also higher
years on record for the Caribbean and Mexico/ than normal in nearly all of the Caribbean
Central America, with a mean temperature region. In addition, most of Mexico and
anomaly of +0.8 °C and +1.0 °C, respectively, Central America had above-normal mean
compared with the average temperature for temperatures for the year.
the 1981–2010 period. For South America,
2020 was the second warmest year on re- Below-normal temperatures were recorded in
cord after 2016, with +0.6 °C compared with parts of Central America, in southern Belize,
Figure 3. Time series of 1981–2010 (Figure 3). eastern Costa Rica, southern El Salvador
annual mean regional air
and north-eastern Nicaragua, as well as in
temperature anomalies
from 1961 to 2020.
In nearly all the Caribbean islands, tempera- Mexico, mainly in the west.
Anomalies are relative to tures were warmer than average, especially
the 1981–2010 average. the Bahamas, Belize, the Cayman Islands,
Source: HadCRUT Cuba, French Guiana, Jamaica, Puerto Rico, REGIONAL TEMPERATURE ANOMALIES
version 4. the United States Virgin Islands and the
Caribbean
For Aruba, Dominica and locations in four
other island countries, 2020 was the warmest
year on record. Moreover, a high number of
hot days (i.e. days with a maximum temper-
ature exceeding the 90th percentile across
the 1985–2014 period) were recorded in three
island countries/territories. In 2020, mean
temperatures in Grenada, Saint Kitts and
Nevis, and locations in Guyana, Jamaica,
Martinique, Puerto Rico and Saint Lucia were
their highest on record.
In 2020, several monthly heat records
were broken in the Caribbean. Dominica,
Grenada and Puerto Rico broke their national/
territorial all-time high temperature records
in September. The historical highest monthly
mean maximum temperature was also ob-
served in September, in Aruba, Saint Lucia
and at least one location in Martinique.
On 9 April 2020, Guáimaro, Cuba, registered
39.2 °C (the previous record was 38.0 °C on
17 April 1999). In Belize, the highest daily
maximum temperature was recorded at the
Punta Gorda station, with a value of 35.6 °C
on 4 January 2020, and the Tower Hill station
recorded the highest monthly mean maximum
temperature of 30.7 °C.
Mexico and Central America
The warmest daily mean temperatures on
record were exceeded in most of Belize,
Guatemala and Cuba, as well as in some
places in Mexico.
6
Several locations in Honduras and Mexico        and 1.0 °C warmer than the 1981–2010 av-
surpassed the previous record for daily         erage, particularly in the northern region
maximum temperatures. In Santa Rosa de          (Dirección de Meteorología e Hidrología
Copán, Honduras, a new record of 39.6 °C        (DMH)) (see Figure 4c).
(compared with the previous 36.2 °C) was
set. In Oaxaca, Mexico, a new record of 44 °C
                                                a)                                           Figure 4. Air temperature
(compared with the previous 40 °C) was
                                                                                             (2 m) anomalies for 2020
established.                                                                                 (relative to 1981–2010)
                                                                                             for (a) the Caribbean;
In Mexico, the previous record for the cold-                                                 (b) Mexico/Central
est daily mean temperature was broken                                                        America; and (c) South
on 19 January, with −16 °C in the town of                                                    America, in °C. The
La Rosilla (municipality of Guanaceví, state                                                 colour scale is shown
                                                                                             below the maps.
of Durango), the lowest that has ever been
                                                                                             Source: Data obtained
recorded by the National Water Commission
                                                                                             from NMHSs of the
(CONAGUA). New records for daily minimum                                                     Caribbean and the
temperatures were registered only in loca-                                                   Central and South
tions across Mexico, such as in Tamaulipas,                                                  American countries and
Sinaloa and Chihuahua. Many other locations                                                  plotted by Dr. Teddy
in Mexico broke previous cold temperature                                                    Allen (CIMH).
records, including in Sonora where a tem-
perature of −9.5 °C broke the previous record
of −6 °C.                                       b)

South America

A major heatwave stretched across the
region in late September and early October,
and in November, covering much of central
South America, the Peruvian Amazon, the
Pantanal and the regions of west-central and
south-eastern Brazil. Cuiabá, Curitiba and
Belo Horizonte (Brazil); Asunción (Paraguay);
and Iñapari (Peru) were among the locations
which had their hottest day on record. Higher
temperatures and heatwaves in west-central,
southern and south-eastern Brazil contributed
to the development of wildfires. Moreover,
a number of cold waves were detected in         c)
south-eastern South America, with cooling
reaching western Amazonia in August 2020
(see Extreme events).

In Peru, the 2020 annual mean temperature
anomaly was 0.61 °C above the 1981–2010
mean, the third warmest annual value since
2000, after +0.79 °C in 2016 and +0.74 °C in
2015 (Servicio Nacional de Meteorología e
Hidrología (SENAMHI-Peru)). In Argentina,
the average annual temperature for 2020 was
0.63 °C warmer than the 1981–2010 reference
period, making 2020 the second warmest year
on record since 1961 (National Meteorological
Service (SMN)). In Paraguay, temperatures
were well above normal, between 0.5 °C

                                                                                                           7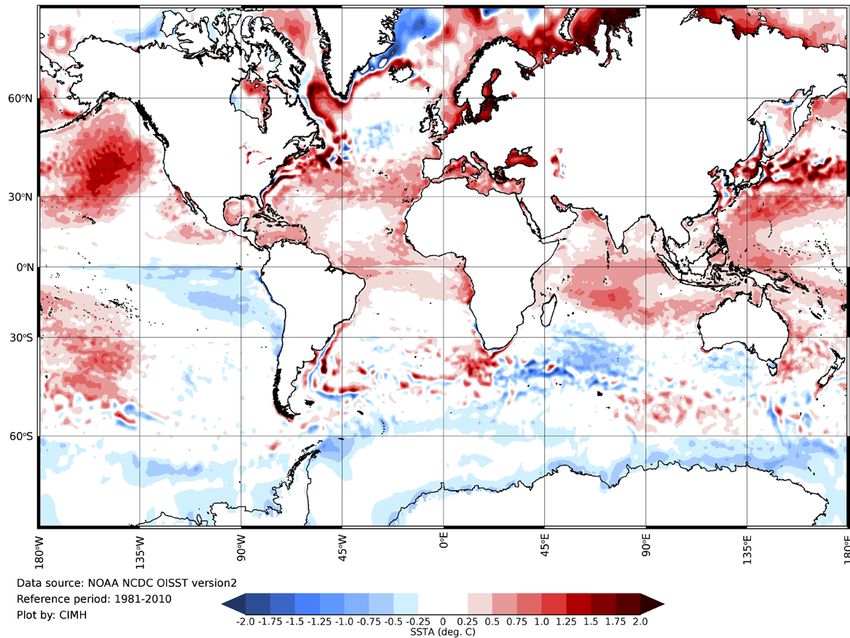
PRECIPITATION                                   Pacific coast of Central American countries,
                                                                         as well as in the Yucatán Peninsula and in
                         Cumulative precipitation in 2020 was variable   Jalisco, Mexico (Figure 5b).
                         across Mexico and Central America in relation
                         to the 1981–2010 average. Below-normal          Annual precipitation totals in 2020 were also
                         rainfall was recorded in Mexico, mainly in      below the long-term mean in most of tropical
                         the north-western region, and in parts of       South America, including the central Andes,
                         the Caribbean coast. Precipitation above        southern Chile, northern South America, the
                         the long-term average was observed in the       Amazon and the Pantanal, and south-east-
                                                                         ern South America. The exception was the
Figure 5. Rainfall
                         a)                                              semi-arid region of north-eastern Brazil,
anomalies for 2020                                                       where rainfall was above normal (Figure 5c).
(% with respect to the
                                                                         In Ecuador, rainfall deficits were detected in
1981–2010 reference
                                                                         the coastal region from July to December, due
period) in
(a) the Caribbean,                                                       to La Niña. The austral summer (December
(b) Mexico/Central                                                       to February) was characterized by weak
America and                                                              rainy seasons in the southern Amazon and
(c) South America. The                                                   Pantanal regions and southern Brazil. Rainfall
colour scale is shown                                                    above normal over the semi-arid region of
below the maps.                                                          north-eastern Brazil, from March to May,
Source: Data obtained                                                    ended a six-year drought. However, in the
from NMHSs of the
                                                                         second half of July, no significant rains were
Caribbean and the
Central and South
                                                                         recorded in much of Brazil, causing precipi-
American countries and                                                   tation deficits to increase again.
plotted by Dr. Teddy
Allen (CIMH).                                                            In central South America, precipitation totals
                         b)                                              were close to about 40% of normal values.
                                                                         The seasonal precipitation period from
                                                                         September 2019 to May 2020 was marked
                                                                         by a precipitation deficit that was most ac-
                                                                         centuated between January and March. In
                                                                         the central Andes, several extreme rainfall
                                                                         events occurred in February, while in northern
                                                                         Peru, a drought was reported during the
                                                                         austral summer (December to February).
                                                                         In Argentina, 2020 was a dry year, with an
                                                                         estimated national anomaly of −16.7% in
                                                                         relation to the 1981–2010 average, placing
                                                                         2020 as one of the driest years on record
                                                                         since 1961 and as the driest since 1995. For
                                                                         the north-eastern region of Argentina, 2020
                                                                         was the fifth driest year since 1961. The be-
                         c)                                              low-normal precipitation totals in Argentina
                                                                         were an extension of the same drought that
                                                                         affected the Pantanal region.

                                                                         REGIONAL PRECIPITATION ANALYSES

                                                                         Caribbean

                                                                         For most of the Caribbean region, below-nor-
                                                                         mal rainfall during the first months of 2020
                                                                         resulted in widespread drought conditions.
                                                                         In general, the start of the rain season (June–
                                                                         November) was delayed by extremely dry late
                                                                         spring rainfall anomalies (Figure 5a). However,

       8
an active latter part of the rain season, asso- South America
ciated with an abundance of tropical waves,
brought a cessation to the region-wide drought In most of South America, rainfall during the
conditions by October. An active hurricane first half of 2020 was below the 1981–2010
season in the Central America–Caribbean average, especially in the Caribbean and the
region led to intense rainfall events. Andean regions of Colombia. The channels
of the Magdalena River experienced reduced
Mexico and Central America flows and levels, affecting navigation between
January and March 2020, and 11 municipal-
The 12-month Standardized Precipitation Index ities declared a state of public calamity. In
(SPI)5,6, values generated by NMHSs in Mexico Chile, intense rainfall on 27–28 January in
and Central America indicate the persistence the Atacama region produced landslides
of below-normal rainfall conditions in many and floods.
places during 2020. Meteorological stations in
Central America that recorded below-normal In the first quarter of 2020, during the rainy
rainfall were located on the Caribbean coast of season, the coastal region of Ecuador expe-
Costa Rica and throughout Panama, Honduras, rienced an extraordinary current of dry air
Guatemala and Belize. In Costa Rica, rainfall from the Pacific Ocean, which led to a dry spell
deficit was reported in July and August 2020. of at least 20 consecutive days. This altered
the sowing and harvesting periods of crops
Above-normal precipitation was recorded in in the Costa and the Sierra. In February, the
2020 around the Pacific coasts of Costa Rica, current weakened and allowed the return of
Panama and Guatemala, as well as throughout moisture from the Amazon.
El Salvador, Colón (Panama) and north-western
Belize. Mexico, El Salvador, Costa Rica and In Peru, during the rainy season from
Panama registered very rainy and extremely September 2019 to May 2020, a rainfall
rainy conditions, as shown by their 6-month deficit accumulated between January and
SPI values >1.5. In Central America, these March, but several extreme rainfall events
maximum values were observed in El Salvador occurred in the central Andes in February.
(Ilopango, San Salvador), Costa Rica (Nicoya, During January and March 2020, the southern
Guanacaste) and Guatemala (Asunción Mita, coast of Peru reported very wet conditions
Jutiapa). Honduras experienced rainfall and on 22–24 January: 32.4 mm/day in Camaná
flooding during March, accounting for well (Arequipa), 16.4 mm/day in Jorge Basadre
over half the people affected by floods in the (Tacna), 17.3 mm/day in Copara (Ica) and
region during March 2020. 13.2 mm/day in Calana (Tacna).
In Mexico, persistently below-normal pre- Finally, above-normal rainfall over the semi-ar-
cipitation was recorded in the north-west id region of north-eastern Brazil in February
and in some other regions: some areas of and March ended a six-year drought. However,
Sonora and Chihuahua experienced annual the southern region of Brazil experienced
precipitation totals between 25% and 50% drought during most of the year, interrupted
below normal values. However, above-normal by intense short-term rainfall events. During
precipitation values were reported in the the austral summer of 2020 (December to
south-east and in Baja California (except in February), various episodes of intense rainfall
the north-east). The highest 6-month SPI were associated with extensive damage and
values were recorded in Muná (Yucatán) and fatalities in south-eastern Brazil, in the cities
Jacatepec (Oaxaca), both being the highest of Belo Horizonte, São Paulo, Espírito Santo
in their corresponding historical records. and Rio de Janeiro.
5
The SPI is a drought index proposed in 1993 by McKee et al. For more information about the index, see Standardized
Precipitation Index: User Guide (WMO-No. 1090).
6
McKee, T.B. et al., 1993: The relationship of drought frequency and duration to time scales. Proceedings of the Eighth
Conference on Applied Climatology, American Meteorological Society, 179–184.
9GLACIERS
Rising temperatures have significant impacts
on glaciers. Mountain glaciers represent
a measurable indicator of the spatial and
temporal patterns of global climate variability.
In the Andes, glaciers constitute important
sources of fresh water for water consumption,
power generation, agriculture and ecosystem
conservation. In this region, glacier moni-
toring programmes were established in the
1990s, and few glaciers have continuous
long-term series.7,8,9,10 Only the Echaurren
Norte glacier, in the central Andes of Chile,
has had continuous observations for more
than 40 years.11 The data series show gen-
eralized glacier mass loss across the region
over the past decades, but there are some
differences from one glacier to another which
can be explained by the feedback between the
regional climate and local glacier morphology
(Figure 6).
To achieve a better understanding of Andean
glacier evolution, the Cordillera is divided into
three zones:12 the tropics, the dry Andes and
the central Andes. In the tropics, glacier mass
balance has a negative trend of −0.71 metre
water equivalent (m.w.e.) per year during
the monitoring period (Figure 6a). Previous
studies have shown that tropical glaciers had
moved into a period of significant ice mass
7
Dussaillant, I. et al., 2020: Author correction: two
decades of glacier mass loss along the Andes.
Nature Geoscience, 13: 711, https://doi.org/10.1038/
s41561-020-0639-5.
8
Ferri L. et al., 2020: Ice mass loss in the central Andes of
Argentina between 2000 and 2018 derived from a new
glacier inventory and satellite stereo-imagery. Frontiers
in Earth Science, 8: 530997, https://www.frontiersin.org/
articles/10.3389/feart.2020.530997/full.
9
Falaschi D. et al., 2019: Six decades (1958–2018) of
geodetic glacier mass balance in Monte San Lorenzo,
Patagonian Andes. Frontiers in Earth Science, 7: 326,
https://doi.org/10.3389/feart.2019.00326.
10
Hugonnet, R. et al., 2021: Accelerated global glacier
mass loss in the early twenty-first century. Nature, 592:
726–731, https://doi.org/10.1038/s41586-021-03436-z.
11
Gärtner-Roer, I. et al., 2019: Worldwide assessment of
national glacier monitoring and future perspectives.
Figure 6. The cumulative mass balance of 20 monitored glaciers shows the evolution of the Mountain Research and Development, 39(2): A1–A11,
Andean ice masses in the three zones: (a) tropics (1992–2019), (b) dry Andes (2004–2019) https://doi.org/10.1659/MRD-JOURNAL-D-19-00021.1.
and (c) central Andes (1976–2019). The inset figures show the centred mass balance of the 12
Masiokas, M.H. et al., 2020: A review of the current
data series. The average centred balance is shown by the black line. state and recent changes of the Andean cryosphere.
Source: World Glacier Monitoring Service, 2020: Fluctuations of glaciers database http:// Frontiers in Earth Science, 8: 99, https://doi.org/10.3389/
dx.doi.org/10.5904/wgms-fog-2020-08, plotted by Dr. Rubén Basantes(IKIAM). FEART.2020.00099.
10loss since the late 1970s.13 This could be asso- data also show that the rate of rise is not
ciated, at least partly, with a decreasing trend geographically uniform, mostly as a result of Figure 7. Regional
in snow accumulation at high elevations.14 non-uniform ocean thermal expansion and sea-level trends around
regional salinity variations. South America from
Further south, in the Andes of Chile and January 1993 to June
Argentina, glaciers have been retreating for South America 2020 (based on satellite
several decades, with a differential rate of altimetry). The red
boxes indicate the
−0.72 m.w.e. a-1 for the 2004–2019 period in The regional sea-level trends around South
areas where the coastal
the dry Andes (Figure 6b) and −0.58 m.w.e. a-1 America are shown in Figure 7. The rates sea-level time series in
from 1976 to 2019 in the central Andes of sea-level change on the Atlantic side are Figure 8 are computed.
(Figure 6c). This loss of ice mass has been higher than on the Pacific side. Time series Source: Copernicus
increasing since 2010, in line with an increase reveal sea-level trends and variability from Climate Change Service
in temperatures and a significant reduction January 1993 to June 2020 in the Pacific, (C3S), https://climate.
in precipitation in the region.15 equatorial Atlantic and south Atlantic, based copernicus.eu/sea-level
To ensure that the signals from glaciers within
each region are comparable, mass balances
were calculated centred on the available
period. Thus, despite the different behaviour SEA LEVEL TRENDS. JANUARY 1993 - JUNE 2020.
of the glaciers, a common response to climate COPERNICUS CLIMATE CHANGE SERVICE
variability in the region can be distinguished.
OCEAN
SEA LEVEL
As concentrations of greenhouse gases rise,
excess energy accumulates in the Earth sys-
tem, of which approximately 90% is absorbed
by the ocean.
As its temperature rises and water warms, the
ocean expands. This thermal expansion, com-
bined with increased ice loss from glaciers
and ice sheets, contributes to sea-level rise.
Accurate sea-level projections over the next
decades are important for both decision-mak-
ing and the development of successful
adaptation strategies in coastal and low-lying
regions, including the Caribbean Sea.16
On average, since early 1993, the altime-
try-based global mean rate of sea-level rise
has amounted to 3.3 ± 0.3 mm/yr, as a result
of ocean warming and land ice melt. The
13
Rabatel, A. et al., 2013: Current state of glaciers in the tropical Andes: a multi-century perspective on glacier evolution
and climate change. The Cryosphere, 7: 81–102, https://doi.org/10.5194/tc-7-81-2013.
14
Masiokas et al., 2020: A review of the current state and recent changes of the Andean cryosphere.
15
Garreaud, R. et al., 2017: The 2010–2015 mega drought in central Chile: impacts on regional hydroclimate and vegetation.
Hydrology and Earth System Sciences - Discussions, https://doi.org/10.5194/hess-2017-191.
16
van Westen, R.M. et al., 2020: Ocean model resolution dependence of Caribbean sea-level projections. Scientific
Reports, 10: 14599, https://doi.org/10.1038/s41598-020-71563-0.
11a) b)
Figure 8. Altimetry-
based coastal sea-level c)
time series (m) from
January 1993 to June
2020 for (a) the Pacific
side of South America;
(b) the equatorial
Atlantic side; and
(c) the south Atlantic
side. Seasonal cycle
was removed; glacial
isostatic adjustment
correction was applied.
The orange line
represents the linear
trend.
Source: C3S
on gridded altimetry data averaged from mean (~3.6 mm/yr), while it is lower along
50 km offshore to the coast (Figure 8). The the Pacific coast (2.94 mm/yr).
coastal sea level on the Pacific side (Figure 8a)
displays important interannual variability Central America
driven by El Niño –Southern Oscillation
(ENSO). The curve shows temporary high The regional sea-level trends around Central
sea level (>10–15 cm) during the 1997–1998 America are shown in Figure 9. The map
and 2015–2016 El Niño events. Along the shows high rates of sea-level change in
Atlantic coast of South America, the rate of the Caribbean Sea and the Gulf of Mexico
sea-level rise is slightly higher than the global compared with the Pacific side.
Figure 9. Regional
sea-level trends around
Central America from
January 1993 to June
2020 (based on satellite
altimetry).
Source: C3S
12Figure 10 shows coastal sea-level time series a)
Figure 10. Altimetry-
from January 1993 to June 2020 for the Pacific based coastal sea-level
time series from January
and the Caribbean Sea/Gulf of
1993 to June 2020 for
(a) the Atlantic side
Mexico. A clear ENSO signal can be seenin of Central America
Figure 10b, with temporary high sea levels (Caribbean Sea/Gulf of
(>20 cm) during the 1997–1998 and 2015–2016 Mexico); and
El Niño events, which might influence the (b) the Pacific side
overall trend for this series. The coastal of Central America.
sea-level rise is higher than the global mean Seasonal cycle was
removed; glacial
on the Caribbean Sea/Gulf of Mexico side
isostatic adjustment
(3.7 mm/yr) and lower than the global mean
correction was applied.
on the Pacific side (2.6 mm/yr). The orange line
b)
represents the linear
trend.
Source: C3S
Caribbean
The regional sea-level trends around the
Caribbean are shown in Figure 11 and
Figure 12. Although sea-level rise in the
Caribbean is not uniform (Figure 11), the
linear trend is rising at a slightly higher rate
(3.56 ± 0.1 mm/yr) than the global average.
Sea level in the Caribbean is highly corre-
Figure 11. Regional sea-
lated with ENSO, with larger increases in level trends around the
sea level occurring during stronger El Niño Caribbean region from
events.17 Interannual variability in sea level January 1993 to June
is particularly relevant in the Caribbean, as 2020 (based on satellite
it is correlated with hurricane activity. Both altimetry).
hurricane intensity and sea-level interannual Source: C3S
variability have increased since 2000 (see
Extreme events).
OCEAN ACIDIFICATION Figure 12. Altimetry-
based coastal sea-level
The ocean absorbs about 23% of annual time series from January
anthropogenic emissions of CO2 in the at- 1993 to June 2020 for
the Caribbean Sea and
mosphere,18 thereby helping to alleviate the
Gulf of Mexico (based
impacts of rising emissions on Earth’s climate. on gridded altimetry
data averaged from
However, CO 2 reacts with seawater and 50 km offshore to the
lowers its pH. This process, known as ocean coast). Seasonal cycle
acidification, affects many organisms and was removed; glacial
ecosystem services, threatening food security isostatic adjustment
by endangering fisheries and aquaculture. correction was applied.
The orange line
represents the linear
17
Climate Studies Group Mona (eds.), 2020: The State of the Caribbean Climate. Produced for the Caribbean Development trend.
Bank. Source: C3S
18
World Meteorological Organization, 2019: WMO Greenhouse Gas Bulletin: The State of Greenhouse Gases
in the Atmosphere Based on Global Observations through 2018, No. 15, https://library.wmo.int/index.
php?lvl=notice_display&id=21620.
13Figure 13. Global mean
ocean pH. Global mean ocean pH (pH)
Source: Met Office, 8.11
United Kingdom
8.10
8.09
pH
8.08
8.07
8.06
CMEMS
1985 1990 1995 2000 2005 2010 2015 2020
Year © Crown Copyright. Source: Met Office
Global ocean pH levels have been stead- climate conditions in the region are largely
ily declining, reaching a new low in 2020 modulated by the prevailing sea-surface
Figure 14. Sea-surface (Figure 13). Along the Pacific coast of South temperatures of the oceans and associated
temperature anomalies America, the Humboldt Current, one of the large-scale atmosphere-ocean coupling
in 2020 (reference period world’s four major upwelling systems, is phenomena, such as ENSO.
1981–2010). Source: being affected by ocean acidification and
National Oceanic oxygen loss, with negative impacts on key The year 2020 started with higher than
and Atmospheric ecosystems.19 long-term average sea-surface temperature
Administration (NOAA), observed in the tropical western Pacific, with
Optimum Interpolation
the Oceanic Niño Index reaching 0.6 °C in
Sea Surface
Temperature (OISST)
January–March 2020. Despite being slightly
v2 data set, plotted by KEY CLIMATE DRIVERS above the 0.5 °C threshold usually considered
the Caribbean Institute for warm events in the equatorial Pacific,
for Meteorology and As Latin America and the Caribbean is sur- the atmospheric counterpart, the Southern
Hydrology (CIMH). rounded by the Pacific and the Atlantic oceans, Oscillation Index, was near zero in the early
months of 2020. Therefore a fully coupled
El Niño event never developed
A significant sea-surface temperature cooling
was in progress from May in the easternmost
part of the equatorial Pacific Ocean, which
reached La Niña levels in the last quarter of
the year. During La Niña, more hurricanes
can form in the deep tropics from African
easterly waves, posing an increased threat
to the Caribbean. 20
The Atlantic Warm Pool in the Caribbean and
adjacent ocean areas likely also contributed
to the record-breaking Atlantic tropical cy-
clone activity in 2020 (see Extreme events
and Figure 14). The sea-surface temperature
anomaly in the Caribbean Sea in 2020 was
0.87 °C above the 1981–2010 average, sur-
passing the previous highest value of +0.78 °C
in 2010. 21
19
Intergovernmental Panel on Climate Change (IPCC), 2019b: IPCC Special Report on the Ocean and Cryosphere in a
Changing Climate (H.-O. Pörtner et al., eds.), https://www.ipcc.ch/srocc/.
20
Climate Studies Group Mona (eds.), 2020: The State of the Caribbean Climate.
21
Australian Antarctic Data Centre, 2003: Reynolds-Smith V2 global monthly average sea surface temperatures (revised in
2019), https://data.aad.gov.au/metadata/records/REYNOLDS_MONTHLY_SST.
14Extreme events
TROPICAL CYCLONES af fecting the region between 1980 and
2016. Tropical cyclones account for more
In 2020, the Atlantic basin cyclone season than 70% of meteorological-related disasters,
registered a total of 30 storms, beating representing nearly 95% of damage from
the previous record of 28 storms in 2005. meteorological disasters in the Caribbean
Eight had direct or indirect impacts in the countries since 1960.
region: Tropical storm Amanda/Cristobal,
and Hurricanes Gamma, Marco, Nana, Delta, In 2020, Hurricane Isaias produced devas-
Zeta, Eta and Iota. Furthermore, Eta and Iota tating flooding and wind damage in Puerto
reached category 4 intensity (according to Rico and the Dominican Republic, leading
post-storm intensity analyses)22, made landfall to the death of three people. A state of
in the same region in quick succession (two emergency was declared in Puerto Rico
weeks) and followed identical paths across resulting from the effects of Tropical storm
Nicaragua and Honduras, severely affecting Laura. Laura also contributed to the death
many of the same areas in these countries. of 31 people in Haiti and 4 in the Dominican
Republic. An estimated 80% of total land area
Tropical storm Amanda emerged in the Pacific in Puerto Rico was classified as abnormally
Ocean and moved to the Caribbean Sea. dry by late June, triggering water rationing
Its remnants evolved into Tropical storm during the hot summer months. In contrast,
Cristobal. Both systems produced rainfall by 31 July intense rainfall due to Hurricane
and contributed to floods and landslides over Isaias triggered numerous landslides in the
Guatemala, Honduras, El Salvador and Costa steep terrain along the Cordillera Central
Rica (which was affected only by Amanda). and over the Sierra de Luquillo, affecting
Nana resulted in flooding and landslides in local roadways.
Guatemala and Honduras. Costa Rica suffered
overflow of rivers and floods on the North
Pacific side following Marco.
DROUGHT
Hurricanes Eta and Iota brought a large
amount of rainfall to eastern Mexico and Caribbean
the Yucatán Peninsula, Belize, Guatemala,
Honduras, Costa Rica and Panama. Estimated The Caribbean faces significant, and often
rainfall accumulations over parts of Nicaragua overlooked, challenges due to drought.
and Honduras were in excess of 305 mm after During the past decades, the Caribbean has
the passage of Eta on 6 November. Parts of experienced several drought events, including
eastern Nicaragua, Honduras, Belize and in 1957, 1968, 1976–1977, 1986–1987, 1991,
Costa Rica picked up more than 150–300 mm 1994, 1997–1998, 2009–2010 and 2013–2016.23
of rain from Iota by 15–16 November. In 2020, based on an analysis using the
Integrated Drought Index (IDI)24, the Caribbean
The Caribbean is particularly exposed to region recorded severe to extreme drought
hurricanes, with more than 110 storms in the Dominican Republic, Haiti, northern
22
National Hurricane Center, NOAA, 2021: Hurricane Iota. Tropical cyclone report (AL312020), https://www.nhc.noaa.gov/
data/tcr/AL312020_Iota.pdf.
23
Climate Studies Group Mona (eds.), 2020: The State of the Caribbean Climate
24
Cunha, A.P.M.A. et al., 2019: Extreme drought events over Brazil from 2011 to 2019. Atmosphere, 10: 642, https://doi.
org/10.3390/atmos10110642.
15Figure 15. IDI map (left)
and SPEI (6-month
and 12-month) time
series (right) in some
regions with severe to
exceptional drought in
the Caribbean region.
Source: National
Center for Monitoring
and Early Warning of
Natural Disasters, Brazil
(CEMADEN)
Figure 16. IDI map (left)
and SPEI (6-month
and 12-month) time
series (right) in some
regions with severe to
exceptional drought
in Mexico/Central
America.
Source: CEMADEN
Colombia, Panama and nor th-western By October 2020, severe drought had devel-
Bolivarian Republic of Venezuela (Figure 15). oped in Saint Vincent and the Grenadines,
western French Guiana, eastern Guadeloupe,
The IDI map corresponds to the 12-month northernmost Guyana, Martinique, Saint
period (2020), based on 12-month SPI. Lucia and eastern Suriname. In December
The graphs correspond to the 6-month the severe drought conditions changed to
and 12-month Standardized Precipitation moderate.
Evapotranspiration Index (SPEI).25. Northern
Colombia and north-western Bolivarian Mexico and Central America
Republic of Venezuela show large negative
values (generally less than −1.5) for 6-month In 2020, severe to moderate drought conditions
SPEI and 12-month SPEI26 in 2020 (Figure 15), were reported in Belize, northern Guatemala,
which was a year without El Niño but with a eastern Costa Rica, Honduras and Nicaragua
warmer-than-normal tropical North Atlantic, and northern South America. Extreme to
as well as in 2015 –2016 and 1997 (both exceptional drought conditions prevailed
El Niño years). during 2020 in north-western Mexico, associ-
ated with a weak North American monsoon,
In Puerto Rico, in the middle of the COVID-19 as reflected in the negative 6-month SPEI
outbreak, the government declared a state of and 12-month SPEI, comparable only to the
emergency in June 2020 owing to drought. drought of 2012 (Figure 16).
About 60% of Puerto Rico was experiencing
drought conditions, which improved after Mexico, Belize, Honduras, Costa Rica and
Hurricane Isaias and Topical Storm Laura Panama reported regions with severe and
during July and August, respectively. extreme meteorological droughts, with
25
The SPEI was designed to consider both precipitation and potential evapotranspiration in determining drought. It
was first proposed in Vicente-Serrano S.M. et al., 2010: A multiscalar drought index sensitive to global warming:
the standardized precipitation evapotranspiration index. Journal of Climate, 23(7): 1696–1718, https://doi.
org/10.1175/2009JCLI2909.1.
26
The reference period used for the 6-month SPEI and 12-month SPEI is 1981–2010.
16Figure 17. IDI map (left)
and SPEI (6-month
and 12-month) time
series (right) in some
regions with severe to
exceptional drought in
South America.
Source: CEMADEN
6-month SPISeptember 2020 the lowest minimum value On 20 and 21 February, temperatures above
was 1 cm, the lowest level in 47 years. In the the 90th percentile were recorded in the
Paraguay River, the anomalously low river department of San Martín, in the northern
levels hampered shipping. Several ships ran Amazonia of Peru. The Saposoa station re-
aground, and many vessels had to reduce corded a 39.5 °C daily maximum temperature
their cargo in order to navigate to and from on 21 February (compared with the long-
inland river ports. 29 term mean of 32.4 °C). During 17–22 April, a
heatwave affected Valparaíso in Chile, with
Argentina recorded a dry year with an esti- temperatures of 28.8 °C and a corresponding
mated national rainfall anomaly of −16.7% anomaly greater than 9 °C compared with the
compared with the 1981–2010 average, plac- long-term mean of 19.3 °C. In May, record
ing 2020 as the driest year since 1995. The temperatures were observed in Chile during
National Fire Management Service (SNMF), the three episodes of heatwaves between
Argentina, reported that the drought was Arica and Santiago, with temperatures of
fuelling the wildfires, as many of the fires were 35.5 °C in Rodelillo, 30.6 °C in Santo Domingo
burning in dry areas that would normally be and 28.8 °C in Calama on 25–28 April, the
flooded during this time of year, and that the highest since the late 1960s.
drought had dried up the streams and river
channels that normally serve as firewalls and Between 29 September and 15 October, a ma-
sources of moisture. jor heatwave affected central South America.
Some locations experienced warming of
about 10 °C above normal, and some even
had temperatures above 40 °C several days
HEATWAVES AND WILDFIRES in a row (Figure 18). Maximum temperatures
at some stations showed record-breaking
A series of heatwaves and extreme tempera- values, with temperatures up to 10 °C above
tures affected several places in South America normal. October maximum temperature in
during the year and induced favourable weath- Asunción (Paraguay) reached 42.3 °C, a new
er conditions for wildfires, especially in the historical record. In the city of São Paulo
Amazonian forest. A heatwave occurred in the (Brazil), the maximum temperature reached
Cuyo Region in Argentina on 18–28 January, 37.5 °C on 2 October (compared with the
with temperatures of 36–43 °C across the long-term mean of 28.8 °C), and on three
region. In Mariscal Estigarribia, Paraguay, occasions temperatures surpassed 37.4 °C
temperature reached 42.5 °C on 8 March. (Figure 18). In the Plurinational State of Bolivia,
Figure 18. Time series
of maximum and
minimum temperatures
in some locations in
Brazil, Paraguay, the
Plurinational State of
Bolivia and Argentina,
from 25 September to
25 October 2020.
Source: CEMADEN and
INMET
29
Marengo, J.A. et al., 2021: Extreme drought in the Brazilian Pantanal in 2019–2020: characterization, causes, and
impacts. Frontiers in Water, 3: 639204, https://doi.org/10.3389/frwa.2021.639204.
18the heatwave produced record-breaking
temperatures in October in four cities, and
the highest temperature ever recorded in
San José de Chiquitos of 43.4 °C.
November was very hot in many places in
South America. Between 22 and 24 November,
the Plurinational State of Bolivia reported
new record maximum temperatures in
the regions of Santa Cruz and Beni, and
maximum temperatures reached 41.3 °C
in Rurrenabaque (compared with the long-
term mean of 30.0 °C) and 40.2 °C in San
Joaquín (compared with the long-term mean
of 32.0 °C). In Requena, in the northern
Amazon region, maximum temperatures
reached 40.7 °C on 22 November (compared
with the long-term mean of 31.7 °C). Brazil
reported a record maximum temperature
on 5 November of 44.8 °C in Nova Maringá
(state of Mato Grosso) (compared with the
long-term mean of 30.0 °C). This is the highest
maximum temperature recorded in Brazil in
111 years (i.e. since 1909 when the National
Meteorological Institute of Brazil (INMET)
was created).
The number of heat sources (which are indi- Figure 19. Burned area
The year 2020 saw the most catastrophic cators of wildfires) registered by the National in the Pantanal biome,
Brazil, in 2020.
fire season over the Pantanal, with burned Institute for Space Research (INPE), Brazil,
Source: LASA-UFRJ
area exceeding 26% of the region (Figure 19), in the Pantanal was 241% higher in 2020
according to the ALARMES warning sys- compared with 2019. 33,34,35 Moreover, 2020
tem from the Laboratory for Environmental surpassed 2019 to become the most active
Satellite Applications (LASA-UFRJ).30 This was fire year in the southern Amazon since 2012,36
four times larger than the long-term average with 574 000 active fires in 2020, compared
observed between 2001 and 2019. 31,32 with 509 000 for the same period last year.
30
https://lasa.ufrj.br/alarmes
31
Libonati, R. et al., 2020: Rescue Brazil’s burning Pantanal wetlands. Nature, 588: 217–219, https://doi.org/10.1038/
d41586-020-03464-1.
32
Garcia et al., 2021: Record-breaking wildfires in the world's largest continuous tropical wetland: Integrative fire
management is urgently needed for both biodiversity and humans, Journal of Environmental Management, 293: 112870,
https://doi.org/10.1016/j.jenvman.2021.112870.
33
Marengo et al., 2021: Extreme drought in the Brazilian Pantanal in 2019–2020: characterization, causes, and impacts.
34
Libonati et al., 2020: Rescue Brazil’s burning Pantanal wetlands.
35
Leal Filho, W. et al., 2021: Fire in paradise: why the Pantanal is burning. Environmental Science and Policy, 123: 31–34,
https://doi.org/10.1016/j.envsci.2021.05.005.
36
Global Fire Emissions Database, 2020: Amazon fire activity in 2020 surpasses 2019, https://globalfiredata.org/
pages/2020/09/22/amazon-fire-activity-in-2020-surpasses-2019.
19COLD WAVES HEAVY PRECIPITATION AND
ASSOCIATED FLOODING
During 21–23 August, a cold wave affected
most of Brazil due to the entrance of a polar Heavy rains and related floods, flash floods
air mass with a cold front that reached as far and landslides affected Brazil in January and
as western Amazonia. In the state of Acre, February. On 10 February, the weather station
western Amazonia, the city of Rio Branco Mirante de Santana, in the state of São Paulo,
recorded minimum temperatures of 12 °C recorded 114 mm (February was the wettest
on 22 August (compared with the long-term month in 77 years with 483.6 mm, almost
mean of 17.4 °C). Temperatures were below double the normal average of 249.7 mm).
10 °C in Curitiba, in the state of Paraná, and Dozens of lives were lost and thousands of
the city experienced freezing rain. In the city people lost their homes from the flash floods
of São Paulo, temperatures reached 1 °C early and landslides. Floods were also recorded
morning on 21 August (compared with the in March, which affected the Plurinational
long-term mean of 12.8 °C). In the lower Chaco State of Bolivia, Brazil, Colombia, Ecuador
region of Paraguay, new record minimum and Peru. In Uruguay, heavy rain from 22 to
temperatures were observed on 21 August, 24 June led to flash floods, cutting roads
with −0.8 °C in the city of Pilar (compared and prompting evacuations. According to
with the long-term mean of 2.8 °C), the lowest the Instituto Uruguayo de Meteorología
since 2011. The cold wave reached Peruvian (INUMET), the town of José Batlle y Ordóñez,
Amazonia, with temperatures reaching 12.8 °C in the department of Lavalleja, recorded
on 21 August in Iquitos (compared with the 105 mm of rain in 24 hours.
long-term mean of 22.2 °C). In Caballococha,
minimum temperatures reached 12.8 °C on During 30 June–1 July, an intense extratrop-
22 August (compared with the long-term ical cyclone (called ciclone bomba by local
mean of 21.3 °C), closer to the historical lowest meteorologists) affected southern Brazil, with
values recorded on 21 July 1975. tornadoes, hails and wind gusts exceeding
130 km/h. Some 18 people were killed from the
From mid-June to early July, a high pressure falling trees and structures in Rio Grande and
blocking pattern over southern Patagonia led Santa Catarina. A total of 229 municipalities
to extremely low temperatures that persisted were affected, 2 600 people lost their homes
up to eight days in the city of Rio Grande and and 1.5 million people were left without
in most parts of central Argentina, southern electricity in Santa Catarina.
Patagonia (Santa Cruz and Tierra del Fuego),
where temperatures ranged from −20 °C to Further north, between 9 and 15 September,
−9 °C. Cold temperatures and several snowfalls several states in the Bolivarian Republic of
affected the whole region during austral winter Venezuela were severely affected by floods
(June to August), producing significant accu- of the Limón River. The states of Aragua,
mulation of snow depth (1–2 m), particularly Portuguesa and Bolívar were the most af-
in the high mountain areas. According to fected. On 9 September, the Rancho Grande
estimates from satellite measurements, the location in Ecuador recorded 90.5 mm in
snow-cover extent for central and southern 4 hours, triggering landslides that affected
Patagonia was the highest since 2000. 1 409 people.
20Climate-related Impacts
and Risks
IMPACTS ON SECTORS IMPACTS ON AGRICULTURE AND
WATER RESOURCES
The importance of action to tackle climate
change and to limit global warming to 1.5 °C Climate change is considered one of the major
above pre-industrial levels is strongly em- disruptors of agriculture and food systems
phasized in the IPCC special report on global in Latin America and the Caribbean, owing
warming of 1.5 °C.37 As mentioned in the State to the projected reductions in most yields
of the Global Climate 2020 (WMO-No. 1264), (Figure 20).41 This impact was also addressed
the risk of climate-related impacts depends on in the IPCC special report on climate change
complex interactions between climate-related and land, which refers to reductions of 6% in
hazards and the vulnerability, exposure and the Latin America and the Caribbean region
adaptive capacity of human and natural sys- by 2046–2055 for a group of 11 major global
tems. According to the IPCC Sixth Assessment crops.42 Some of the worst impacts on sus-
cycle special reports,38,39 Latin America and the tainable development are expected to be felt
Caribbean is one of the world regions where among those whose livelihood depends on
Figure 20. Projected
climate change effects and impacts – such as agriculture and the coasts. On many small
changes in yields due
heatwaves, decrease in crop yield, wildfires, islands, such as SIDS, freshwater stress is to climate change in the
coral reef depletion and extreme sea-level expected to occur as a result of projected Latin America and the
events – are projected to be more intense. aridity change. Constraining warming to Caribbean subregions,
Thus, limiting global warming to well below 1.5 °C, however, could prevent a substantial 2010 vs. 2030.
2 °C, as prescribed in the Paris Agreement, is fraction of water stress, compared with 2°C, Source: Morris et al.,
important for reducing climate-related risks in especially across the Caribbean region.43 2020
a region already facing economic and social
asymmetries to its sustainable development.
The IPCC special report on global warming of
1.5 °C highlights that, compared with current 10
conditions, even 1.5 °C of global warming 8
6
would pose heightened risks to eradicating
4
poverty, reducing inequalities and ensuring
2
human and ecosystem well-being. 40 The
Percent change
0
associated impacts would disproportion-
-2
ately affect disadvantaged and vulnerable
-4
populations through food insecurity, higher
-6
food prices, income losses, lost livelihood -8
opportunities, adverse health impacts and -10
population displacements. Small Island
Developing States (SIDS) are among the
regions and ecosystems where the worst
climate change impacts are expected.
Latin America Caribbean Central America Mexico Andean Zone Brazil and Guyanas Southern Cone
37
IPCC, 2018: Global Warming of 1.5°C: an IPCC Special Report on the Impacts of Global Warming of 1.5°C above Pre-
industrial Levels and Related Global Greenhouse Gas Emission Pathways, in the Context of Strengthening the Global
Response to the Threat of Climate Change, Sustainable Development, and Efforts to Eradicate Poverty (V. Masson-
Delmotte et al., eds.), https://www.ipcc.ch/sr15/.
38
IPCC, 2019a: Climate Change and Land: an IPCC Special Report on Climate Change, Desertification, Land Degradation,
Sustainable Land Management, Food Security, and Greenhouse Gas Fluxes in Terrestrial Ecosystems
(P.R. Shukla et al., eds.), https://www.ipcc.ch/srccl/.
39
IPCC, 2019b: IPCC Special Report on the Ocean and Cryosphere in a Changing Climate.
40
IPCC, 2018: Global Warming of 1.5°C.
41
Morris, M. et al., 2020: Future Foodscapes: Re-imagining Agriculture in Latin America and the Caribbean. Washington, DC,
International Bank for Reconstruction and Development/The World Bank.
42
IPCC, 2019a: Climate Change and Land.
43
IPCC, 2018: Global Warming of 1.5°C.
21You can also read