Article - American Meteorological ...
←
→
Page content transcription
If your browser does not render page correctly, please read the page content below
Article
Multiscale Forecasting of
High-Impact Weather
Current Status and Future Challenges
Sharanya J. Majumdar, Juanzhen Sun, Brian Golding,
Paul Joe, Jimy Dudhia, Olivier Caumont, Krushna Chandra Gouda,
Peter Steinle, Béatrice Vincendon, Jianjie Wang, and Nusrat Yussouf

                                ABSTRACT: Improving the forecasting and communication of weather hazards such as urban
                                floods and extreme winds has been recognized by the World Meteorological Organization (WMO)
                                as a priority for international weather research. The WMO has established a 10-yr High-Impact
                                Weather Project (HIWeather) to address global challenges and accelerate progress on scientific
                                and social solutions. In this review, key challenges in hazard forecasting are first illustrated and
                                summarized via four examples of high-impact weather events. Following this, a synthesis of the
                                requirements, current status, and future research in observations, multiscale data assimilation,
                                multiscale ensemble forecasting, and multiscale coupled hazard modeling is provided.

https://doi.org/10.1175/BAMS-D-20-0111.1
Corresponding author: Sharanya J. Majumdar, smajumdar@rsmas.miami.edu
In final form 27 September 2020
©2021 American Meteorological Society
For information regarding reuse of this content and general copyright information, consult the AMS Copyright Policy.

                AMERICAN METEOROLOGICAL SOCIETY
                                                                                                                   Unauthenticated     021    E635
                                                                                                                          M A R C H| 2Downloaded 04/18/21 10:27 AM UTC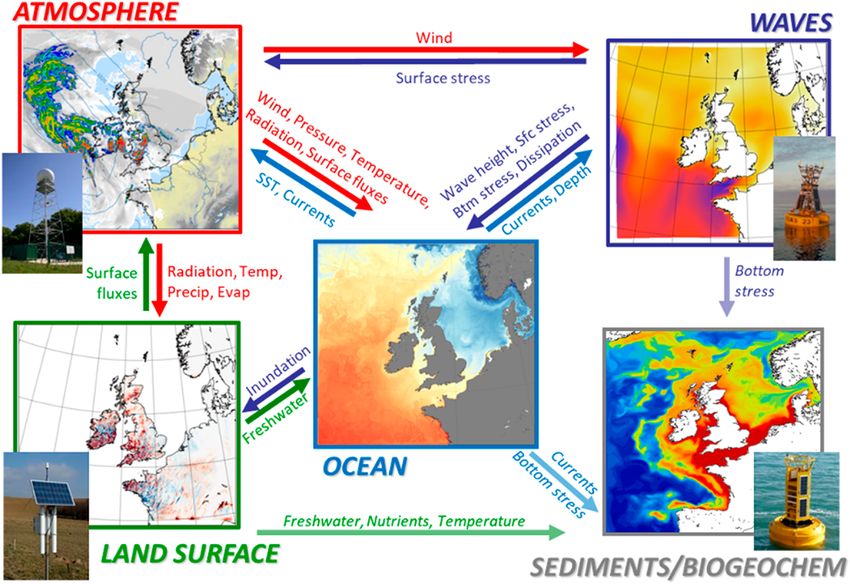
AFFILIATIONS: Majumdar—University of Miami, Miami, Florida; Sun and Dudhia—National Center for
Atmospheric Research, Boulder, Colorado; Golding—Met Office, Exeter, United Kingdom; Joe—Environment
Canada, Toronto, Ontario, Canada; Caumont—CNRM, Université de Toulouse, Météo-France, CNRS, Toulouse,
France; Gouda—CSIR Fourth Paradigm Institute, Bangalore, India; Steinle—Bureau of Meteorology, Melbourne,
Victoria, Australia; Vincendon—Météo-France, Toulouse, France; Wang—China Meteorological Administra-
tion, Beijing, China; Yussouf—CIMMS, University of Oklahoma, and NOAA/NSSL, Norman, Oklahoma

F
      ollowing the conclusion of the World Meteorological Organization (WMO)/World Weather
      Research Programme (WWRP) THORPEX project (Parsons et al. 2017), three new projects
      were launched with a view toward global collaboration on advancing prediction on
multiple scales. One of these projects, the High-Impact Weather Project (HIWeather), was
launched in 2015 and seeks to “promote co-operative international research to achieve a
dramatic increase in resilience to high impact weather, worldwide, through improving forecasts
for timescales of minutes to two weeks and enhancing their communication and utility in
social, economic and environmental applications.”1 HIWeather emphasizes the relationships
between key weather and societal drivers for (i) urban flooding, (ii) extreme local wind, (iii)
urban heat waves and pollution, (iv) wildfires, and (v) disruptive winter weather. Decision-
makers taking actions to mitigate against the impacts of these
hazards need probabilistic impact-oriented forecast information       1
                                                                        http://hiweather.net/
across a variety of lead times (see Fig. 1 for the “ready, set, go”

Fig. 1. Action timelines for selected responses to urban flooding. The upper axis refers to actions
in a major river or coastal flood, for which evacuation requires several days’ notice and early warn-
ings up to 2 weeks ahead may be available, while the lower axis refers to flash floods affecting
smaller areas and for which less warning is possible. Response actions are categorized according
to the risk threshold at which they are initiated (bearing in mind that risk encompasses both
probability and impact), in a “ready, set, go” sequence represented by the colors yellow, orange,
and red. Consistency of advice is important as the event approaches and the shortest-lead-time
nowcasts are valuable in both scenarios for optimizing the rescue and recovery phase.

AMERICAN METEOROLOGICAL SOCIETY
                                                                              Unauthenticated     021    E636
                                                                                     M A R C H| 2Downloaded 04/18/21 10:27 AM UTC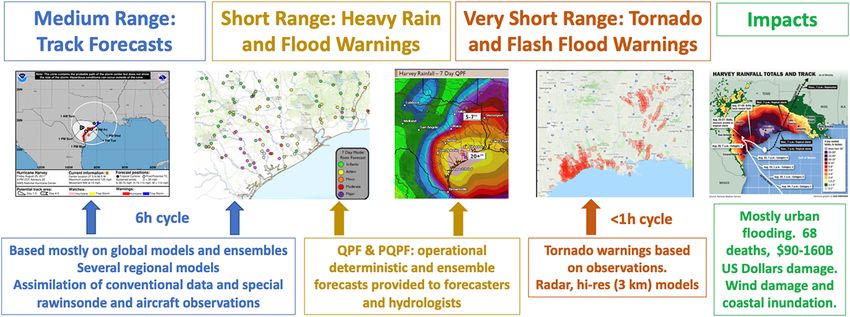
timeline for the urban flooding hazard, designed by the HIWeather Task Team). To address
               the broad scope of the warning process, the HIWeather project has five research themes:
               Predictability and Processes; Multiscale Hazard Forecasting; Human Impacts, Vulnerability
               and Risk; Communication; and Evaluation, but much of the work is carried out in cross-cutting
               activities. Here we focus on the Multiscale Hazard Forecasting theme, to which the authors of
               this paper contribute. The purpose of this paper is to review the state of forecasting of high-
               impact weather events in the context of the warning chain described in Golding et al. (2019)
               so as to establish priorities and recommendations for future work.
                  We first set the scene with four cases from across the globe that focus on short-range fore-
               casting of urban flooding, localized extreme wind, and wildfires. We then continue with a
               review of methodologies applicable to the forecasting of all hazards and their parent weather
               systems across multiple scales. We note that hazards may be interconnected; for example,
               extreme winds and flooding from tropical cyclones, or wildfires affected by localized extreme
               winds. Given these complexities, it is important to consider whether some of the challenges
               identified from these examples can be generalized, or if some are specific to a particular type
               of meteorological event, infrastructure or communication mechanism. For example, com-
               mon global problems include the influence of terrain, the need for accurate real-time rainfall
               estimates for nowcasting, and the need to improve predictions of convective initiation. On the
               other hand, specific local challenges arise in observational infrastructure, forecasting, and
               communication due to cultural, economic, and political differences. In this paper, we restrict
               our attention to commonalities and disparities in the areas of observations, data assimilation,
               ensemble forecasting, and coupled hazard modeling.

               Examples of high-impact weather events
               Every year there are numerous weather-related disasters around the world, resulting in many
               fatalities and injuries, the displacement of large populations, and substantial repair and
               recovery costs (CRED 2019). We present brief descriptions of four recent examples of weather-
               related disasters, including an outline of the weather, the resulting hazards and their impact,
               a summary of the warning timeline and resulting mitigation actions, and an assessment of
               the challenges and pointers for future development. While these examples were chosen to
               give a spread of geographical location and hazard, they are only a small sample of the chal-
               lenges faced by countries across the world in forecasting and responding to high-impact
               weather. At the end, in Table 1, we summarize some features of these examples that appear
               to be generic and that highlight some challenges for the future development of forecasting
               and warning capabilities.

Table 1. Common forecasting challenges for high-impact weather events.

 Challenge 1: Early information to enable preparation. Information is        Challenge 2: Early information to enable early action. To avert a major
 needed by emergency managers and by those who will be affected.             disaster, costly and time-consuming actions, including evacuation, may be
 Early information is necessarily uncertain. The better the information      needed. Information available at the time is critical to determine the scale
 is about the nature of that uncertainty, the more appropriate the           of evacuation, safe evacuation routes and destinations, and to persuade
 preparation as the event approaches. Improving numerical model-             reluctant people to move. This challenge requires improved numerical
 ing and multiscale ensemble prediction are the keys to meet this            modeling, multiscale ensemble prediction, data assimilation, and coupled
 challenge.                                                                  modeling.

 Challenge 3: Precise information to enable targeted response.               Challenge 4: Information on the nature of the threat. Decision-makers need
 Emergency managers respond dynamically to the specific impacts of           to know what the hazard will be and what impact it will have. Aspects of the
 the hazard as it develops. In urban areas this detailed information is      weather that create hazards are not those typically focused on by forecast
 ultimately required at block level. Monitoring and very short-range         verification. Coupling weather and hazard models can help the detection and
 forecasting of the hazard provides the situational awareness required for   correction of weaknesses in weather forecasts, such as biases in the extremes.
 a fast and effective response. The key areas of improvement required to     Improvements in coupled data assimilation, modeling, and ensemble prediction
 meet this challenge are hazard observations and nowcasting.                 are necessary for this challenge.

               AMERICAN METEOROLOGICAL SOCIETY
                                                                                                              Unauthenticated     021    E637
                                                                                                                     M A R C H| 2Downloaded 04/18/21 10:27 AM UTC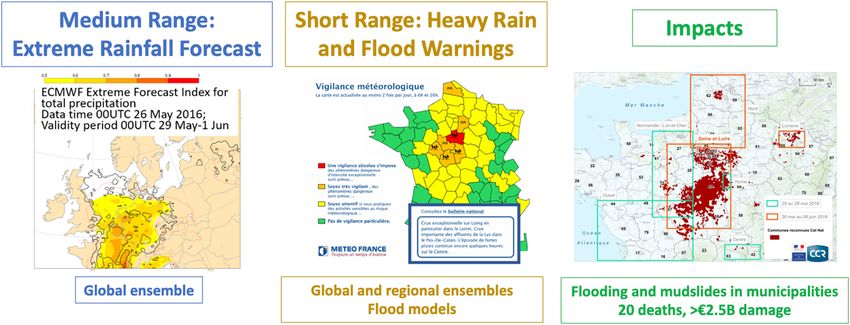
North America: Urban flooding from Tropical Storm Harvey (2017). Tropical Storm
            Harvey (Fig. 2) has to date been the most significant tropical rainfall event in U.S. history
            (Blake and Zelinsky 2018). It resulted in the loss of 68 lives and was the second-costliest tropi-
            cal cyclone in U.S. history (adjusting for inflation). Rain was intense and widespread, some
            localities receiving approximately 60 in. (~1.5 m) of rain, producing major to catastrophic
            flash flooding and river flooding.
               From the time when the U.S. NOAA/National Weather Service (NWS)/National Hurricane
            Center (NHC) started reissuing advisories for a regenerated Harvey in the Gulf of Mexico
            on 23 August 2017, 3 days before the most intensive flooding began, they included key

Fig. 2. Timeline leading to the impacts from Tropical Storm Harvey (2017).

            messages stating that “several days of heavy rainfall” were likely over regions that included
            the Houston area, and that the rainfall “could cause life-threatening flooding.” The track and
            stall of Harvey’s center were captured accurately in NHC’s forecasts, based on a consensus of
            operational global and regional forecast models, and the rainfall threat was consistently well
            communicated. NWS offices in the affected areas in Texas issued 372 tornado, flash flood,
            and severe thunderstorm warnings during 25–30 August (NOAA 2018). Many of these warn-
            ings were based on rapidly updated radar imagery and were credited as a major motivator
            for public action and the saving of lives. Operational deterministic forecasts including the
            High-Resolution Rapid Refresh (HRRR; Benjamin et al. 2016), hydrologic ensemble forecasts,
            and probabilistic quantitative precipitation forecasts, which are complementary products
            provided by different NWS centers, were used.

            Challenges. The main forecasting challenges cited by NOAA included (i) the evolution of
            Harvey’s rainbands; (ii) the duration and trajectory of precipitation near the center; (iii) a
            dry bias to the east and northeast of the storm center; (iv) the timing and location of locally
            extreme rainfall; (v) the bursting of banks of rivers and reservoirs; (vi) the lack of products
            to communicate the impacts of an unprecedented amount of rain; and (vii) the need for
            probabilistic information, especially rainfall, at least 2 days in advance (NOAA 2018). A key
            lesson was the critical importance of mutual understanding and messaging of precipitation
            and flooding. A complication was the presence of tornadoes in the rainbands, with simulta-
            neous tornado and flash flood warnings producing conflicting public guidance (previously
            documented by Nielsen et al. 2015).

            AMERICAN METEOROLOGICAL SOCIETY
                                                                                     Unauthenticated     021    E638
                                                                                            M A R C H| 2Downloaded 04/18/21 10:27 AM UTC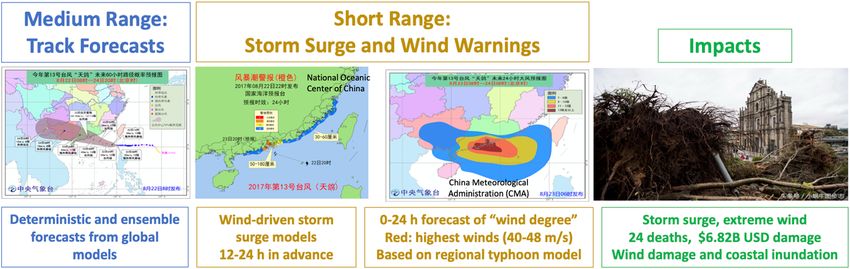
Europe: Large-scale flooding (2016). Following a wet winter and spring, intense rainstorms
            on 28 May 2016 were followed by heavy precipitation from a frontal disturbance giving 4-day
            totals of 80–120 mm in central France (Fig. 3). The Loing River rose rapidly at Montargis,
            110 km southwest of Paris, with maximum water levels exceeding the century record set in
            1910. Supplemented by additional rain (~20 mm) in northeastern France, the flooding reached
            Paris on 3 June, with the Seine River level reaching 6.10 m in Paris-Austerlitz. A total of 1,400
            French municipalities were placed in a “natural disaster” status for the events that occurred
            from 27 May to 3 June and 15,000 people were evacuated (van Oldenborgh et al. 2016;
            Perrin et al. 2017).

Fig. 3. Timeline leading to the flooding impacts in France (2016).

               The rainy episode of 29–30 May was predicted from 28 May with uncertainty in the location
            and total expected amounts. The first weather watches were issued on 30 May, recommending
            extreme vigilance in the center and north of France. On 27 May, the European Flood Awareness
            System began to disseminate information for 1–3 June to the Vigicrues national flood forecasting
            service about significant river level peaks. The SIM hydrological model driven by the ECMWF
            ensemble also predicted alert thresholds at about this time (Ramos et al. 2017). Flood watches
            issued by the Vigicrues national flood forecasting network reached maximum alert level (red)
            for the first time on some rivers on 31 May. Red watch levels remained in force up to 2 June.

            Challenges. While the rainfall amounts were well forecasted 2–3 days ahead, the location,
            timing, and spatial extent of the extremes were less well predicted. Hydrological monitoring
            worked well except when gauges were lost due to flooding. However, there were shortcomings
            in the flood forecasts and better hydrological data assimilation is needed. More effective com-
            munication of these forecasts and their associated uncertainty to civil protection would have
            allowed more timely responses. A need for improved coordination between meteorological and
            hydrological watch messages was identified. The role of human interpretation remains crucial.

            East Asia: Wind and storm surge impacts from Typhoon Hato (2017). Super Typhoon Hato
            made landfall in Zhuhai, China, on 23 August 2017 (Fig. 4). It brought destructive wind and
            record-breaking storm surge to the city and other parts of the highly populated Pearl River
            Delta (Liu et al. 2018). Many buildings and public facilities were damaged, including trans-
            port, communication, the electrical grid, and trees.

            AMERICAN METEOROLOGICAL SOCIETY
                                                                                    Unauthenticated     021    E639
                                                                                           M A R C H| 2Downloaded 04/18/21 10:27 AM UTC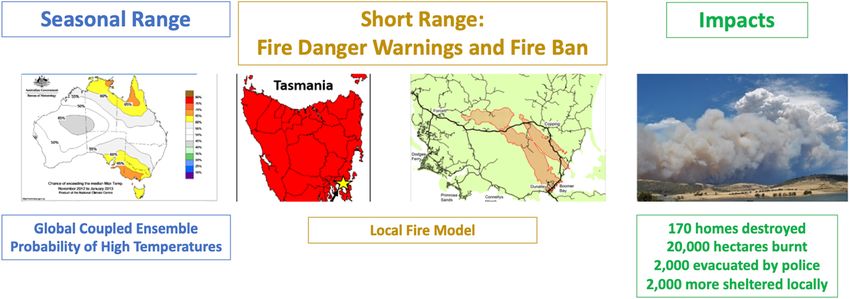
Fig. 4. Timeline leading to the impacts from Typhoon Hato (2017).

               Two days before Hato’s landfall, the China Meteorological Administration issued the blue
            typhoon warning signal (the lowest level), with forecasts of landfall location, time, wind and
            rainfall, and corresponding defensive notices. One day later, the warning was upgraded to brown
            with increased forecast wind intensity (35–42 m s−1). Seven hours before the center of Hato made
            landfall, the warning was changed to the highest level (red) with forecast winds of 40–48 m s−1.

            Challenges. Although the track of Hato was predicted reasonably well in the 48 h before
            landfall, the intensity was underpredicted by models and by both central and regional weather
            offices until a very short lead time (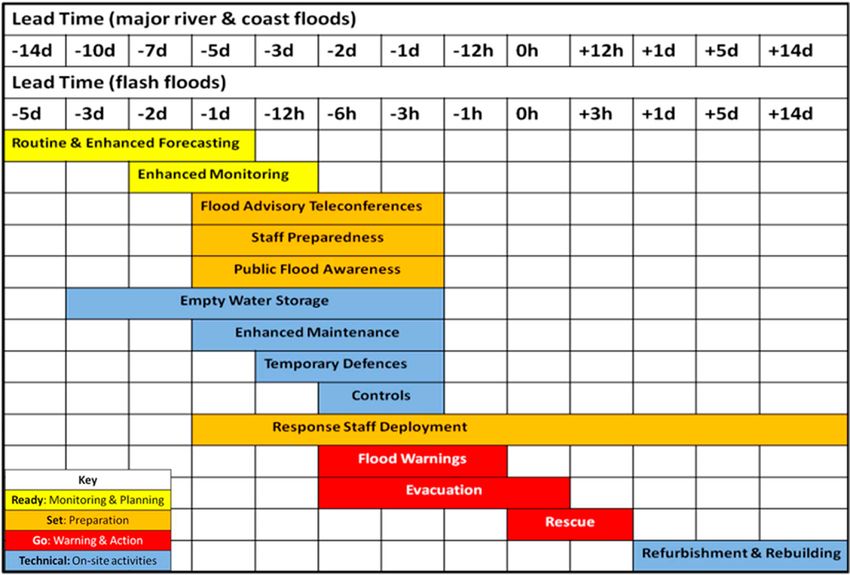
Some of the fires were in tourist areas during the peak holiday season, and record high
temperatures were recorded at several observing sites. The rugged terrain limited access to
settlements in the worst affected area. Since these fires occurred only 4 years after Australia’s
worst bush fire disaster up to that time (the “Black Saturday” fires), the level of community
preparedness was perhaps heightened.
   Seasonal outlooks from the Australian Bureau of Meteorology (2012) predicted raised prob-
abilities of a dry and hot summer associated with neutral El Niño and Indian Ocean dipole indices
and a warm Indian Ocean. The heat wave in southeastern Australia was associated with a large
high pressure system and was well predicted by global models at medium range time scales. The
Australian Forest Fire Danger Index, derived from these model runs and incorporating vegeta-
tion information, gave very high to extreme fire danger levels in the days leading up to the fires.

Challenges. The subsequent inquiry highlighted the value of experimental modeling of fire be-
havior and its interaction with the atmosphere (Tasmanian Government 2013). Once the fires
had broken out, the PHOENIX RapidFire model (Tolhurst et al. 2008) was used to predict fire
behavior given wind forecasts. The effect of atmospheric stability on fire behavior was empha-
sized, particularly the feedback between convection, fire ventilation and increasing wind speed/
decreasing humidity, and the lofting of embers creating further spot fires. This in turn affected
visibility (from smoke/debris) and low-level turbulence, influencing the use of aircraft to assist in
fire control. Making these modeling systems operational is an important future development that
will assist in making better decisions for safe evacuation of residents and protection of firefighters.
   The above four examples illustrate some common features of high-impact weather events
that challenge our forecasting capabilities on multiple scales. These are summarized in
Table 1. One important theme that exists at all stages of the forecast and warning process is
the communication of the information. Even when skillful forecasts are made, effective com-
munication at all stages is essential for hazard avoidance or mitigation. While communication
is a central research theme of the HIWeather project, a detailed synthesis of communication
of high-impact weather warnings and decision-making processes is beyond the scope of this
paper. Instead, the interested reader is referred to activities conducted by the HIWeather task
team in Communication, and Taylor et al. (2018) and accompanying papers in a special issue
of the International Journal of Disaster Risk Reduction. Their key points include the need for
timely and accessible information, varying needs of different user groups, and communica-
tion of the hazards instead of the meteorological variables. Additionally, challenges remain
in the messaging and communication of forecast uncertainty, and these are additional central
topics in HIWeather. One example of how the messaging challenge is being addressed is the
NHC’s annual training of meteorologists in WMO Regional Association RA-IV and emergency
managers on probabilistic forecasts of tropical cyclones.
   The remainder of this paper provides a review of the primary elements of the multiscale
forecasting process, mindful of the fact that this is only one section of the full warning chain
(Golding et al. 2019). The elements of the forecasting process are introduced sequentially,
beginning with the collection of observations and nowcasting that is sometimes employed
based on these observations. A central component is data assimilation, through which ob-
servations are blended with numerical models to provide a gridded analysis (or ensemble of
analyses). The review concludes with probabilistic predictions created from these analyses,
and recent progress in coupled hazard forecasting.

Observations
Observations and monitoring networks evolve over time in quantity, quality, and diversity with
technological advances. Accurate observations on all scales are required for many facets of
the forecasting and warning process, including scientific understanding, hazard monitoring,

AMERICAN METEOROLOGICAL SOCIETY
                                                                             Unauthenticated     021    E641
                                                                                    M A R C H| 2Downloaded 04/18/21 10:27 AM UTC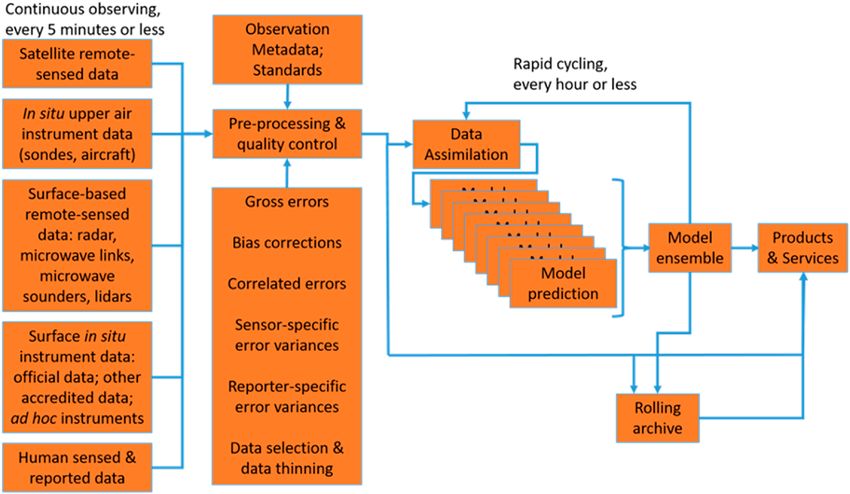
nowcasting, data assimilation, and forecast evaluation and verification. In this section we
            emphasize hazard monitoring and nowcasting, with a section on data assimilation to follow.

            Hazard monitoring: Requirements and current status. In a hazardous weather situation, it is
            necessary to maintain both situational awareness of the evolving meteorological environment
            on the medium-to-large scales in space and time, and a focus on the specific hazardous weather
            elements on the smaller scales for strategic and tactical decisions and actions. An accurate repre-
            sentation of the environment that may alter (and be altered by) the hazardous weather system is
            critical to the prediction of small-scale hazardous weather, and the issuance of weather watches.
            Hence, continuous, multiscale observations are required. In addition to the environment, the
            evolution of the location and nature of the hazard itself needs to be known accurately at all times,
            in order to enable hazard warnings to be initiated, updated, or discontinued, and for response
            and recovery operations to be managed effectively (e.g., Fig. 1). Hazard observations are also
            required for verification of early warnings and to enable research into improving hazard predic-
            tion. The discussion in this section focuses mostly on observations of hazards on smaller scales.
               Many hazards have highly heterogeneous distributions and are difficult to observe.
            Examples include snow in undulating terrain that is alternately above and below the freezing
            level and fire risk in partially wooded country. The accurate spatial and temporal monitoring
            of such hazards may require a combination of observing systems, integrated using statistical
            and/or process modeling methods. Most importantly, hazard observations must meet the
            needs of the decision-makers. Some parameters need to be quantitative and highly accurate,
            whereas for others, a qualitative or binary indication may be sufficient. When observations
            are made for multiple uses, trade-offs have to be made, but this should not be at the expense
            of providing timely information for key decisions.
               It is projected that by 2050, 68% of the world’s population will be concentrated in urban
            centers (United Nations 2018). As the focus on urban areas increases, the nature of weather-
            related hazard monitoring will evolve, particularly for those hazards that threaten the
            infrastructure services that maintain urban life. Since these hazards, particularly winds,
            lightning, floods, and heat, are strongly influenced by the urban fabric, the traditional nature
            of monitoring that is largely independent of human structures will need to change.
               Observations of weather hazards are conventionally made by human observers, in situ in-
            strumentation, and remote sensing platforms (Fig. 6, left panel). To accompany the discussion

Fig. 6. (left) The current global observing network provides in situ and remotely sensed data for hazard monitoring, nowcast-
ing, and data assimilation. Observing methods are standardized to ensure that results are compatible for use in specifying the
climate and the initial state for global weather prediction. (right) Potential future sources of weather and hazard observations
that may need to be accommodated in hazard monitoring and forecasting systems (source: World Meteorological Organization).

            AMERICAN METEOROLOGICAL SOCIETY
                                                                                         Unauthenticated     021    E642
                                                                                                M A R C H| 2Downloaded 04/18/21 10:27 AM UTC
below, some examples of recent advances in hazard monitoring and key references are pro-
vided in Table 2.
Human observations include variables that require visual classification. Although
reproducible results require skilled professionals, some requirements may be met with
Table 2. Summary of recent advances in hazard monitoring by ground-based, airborne, and space-based sensors, with key references.
Recent Advances: Hazard Monitoring
Instrumentation Capability Key References
Ground-based sensors
Centimeter radar Doppler wind and reflectivity of precipitation cloud; Doppler wind of Ryzhkov and Zrnić (2019);
boundary layer; precipitation type (with dual polarization); refractivity; McLaughlin et al. (2009)
quantitative precipitation estimate
Millimeter radar Doppler wind and reflectivity for fog, cloud, and light precipitation Kollias et al. (2007)
Lidar Doppler measurements of boundary layer wind and turbulence profiles; Wulfmeyer et al. (2015)
aerosols and air quality; temperature and water vapor profiles
Lightning detection Remotely sensed electromagnetic emissions (ground and spaced based) that Orville (2008)
network directly observe lightning; proxy for rainfall
Radiosondes Vertical profiles of temperature, water vapor, wind, used in satellite Ingleby et al. (2016)
calibration and data assimilation
Radiometers Temperature and water vapor profiles; liquid water path Westwater et al. (2005)
Cell phones Pressure and temperature sensors Mass and Madaus (2014);
Droste et al. (2017)
Ground transportation Precipitation type and rate, temperature, and other observations from mobile Mahoney and O’Sullivan (2013)
sensors on vehicles
Social media Visual reports of hazards and impacts Elmore et al. (2014)
Low-cost, compact Meteorological measurements with low-cost infrastructure in both rural and van de Giesen et al. (2014)
weather stations urban environments
Air quality sensors Small, low-cost sensors measuring air quality Jiao et al. (2016)
Airborne sensors
Dropwindsondes Temperature, pressure, relative humidity, vertical wind profiles Wang et al. (2015)
Radar Precipitation, wind Vivekanandan et al. (2014)
Lidar Vertical profiles of wind and humidity Lux et al. (2018)
AMDAR Temperature, pressure, relative humidity, and wind profiles during ascent, Petersen (2016)
descent, and en route, by commercial aircraft
Mode-Selective Temperature and wind retrievals from routine messages broadcast by Stone and Pearce (2016)
Enhanced Surveillance commercial aircraft
(Mode-S)
Unmanned aircraft In situ and remote sensing platforms mounted aboard small and large Cione et al. (2020)
unmanned aircraft systems
Space-based sensors
Cloud sensors Routine monitoring from geostationary satellites and polar orbiters, plus new Stephens et al. (2018)
continental, mesoscale, and “flex” modes aboard geostationary satellites
Precipitation sensors Constellation of sensors aboard multiple polar-orbiting satellites Skofronick-Jackson et al. (2017)
Optical and infrared Increased resolution of hazard monitoring under clear skies Schmit et al. (2017)
sensors
Radar sensors Additional data in cloudy and rainy regions, including severe storms Goodman et al. (2013);
Hou et al. (2014)
Lightning sensors Total lightning detection from geostationary satellites Goodman et al. (2013)
Lidar; aerosol sensors Vertical wind profiles; aerosol direct detection Lux et al. (2020)
Global navigation Zenith Total Delay to estimate precipitable water; Delay Doppler Mapping to Guerova et al. (2016);
satellite system/ estimate soil moisture, water, and wind; refractivity measurement of water Ruf et al. (2016)
global positioning vapor
system
CubeSats Constellation of small sensors Blackwell et al. (2018)
AMERICAN METEOROLOGICAL SOCIETY
Unauthenticated 021 E643
M A R C H| 2Downloaded 04/18/21 10:27 AM UTCsimple binary observations made by nonprofessionals. Such observations may include
rain, snow, hail, fog, flood, mudslides, wind damage, fire, and tornadoes (e.g., mPING;
Elmore et al. 2014).
Ground-based in situ observations are well suited to monitoring the parent synoptic-
scale weather systems within which hazardous weather may develop. However, they are
mostly too coarse to capture the full details of the hazards themselves, though relatively
high-density mesonets have been implemented in a few countries. Ground-based remote
sensing observations are available in some countries. Radars provide the foundation for
high-resolution precipitation mapping, and the detection of the parent structure of extreme
local winds including microbursts and tornadoes. Polarization diversity enables the detec-
tion of large hail and rain–snow discrimination. However, radars are expensive to install
and maintain, and they need to be close enough together to sample rainfall everywhere
at altitudes that correlate well with the surface rainfall. Aircraft observations provide
an additional capability, but commercial flights are limited by fixed paths, and special
missions targeted at hazardous weather are compromised by range limitations and safety
considerations.
Satellite remote sensing forms the core of observations for numerical weather analysis
and prediction. Traditional passive sensors detect radiation emitted or reflected from the
atmosphere and its constituents at multiple wavelengths, yielding retrievals of temperature
and moisture. More recent advances include cloud sensors, lightning sensors, atmospheric
motion vectors (AMVs) based on cloud tracking, and global positioning system (GPS) radio
occultation. Active sensors emit radiation and detect the amount that is reflected or backscat-
tered from targets, with recent developments including precipitation radars and active wind
lidars. A detailed review of satellite observations including the hydrological cycle, weather
analysis and prediction, and atmospheric composition is provided by Ackerman et al. (2018).
Over several decades, radiances and derived quantities such as AMVs from geostationary and
polar-orbiting satellites have formed the basis for model initialization on the synoptic scales,
especially over the oceans. Moreover, recent increases in horizontal resolution together with
the new ability for geostationary satellite sensors to adaptively scan mesoscale sectors now
allow for the sampling of high-impact weather systems down to the convective scales. The
increase in scanning frequency in geostationary satellites, now of order 1–10 min, allows
for the timely capture of the rapid evolution of convective systems. The leading numerical
models and data assimilation schemes therefore face a challenge to fully exploit the vast
volume of satellite data at these advanced temporal and horizontal spatial resolutions. On
the other hand, several limitations, which vary depending on the type of sensor, include the
restricted vertical resolution, the limited ability to sample below cloud tops, and the attenu-
ation of radiation in precipitating systems. Low-Earth-orbiting satellites provide very few
passes each day over any particular region. These deficiencies are exacerbated in hazardous
convective weather systems.
Hazard monitoring: Challenges and suggested foci. The design and implementation of
hydrometeorological, climate, and environmental observational networks at fine resolution
is expected to focus on urban and specialized environments (e.g., nuclear power stations,
dams; WMO 2019). Some examples of new augmentations are illustrated on the right panel
in Fig. 6. Key questions for future network design include: What needs to be observed:
the phenomenon, its environment, and/or its precursors? Where and when do the target
area and/or upstream regions need to be observed? Are multiple applications supported?
Several technical challenges remain, including the integration of multiple sources of mea-
surements and sharing of data and metadata. Three major challenges and suggested foci
are described here.
AMERICAN METEOROLOGICAL SOCIETY 0 2 1 E644
M A R C H| 2Downloaded
Unauthenticated 04/18/21 10:27 AM UTCSurface in situ monitoring. Crowdsourcing, professional networks, vehicles, and social media
contain vast amounts of information on the weather and its impacts, at a much higher density
than a decade ago, but their effective use depends on overcoming challenges in accessibility,
selection, quality control, and integration. High density is particularly needed in urban ar-
eas, where observations are influenced by the urban fabric, and so are only representative of
the immediate surroundings. The use of such unrepresentative data poses many challenges,
but urban models are now being designed to capture the characteristics of urban canyons,
green and blue spaces, and the built environment (Schoetter et al. 2017; Ching et al. 2018).
Unmanned aerial vehicles and cell phones have sensors that could be of value for monitoring
and forecasting. For winter weather, the observation of multiple precipitation types remains
a challenge.
Surface remote sensing.
While ground-based radar can potentially provide information
on humidity via refraction of fixed returns, complex processing is required. Microwave at-
tenuation using commercial cell phone links is an alternative or complement to radar rain
measurement, but data are proprietary and access is an issue. New services can benefit from
higher wavelength radars and lidars. Networks of cameras also offer the potential for analyz-
ing clouds, fog, and wind.
Satellite remote sensing. Challenges include the interpretation of data from heterogeneous
scenes, such as cloud-contaminated infrared. To augment the conventional satellite network,
relatively low-cost satellites such as CubeSats are increasingly being proposed for the obser-
vation and forecasting of high-impact weather events, potentially leading to a more compre-
hensive but less integrated and long-term space-based observing capability.
Observation-based nowcasting: Requirements and current status. While the WMO defini-
tion of nowcasting (WMO 2017) has evolved over the years from lead times from 2 to 6 h by
any method, it is generally viewed as primarily “observation-driven forecasting” (as opposed
to model-driven forecasting). Originally, nowcasting was synonymous with warnings of thun-
derstorm hazards, whose small-scale details were unable to be captured by numerical models.
Forecasters would first issue hazardous weather “watches” that used large-scale observations
and models to predict the environmental conditions conducive to the imminent development of
thunderstorms. Forecasters would then issue hazard “warnings” based, for example, on radar
pattern recognition and science-based conceptual models. Nowcasting has been extended to
precipitation predictions through the computer extrapolation of radar images. These are limited
to predictions of less than 2 h, as the small hazardous elements of most precipitating systems
such as tornadoes, hail, and heavy rain cores have very short life cycles (an exception being
supercell thunderstorms). In contrast, the larger and less hazardous synoptic-scale precipitat-
ing systems can be extrapolated for much longer periods of time, beyond 6 h. Also, nowcast-
ing systems have been developed to blend radar with model precipitation fields to attempt to
extend the lead time, with a goal to achieve the skill levels appropriate for issuing warnings.
At these very short ranges, forecasters and emergency managers are looking for definitive
information that enables fast and accurate decision-making. Due to the nature of hazardous
weather, the relevance of an observation to future events falls off rapidly with time, making
predictions highly perishable. This type of nowcasting has particularly focused on rapidly
developing hazardous weather such as convective storms, heavy rain, and strong winds
including tornadoes and downbursts, hail, and lightning. Specialized services for events (e.g.,
conventions, sports, terrorism) and applications (e.g., oil rig operations, concrete pouring,
port operations) use nowcasting methods that are often developed by the private sector to
address niche requirements.
AMERICAN METEOROLOGICAL SOCIETY
Unauthenticated 021 E645
M A R C H| 2Downloaded 04/18/21 10:27 AM UTCObservation-based nowcasting: Challenges and suggested foci. Numerical weather pre-
diction (NWP) on the synoptic and mesoscales is often capable of providing the information
required for issuing watches for precautionary and preparatory actions. Increased attention
is therefore now being directed toward the gaps in the capabilities to issue hazard warnings,
and to inform response and recovery actions. With a maturing capability of NWP to predict
convection, the key challenges and suggested foci in nowcasting are directed increasingly
toward rapidly developing storms and their hazardous weather elements.
Scale remains a major challenge. For example, damaging floods can be produced by
intense rain from a single stationary subkilometer storm. Detecting and highlighting that
possibility demands advanced observation processing and human interfaces to access the
relevant information quickly. Furthermore, the relationship between what can be observed
and the hazard that may result depends on a detailed knowledge of local topography, land
use, vegetation, and potential projectiles (parked cars, fallen trees, trash, temporary sediment
accumulations, etc.). Obtaining up-to-date information and integrating it into the NWP and
forecasting process at a sufficiently finescale is a major challenge. Process modeling is limited
in this area, which is a major opportunity for application of machine learning techniques.
The rapid development or intensification of high-impact weather and related hazards is
generally associated with nonlinear processes, characterized by rapidly growing uncertainty.
Another missing link is the physical mechanism to initiate convection. However, case-study
analyses have shown that there are often signals in the data (e.g., “fine lines” in the boundary
layer) that provide indications of future initiation that taps into the larger-scale environment
for development. Progress to date has largely depended on using these analyses to develop
empirical rules-based forecasting methods. Moving beyond this empirical approach will
require observation systems that can effectively observe these signals (e.g., highly sensitive
radars, lidar and radar networks that can detect the lowest levels of the atmosphere over
broad areas), assembly of multisensor datasets, and the use of data assimilation and new
approaches such as machine learning.
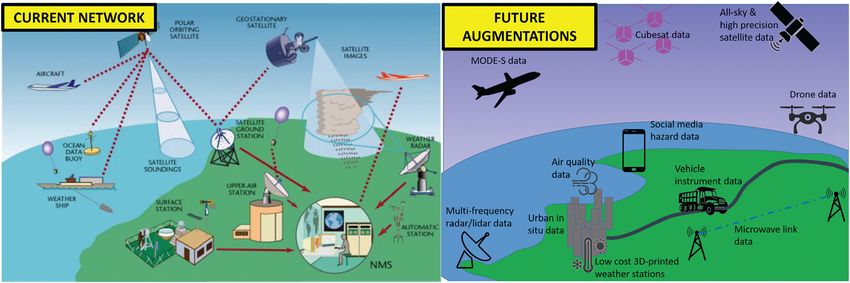
Multiscale data assimilation, ensemble prediction, and coupled hazard modeling
Forecast products from NWP systems have been routinely used in the preparation of high-
impact weather warnings, through providing information on the evolving large-scale situation
prior to the warning being issued. For example, warnings based on NWP have been in effect
for winter storms and tropical cyclones over several decades. More recently, warnings based
on NWP have been extended to include convective-scale weather (Stensrud et al. 2009). Much
of this progress has been enabled through successive improvements to the spatial resolution
of NWP models, with regional convection-permitting models now operating at a horizontal
grid spacing of 1–2 km. These models allow for the representation of (i) convective storms and
their associated hazards, (ii) the underlying topography and its interaction with near-surface
weather, (iii) smaller predictable spatial scales for very short-range forecasts, and (iv) inter-
action with small-scale ocean and land surface hazard processes. However, a considerable
gap remains between the practical predictability and intrinsic predictability for high-impact
weather systems. To close this gap and realize the benefits of improved model representa-
tions, focused efforts are required particularly in data assimilation, ensemble prediction, and
coupled modeling of the hazards.
Multiscale data assimilation: Requirements and current status. Data assimilation (DA)
blends together observational data with a “first guess” field, normally a short-range forecast
from a numerical model or ensemble, to provide the initial conditions for NWP. DA technique
development and applications have received considerable attention in recent years, especially
for convective and smaller scales, and new challenges are emerging.
AMERICAN METEOROLOGICAL SOCIETY
Unauthenticated 021 E646
M A R C H| 2Downloaded 04/18/21 10:27 AM UTCAdvances in producing accurate initial conditions down to the convective and even smaller
scales are necessary to address the challenges outlined in Table 1. Following initial efforts
by Lilly (1990), research into techniques to initialize convection-permitting models has pro-
duced encouraging results (Sun et al. 2014; Gustafsson et al. 2018). In parallel, the number of
observations available for assimilation on all scales is increasing, due in part to the growing
number of platforms and sensors, and also to continuous gains in computational power. Earlier
efforts in convective-scale DA needed to focus on reducing the model spinup, by producing
convective-scale analyses and through diabatic initialization. More recently, attention has
evolved to address the problem of multiscale DA, in recognition that the convective-scale infor-
mation can be quickly lost during the subsequent forecast without an accurate analysis across
the scales. Major operational centers throughout the world are now assimilating multiscale
data in convection-permitting regional NWP systems with 1–3-hourly rapid update cycles.
The ingredients of the data flow in such modern NWP and DA systems are summarized in
Fig. 7. Some recent advances are described in the next two paragraphs, with specific details
and references provided in Table 3.
Over the past two decades, there has been substantial progress in DA technique develop-
ment and applications on all scales. The 4DVar technique has demonstrated its capability
in global models, and more recently in convection-permitting models. In parallel, the en-
semble Kalman filter (EnKF) has come to the fore in research and operational NWP, again
at all scales. Recent research and operational DA development has centered on hybrid
ensemble–variational (EnVar) approaches that combine the benefits of the variational and
ensemble approaches. Several variants have been proposed using different blends of the
climatological background error covariance with the flow-dependent error covariance.
The benefits have been demonstrated for global models and coarse-resolution regional
applications, and more recently for convective-scale DA, although challenges remain.
However, the variational, EnKF, and hybrid techniques are usually reliable only when the
dynamics are quasi-linear. When the convective-scale physical processes are resolved with
a kilometer-scale model, the model prediction may manifest rapid nonlinear error growth,
Fig. 7. Outline of the data flow in a kilometer-scale rapid update prediction system. Very short-
range forecasts will be based on the latest observations or on the most recent NWP cycle. Longer
forecasts may use multiple NWP cycles to optimize ensemble spread.
AMERICAN METEOROLOGICAL SOCIETY
Unauthenticated 021 E647
M A R C H| 2Downloaded 04/18/21 10:27 AM UTCTable 3. Summary of recent advances in multiscale data assimilation, with key references.
Recent Advances: Multiscale Data Assimilation
Technique Capability Key References
Methodologies
Multistep DA Observations that sample different scales of motion are assimilated using Tong et al. (2016)
different cost functions and localization radii
Multiscale DA Systematic approaches via sophisticated localization related to observation Buehner and Shlyaeva (2015);
density, physical correlation length, model resolution, etc. Li et al. (2015)
EnKF convective-scale DA Applications of EnKF to convection-permitting models Tong and Xue (2005);
Bick et al. (2016)
4D variational (4DVar) DA 4DVar systems for synoptic-scale and convective-scale applications Rabier et al. (2000);
Li et al. (2018)
Ensemble–variational Blends of the climatology background error covariance (variational) with the flow Clayton et al. (2013);
(EnVar) DA dependent error covariance (ensemble-based) and applications to both synoptic Lu et al. (2017)
scale and convective scale
Particle filter Simulated radar observations assimilated within a local particle filter demonstrated Poterjoy et al. (2017)
the potential for producing probabilistic analyses of non-Gaussian variables,
such as hydrometeor mixing ratios
DA of ground-based sensors
Ground-based radar Convective-scale assimilation of radar radial velocity and reflectivity assimilation Ballard et al. (2012);
for high-impact weather prediction Sun and Wang (2013)
Dual-polarization radar Research on the potential of assimilating dual-polarization data to improve Li and Mecikalski (2012);
high-impact weather prediction Augros et al. (2018)
Lightning Assimilation of lightning flash rate on convection-permitting grids Fierro et al. (2012);
Dixon et al. (2016)
DA of airborne sensors
Aircraft radar Improved tropical cyclone intensity prediction by assimilating airborne radar Zhang and Weng (2015)
observations into a convection-permitting model using the 4DVar or EnKF DA method
Mode-S High-density wind and temperature data during takeoff and landing enabled Strajnar et al. (2015)
improved initialization of atmospheric structure
Convective-scale DA of space-based sensors
All-sky (cloudy) Assimilation of 5–15 min all-sky radiances from geostationary satellites to improve Honda et al. (2018);
radiance DA tropical cyclone and severe storm predictions Zhang et al. (2019a)
Convective-scale DA of combined remote sensors
Satellite and radar Assimilation of combined observations proved beneficial to severe storm prediction Zhang et al. (2019b)
compared with assimilation of a single type
Radar and lightning Assimilation of both observations in a 4DVar system significantly improved the Xiao et al. (2021)
structure and intensity of a local-scale convective system
and there are likely to be spurious model adjustments when a forecast is integrated from
the analysis created by an imperfect DA technique. An example of a nonlinear DA technique
is the particle filter, which uses ensemble members or “particles” to produce probabilistic
analyses of non-Gaussian variables such as hydrometeor mixing ratios. No assumptions
are made about the prior or posterior error distributions. While particle filters are compu-
tationally expensive, new approaches to improve their efficiency are being developed. A
localized particle filter (Poterjoy et al. 2017) assumes the dynamical system to be a set of
loosely coupled systems, which allows for the localization of the effect of observations and
therefore the number of required particles. A localized particle filter may produce more
physically consistent posterior members than the EnKF, leading to fewer spurious model
adjustments during forecasts.
AMERICAN METEOROLOGICAL SOCIETY
Unauthenticated 021 E648
M A R C H| 2Downloaded 04/18/21 10:27 AM UTCIn parallel with technique development, applications of DA on multiple scales have prolif-
erated in recent years. The most common research applications on convective scales involve
radar DA for high-impact weather prediction. In addition to ground-based radar measurements
of radial velocity and precipitation, airborne radar and dual-polarization Doppler radar obser-
vations have demonstrated promise in improving predictions of tropical cyclones and severe
weather. Research has also expanded to other types of observations, such as geostationary
satellite data. Historically, most satellite channels have been used only in clear-sky conditions.
Recent developments have led to the use of such data also in cloudy conditions, again with
applications to individual severe storms and tropical cyclones. Several studies using differ-
ent DA techniques and convection-permitting grids have also provided encouraging results
on the assimilation of lightning data. In addition to covering data-sparse regions between
radar networks, lightning data can detect rapidly growing cells within a convective system.
Another recent area of success is the use of mode-selective enhanced surveillance (Mode-S)
wind and temperature data from aircraft. The high density of these data during takeoff and
landing enables improved initialization of atmospheric structure over that available from
conventional observations only.
Multiscale data assimilation: Challenges and suggested foci. Creating high-resolution
analyses at O(1) km that contain multiscale information is a key challenge for the future
success of improved NWP for high-impact weather warning. For tropical cyclones, accurate
rainfall forecasts require the eyewall and rainband structures to be accurately initialized
in combination with the overall vortex dynamics. For severe convective storms, the three-
dimensional cloud structure must be initialized consistently with the dynamics of the cloud
and its environment. For topographically driven systems, the local response must be initial-
ized in balance with larger-scale forcing and the resolved topography. The challenge is not
just to produce an initial state that gives an accurate forecast, but one that evolves smoothly,
with minimal noise or spinup, so that very short-range forecasts can be used as input for
hourly cycling, for instance. Below we suggest four foci that can potentially lead to meeting
the challenge.
Integrated assimilation of multiple types of observations. Monitoring systems that are deployed
for different purposes, with different sensors, characteristics, and scales of motion, need to
be integrated to meet the needs of high-impact weather forecasting. For example, operational
radar networks sample wind and precipitation with less than 1 km horizontal resolution and
5–10 min temporal resolution, whereas radiosondes provide observations that are typically
hundreds of kilometers apart every 6 or 12 h, but with a very fine vertical resolution. Merging
these and other disparate datasets will require sophisticated DA systems at high resolution
that account for error characteristics of each technology, each sensor type, and each scale
of motion. The design of the monitoring network needs to take account of how this will be
achieved. Since most DA studies on the convection-permitting scale have evaluated the im-
pact of a single type of unconventional observation, new methods are needed to optimally
merge the high-resolution observations along with conventional observations. New types of
data include crowdsourced observations from professional observing sites with nonstandard
exposures and pressure observations from smart phones. The challenges of quality control
and of estimating observation errors are substantial, and much work remains to be done
before integrating these into routine operational application.
Quantifying observation, model, and DA uncertainties.
Diagnosing and understanding the
uncertainties in observations, convection-permitting model forecasts, and DA systems, es-
pecially those related to atmospheric convection, are necessary for future development of
AMERICAN METEOROLOGICAL SOCIETY
Unauthenticated 021 E649
M A R C H| 2Downloaded 04/18/21 10:27 AM UTCmultiscale DA. To optimally extract multiscale information from a mix of observation types,
not only their measurement errors but also their correlations, representativeness character-
istics, and information content must be understood and quantified. Furthermore, diagnosis,
understanding, and correction of multiscale forecast bias and noise is important in a rapidly
cycled system such that a true continuously cycled system can be built without requiring
periodical restarts.
Developing approaches for multiscale DA at O(1) km. The rapid nonlinear development of
convective storms and other kilometer-scale disturbances requires frequent updating (typi-
cally hourly) of the model forecast with assimilation of the latest observations. This requires
a smooth transition from initial state to forecast, with minimal noise or spinup bias. Methods
of addressing initialization noise in larger-scale models have included filters, penalty terms in
variational DA, and forms of diabatic initialization. Application to kilometer-scale prediction
is more challenging as the required balances are implicit in the local atmospheric structure,
rather than universally defined by geostrophic constraints. Whereas it is important to pro-
duce an initial analysis with small-scale balance to minimize spinup, the underlying large-
scale balance must not be compromised. Localization schemes capable of taking account of
multiple-scaled observation types, observation density, ensemble size, and flow-dependent
correlation length of the modeled flow need to be explored. The multistep DA approach, in
which observations with different spatial resolutions and temporal frequencies are assimi-
lated at different steps, also deserves further study. Since warning is a cascading process,
from longer lead times and larger regions to shorter lead times and specific locations, the
multistep approach offers flexibility in the use of DA techniques, selections of observation
types, grid resolution, and cycling frequency in each step depending on the desired applica-
tion. Nevertheless, experimental and theoretical studies are required to design such systems.
Development of advanced DA techniques for convective scale. The benefits of hybrid DA have
been demonstrated for global systems and implemented operationally. However, its application
in convection-permitting regional DA systems lags behind. More research is required to deal
with several issues pertaining to the convective scale in a hybrid system. Among them are
the selection of ensembles that can represent multiscale uncertainty of high-impact weather,
optimal design of rapid update cycles, multiscale covariance localization, improving estima-
tion of static background error covariance, and dealing with nonlinearity and non-Gaussianity
of clouds and precipitation. The utility of 4DVar multiscale DA should be further explored. In
addition to further examination of its role in hybrid EnVar DA, one of the key scientific ques-
tions deserving exploration is how to assimilate multiscale observations with varied lengths
of assimilation windows for different nonlinear outer loops. The encouraging recent results
of nonlinear filters such as the local particle filter for high-impact weather warrant further
studies for convective-scale DA.
Multiscale ensemble prediction: Requirements and current status. Several days ahead of
a high-impact weather event, NWP provides guidance on the potential for local weather in
a region. Examples include winter storm or tropical cyclone tracks, or whether heat waves
or pollution episodes will begin or continue. Less than 2 days ahead, the guidance ranges
from more deterministic for larger-scale weather systems (e.g., heat waves, fronts) to more
probabilistic for smaller scale short-lived systems (e.g., severe storms), while midlatitude and
tropical cyclones are intermediate in the sense of deterministically knowing that there is a
swath of large risk, but not its exact structure or impacts. While the forecaster is able to use
experience to judge the uncertainty qualitatively, high-impact weather forecasting requires a
quantitative uncertainty assessment, tying risks to specific locations (e.g., urban areas) and
AMERICAN METEOROLOGICAL SOCIETY
Unauthenticated 021 E650
M A R C H| 2Downloaded 04/18/21 10:27 AM UTCtimes. This requirement motivates the use of ensemble prediction systems (EPSs), which are expected to improve on the practice of a forecaster judging deterministic forecasts for their un- certainties. Features with sharp boundaries between hazardous and nonhazardous weather, such as severe storms and precipitating systems, are particularly challenging in this regard. An EPS produces a range of forecast scenarios that, taken together, can be used to predict the likelihood of a hazardous weather situation occurring or of a hazardous threshold being surpassed. Global EPSs were initially designed to capture uncertainties of synoptic-scale motions, and the more recently introduced stochastic parameterizations (Berner et al. 2017) can capture uncertainties on all resolvable scales including the mesoscale. Other ensemble perturbation methods continue to be designed and implemented. Global EPSs can also ex- ploit reforecasts, which can be used to diagnose model bias and statistically correct forecasts (Hamill et al. 2006). Convective-scale EPSs currently comprise regional models that capture phenomena including short-lived severe storms, bands of intense snow, or wind and rainfall distributions in tropical cyclones. Examples of some challenges are described below. Nonhydrostatic models run at convection-permitting scales (
remains a challenge and relies on experience with the model. Reforecasts may be applied to
CAM-based ensembles if the locations of extreme weather features are accounted for, which
will likely require alternative methods to point verifications. Reforecasts are also used in the
training of bias-corrected analog ensembles (Alessandrini et al. 2019).
   Ensemble forecasts of tropical cyclones are increasingly being used operationally, with
new ensemble-based techniques and products under development. The probabilistic skill of
ensemble-based track forecasts is improving (Titley et al. 2020), which is expected since the
track is largely determined by the synoptic-scale flow. Although the progress in ensemble
predictions of structure and intensity are lagging, several centers are now using downscaling
on demand in high-resolution prediction, where a single refined convection-permitting grid
follows a tropical cyclone nested within a coarser model. For example, NOAA’s Hurricane
Weather Research and Forecasting (HWRF) model employs moving 6 and 2 km grids around
the world. Other similar examples include the U.S. Navy’s COAMPS-TC, China’s GRAPES-
TC, and the Taiwan Central Weather Bureau’s TWRF. Recent research with a fixed regional
convection-permitting model by Short and Petch (2018) has also demonstrated improved
intensity forecasting, especially in periods of rapid intensification.
   Finally, even when ensemble predictions are available, the utilization and presentation of
probabilistic forecasts by forecasters is varied. Possible reasons include a lack of availability
of ensemble data or time to synthesize them under an operational timeline, or the unfamiliar-
ity that some forecasters, officials, and emergency managers may possess in communicating
and/or interpreting probabilistic output.

Multiscale ensemble prediction: Challenges and suggested foci
Surface interactions. While models at kilometer-scale have sufficient resolution, dynamics,
and physics to represent much hazardous weather, further work is needed to adequately
model the interaction between the surface (marine and land) and the internal cloud dynam-
ics and physics, particularly those aspects that remain unresolved. Computing advances
are making it possible to have focused grids in the 100–300 m scale over small regions of
interest, such as urban areas. For example, the United Kingdom’s Met Office is using a 100 m
grid domain over London (Lean et al. 2019), and Environment and Climate Change Canada
has tested 250 m over Vancouver (Leroyer et al. 2014). However, such models remain in the
gray zone where large turbulent eddies are resolved but smaller ones are not, and where the
heterogeneity and complexities of the surface topography and the urban built surface are at
scales comparable to the grid scale. Alternative approaches to downscaling include the use
of surface urban models instead of full atmospheric models, statistical downscaling (e.g., for
local heat islands or wind-prone urban canyons), and offline precomputation of scenarios
indexed to the larger-scale forcing (Speight et al. 2018).

Uncertainty quantification on kilometer scales. For weather features that are resolved by the
model, the uncertainty of the initial state and of the small-scale processes requires that any
prediction is accompanied by a quantitative estimate of uncertainty. While kilometer-scale
EPS can provide probabilities and give a better chance of capturing risks of extreme events,
obtaining an ensemble that spans the range of likely weather without excessive spread re-
mains a challenge. Interactions of storms with each other and with complex terrain (e.g., for
streamflow) is highly stochastic, regardless of the accuracy of initial conditions, and the chal-
lenge is to have enough ensemble members to represent the sources of uncertainty. Ensemble
spread is generated by perturbing the initial conditions, the lower boundary state, and the
model processes, within realistic ranges, but more research is needed to do this effectively at
kilometer-scale and to calibrate the resulting ensemble probabilities. A particular challenge at
kilometer-scale is to interpret an ensemble in which single members may contain forecasts of

AMERICAN METEOROLOGICAL SOCIETY
                                                                        Unauthenticated     021    E652
                                                                               M A R C H| 2Downloaded 04/18/21 10:27 AM UTC
You can also read