Characterization of discontinuities in potential reservoir rocks for geothermal applications in the Rhine-Ruhr metropolitan area (Germany) - Solid ...
←
→
Page content transcription
If your browser does not render page correctly, please read the page content below
Solid Earth, 12, 35–58, 2021
https://doi.org/10.5194/se-12-35-2021
© Author(s) 2021. This work is distributed under
the Creative Commons Attribution 4.0 License.

Characterization of discontinuities in potential reservoir
rocks for geothermal applications in the Rhine-Ruhr
metropolitan area (Germany)
Martin Balcewicz1,2 , Benedikt Ahrens3 , Kevin Lippert3,2 , and Erik H. Saenger1,3,2
1 Department   of Civil and Environmental Engineering, Bochum University of Applied Sciences,
Am Hochschulcampus 1, 44801 Bochum, Germany
2 Institute of Geology, Mineralogy, and Geophysics, Ruhr University Bochum,

Universitätsstraße 150, 44801 Bochum, Germany
3 Fraunhofer IEG, Fraunhofer Research Institution for Energy Infrastructures and Geothermal Systems,

Am Hochschulcampus 1, 44801 Bochum, Germany

Correspondence: Martin Balcewicz (martin.balcewicz@hs-bochum.de)

Received: 21 April 2020 – Discussion started: 6 May 2020
Revised: 20 November 2020 – Accepted: 20 November 2020 – Published: 13 January 2021

Abstract. The importance of research into clean and renew-        entation analysis indicated three dominant strike orientations
able energy solutions has increased over the last decade.         in NNW–SSE, NW–SE, and NE–SW directions within the
Geothermal energy provision is proven to meet both con-           target horizon of interest. This compacted limestone layer
ditions. Therefore, conceptual models for deep geothermal         (Massenkalk) is approximately 150 m thick and located at
applications were developed for different field sites regard-     4000 to 6000 m depth, dipping northwards at a dip angle of
ing different local conditions. In Bavaria, Germany, geother-     about 30 to 40◦ . An extrapolation of the measured layer ori-
mal applications were successfully carried out in carbonate       entation and dip suggests that the carbonate reservoir could
horizons at depths of 4000 to 6000 m. Matrix permeabil-           hypothetically extend below Essen, Bochum, and Dortmund.
ity and thermal conductivity was mainly studied in karsti-        Our combined analysis of the field and laboratory results
fied carbonates from the Late Jurassic reef facies. Similar       has shown that it could be a naturally fractured carbonate
to Bavaria, carbonates are located in the east of the Rheno-      reservoir. We evaluated the potential discontinuity network
hercynian Massif, in North Rhine-Westphalia (NRW), for            in the reservoir and its orientation with respect to the prevail-
which quantification of the geothermal potential is still lack-   ing maximum horizontal stress before concluding with im-
ing. Compared to Bavaria, a supraregional carbonate moun-         plications for fluid flow: we proposed focusing on prominent
tain belt is exposed at the Remscheid-Altena anticline (in        discontinuities striking NNW–SSE for upcoming geothermal
NRW) from the Upper Devonian and Lower Carbonifer-                applications, as these (1) are the most common, (2) strike
ous times. The aim of our study was to examine the po-            in the direction of the main horizontal stress, (3) have a
tential geothermal reservoir by field and laboratory investi-     discontinuity permeability that significantly exceeds that of
gations. Therefore, three representative outcrops in Wupper-      the reservoir rock matrix, and (4) only about 38 % of these
tal, Hagen-Hohenlimburg, and Hönnetal were studied. Dur-          discontinuities were observed with a calcite filling. The re-
ing field surveys, 1068 discontinuities (139 open fractures       maining discontinuities either showed no filling material or
without any filling, 213 joints, 413 veins filled with calcite,   showed debris deposits, which we interpret as open at reser-
and 303 fractures filled with debris deposits) at various spa-    voir depth. Our results indicate that even higher permeability
tial scales were observed by scanline surveys. These dis-         can be expected for karstified formations related to the reef
continuities were characterized by trace length, true spacing,    facies and hydrothermal processes. Our compiled data set,
roughness, aperture, and filling materials. Discontinuity ori-    consisting of laboratory and field measurements, may pro-

Published by Copernicus Publications on behalf of the European Geosciences Union.
36                           M. Balcewicz et al.: Geothermal potential of a carbonate reservoir in the Rhine-Ruhr region

vide a good basis for 3D subsurface modelling and numerical        reservoir permeability is obvious. Compared to the matrix
prediction of fluid flow in the naturally fractured carbonate      permeability of the host rock, the permeability of disconti-
reservoir.                                                         nuities is generally several orders of magnitude higher (e.g.
                                                                   Nelson and Handin, 1977; Kranz et al., 1979; Evans et al.,
                                                                   1997; Ahrens et al., 2018). Detailed discontinuity analysis
                                                                   is essential to model reservoir quality, optimal well location,
1    Introduction                                                  and well performance (Nelson, 2001). Field surveys are both
                                                                   the first and one of the most crucial steps in the exploitation
The Rhine-Ruhr metropolitan region in western Germany is           of the reservoir (van Golf-Racht, 1982; Agosta et al., 2010),
one of the largest metropolitan areas in Europe. It has the        i.e. the investigation of the discrete fracture network (DFN).
largest European district heating network (AGFW, 2009) and         Furthermore, since direct information on in situ properties
is one of the largest energy systems in the world that is pre-     is limited and inaccessible (e.g. seismic tomography or well
dominantly fed by fossil fuels (Klaus et al., 2010). In re-        and borehole data), outcrop characterizations and laboratory
cent decades, the Ruhr metropolitan area has been subject to       measurements can provide the basis for reservoir characteri-
structural changes associated with the ending of traditional       zation and the estimation of the potential reservoir behaviour
coal mining and steel industry, as well as accelerated ur-         under in situ conditions.
banization. Considering effective climate change, these pro-          In this integrated study, we examine the geothermal poten-
cesses pose local to global challenges for a post-fossil en-       tial of deep carbonates in the Rhine-Ruhr area by combin-
ergy future. The polycentric structure of the Rhine-Ruhr area      ing field and laboratory investigations of pre-existing discon-
is particularly promising for the requirements imposed by          tinuities and discontinuity networks at outcrop and sample
the energy transition (Wegener et al., 2019). To account for       scales. The combined analysis of field and laboratory mea-
the increasing demand for energy supply (e.g., Scheer et al.,      surements allows us to describe the potential carbonate reser-
2013; Araújo, 2014), the successful implementation of sus-         voir by characterizing its natural fracture systems. Three out-
tainable non-fossil energy concepts, such as geothermal en-        crop analogues on the eastern side of the northern Rhenoher-
ergy projects, is required (Fridleifsson et al., 2008; Goldstein   cynian Massif have been chosen for field survey and sample
et al., 2011).                                                     collection. All quarries are located within the Devonian Reef
   In recent years, many economically successful geother-          Complex. The dominant stratigraphic unit in those quarries is
mal energy projects in Bavaria, southern Germany, have             the Massenkalk facies from the Middle and Upper Devonian
been realized and could serve as a valuable model for the          (Krebs, 1970; Paeckelmann, 1979; Schudack, 1993). Dom-
Rhine-Ruhr area. The Bavarian part of the South German             inant discontinuity systems and different facies have been
Molasse Basin has a high hydrothermal energy potential             documented and sampled. Most of these measurements have
(Schellschmidt et al., 2010; Böhm et al., 2010; Stober, 2014;      been conducted by one-dimensional scanline surveys (Priest
Homuth, 2014), which can be extracted from pre-existing            and Hudson, 1976, 1981). Representative fresh rock samples
discontinuity and karst systems in deep carbonate rocks            have been taken directly from the outcrop wall and petro-
(e.g., limestone deposits Fritzer et al., 2010). Similar to        physically characterized by different laboratory methods.
deep Bavarian deposits, carbonate rocks were accumulated              In the following, we first introduce the geology of the De-
in western Germany. Geothermal systems aiming for compa-           vonian Reef Complex. We proceed by describing the out-
rable geological carbonate horizons in the Rhine-Ruhr area,        crops and the employed field and laboratory methods. Fol-
located at depths relevant for deep geothermal applications        lowing the presentation of the measurements results, we con-
(DEKORP Research Group, 1990), are promising solutions             clude by discussing the geothermal potential of the geologi-
to initiate the energy transition (Knutzen, 2017). A feasibil-     cal subsurface model, i.e. the deep carbonate layers and their
ity study including extensive subsurface reservoir character-      discontinuity systems.
ization and local geological site assessment is essential to
describe the hydrothermal potential of presumably fractured
and faulted carbonates in the Rhine-Ruhr area.                     2     Geology, outcrop investigations, and laboratory
   The estimation and description of individual discontinu-              measurements
ities and entire discontinuity networks in deep reservoirs is
of elementary importance when it comes to reservoir charac-        2.1    Geological setting: the Devonian Reef Complex
terization. Discontinuities and discontinuity networks have
a decisive influence on the fluid flow within the reservoir        The Rhenohercynian Massif is the northernmost mountain
(e.g. Odling et al., 1999) and also on its stability (e.g. Cappa   belt of Europe, which shows the results of the Hercy-
et al., 2005). They are typical observations at analogue out-      nian orogeny with its numerous northeast striking folds and
crops and can be measured there (see review by Bonnet et al.,      thrusts at the northern edge. During the early Devonian a pas-
2001). While the origin of these typically tectonically driven     sive continental margin developed south of Laurussia, which
discontinuities can be discussed extensively, the influence on     was affected by crustal thinning. A shelf sea formed above

Solid Earth, 12, 35–58, 2021                                                             https://doi.org/10.5194/se-12-35-2021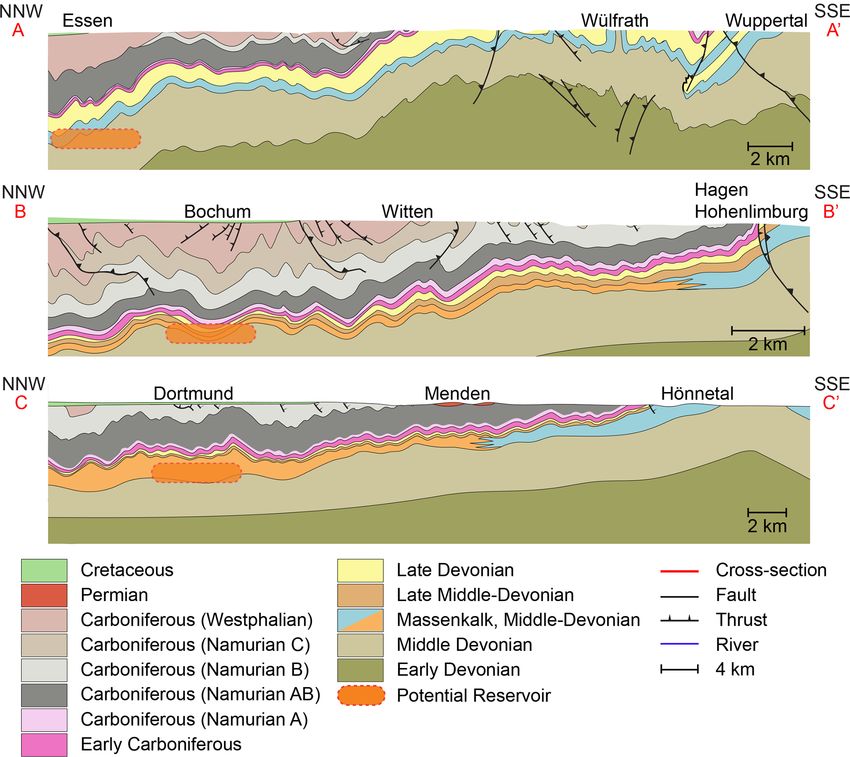
M. Balcewicz et al.: Geothermal potential of a carbonate reservoir in the Rhine-Ruhr region                                  37

the thin crust, which is called the Rhenish-Hercynian Basin.     (Fig. 1a). The outcrops in Osterholz, Oege, and Asbeck are
The shallow sea, which ranged from Brittany across Bel-          active open-pit mines and are driven by the following in-
gium to Germany, was filled with clastic shelf deposits and      dependent companies: Kalkwerke H. Oetelshofen GmbH &
carbonates from Laurussia. During the Early Devonian, the        Co. KG, Hohenlimburger Kalkwerke GmbH, and Rheinkalk
sedimentation in the offshore belt decreased, and the hori-      GmbH, respectively. The entrances of the three quarries are
zons are characterized by a transition from siliceous, deltaic   located at (1) 51.248219◦ N, 7.042342◦ E, (2) 51.347811◦ N,
shallow marine environments (Rhenish facies) to open ma-         7.581534◦ E, and (3) 51.400452◦ N, 7.842271◦ E (Fig. 3).
rine shale and purely limestone-dominated facies (Hercy-         In the following, the outcrops will be referred according
nian facies) (Krebs, 1970; Grabert, 1998; Pas et al., 2013;      to their geographical location: Wuppertal (WOH), Hagen-
Meschede, 2018). In the late Middle Devonian, the continued      Hohenlimburg (HKW), and Hönnetal (HLO).
northwestward movement favoured the growth of submarine             The Osterholz quarry in Wuppertal is located in the Os-
volcanic mounds and thus also that of carbonates and coral       terholz graben, which is limited by the Herzkamper syncline
and stromatoporoid reefs on the shelf (Jux, 1960; Grabert,       to the north and the Wupper river to the south (Fig. 1a). The
1998; Dallmeyer et al., 2013; Franke et al., 2017). Along the    regional geology is dominated by WSW–ENE-striking folds,
coast of Laurussia an elongated reef complex developed, the      which are associated with the Hercynian orogeny (Paeckel-
so-called Devonian Reef Complex (Krebs, 1970). In the Late       mann, 1979). This local tectonic regime was mainly affected
Devonian, the first coral reefs disappeared in the course of     by the Hercynian orogeny and became further compressed
the Late Devonian extinction (Kellwasser event), which was       by recent folding processes in the south. The stratigraphic
first favoured by a marine transgression and then by rapid       unit of the quarry Osterholz in Wuppertal is Upper Givetian
regression (e.g. Meschede, 2018).                                (approx. 382 Ma), primarily the Schwelm facies (according
   The Devonian Reef Complex extends over the area               to Krebs, 1970). The studied limestone layers, with a mean
from Neandertal (Düsseldorf) across Dornap, Wuppertal,           thickness of 1 to 5 m, showed greyish, compacted layers of
Schwelm, Hagen-Hohenlimburg, Letmathe, Sundwig, Iser-            well-bedded carbonates with corals, stromatoporoids, and
lohn, Hemer, and Balve (Fig. 1a). Furthermore, these hori-       bioclastic materials. This approximately 150 m thick hori-
zons can also be observed from drilling in northern Germany      zon sits on top of dolomitic carbonates and is related to the
(e.g. Fig. 2; Hesemann, 1965, Münsterland 1). During the         brachiopoda- and coral-rich series or stromatoporoid series.
Early Carboniferous, the sedimentation changed during the        The limestone bed boundaries show mechanical and fracture
closure of the Rhenohercynian basin. Primarily caused by         stratigraphy.
tipping blocks and faults, first greywacke turbidites and sec-      The regional tectonic structure is characterized by
ond a quartz-rich sandstone was deposited in the foreland.       the Remscheider anticline, the Ennepe thrust, and the
Marine regressions occurred due to the mentioned sediment        Großholthausener fault in Hagen-Hohenlimburg (Fig. 1a). In
deposits. This was followed by a gradual subsidence of the       the Remscheider anticline’s northern limb, where the stud-
bedrock. These periodic marine transgressions (i.e. sea level    ied quarry was set, the Hasper anticline and Voerder syn-
rises) and regressions (i.e. sea level falls) can be followed    cline are located. Both folds are monoclines, and their steep
in the Upper Carboniferous Ruhr sequences (cyclothems) in        limbs rapidly end when intersecting the regional strike–
today’s Rhine-Ruhr area. From the Lower Carboniferous on-        slip fault, the Großholthausener fault. The Oege quarry in
wards, the deposited sediments were compacted and folded         Hagen-Hohenlimburg is based in the eastern part of the
by the Hercynian orogeny. In the meantime, the thick sed-        Großholthausener fault. Krebs (1970), Flügel and Hötzl
iment accumulations (3 to 12 km) were thrusted by reacti-        (1976), and Koch-Früchtel and Früchtel (1993) character-
vated listric normal faults during the NW movement (On-          ized the local compacted limestone in the quarry Oege as
cken, 1997; Franke et al., 1990; Engel et al., 1983; Franke      Schwelm facies. The quarry is enriched in dolomite due to
and Engel, 1982; Holder and Leversidge, 1986; Meschede,          hydrothermal veins (von Kamp and Ribbert, 2005). These
2018). Between the Early Triassic and the Late Cretaceous        dolomitic carbonates manifest in a high degree of frac-
at least two further extension sequences developed, which        tured blocks and karst formations, which were filled by Ter-
caused a NE–SW-directed shortening (Brix et al., 1988;           tiary and Cretaceous sediments, respectively. The carbon-
Drozdzewski and Wrede, 1994). Since the Eocene, the com-         ates, which were untouched by the hydrothermal veins, con-
plex tectonic environment is affected by another extension       tain brachiopoda, bivalves, crinoids, corals, gastropoda, stro-
regime (Kley, 2013).                                             matoporoids and micrite. These carbonates are identified as
                                                                 Middle Devonian (Givetian according to Basse et al., 2016).
2.2   Study area                                                    The Asbeck quarry in Hönnetal is located to the north
                                                                 of the Remscheid-Altena anticline (Fig. 1a). The exposed
Three stone pits have been chosen for field studies within       compacted limestone deposits dip gently to the north and
the Devonian Reef Complex: (1) Osterholz stone pit, lo-          are surrounded by Lower Devonian sediments in the south
cated in Wuppertal; (2) Oege quarry, located in Hagen-           and Upper Devonian to Lower Carboniferous sediments to
Hohenlimburg; and (3) Asbeck quarry, located in Hönnetal         the north. The regional setting is dominated by NNW–

https://doi.org/10.5194/se-12-35-2021                                                           Solid Earth, 12, 35–58, 2021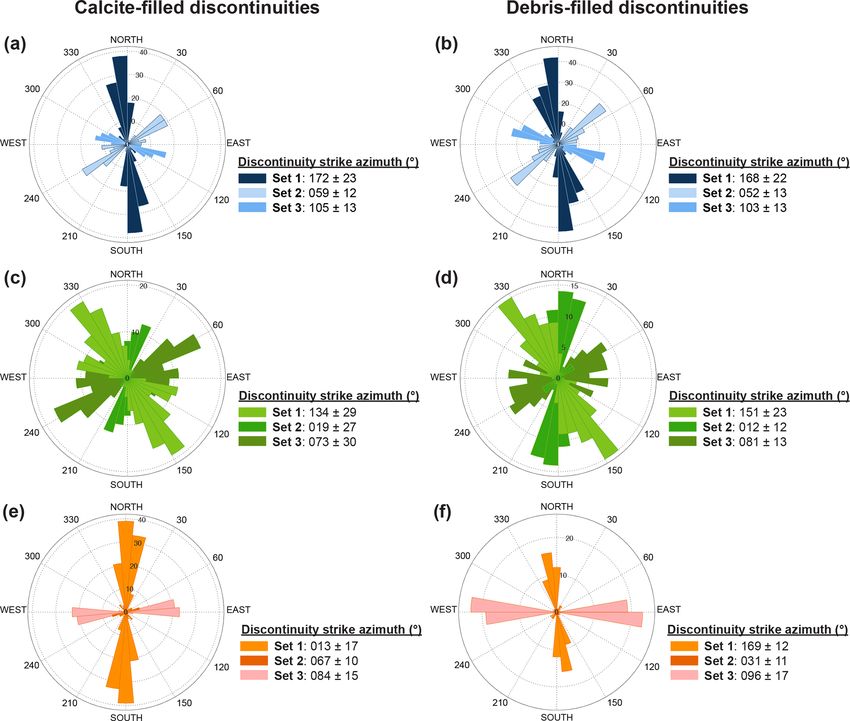
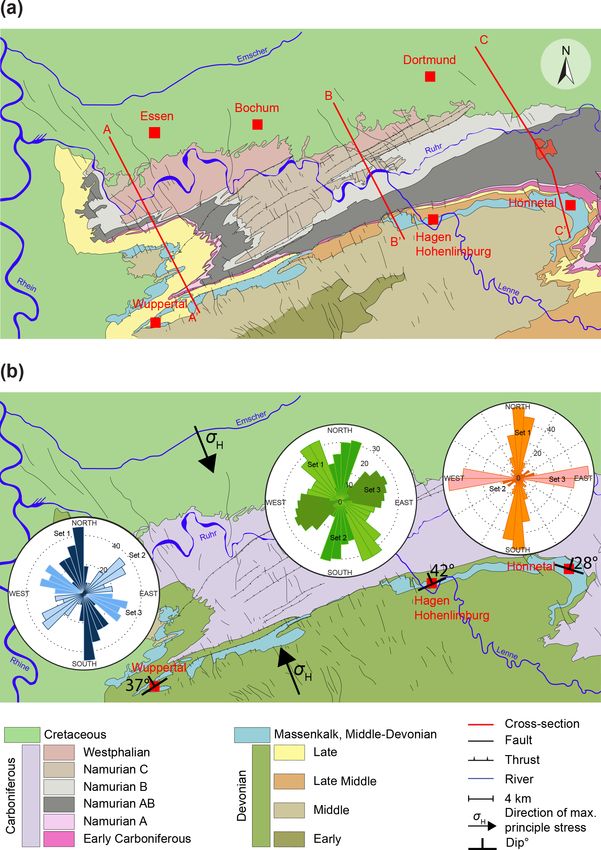
38                             M. Balcewicz et al.: Geothermal potential of a carbonate reservoir in the Rhine-Ruhr region

Figure 1. (a) Simplified geological map of the Rhine-Ruhr metropolitan area, Germany (modified from Jansen et al., 1986; Drozdzewski
et al., 2007). Here, three stone pits have been chosen for field surveys: Osterholz (Wuppertal), Oege (Hagen), and Asbeck (Hönnetal), which
are part of the Devonian Reef Complex (Massenkalk). The red lines indicate the three geological cross sections as shown in Fig. 2. In
panel (b), the geological map from panel (a) was further simplified, and in addition the rose diagrams of the discontinuity sets as measured
by scanline investigations at the quarries in Wuppertal (blue), Hagen-Hohenlimburg (green), and Hönnetal (orange) are added (for more
detail, see Figs. 4 to 6). The arrows indicate the direction of maximum horizontal stress σH according to the World Stress Map (Heidbach
et al., 2016). The specific directions and angles of incidence of the investigated, exposed limestone layers are also shown in panel (b).

SSE-striking strike–slip faults, which are associated with              most eastern part of the Remscheid-Altena anticline, the
the folding mechanics during Hercynian orogeny like the                 fold’s tip plunges in the NNE direction. The local stratig-
Großholthausener fault in Hagen-Hohenlimburg (Paeckel-                  raphy of the Asbeck quarry in Hönnetal consists of an ini-
mann, 1938). Those strike–slip faults can be tracked along              tial bank stadium (Schwelm facies) that developed into a
with the major Remscheid-Altena anticline structure. At the             true bioherm complex, i.e. Dorp facies (Becker et al., 2016).

Solid Earth, 12, 35–58, 2021                                                                    https://doi.org/10.5194/se-12-35-2021
M. Balcewicz et al.: Geothermal potential of a carbonate reservoir in the Rhine-Ruhr region                                           39

Figure 2. Simplified cross sections of the Remscheid-Altena anticline (modified after Jansen et al., 1986; Drozdzewski et al., 2007). The
exact position and orientation of the three cross sections is illustrated in Fig. 1a.

Schudack (1993) has investigated the different facies and              planes or schistosity planes in the field surveys. Neverthe-
cyclic depositions of the reef and back-reef lagoon facies             less, we distinguish between natural discontinuities, which
and subdivided these facies into six subfacies, which were             are associated with geological origins, and artificial discon-
investigated in more detail by Kloke (2007). The greyish,              tinuities, which result from anthropogenic processes (e.g.
highly compacted limestones (approx. 600 m thickness) con-             drilling, blasting, or excavation).
taining corals, stromatoporoids, and brachiopods are asso-                The discontinuities were recorded by a scanline sampling
ciated with late Middle Devonian (Givetian) or early Late              technique according to Priest and Hudson (1981). The ad-
Devonian (Frasnian). Except for some minor parts that were             vantages and disadvantages of this method have already been
mentioned by Kloke (2007), no dolomitic rocks were docu-               discussed in detail in several studies over the last few decades
mented.                                                                (e.g. Attewell and Farmer, 1976; Priest and Hudson, 1981).
   The mean bedding orientation in the quarries Wuppertal,             Based on our field observations, we simply assume that spa-
Hagen-Hohenlimburg, and Hönnetal is approximately 327,                 tially homogeneous discontinuity networks dominate in the
345, and 18◦ in dip direction, with an average dip angle               exposures, depending on the spatial observation scale. In re-
of about 37, 42, and 28◦ . Each stone pit’s working levels             gions with spatially heterogeneous discontinuity networks,
were approximately oriented perpendicular to each other and            however, more complex methods than the scanline sampling
strike NNW–SSE and NE–SW (Fig. 3).                                     technique are required for discontinuity characterization (e.g.
                                                                       Watkins et al., 2015). Following the study of Priest and Hud-
2.3   Field method and theoretical estimation: 1D                      son (1981), our paper focuses only on the most important
      outcrop scanline surveys and 2D discontinuity                    parts of this technique. The setting of a scanline survey is a
      connectivity                                                     tape line, which is fixed firmly to the exposed rock wall and
                                                                       shows a start and an endpoint. The length of a scanline can
The term discontinuity and its origin can be looked up in              range from a few decimetres to several metres. Estimates of
many textbooks on structural and engineering geology (e.g.             all possible error sources have shown that the number of mea-
Priest, 1995). In the following, we define a discontinuity as          sured and recorded discontinuities is more significant than
a weak zone within a rock mass that can be referred to as a            the length of the scanline (Priest and Hudson, 1981). There-
fracture, joint, vein, or fault. Unlike the International Society      fore, we selected representative, safe rock walls for each
for Rock Mechanics (ISRM, 1978), we neglect weak bedding               quarry where at least 30 measurable discontinuities (number

https://doi.org/10.5194/se-12-35-2021                                                                   Solid Earth, 12, 35–58, 2021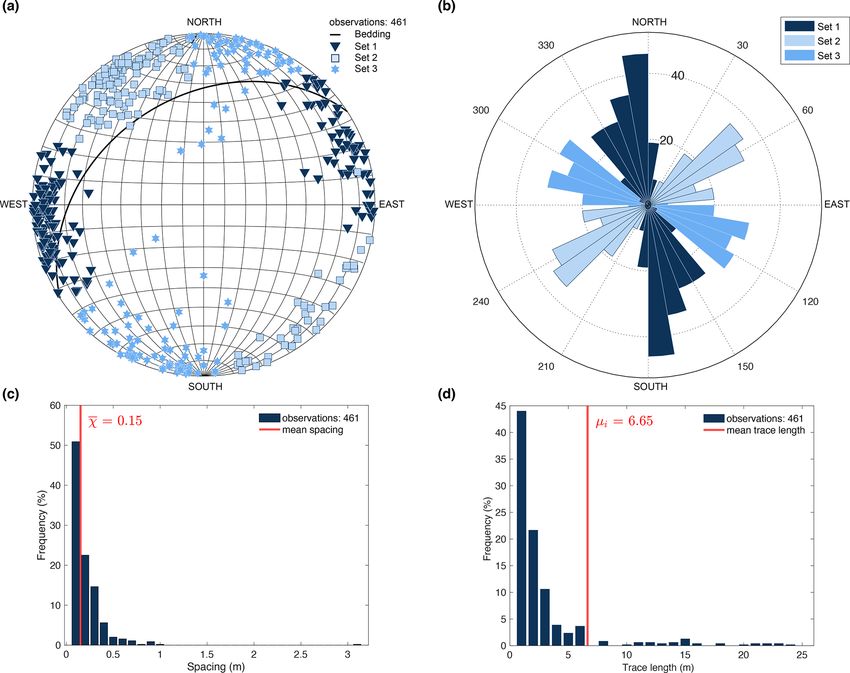
40                              M. Balcewicz et al.: Geothermal potential of a carbonate reservoir in the Rhine-Ruhr region

Table 1. Overview of the documented discontinuity properties and their classification as defined for scanline surveys (modified from
Markovaara-Koivisto and Laine, 2012). In our observations we distinguish between open, closed, and filled discontinuities. Open discon-
tinuities are those that are neither filled with calcite nor with debris. Closed discontinuities are in fact joints. Filled discontinuities are not
categorized as closed ones, since both discontinuity surfaces are not in direct contact with each other. Filled discontinuities can either be filled
with calcite or with debris (i.e. veins). The roughness of the discontinuities was classified on field scale (> 10−1 m) and on a mesoscopic
scale (6 10−1 m).

                                                                                           Class
               Property
                                                     1                 2                     3                   4
               Discontinuity type                    open              closed                filled              slickensides
               Ending type                           through-going     both ends visible     one end visible     neither end visible
               Roughness on field scale              smooth            slightly rough        rough               –
               Roughness on mesoscopic scale         smooth            slightly rough        rough               –
               Filling                               calcite           debris                –                   –

of discontinuity observations n ≥ 30) could be recorded. Af-                      and visual evaluation of wavelength measurements with
ter the tape line was fixed, the trend and plunge angles of the                   a tape line. The specified roughness classes correspond
tape line were measured. The trend angle reflects the orien-                      to the average roughness on the respective scale.
tation of the tape line (αS = 0◦ ≡ north; αS = 180◦ ≡ south),
which corresponds to the strike of the rock wall. The tape’s                   5. Aperture. Aperture is the perpendicular distance be-
line levelling is defined by the angle of plunge (approx.                         tween adjacent rock walls of a discontinuity where the
0◦ ≤ βS ≤ 15◦ ). After the tape line was installed, each dis-                     space between them is filled with a material, i.e. filling.
continuity that intersected the tape line was recorded and cat-                   The determined values correspond to the mean aper-
egorized according to the following six properties (see also                      tures determined by geometric (qualitative) analysis of
Table 1):                                                                         the respective total discontinuity lengths.

  1. Intersecting distance. The intersecting distance corre-                   6. Filling. Filling is the material that separates the adjacent
     sponds to the distance between each intersecting discon-                     rock wall of a discontinuity and is usually weaker than
     tinuity and the fixed starting point of the tape line.                       the parent rock. In our study, typical filling materials
                                                                                  are calcite, clay, or debris. These include thin mineral
  2. Discontinuity length. The installed tape line and the in-
                                                                                  coatings and healed discontinuities such as quartz and
     tersecting discontinuity meet at an intersecting point.
                                                                                  calcite veins.
     The trace length above and below the tape towards the
     discontinuity tips indicates the length of the disconti-                  In spite of the above-mentioned records, it must be em-
     nuity. If both tips exceed the rock wall height, the dis-              phasized again how important the calculation of the inter-
     continuity is recorded as “through-going”. Accordingly,                secting angle is. Due to an irregular outcrop wall, the dis-
     discontinuities of which one or both ends are visible are              tance between the starting point and the recorded discontinu-
     categorized as “one end visible” or “both ends visible”.               ity (i.e. apparent spacing) is measured incorrectly. This ap-
     On rare occasions, neither end can be recorded, and thus               parent distance distorts the true orientation of the discontinu-
     the discontinuity is documented as “neither end visi-                  ity. The true angle δ between the scanline orientation (trend
     ble”.                                                                  and plunge) and the normal to recorded discontinuity was
                                                                            calculated according to
  3. Orientation. The dip and dip direction of the intersect-
     ing discontinuities were recorded.
                                                                            δ = arccos (cos (αn − αs ) cos (βn ) cos (βs )
  4. Roughness. Roughness is the inherent alignment and                       + sin (βn ) sin (βs )) ,                                          (1)
     waviness of the surface at the mean level of a dis-
     continuity. A large-area waviness may also alter the                   where αs , βs , αn , and βn denote the trend direction of the
     dip locally. All roughness measurements were recorded                  tape line (scanline), the plunge direction of the tape line with
     manually. Therefore, we distinguish between “smooth”,                  regard to trend orientation, and the dip direction and dip of
     “slightly rough”, and “rough”, both on mesoscopic and                  the normal to the discontinuity, respectively. Further, the true
     field scales. On the mesoscopic scale, the discontinu-                 angle δ and the apparent spacing χs between two discontinu-
     ity surfaces were analysed for mineral steps, stylolites,              ities were used to calculate the true spacing assuming a ho-
     or plumose structures. On the field scale, the discontinu-             mogeneous discontinuity pattern χr = cos(δ)χs . By evaluat-
     ity roughness was determined by subjective (qualitative)               ing the ratio of true discontinuity spacing χr and the number

Solid Earth, 12, 35–58, 2021                                                                             https://doi.org/10.5194/se-12-35-2021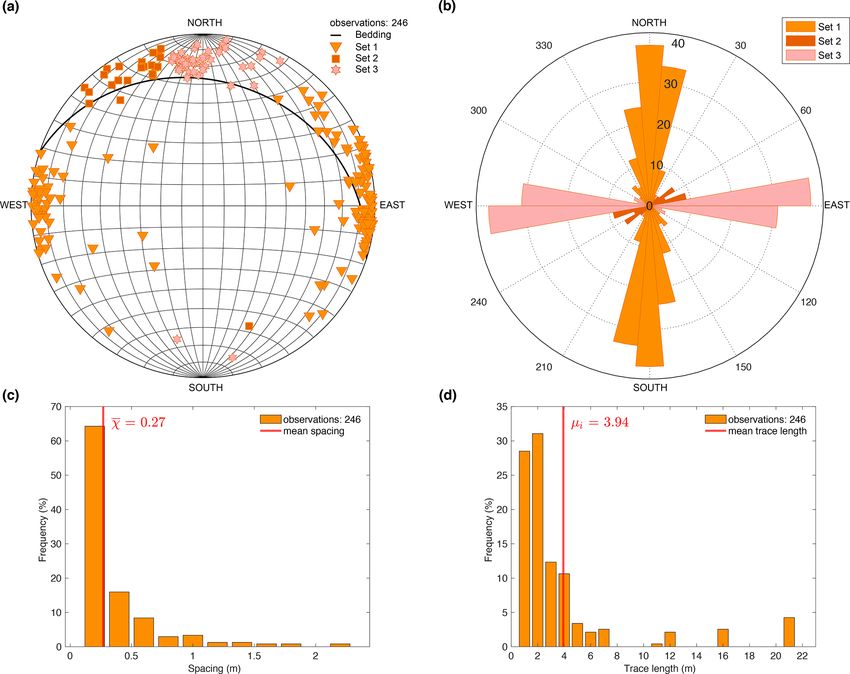
M. Balcewicz et al.: Geothermal potential of a carbonate reservoir in the Rhine-Ruhr region 41
of discontinuity Pobservations, the mean discontinuity spac-
ing χ = λ−1 = ( χr )n−1 was determined, where λ denotes
the discontinuity frequency. The evaluation of the mean dis-
continuity track length with respect to the required accuracy
has already been discussed in detail by Priest and Hudson
(1981). The authors have made various suggestions when the
end of a discontinuity trace on an investigated rock wall may
not be visible, for example, due to geological events or an-
thropogenic processes. In our study, the proposed solution
for censored semi-trace length sampling was adopted to eval-
uate the mean discontinuity track length µi . If the distribu-
tion of trace length over the recorded rock wall follows a
power-law distribution, then the frequency f (l) is given by
f (l) = λe−λχ . Following the approach of Priest and Hudson
(1981), for censored semi-trace length analysis, the mean dis-
continuity trace length was determined according to
−1
µi −1 = µ−1 − ce−µc 1 − e−µc ,
(2)
where µ and c denote mean population frequency and con-
cealed trace length of the recorded discontinuity, respec-
tively. Typically, the concealed trace length is an order of
magnitude smaller than the recorded trace length. Note that
discontinuities exceeding the height of the outcrop wall could
be detected at the nearest level above and/or below the
quarry.
In addition, the simplified 2D discontinuity connectivity
of discontinuities aligned perpendicular to the examined out-
crop face, i.e. the average number of discontinuity intersec-
tions per discontinuity P , was estimated for each opencast
mine according to Ozkaya (2011)
n
X n
X n
X
dk−1
P= dk dj Lj sin 1θj k , (3)
k k j 6 =k
where 1θj k , dj , and Lj denote the angle between the average
striking directions of two discontinuity sets j and k, the num-
ber of discontinuities per total scanline length (i.e. discon-
tinuity density), and the mean discontinuity length of each
discontinuity set, respectively. In each outcrop we encoun-
tered three sets of discontinuities (n = 3) in the respective
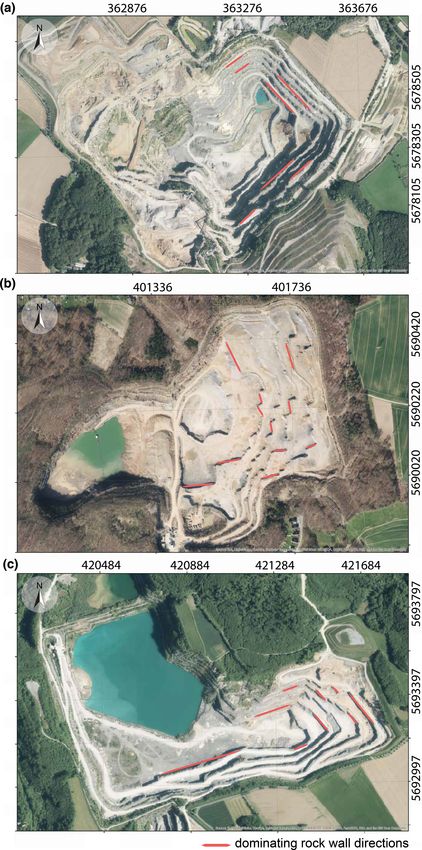
Figure 3. Map view of all three study areas in which scanline sur- investigated carbonate layers. Therefore, the average discon-
veys were carried out: (a) the Osterholz stone pit, which is oper-
tinuity connectivity P of each exposed carbonate layer was
ated by Kalkwerke H. Oetelshofen GmbH & Co. KG in Wupper-
tal; (b) the Oege stone pit, operated by Hohenlimburger Kalkw-
estimated on the basis of three average discontinuity densi-
erke GmbH in Hagen-Hohenlimburg; (c) the Asbeck rock mine, ties and mean discontinuity lengths.
managed by Lhoist Deutschland, Rheinkalk GmbH in Hönnetal. The recorded discontinuities were evaluated with MAT-
Red lines indicate the predominant rock walls, i.e. the direction LAB (2018) following Hudson (2005) and Markovaara-
of the mining. In each of the three outcrops there were two dom- Koivisto and Laine (2012). Markovaara-Koivisto and Laine
inant mining directions, which were approximately perpendicu- (2012) developed an open-source MATLAB code for the vi-
lar to each other. This figure was created using ArcGIS® soft- sualization of scanline survey results that was adapted to the
ware by Esri (Basemap, World Imagery: http://www.arcgis.com/ purpose of this study. All measurements were recorded ac-
home/item.html?id=10df2279f9684e4a9f6a7f08febac2a9, last ac- cording to the metric system of measurement.
cess: 24 March 2020). © ArcGIS and ArcMap™ are the intellectual
property of Esri and are used herein under license. © Esri. All rights
reserved. For more information about Esri™ software, please visit
http://www.esri.com (last access: 24 March 2020).
https://doi.org/10.5194/se-12-35-2021 Solid Earth, 12, 35–58, 2021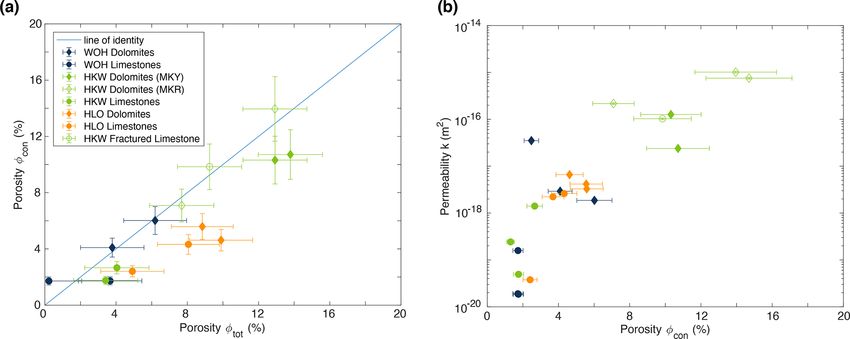
42 M. Balcewicz et al.: Geothermal potential of a carbonate reservoir in the Rhine-Ruhr region
2.4 Laboratory measurements: petrophysical moved along the sample at a fixed distance. The emitted light
characterization of samples and heat radiation are focused on the sample’s surface, which
heats up the sample pointwise. To ensure absolute absorp-
During the fieldwork, loose rock blocks were taken in each tion of the energy, a part of the sample, usually a strip, was
quarry for further petrophysical characterization. Compacted painted black. Furthermore, it was ensured that the samples
limestones, dolomites, and red dolomitic rocks were named for thermal conductivity measurements meet the geometri-
MKB (black Massenkalk), MKY (yellow Massenkalk), and cal requirements for sample size in order to reduce boundary
MKR (red Massenkalk), respectively. After sampling, the effects. Infrared temperature sensors are located at a fixed
rocks were named according to the sampled quarry, sampled distance from the emitter (lead sulfide infrared receiver) and
working level, rock type, and sample number. Representative measure the sample’s temperature difference before and after
cylindrical cores with a diameter of 40 mm were extracted heating. The thermal conductivity was determined by com-
from each of these blocks by diamond core drilling per- parison with known standards. In this study, we used the
pendicular to the bedding direction. All samples were saw- standards of quartz (κqtz = 1.35 W (m K)−1 ) and titanium al-
cut perpendicular to the core axis and their end faces were loy (κTi = 6.05 W (m K)−1 ). According to the manufacturer
ground square to the maximal possible length l. All steps of (Lippmann and Rauen GbR; TCS no. 2010-013), the deter-
the preparation were conducted with water as coolant and mination of thermal conductivity is subject to an absolute er-
for rinsing removed material. Following preparation, samples ror of approximately 3 %.
were oven-dried at 60 ◦ C for about 48 h. Basic petrophysical Permeability k of the samples was determined using
properties were determined on identically prepared samples Darcy’s law (Darcy, 1856) and a conventional Hoek cell
at ambient conditions, except permeability, which was de- (Hoek and Brown, 1997) to apply the axial load, pore-fluid
rived under elevated pressures. pressure, and confining pressure. Axial pistons and the pre-
Bulk density ρgeo was calculated from the geometrical vol- saturated samples were jacketed by a rubber tube to prevent
ume of the cylindrical samples and their dry masses. Grain oil from penetrating the sample, i.e. a connection between
density ρgrain was gained from pycnometer measurements on confining and pore pressure. In addition, confining and pore-
rock powder, produced by crushing and grinding of leftover fluid pressure were kept below the axial pressure. A hand
rock fragments, in compliance with the German (NABau, pump was operated, supplying the axial load (12 MPa). A
2011) standard. By evaluating the ratio between bulk and computer-controlled, high-pressure metering pump was used
grain density, the total porosity was determined according to apply confining pressure on the sample by compressing
to φtot = 1 − (ρgeo /ρgrain ). The connected porosity, i.e. the distilled water (10 MPa). The axial pore-fluid flow was en-
externally accessible and connected pore volume, was deter- sured through central bores in the axial loading pistons. Dis-
mined using the difference of the masses of dry and saturated tilled water was pumped from a water reservoir through the
samples with distilled water (see Duda and Renner, 2013). lower end face of the samples either by applying constant
Ultrasonic P- and S-wave velocities, vP and vS , were de- flow rates (0.001 to 0.15 L h−1 ). The lower axial loading pis-
termined on dry and saturated samples from first-arrival mea- ton was equipped with an outlet pipe discharging fluid pres-
surements using an ultrasound benchtop unit composed of sure to the atmosphere (i.e. 100 kPa). The temperature and
a waveform generator, two identical broadband ultrasound pressure of the pore fluid were measured to calculate the
sensors (1 MHz centre frequency and 0.5 in., i.e. 12.7 mm, temperature- and pressure-dependent fluid viscosity, accord-
diameter), and a digital storage oscilloscope (200 MHz sam- ing to Wagner (2009). Each permeability of the samples cor-
pling frequency). Measurements were performed parallel to responds to the arithmetic mean value of all experiments con-
the cylinder axis, i.e. the drilling direction. Velocities were ducted with various flow rates for steady-state fluid flow con-
calculated by dividing the sample length by the determined ditions.
arrival times, less the assembly parts’ travel time. Drained
dynamic Young’s modulus Ẽd and Poisson’s ratio ν̃d were
calculated by dry P- and S-wave velocities, vP,dry and vS,dry , 3 Results
and bulk density assuming isotropy (see Mavko et al., 2020).
Moreover, saturated P- and S-wave velocity, vP,sat and vS,sat , 3.1 Field discontinuity observations and discontinuity
and the density of the fluid-saturated sample was used to cal- connectivities
culate undrained Poisson’s ratio ν̃ud and Young’s modulus
Ẽud , assuming isotropy and employing Gassmann’s hypoth- A total of 1068 discontinuity observations were recorded and
esis (Gassmann, 1951) that S-wave velocity remains unaf- classified (e.g. discontinuity type, filling, and roughness) by
fected by the presence of a fluid (vS,dry = vS,sat ). using the field surveys in the three outcrops in Wuppertal,
Thermal conductivity κdry of the dry sample cores was de- Hagen-Hohenlimburg, and Hönnetal (Table 2). To map all
termined by a thermal conductivity scanner using an optical the features of the outcrop, we decided to carry out surveys at
scanning method at ambient conditions (Popov, 1997). The different levels of the quarry. During the field observations in
scanner consists of an emitter and a measuring unit that is Wuppertal, scanline surveys were taken in two orientations:
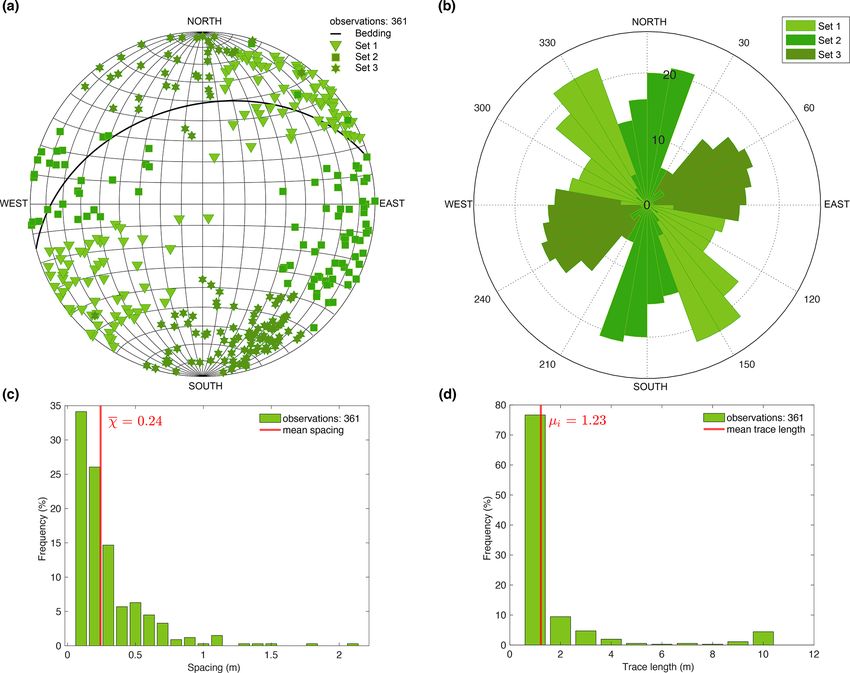
Solid Earth, 12, 35–58, 2021 https://doi.org/10.5194/se-12-35-2021M. Balcewicz et al.: Geothermal potential of a carbonate reservoir in the Rhine-Ruhr region 43 NNW–SSE and NE–SW (Fig. 3a). In contrast, the scanline 8 times higher in Wuppertal (P = 21.42) than in the other investigations in Hagen-Hohenlimburg and Hönnetal were outcrops at Hagen-Hohenlimburg (P = 3.71) and Hönnetal conducted on two exposed rock faces, each with the ori- (P = 2.49). entations NNW–SSE and ENE–WSW (Fig. 3b, c). Compa- rable scanline surveys over total lengths of 66.60, 76.15, 3.2 Laboratory characterizations and 62.76 m were measured in Wuppertal (461 discontinu- ities), Hagen-Hohenlimburg (361 discontinuities), and Hön- Samples could be obtained from all outcrops of dolomitic netal (246 discontinuities), respectively. It was found that in carbonates and limestone rocks, although it was challeng- all quarries the majority of the discontinuities were filled (Ta- ing to obtain samples from the Hönnetal due to the lack ble 2). In Wuppertal most of the discontinuities were filled of revealed outcrops. Most of the exposed Hönnetal lime- with debris, whereas in the other two outcrops calcite was stone rocks were purely calcitic and showed a low grade the dominant filling material. In general, most of the ends of of dolomitization. Nevertheless, some dolomitic carbon- all discontinuities were visible on the outcrop wall. On the ates have been sampled. Dolomitic carbonate samples from field scale the discontinuities had a smooth roughness and on Hagen-Hohenlimburg occurred as highly fractured rocks a smaller (mesoscopic) scale they were slightly rough. The with karst and highly porous formations, ranging from a few mean discontinuity trace lengths clearly differed between the millimetres to several centimetres. outcrops, so that the largest one was determined in Wuppertal The mean bulk densities of the samples retrieved from the with 6.65 m and the smallest in Hagen-Hohenlimburg with outcrops in Wuppertal, Hagen-Hohenlimburg, and Hönnetal 1.23 m. The mean discontinuity spacing of the quarries were were 2704 ± 39, 2537 ± 128, and 2620 ± 46 kg m−3 , respec- all in the same order of magnitude, amounting to 0.15, 0.24, tively (Table 4). These mean values were determined inde- and 0.27 m in Wuppertal, Hagen-Hohenlimburg, and Hön- pendently of whether they were limestone rocks or dolomitic netal, respectively. carbonates. In Wuppertal and Hagen-Hohenlimburg, one Three sets of discontinuity orientations were predominant dolomitic carbonate sample was investigated in each case in all outcrops (Table 3). In Wuppertal the sets were grouped that differed significantly from the other samples and was into the arithmetic mean discontinuity azimuth directions not included in the calculation of the mean bulk densi- of strike 172◦ (181 discontinuities), 55◦ (142 discontinu- ties. Taking into account the measurement uncertainty and ities), and 105◦ (138 discontinuities) (Fig. 4c, d; Table 6). standard deviation, all samples examined showed compara- In contrast, the discontinuity sets in Hagen-Hohenlimburg ble densities. A similar trend was observed for the mean and Hönnetal were oriented towards 135◦ (134 discontinu- grain densities, as these values are also very close together. ities), 12◦ (95 discontinuities), and 75◦ (132 discontinuities) The mean grain densities of the samples from Wuppertal, and 176◦ (140 discontinuities), 65◦ (24 discontinuities), and Hagen-Hohenlimburg, and Hönnetal amounted to 2801 ± 51, 87◦ (82 discontinuities), respectively (Figs. 5c, d; 6c, d; Ta- 2777 ± 41, and 2848 ± 32 kg m−3 , respectively. ble 6). The dip angles of the discontinuities were documented Laboratory measurements to determine the total and con- as very steep, i.e. between 80 and 90◦ (dip) in all three quar- nected porosities indicated that the dolomitic carbonates in- ries (Table 3). By further differentiating the strike directions vestigated were significantly more porous than the lime- of the classified discontinuity sets according to their filling stones. This trend was evident at all quarries. On average, material, no strike rotation between calcite- and debris-filled the volumetric proportion of pores in the dolomitic carbon- veins and fractures was identified (Fig. 7). Besides, sev- ates was twice as high as in the limestones among almost all eral generations of repeated cracking and sealing were ob- samples. Our uncertainty analysis showed no significant vol- served that were located within the recorded veins in Hagen- ume of isolated pores, and pre-existing cracks could be deter- Hohenlimburg. A precise analysis of the individual vein gen- mined in the investigated samples. Considering the measure- erations is currently the subject of recent studies and could ment uncertainties, the total and connected porosities over- not be provided within the scope of this study. lapped (Fig. 8a). The statistical analysis of the three subdivided sets from Ultrasound P- and S-wave velocities of the dry samples Wuppertal and Hagen-Hohenlimburg showed that although ranged between 3000 and 6500 and 1300 and 3500 m s−1 , re- the mean discontinuity lengths differed significantly, the dis- spectively (Table 4). Regardless of the outcrop, it was shown continuity densities were comparable (Table 6). In Wuppertal that the dry P-wave velocities of the limestones tended to and Hagen-Hohenlimburg the discontinuity densities ranged be 1000 to 1500 m s−1 higher than those of the dolomitic from about 2.00 to 2.75 and 1.25 to 1.75 m−1 , respectively. carbonates. The Wuppertal samples have shown that the Only in Hönnetal were clear differences in both mean dis- dolomitic carbonates and limestones cannot be distinguished continuity lengths and discontinuity densities found between according to the S-wave velocities (Table 4). Both rock types the three sets of discontinuities. Here, the mean discontinu- had comparable S-wave velocities. The samples of the re- ity length and the discontinuity densities amounted to 4.51, maining outcrops showed a clear difference in S-wave veloc- 5.57, and 2.85 m and 2.23, 0.38, and 1.31 m−1 , respectively. ities between dolomitic carbonates and limestone. In Hagen- The identified 2D discontinuity connectivity was about 6 to Hohenlimburg and Hönnetal the S-wave velocities of the https://doi.org/10.5194/se-12-35-2021 Solid Earth, 12, 35–58, 2021
44                            M. Balcewicz et al.: Geothermal potential of a carbonate reservoir in the Rhine-Ruhr region

Table 2. Overview of the recorded properties and their classification of the measured discontinuities in the three studied outcrops in Wup-
pertal, Hagen-Hohenlimburg, and Hönnetal. See the text and Table 1 for a detailed description of the classes.

                                                                                           Class
                       Outcrop                  Property                                                      Total
                                                                                    1      2       3     4
                                                discontinuity type                129    110    113    109     461
                                                ending type                         4    356     93      8     461
                       Wuppertal                roughness at field scale          354     81     26      –     461
                                                roughness at mesoscopic scale     159    250     52      –     461
                                                filling                           116    154      –      –     270
                                                discontinuity type                 86     52    156     67     361
                                                ending type                        20    300     37      4     361
                       Hagen-Hohenlimburg       roughness at field scale          194    116     51      –     361
                                                roughness at mesoscopic scale      77    184    100      –     361
                                                filling                           160     98      –      –     258
                                                discontinuity type                 51     51    121     23     246
                                                ending type                        29    116     96      5     246
                       Hönnetal                 roughness at field scale          216     26      4      –     246
                                                roughness at mesoscopic scale      55    155     36      –     246
                                                filling                           137     51      –      –     188
                                                discontinuity type                266    213    390    199    1068
                                                ending type                        53    772    226     17    1068
                       all outcrops             roughness at field scale          764    223     81      –    1068
                                                roughness at mesoscopic scale     291    589    188      –    1068
                                                filling                           413    303      –      –     716

limestones were about 500 to 1000 m s−1 higher than those               dolomitic carbonates from Hagen-Hohenlimburg are the
of the dolomitic carbonates. These differences were also ap-            highest and averaged to about 4.27 × 10⁻¹⁶ m2 . The Hagen-
parent in the drained dynamic Young’s moduli (Table 4).                 Hohenlimburg limestones were, on average, about 3 orders
The mean drained Young’s moduli of the limestone and the                of magnitude less permeable than the limestones. The dif-
dolomitic carbonates amounted to about 60 and 70 GPa, re-               ferences in permeability between dolomitic carbonates and
spectively. The mean drained Poisson’s ratio, that is, the              limestone samples amounted to approximately 2 orders of
relative relationship between P- and S-wave velocities, is              magnitude in Wuppertal. In contrast, dolomitic carbonates
about 0.35 for both rock types. Upon saturation, P-wave                 and limestones in Hönnetal showed similar permeabilities of
velocities of the samples collected in Wuppertal, Hagen-                the same order of magnitude, that is, permeabilities in the
Hohenlimburg, and Hönnetal increased by up to 4 %, 11 %,                range of 10−18 m2 . Only one sample from Hönnetal was low
and 14 % on average. This increase was also apparent in the             permeable (permeability of about 4 × 10⁻²⁰ m2 ), but here the
undrained Poisson’s ratios. The undrained Young’s moduli                associated connected porosity was also significantly smaller
hardly differ from the drained ones (Table 4).                          than that of the comparative samples.
   The thermal conductivity measurements showed similar
results for limestones as for dolomitic carbonates. However,
a slight scattering can be observed. The dolomitic carbonate            4   Discussion
samples from Wuppertal were an exception, as these samples
showed relatively high thermal conductivities that exceeded             The discontinuities of deep carbonates in the Rhine-Ruhr
those of the limestones. On average, the highest and lowest             area were characterized and described using outcrop scanline
conductivities could be determined on the Wuppertal and the             surveys. In addition, the results of laboratory investigations
Hagen-Hohenlimburg samples, respectively. Measured ther-                of density, porosity, dynamic elastic moduli, thermal conduc-
mal conductivities of all samples varied between 1.10 and               tivity, and permeability of the collected representative rock
3.40 W (m K)−1 .                                                        samples of the Devonian Reef Complex were presented. In
   The permeabilities measured correlated as expected with              the following, we correlate the field and laboratory investiga-
the corresponding porosities, i.e. a permeability increase              tions and address the geothermal potential of these deep car-
with an increasing proportion of connected pore volume                  bonates in the Rhine-Ruhr region. We focus our results of the
(Fig. 8b; Table 4). The measured permeabilities of the                  DFN on discontinuity length, density, orientation, and aper-

Solid Earth, 12, 35–58, 2021                                                                   https://doi.org/10.5194/se-12-35-2021
M. Balcewicz et al.: Geothermal potential of a carbonate reservoir in the Rhine-Ruhr region 45
Table 3. Overview of the settings and the results of the scanline surveys performed on rock walls in the outcrops Wuppertal (WOH), Hagen-
Hohenlimburg (HKW), and Hönnetal (HLO). The abbreviations MKY, MKB, and MKR correspond to the coloured rock types Massenkalk
yellow (dolomite), Massenkalk black (limestone), and Massenkalk red (dolomite), respectively. Three main families or sets of discontinuity
orientations were found to be predominant in all outcrops.
lscan n l dis hdis d dis Discontinuity orientation
Scanline survey
(m) (–) (m) (m) (m) (dipdir/dip)
set 1 set 2 set 3
WOH-2-MKB-1 9.70 74 1.63 < 0.01 0.13 329/89 237/84 –
WOH-3-MKB-1 12.22 84 1.64 < 0.01 0.15 259/87 190/87 –
WOH-4-MKB-1 14.10 58 2.31 < 0.01 0.25 265/85 150/86 –
WOH-4-MKB-2 8.10 39 0.92 < 0.01 0.20 146/70 193/81 270/88
WOH-4-MKY-1 5.92 81 3.14 < 0.01 0.08 247/89 198/88 –
WOH-4-MKY-2 3.94 44 0.56 < 0.01 0.09 261/84 203/65 –
WOH-5-MKB-1 10.10 59 0.87 < 0.01 0.20 259/87 135/77 –
WOH-5-MKB-2 2.52 22 0.85 < 0.01 0.11 268/83 313/69 038/69
HKW-2-MKB-1 17.40 41 2.75 0.02 0.43 240/87 – –
HKW-2-MKB-2 9.90 42 3.58 0.03 0.24 333/71 – –
HKW-3-MKB-1 5.80 36 0.77 < 0.01 0.19 290/89 348/70 –
HKW-3-MKB-2 4.75 30 0.54 < 0.01 0.22 194/71 – –
HKW-1-MKY-1 17.30 97 0.58 < 0.01 0.21 207/83 – –
HKW-4-MKB-1 6.80 40 0.54 < 0.01 0.20 277/87 175/81 –
HKW-5-MKB-1 7.43 14 0.76 < 0.01 0.28 212/82 – −
HKW-5-MKY-4 6.80 46 0.23 < 0.01 0.36 351/86 284/82 212/82
HLO-4-MKB-1 13.66 50 3.31 < 0.01 0.30 351/75 – –
HLO-4-MKB-2 10.00 49 2.32 < 0.01 0.21 176/77 – –
HLO-6-MKB-1 17.70 34 6.77 0.06 0.53 254/87 018/86 –
HLO-6-MKB-2 10.80 30 3.55 0.01 0.40 253/81 134/74 195/86
HLO-6-MKB-3 10.60 84 4.67 0.02 0.14 271/89 – –
lscan : scanline length; n: number of discontinuities; l dis : mean trace length; hdis : mean discontinuity aperture; d dis :
mean discontinuity spacing. The resolution of the length measurements amounts to 0.01 m.
ture. Characterizing the DFN requires access to the reservoir shelf carbonates, some reef deposits formed on volcanic
rock at reservoir-related depth, which is not present. How- mounds within the hemipelagic realm (the isolated car-
ever, we have reasonable cause to expect comparable discon- bonate complexes on the outer shelf are the geothermal
tinuity orientations in our geological subsurface model, as in horizon of interest in this study, e.g. Franke et al., 2017;
our studied outcrops (Lorenz et al., 1991; Narr, 1991). For Salamon and Königshof, 2010);
example, Narr (1991, 1996) presented how to derive DFN
from drill core samples of reservoirs. 3. the ongoing NW movement that changed the material
deposits and thus finally created the Ruhr coal district
4.1 Estimating the geological subsurface model of the during the Carboniferous (e.g., Meschede, 2018);
carbonate reservoir
4. at least two different extension sequences during the
Early Triassic and Early Cretaceous (Drozdzewski and
The geological setting in the Rhine-Ruhr metropolitan area
Wrede, 1994);
is highly complex, with details still being debated (e.g. Brix
et al., 1988). However, we can name large tectonic events that 5. a NE–SW-directed shortening during the Late Creta-
have influenced local formations to a varying extent: ceous (e.g., Brix et al., 1988);
1. crustal thinning that enhanced the formation of a shelf 6. a further extensional regime since the Eocene (Kley,
sea during the Early Devonian (e.g., Dallmeyer et al., 2013).
2013).
Due to the geological formation’s complexity, our under-
2. an overall NW movement that reduced clastic sedimen- ground model has been simplified concerning the most im-
tation within the sea and enabled the formation of reef portant tectonic features, such as folds and faults. The foun-
carbonates on the clastic shelf; besides those clastic dation of our model is an approx. 150 m thick carbonate
https://doi.org/10.5194/se-12-35-2021 Solid Earth, 12, 35–58, 202146 M. Balcewicz et al.: Geothermal potential of a carbonate reservoir in the Rhine-Ruhr region Figure 4. Results of all scanline investigations at the quarry in Wuppertal: (a) stereogram of measured discontinuity sets and a (b) rose diagram of rotated discontinuity orientations according to the bedding layer in panel (a) for a horizontal position, (c) discontinuity spacing diagram, and (d) discontinuity trace length diagram. layer, dipping northwards at a dip angle of about 30 to 40◦ according to the corresponding bedding layers (Figs. 4a, (see Fig. 1b; Jansen et al., 1986; Drozdzewski et al., 2007). 5a, 6a) to a horizontal position (Figs. 4b, 5b, 6b). The We expect this layer to be at depths between 4000 to 6000 m discontinuity unfolding procedure indicates a similar tec- (DEKORP Research Group, 1990). This layer forms the De- tonic origin for fracture sets from Wuppertal and Hagen- vonian basement, overlaid by interbedded sequences of sand, Hohenlimburg. Discontinuities striking NE–SW are consis- clay, silt, and coal layers from the Carboniferous period. tent with folding mechanism and are oriented parallel to These sediments can be mapped to the surface (e.g. Brix fold axes that have been studied within the Rhine-Ruhr area et al., 1988). Many folds and thrusts are found within these (Drozdzewski, 1985; Brix et al., 1988; DEKORP Research extremely complex interbedded sequences (for more details, Group, 1990; Drozdzewski and Wrede, 1994). The domi- see Brix et al., 1988; Drozdzewski and Wrede, 1994). nant discontinuity strike directions in Wuppertal and Hagen- All studied outcrops are located in the large-scale Hohenlimburg (NNW–SSE) agree with the structure of the Remscheid-Altena anticline formation. However, there is a regional Remscheid-Altena anticline (Fig. 1b) and the over- difference between the three outcrop results, which could all assumed mean horizontal stress direction according to be influenced by the regional Remscheid-Altena anticline, the World Stress Map (Heidbach et al., 2016) and addi- different stress conditions, and/or a different time of ori- tional available stress data (Rummel and Weber, 1993). In gin (Table 3). The discontinuity orientations were rotated western Germany, or to be more precise in North Rhine- Solid Earth, 12, 35–58, 2021 https://doi.org/10.5194/se-12-35-2021
M. Balcewicz et al.: Geothermal potential of a carbonate reservoir in the Rhine-Ruhr region                                                 47

Figure 5. Results of all scanline investigations at the quarry in Hagen-Hohenlimburg: (a) stereogram of measured discontinuity sets and a
(b) rose diagram of rotated discontinuity orientations according to the bedding layer in panel (a) for a horizontal position, (c) discontinuity
spacing diagram, and (d) discontinuity trace length diagram.

Westphalia, the World Stress Map contains a wide variability              crops in Wuppertal and Hagen-Hohenlimburg have been fur-
of mean horizontal stress directions (Heidbach et al., 2016),             ther deformed by later tectonic events. The cause of the
which can be explained by shallow stress measurements,                    slightly different discontinuity strike directions in Hönnetal
local anomalies due to weak coal seams, or regional NE–                   cannot be specified according to the current state of scien-
SW-striking thrusts. The observed strong scattering of the                tific knowledge and is therefore unknown. However, the dis-
vein strike directions in the dolomitic carbonates exposed                continuity formation could be explained by various local and
in Hagen-Hohenlimburg is most probably due to their hy-                   temporal stress anomalies and different formation times.
drothermal veins’ formation during the Hercynian orogeny                      Brudy et al. (1997) showed no significant stress orientation
(Gillhaus et al., 2003) but can be also explained by the re-              changes have to be expected in the brittle crust with depth.
cent study of Michie (2015). Michie (2015) found a cru-                   Consequently, it is reasonable to assume that we can expect
cial correlation between fracture propagation and petrolog-               quite similar discontinuity directions in our target horizon of
ical properties of carbonate rocks, specifically grain size and           the deep Devonian limestone, i.e. the potential geothermal
sorting, porosity and uniaxial compressive strength. Further-             reservoir. However, if the carbonate layers exposed in the in-
more, Gillhaus et al. (2003) explain that the existing NNW–               vestigated opencast mines are extrapolated in dip direction of
SSE-striking discontinuities are of post-Hercynian orogeny                bedding, the carbonate reservoir of interest is approximately
origin. This leads to the conclusion that the investigated out-           located below the cities of Essen, Bochum, and Dortmund at

https://doi.org/10.5194/se-12-35-2021                                                                        Solid Earth, 12, 35–58, 2021
48                             M. Balcewicz et al.: Geothermal potential of a carbonate reservoir in the Rhine-Ruhr region

Figure 6. Results of all scanline investigations at the quarry in Hönnetal: (a) stereogram of measured discontinuity sets and a (b) rose diagram
of rotated discontinuity orientations according to the bedding layer in panel (a) to a horizontal position, (c) discontinuity spacing diagram,
and (d) discontinuity trace length diagram.

a depth of 4000 to 6000 m (Fig. 2). This extrapolation of the             porosity of carbonate rocks may increase via a wide variety
carbonates in dip direction corresponds in this case approx-              of processes. Next to dissolution, cementation, and recrys-
imately to the direction of the main horizontal stress (Heid-             tallization, the process of dolomitization is the most com-
bach et al., 2016; Rummel and Weber, 1993) with respect to                mon. Dolomitization describes the geochemical process of
the simplified geological setting (Fig. 1a). This assumption              replacing Ca ions by Mg ions, forming dolomite from cal-
allows us to predict local DFN in the deep Devonian lime-                 cite: 2CaCO3 + Mg2+ → CaMg(CO3 )2 + Ca2+ . Lucia et al.
stone (i.e. naturally fractured carbonate reservoir), whose ex-           (2007) pointed out that dolomitization may increase the car-
act depth and characteristics should be verified by additional            bonate’s porosity by 13 %. This correlates fairly well with
geophysical prospecting techniques to further describe the                our results (Fig. 8a). Consequently, porosity measurements
geothermal potential of this reservoir (e.g. Hirschberg et al.,           are in accordance with the field study’s outcome: porosity
2015).                                                                    decreases towards the core of the reef formation, in agree-
   We carried out laboratory experiments under ambient and                ment with Homuth et al. (2015b).
elevated pressure conditions to gain insights into the poten-                The P- and S-wave velocities and the matrix permeabili-
tial reservoir’s petrophysical properties. The derived porosi-            ties and dynamic mechanical properties derived in the lab-
ties of the limestone samples are in agreement with literature            oratory provide statistical information for further numerical
values between 1 % and 6 % (Fig. 8a; Gebrande, 1982). The                 simulations of the reservoir. The thermal conductivity results

Solid Earth, 12, 35–58, 2021                                                                       https://doi.org/10.5194/se-12-35-2021
You can also read