Metabolic reprogramming ensures cancer cell survival despite oncogenic signaling blockade
←
→
Page content transcription
If your browser does not render page correctly, please read the page content below
Downloaded from genesdev.cshlp.org on March 1, 2021 - Published by Cold Spring Harbor Laboratory Press

Metabolic reprogramming ensures cancer
cell survival despite oncogenic signaling
blockade
Hui-wen Lue,1 Jennifer Podolak,1 Kevin Kolahi,2 Larry Cheng,3 Soumya Rao,1 Devin Garg,1
Chang-Hui Xue,1 Juha K. Rantala,1 Jeffrey W. Tyner,1 Kent L. Thornburg,2 Ann Martinez-Acevedo,4
Jen-Jane Liu,4 Christopher L. Amling,4 Charles Truillet,5 Sharon M. Louie,6 Kimberly E. Anderson,6
Michael J. Evans,5 Valerie B. O’Donnell,7 Daniel K. Nomura,6 Justin M. Drake,3 Anna Ritz,8
and George V. Thomas1,9
1
 Knight Comprehensive Cancer Institute, Oregon Health and Science University, Portland, Oregon 97239, USA; 2Knight
Cardiovascular Institute, Oregon Health and Science University, Portland, Oregon 97239, USA; 3Rutgers Cancer Institute of New
Jersey, Rutgers, The State University of New Jersey, New Brunswick, New Jersey 08903, USA; 4Department of Urology, Oregon
Health and Science University, Portland, Oregon 97239, USA; 5Department of Radiology, University of California at San Francisco
School of Medicine, San Francisco, California 94107, USA; 6University of California at Berkeley, Berkeley, California 94720, USA;
7
 Systems Immunity Research Institute, Cardiff University, Cardiff CF14 4XN, United Kingdom; 8Department of Biology, Reed
College, Portland, Oregon 97202, USA; 9Department of Pathology and Laboratory Medicine, Oregon Health and Science
University, Portland, Oregon 97239, USA

There is limited knowledge about the metabolic reprogramming induced by cancer therapies and how this con-
tributes to therapeutic resistance. Here we show that although inhibition of PI3K–AKT–mTOR signaling markedly
decreased glycolysis and restrained tumor growth, these signaling and metabolic restrictions triggered autophagy,
which supplied the metabolites required for the maintenance of mitochondrial respiration and redox homeostasis.
Specifically, we found that survival of cancer cells was critically dependent on phospholipase A2 (PLA2) to mobilize
lysophospholipids and free fatty acids to sustain fatty acid oxidation and oxidative phosphorylation. Consistent with
this, we observed significantly increased lipid droplets, with subsequent mobilization to mitochondria. These
changes were abrogated in cells deficient for the essential autophagy gene ATG5. Accordingly, inhibition of PLA2
significantly decreased lipid droplets, decreased oxidative phosphorylation, and increased apoptosis. Together, these
results describe how treatment-induced autophagy provides nutrients for cancer cell survival and identifies novel
cotreatment strategies to override this survival advantage.
[Keywords: autophagy; cancer; metabolism; phospholipid; resistance; signaling]
Supplemental material is available for this article.
Received July 25, 2017; revised version accepted October 26, 2017.

Despite significant advances in precision cancer thera-                     ming in the context of PI3K pathway inhibition. The
pies, tumor regressions are variable and rarely complete.                   PI3K pathway, which includes the PI3K holoenzyme and
Although the molecular basis of how cancer cells survive                    its truncal effector kinases, AKT and mTOR, is essential
therapies that are designed to kill them (i.e. drug-tolerant                for cell growth, proliferation, survival, and metabolism.
“persister” cells) is likely due to a mixed set of mecha-                   However, clinical responses to PI3K–AKT–mTOR inhibi-
nisms, we reasoned that at its root are subpopulations of                   tors have been modest to date (Fruman and Rommel 2014;
drug-tolerant cancer cells that can rewire their signaling                  Toska and Baselga 2016). We hypothesized that the limit-
and metabolic networks to adapt to treatment-imposed                        ed ability of PI3K–AKT–mTOR inhibitors to induce can-
proliferative, survival, and nutrient restrictions. While re-               cer cell death was due to the autophagy-mediated
wired compensatory oncogenic signaling (e.g., mediated                      metabolic reprogramming that enabled drug-tolerant cells
through bypass pathways, receptor amplification, and sec-                   to survive despite therapy-enforced nutrient restrictions.
ond site mutations) have been well documented, little is                    Our hypothesis was based on the knowledge that nutri-
known about the metabolic reprogramming induced by                          ents derived from autophagic degradation are reused to
treatment and how this contributes to resistance.                           maintain macromolecular synthesis and or oxidized to
  To better understand the metabolic consequences of
anti-cancer treatment, we studied metabolic reprogram-                      © 2017 Lue et al. This article is distributed exclusively by Cold Spring
                                                                            Harbor Laboratory Press for the first six months after the full-issue publi-
                                                                            cation date (see http://genesdev.cshlp.org/site/misc/terms.xhtml). After
Corresponding author: thomasge@ohsu.edu                                     six months, it is available under a Creative Commons License (At-
Article published online ahead of print. Article and publication date are   tribution-NonCommercial 4.0 International), as described at http://creati-
online at http://www.genesdev.org/cgi/doi/10.1101/gad.305292.117.           vecommons.org/licenses/by-nc/4.0/.

        GENES & DEVELOPMENT 31:2067–2084 Published by Cold Spring Harbor Laboratory Press; ISSN 0890-9369/17; www.genesdev.org                    2067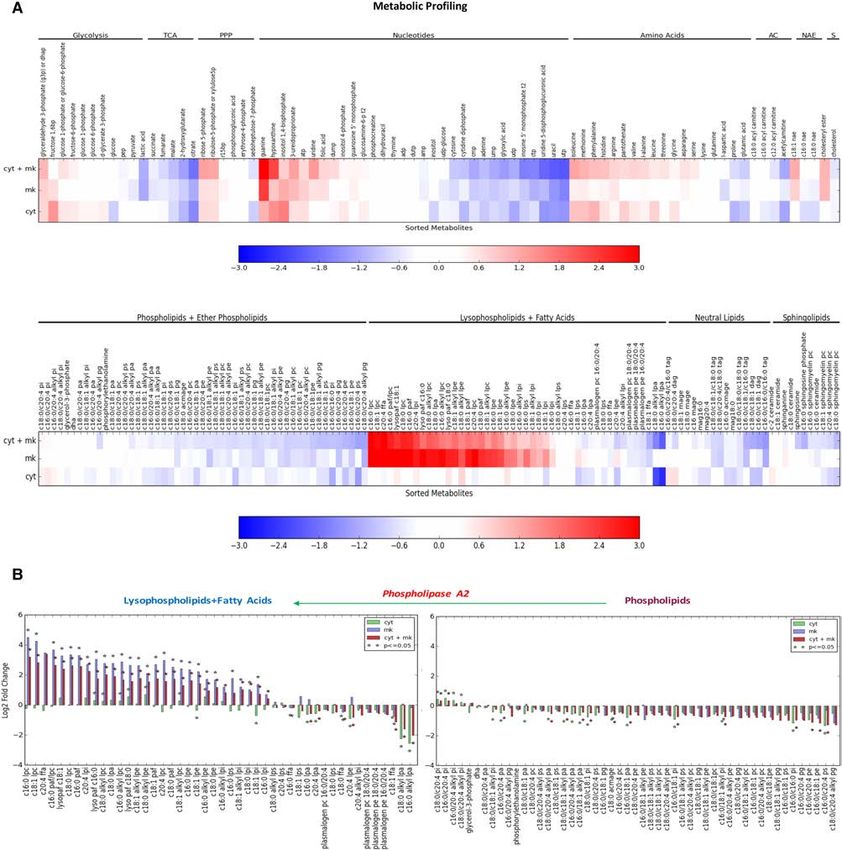
Downloaded from genesdev.cshlp.org on March 1, 2021 - Published by Cold Spring Harbor Laboratory Press

Lue et al.

maintain bioenergetics (Galluzzi et al. 2015). Additional-           annotated compounds that included activity against
ly, due to the central role that the PI3K–AKT–mTOR                   two-thirds of the tyrosine kinome as well as other nonty-
pathway has in regulating cellular growth, we reasoned               rosine kinase pathways on a human renal cell carcinoma
that small molecule inhibitors that converge directly or             (RCC) cell line, ACHN (Leonard et al. 2016; Maxson
indirectly on this pathway would similarly induce                    et al. 2013, 2016) (see Supplemental Fig. S1A for a sche-
autophagy to sustain drug-tolerant cells, therefore extend-          matic of the workflow; see Supplemental Table 1 for a
ing the reach of this mechanism of resistance beyond spe-            list of drugs and known targets). We monitored mTORC1
cific PI3K–AKT–mTOR inhibitors.                                      activity through phosphorylation of S6 and combined this
   Thus far, the therapeutic reflex to block autophagy is to         with a measurement of p62 steady-state levels as an initial
add anti-malarial lysosomotropic inhibitors such as chlo-            screen of autophagy flux (Joachim et al. 2015) in a high-
roquine, but the clinical responses to these drugs have              content imaging screen.
been variable and noncurative (Goldberg et al. 2012; Shan-              Remarkably, the screen identified several structurally
ware et al. 2013; Rosenfeld et al. 2014; Towers and Thor-            different Janus kinase (JAK) inhibitors as potent inducers
burn 2016). Therefore, it would be clinically impactful to           of autophagic flux; namely, pan-Jak inhibitor (JAK1,
directly target the metabolic enzymes mediating autoph-              JAK2, and JAK3), Go6978 (JAK 2), ruxolitinib (Jak1 and
agy-fueled metabolic processes on which drug-tolerant                Jak2), and CYT387 (JAK1 and JAK2). All four drugs potent-
cells are dependent. However, there have not been any                ly inhibited S6 phosphorylation, pointing to a mTORC1-
therapeutically tractable metabolic enzymes identified               dependent mechanism. Since JAK inhibitors as a class of
in the setting of therapy-induced autophagy.                         compounds scored highly in our screen and because
   Here, we identify CYT387, a JAK inhibitor that induces            CYT387 was the most potent JAK inhibitor to induce
autophagy by inhibiting mTOR complex 1 (mTORC1).                     autophagic flux and simultaneously decrease S6 phos-
Consequently, by relieving the inhibitory signal transmit-           phorylation in solid tumor cells in our screen, we selected
ted from mTORC1 to PI3K, treatment with CYT387 leads                 this small molecule for further validation. CYT387
to activation of the PI3K–mTORC2/AKT pathway. Com-                   (momelutinib) is an orally available JAK1–2 inhibitor
bining CYT387 with MK2206, an allosteric AKT inhibitor,              that has improved splenomegaly and reduced anemia in
did not induce any tumor regressions despite effectively             myeloproliferative neoplasia (MPN) patients (Patel et al.
inhibiting PI3K–AKT–mTORC1/2 activation. Notably,                    2016; Winton and Kota 2017). In support of this,
the combination treatment further increased autophagy.               CYT387 suppressed the phosphorylation of JAK; its sub-
This suggested that inhibition of signaling pathways alone           strate, STAT3; and S6 in human RCC and MPN cell lines
would be insufficient to kill all tumor cells. Subsequently,         (Supplemental Fig. S1B,C). CYT387 induces autophagy
we performed global metabolic profiling to systematically            that is reversible—as seen by the reduction in LC3B lipida-
document the immediate metabolic adaptations effected                tion within 24 h of removal of drug—and correlated with
by the therapy-induced autophagic processes. We show                 reversal of the p-STAT3, p-S6, and p-AKT phosphoryla-
that autophagy-mediated metabolic adaptations support-               tion patterns (Supplemental Fig. S1D).
ed cancer cell survival. Autophagy was required for these               CYT387 treatment of ACHN human RCC cells plated
metabolic adaptations because these changes were abro-               on coverslips resulted in decreased p62 protein expression
gated in cells deficient for the essential autophagy gene            and phosphorylated S6 levels by immunofluorescence
ATG5. Subsequently, we identified that phospholipase                 staining, confirming our high-content imaging finding
A2 (PLA2), the rate-limiting enzyme responsible for cata-            (Fig. 1A). Accordingly, we observed that treatment with
lyzing the breakdown of phospholipids to lysophospholi-              CYT387 induced autophagy in multiple human RCC
pids and fatty acids, had an important role in the survival          and MPN cell lines and was primarily cytostatic (Supple-
of cancer cells. Pharmacological inhibition of this enzyme           mental Fig. S1E,F). Immunoblots confirmed the induction
dampened oxidative phosphorylation (OXPHOS) and fur-                 of autophagy by CYT387, as seen by the conversion of
ther increased apoptosis when combined with CYT387–                  LC3-I to LC3-II, the degradation of p62, and inhibition of
MK2206 combination treatment. Our findings highlight                 mTORC1 (as seen by decrease in phosphorylated S6)
a previously unappreciated role for PLA2 in conferring a             (Fig. 1B). We additionally confirmed that CYT387 treat-
survival advantage to drug-tolerant cancer cells in meta-            ment induced autophagic flux by several different meth-
bolically restricted environments, demonstrate that this             ods. (1) We stably expressed a mChery-EGFP-LC3
enzyme supports autophagy-induced metabolic repro-                   reported in ACHN cells, which takes advantage of the
gramming, and, importantly, provide a path forward for               fact that EGFP fluorescence is quenched in the acidic en-
novel cotreatment strategies.                                        vironment of the autolysosome relative to mCherry (Deb-
                                                                     nath 2008). CYT387 treatment resulted in decreased
                                                                     expression of green–yellow cells and increased expression
Results                                                              of red cells (Supplemental Fig. S2A). (2) We stained
                                                                     CYT387-treated ACHN cells with the autofluorescent
CYT387 induces autophagy through the modulation
                                                                     compound monodansylcadaverine (MDC), a marker of
of the PI3K–AKT–mTOR pathway
                                                                     autolysosomes, and found that CYT387 increased MDC
To precisely identify which cancer drugs induce autopha-             autofluorescence (Supplemental Fig. S2B; Turcotte et al.
gic flux by inhibiting the mTORC1 pathway, we used a li-             2008). (3) CYT387 increased LC3-II levels in ACHN cells,
brary of 116 clinically focused and mechanistically                  and this increase was more pronounced in the presence of

2068         GENES & DEVELOPMENT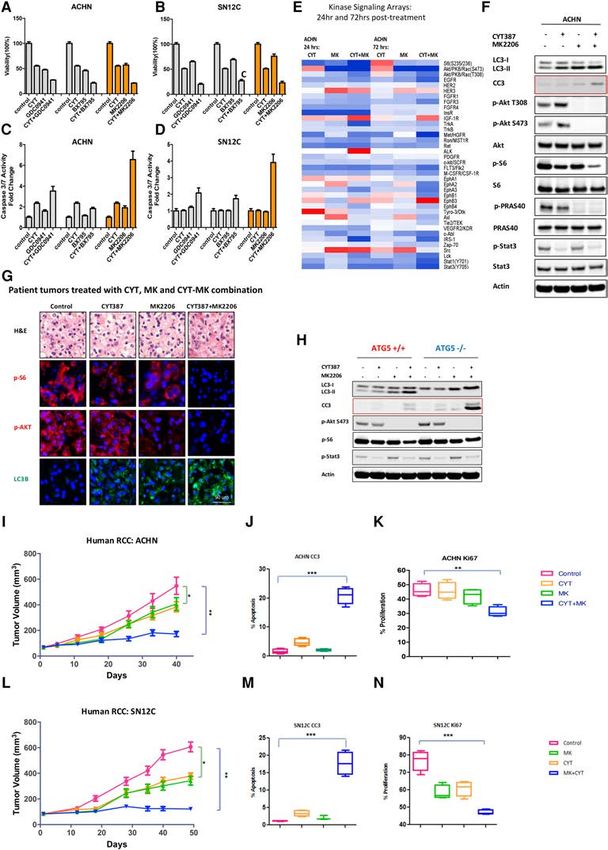
Downloaded from genesdev.cshlp.org on March 1, 2021 - Published by Cold Spring Harbor Laboratory Press
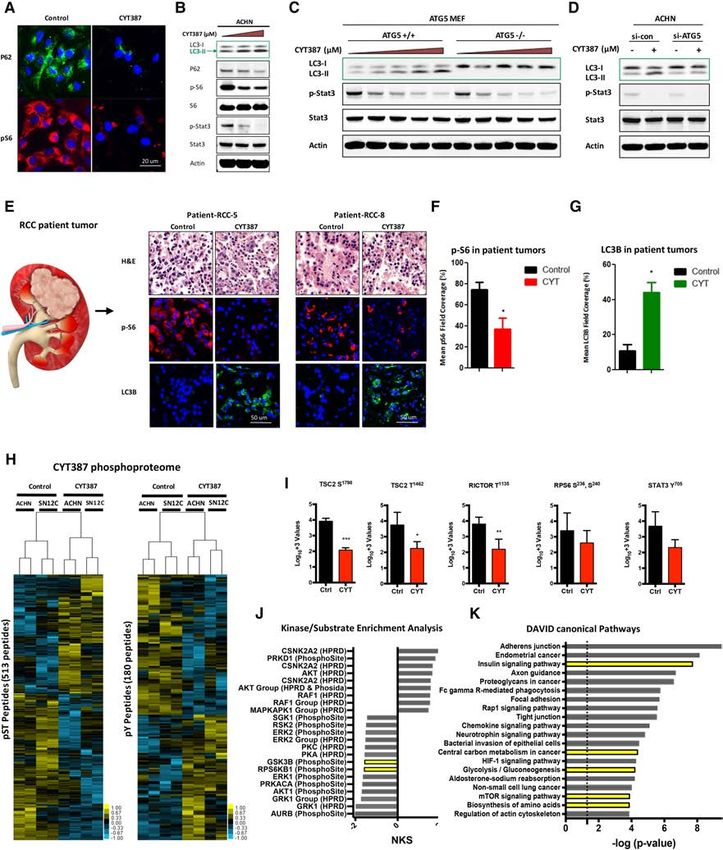
Figure 1. CYT387 induces autophagy in human cancer cell lines and patient-derived models. (A) ACHN cells were grown on coverslips,
treated with CYT387 for 24 h, and stained p62 and p-S6. (B) ACHN cells were treated with increasing doses of CYT387 (0–2 µM) and
immunoblotted with LC3, p62, p-S6, total S6, p-STAT3, total STAT3, and β-actin. (C ) ATG5 +/+ and ATG5 −/− MEFs were treated with
0–3 µM CYT387 for 24 h, and LC3 processing was evaluated by immunoblotting. (D) Immunoblot for LC3 and p-STAT3 and ATG5 in
ACHN cells transiently transfected with siRNA against ATG5. β-Actin was used as a loading control. (E) Patient-derived organotypic cul-
tures were treated with CYT387 for 24 h and stained with p-S6 and LC3B (images from two different patient tumors are shown). (F,G)
Quantification of p-S6 (F ) and LC3B (G) staining in patient-derived organotypic cultures (bar graph). n = 10 patients. (H) Supervised hier-
archical clustering heat maps of phosphoserine and phosphothreonine (pST) peptides and phosphotyrosine (pY) peptides identified from
CYT387-treated and untreated ACHN and SN12C human RCC cells with two technical replicates. Five-hundred-thirteen unique pST
phosphopeptides (rows) and 180 unique pY phosphopeptides were either fourfold more enriched or fourfold less enriched, on average
(t-test, P < 0.2), in CYT387-treated cells compared with untreated cells (phosphopeptide lists are in Supplemental Tables 2, 3). (I) Relative
phosphorylation abundance between ACHN and SN12C CYT387-treated and untreated cells. RPS6 S236, S240 was found in the pST un-
supervised heat map. (Ctrl) Control; (CYT) CYT387. (∗ ) P < 0.05; (∗∗ ) P < 0.01; (∗∗∗ ) P < 0.001, unpaired t-test. (J) Kinase substrate enrichment
analysis (KSEA) of CYT387-treated and untreated pST data. Hits > 5; false discovery rate [FDR] < 0.05. A positive NKS (normalized Kolmo-
gorov-Smirnov score) infers greater kinase activity in CYT387-treated cells, while a negative NKS indicates greater activity in untreated
cells (unfiltered summary is in Supplemental Table 4). (K) KEGG (Kyoto Encyclopedia of Genes and Genomes) pathways found from DA-
VID analysis of relatively active genes due to CYT387 treatment. The DAVID input list was generated by interpreting functional anno-
tations of pSTY data (the complete pathway list is in Supplemental Table 2).
GENES & DEVELOPMENT 2069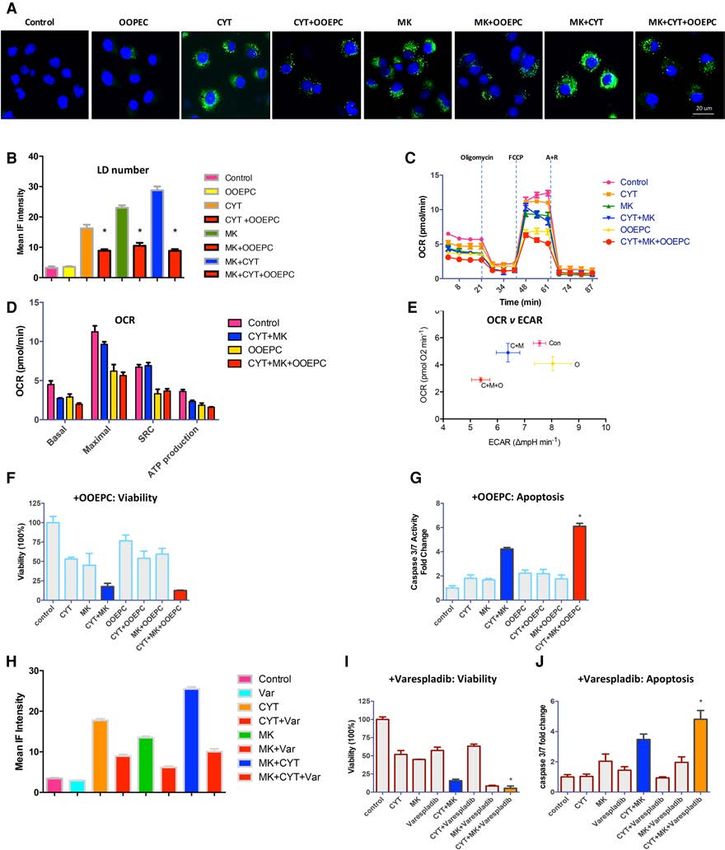
Downloaded from genesdev.cshlp.org on March 1, 2021 - Published by Cold Spring Harbor Laboratory Press

Lue et al.

E64D/pepstatin (which inhibits the protease-induced re-              using gene set enrichment analysis (GSEA) of multiple
conversion of LC3-II into LC3-I), consistent with an in-             independent data sets revealed significant enrichment
crease in autophagosome formation (Supplemental Fig.                 of genes involved in several metabolic pathways, while
S2C; Tanida et al. 2005). (4) CYT387 increased the number            biological modules associated with mTOR (e.g., cell cycle
of double-membraned autophagosomes, which are patho-                 and protein synthesis) were anti-correlated with CYT387
gnomonic of autophagy as determined by transmission                  treatment. (Supplemental Tables 12, 13).
electron microscopy (Supplemental Fig. S2D; Klionsky                   Collectively, the phosphoproteome and transcriptome
et al. 2016). Notably, CYT387 was able to induce autoph-             data provide strong evidence that CYT387 treatment re-
agy in a dose-dependent manner in murine embryonic fi-               duces mTORC1 signaling to increase TSC2 and mTORC2
broblasts (MEFs) that retained the essential autophagy               signaling leading to AKT activation and is coupled with
gene ATG5 (ATG5 +/+), as seen by the lipidation of LC3               changes in metabolic pathways.
(Fig. 1C) (Cecconi and Levine 2008; Fung et al. 2008).
Conversely, CYT387 did not induce autophagy in
                                                                     PI3K–AKT–mTOR inhibition treatment restrains tumor
ATG5-deficient cells (ATG5 −/−). Likewise, CYT387-in-
                                                                     growth but does not induce tumor regression
duced autophagy was abrogated with siRNA depletion of
ATG5 in ACHN cells (Fig. 1D). To extend our studies                  We reasoned that the CYT387-induced inhibition of
into clinical samples, we exposed patient-derived RCC                mTORC1 would relieve the inhibitory feedback signal
organotypic cultures to CYT387 treatment for 24                      normally transmitted from mTORC1 to PI3K, as the phos-
h. Importantly, CYT387 significantly induced LCB ex-                 phoproteomic data suggested via KSEA, and that this
pression while simultaneously reducing phosphorylated                would result in hyperactivation of PI3K and AKT, with
S6 levels (Fig. 1E,F). Taken together, these results indicate        consequent prosurvival signaling. Consistent with this in-
that CYT387 treatment induces autophagic flux in both                terpretation, CYT387 treatment caused an increase in
human RCC cell lines and patient-derived tumors.                     AKT T308, the PDK-1-catalyzed site that serves as read-
   To obtain further insight into the signaling pathways af-         out for PI3K signaling in a time-dependent manner (Sup-
fected by CYT387 treatment, we studied changes in the                plemental Fig. S3A,B). Notably, CYT387 did not
phosphoproteome of two different human RCC cells                     dephosphorylate ERK (Supplemental Fig. S3C). Therefore,
(ACHN and SN12C) after CYT387 treatment using quan-                  we sought to identify PI3K–AKT pathway inhibitors that
titative phosphoproteomics (Rush et al. 2005; Moritz et al.          would effectively cooperate with CYT387 to induce apo-
2010; Zhuang et al. 2013). Supervised hierarchical cluster-          ptosis. We used GDC-0941, a pan-PI3K inhibitor (Sarker
ing revealed that 513 phosphoserine and phosphothreo-                et al. 2015); BX795, a PDK-1 inhibitor (Dangelmaier
nine (pST) peptides and 180 phosphotyrosine (pY)                     et al. 2014); and MK2206 (Yap et al. 2011), an allosteric
peptides significantly differed between treated and un-              AKT inhibitor, to chemically deconstruct this signaling
treated cells (Fig. 1H; Supplemental Tables 2–9). We ob-             pathway, as depicted in the schematic (Supplemental
served two phosphopeptides to be hypophosphorylated                  Fig. S3D–F). We first assessed the biologic effects of these
at inhibitory residues T1462 and S1798 in tuberous sclero-           inhibitors on proliferation and apoptosis in human RCC
sis complex 2 (TSC2) in CYT387-treated cells (Manning                cells singly and in combination with CYT387 (Fig. 2A–
et al. 2002; Roux et al. 2004). Rapamycin-insensitive com-           D). While GDC-0941, BX795, and MK2206 alone exhibit-
panion of mTOR (RICTOR) in CYT387-treated cells was                  ed some anti-proliferative effects, the combination with
hypophosphorylated at T1135. RICTOR is a subunit of                  CYT387 resulted in significantly greater inhibition of pro-
mTORC2 (Kim et al. 2017), but the phosphorylation of                 liferation in ACHN and SN12C cells. In marked contrast,
T1135 is mediated by mTORC1 via induction of the                     all drugs as single agents had little or no effect on apopto-
p70S6 kinase (Julien et al. 2010) and impedes the ability            sis, but the combination of either agent with CYT387 re-
of mTORC2 to phosphorylate AKT on S473 (Fig. 1I; Dib-                sulted in increased apoptosis. This was most striking in
ble et al. 2009). As expected, ribosomal protein S6 at resi-         the CYT387 and MK2206 combination (Fig. 2B,D), and
dues S236 and S240 and STAT3 Y705 trended toward                     we therefore selected MK2206 for further in vivo studies.
hypophosphorylation, and p70S6 kinase (RPS6KB) was                   We investigated the mechanisms by which MK2206 and
significantly less active in CYT387-treated cells based              CYT387 cooperated to suppress tumor growth in RCC
on kinase substrate enrichment analyses (KSEAs) (Fig.                cells (Fig. 2E,F). MK2206 effectively inhibited AKT activa-
1J; Drake et al. 2012). However, KSEAs of AKT motifs                 tion, as documented by dephosphorylation of both p-AKT
were inconclusive, as some motifs trended toward in-                 Thr308 and p-Ser473 and the AKT substrate PRAS40.
creased activity and others trended toward decreased ac-             Consistent with prior results, suppression of AKT induced
tivity in CYT387-treated cells. DAVID analysis of genes              autophagy, as seen by the conversion of LC3-I to LC3-II.
corresponding to the phosphopeptides and activated in                Suppression of mTORC1 by CYT387 led to feedback acti-
CYT387-treated cells (Supplemental Tables 10, 11) also               vation of PI3K, as seen by the increase in phosphorylation
revealed several KEGG (Kyoto Encyclopedia of Genes                   of p-AKT Thr308 (which serves as a readout for PI3K activ-
and Genomes) pathways that are biologically relevant to              ity) and mTORC2 (as monitored by AKT Ser473 phos-
CYT387 treatment, including glycolysis, amino acid bio-              phorylation). Subsequently, combining MK2206 with
synthesis, and central carbon metabolism (Fig. 1K; Huang             CYT387 effectively inhibited both AKT and mTORC1
da et al. 2009a,b). In support of these phosphoproteomics            to almost undetectable levels and induced apoptosis
findings, mRNA analysis of CYT387-treated ACHN cells                 (cleaved caspase 3). Thus, by inhibiting the PI3K–AKT–

2070         GENES & DEVELOPMENT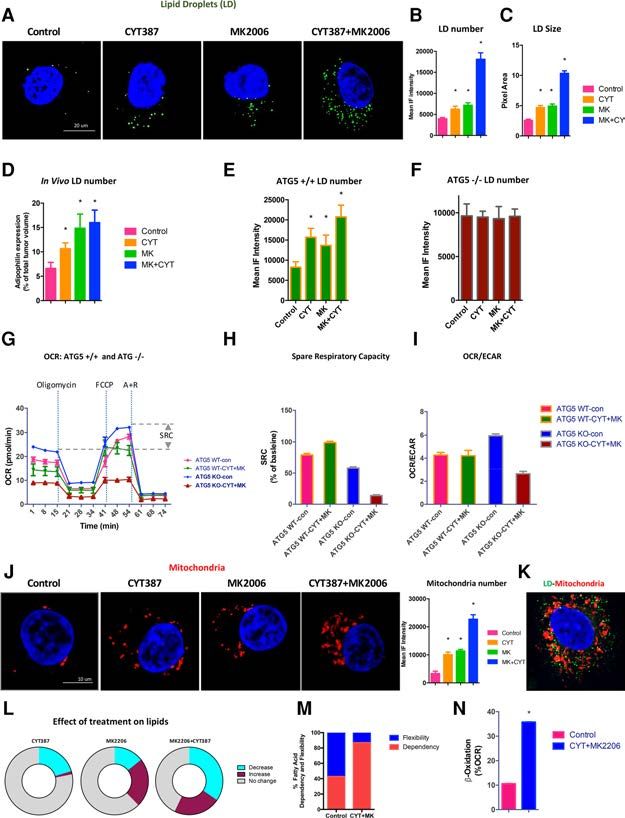
Downloaded from genesdev.cshlp.org on March 1, 2021 - Published by Cold Spring Harbor Laboratory Press

Figure 2. CYT387 combines with MK2206 to effectively inhibit PI3K–AKT–mTOR signaling in human cancer cell lines and xenografts
but does not induce tumor regression. (A,B) Combination treatment with GDC0941, BX795, and MK2206 with measurement of cell vi-
ability in two human RCC cell lines: ACHN (A) and SN12C (B). (C,D) The same combinations as in A, with measurement of apoptosis by
cleaved caspase 3/7 in ACHN (C ) and SN12C (D) cells. (E) A heat map of signaling kinase arrays shows the effects of CYT387, MK2206, and
CYT387+MK2206 cotreatment in ACHN cells at 24 h and 72 h after treatment. (F) Immunoblot for LC3, p-AKT Thr308, p-AKT Ser473,
total AKT, p-PRAS40, total PRAS40, p-S6, total S6, p-STAT3, total STAT3, and β-actin. (G) Patient-derived organotypic cultures treated
with DMSO (control), CYT387, MK2206, and the CYT387+MK2206 combination for 24 h exhibit an increase in LC3B (green) and a
decrease in p-S6 (red) and p-AKT (red). (H) ATG5 +/+ and ATG5 −/− MEFs were treated with 2 µM CYT387, 10 µM MK2206, and the com-
bination for 24 h, and LC3, cleaved caspase 3, p-AKT, p-S6, p-STAT3, and β-actin were evaluated by immunoblotting. (I ) ACHN xenografts
treated with vehicle, 50 mg/kg CYT387, 60 mg/kg MK2206, and a 50 mg/kg CYT387 + 60 mg/kg MK2206 combination. Tumor volume is
shown. Error bars represent mean ± SEM. Control versus CYT387+MK2206, (∗∗ ) P < 0.01. (J,K) The effect on apoptosis (CC3) (J) and prolif-
eration (KI67) (K) in ACHN xenograft tumors. Error bars represent mean ± SEM. (J) Control versus CYT387+MK2206, (∗∗∗ ) P < 0.0001. (K)
Control versus CYT387+MK2206, (∗∗ ) P = 0.0018. (L) SN12C xenografts treated with vehicle, 50 mg/kg CYT387, 50 mg/kg MK2206, and
a 50 mg/kg CYT387 + 60 mg/kg MK2206 combination. Tumor volume is shown. Error bars represent mean ± SEM. Control versus
CYT387+MK2206, (∗∗ ) P < 0.0001. (M,N) The effect on apoptosis (CC3) (M) and proliferation (KI67) (N) in SN12C xenograft tumors. Error
bars represent mean ± SEM. (M) Control versus CYT387+MK2206, (∗∗∗ ) P < 0.0001. (N) Control versus CYT387+MK2206 (∗∗∗ ) P < 0.0001.

                                                                                                     GENES & DEVELOPMENT            2071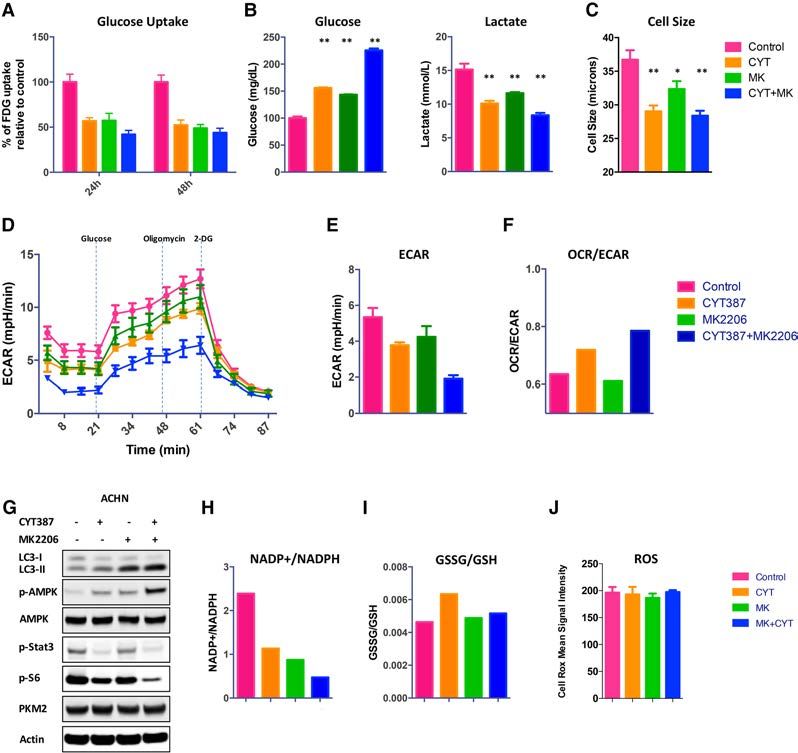
Downloaded from genesdev.cshlp.org on March 1, 2021 - Published by Cold Spring Harbor Laboratory Press

Lue et al.

mTOR pathway at proximal and distal nodes, CYT387                    deoxyglucose (18FDG), lactate excretion, and the extracel-
and MK2206 combine to shut down PI3K oncogenic                       lular acidification rate (ECAR) as readouts for glycolysis.
signaling. However, autophagy still persisted in the com-            CYT387, MK2206, and the combination significantly de-
bination treatment, pointing to a survival signal that               creased glucose uptake and reduced lactate production in
sustains subpopulations of drug-tolerant cancer cells.               vitro (Fig. 3A,B). The dramatic difference between lactate/
Notably, the CYT387–MK2206 combination induced                       glucose ratio in extracellular medium further supports the
autophagy in patient-derived organotypic RCC cultures                finding that CYT387 and MK2206 cotreatment inhibits
(Fig. 2G).                                                           glycolysis (control: 1.51; CYT387: 0.65; MK2206: 0.81;
   To further define the role of treatment-induced                   CYT387+MK2206: 0.37). This impaired carbon metabo-
autophagy in mediating survival, we assessed the effects             lism with treatment also resulted in a reduction of cell
of CYT387 and MK2206 combination treatment on                        size (Fig. 3C). Consistent with the above finding,
ATG5 −/− and ATG5 +/+ MEFs. The CYT387–MK2206                        CYT387, MK2206, and the CYT387–MK2206 combina-
cotreatment induced more apoptosis in ATG5 −/− MEFS                  tion significantly reduced the ECAR (Fig. 3D,E).
than it did in wild-type controls (demonstrated by an in-               Decreased glucose availability with cotreatment might
crease in cleaved caspase 3), indicating that autophagy              also be reflected in changes with OXPHOS activity, as
protects cells from apoptosis (Fig. 2H). Collectively, these         measured by oxygen consumption rate (OCR; an indicator
results suggest that despite effective inhibition of PI3K–           of OXPHOS). However, we found that the OCR/ECAR ra-
AKT–mTOR signaling with the resultant induction of ap-               tio increased after cotreatment, suggesting a predominant
optosis, cancer cells are able to simultaneously induce an           decrease in glycolysis with the maintenance of mitochon-
autophagic-fueled survival pathway.                                  dria-driven OXPHOS (Fig. 3F). Consistent with glucose
   We next examined the safety and efficacy of CYT387                limitation and decreased glycolysis, we observed in-
and MK2206 cotreatment in vivo in two xenograft tumor                creased AMPK phosphorylation at Thr172, an established
models. While CYT387 or MK2206 alone exhibited an                    indicator of metabolic stress (Fig. 3G). Importantly, in the
anti-tumor effect on ACHN and SN12C xenografts, the                  setting of glucose deprivation and impairment of the pen-
combination of CYT387 with MK2206 resulted in signifi-               tose phosphate pathway (PPP), AMPK has been shown to
cantly greater tumor growth inhibition in ACHN and                   increase NADPH levels from increased fatty acid oxida-
SN12C tumor xenografts (P < 0.001) (Fig. 2I,L). Important-           tion. Specifically, we noted increased levels of NADPH,
ly, combination treatment was well tolerated, with no                maintenance of GSSG/GSH ratios, and a resultant mitiga-
weight loss recorded (Supplemental Fig. S3G,H). Pharma-              tion of reactive oxygen species (ROS) (Fig. 3H–J). These
codynamic studies demonstrated that combination                      findings are consistent with the role of AMPK in mitigat-
therapy led to the suppression of S6 and AKTS473 phos-               ing metabolic stress and promoting cancer cell survival
phorylation (Supplemental Fig. S3I). Consistent with our             (Jeon et al. 2012). Additionally, AMPK would be predicted
in vitro finding, CYT387 alone had a minimal impact on               to further inhibit mTOR (Inoki et al. 2003; Gwinn et al.
apoptosis. In marked contrast, combination treatment                 2008). By comparison, we did not see any reduction in
with CYT387 and MK2206 resulted in a significant in-                 PKM2 levels, suggesting that the metabolic switch from
crease in apoptosis (established by an increase in cleaved           aerobic glycolysis to OXPHOS is not dependent on pyru-
caspase 3; P < 0.001) (Fig. 2J [ACHN xenograft tumors],              vate kinase activity (Christofk et al. 2008).
M [SN12C xenograft tumors]) and a reduction in prolifer-                Overall, these findings suggest that by decreasing glu-
ation (demonstrated by a decrease in Ki-67; P < 0.001) (Fig.         cose levels, CYT387–MK2206 cotreatment severely re-
2K [ACHN xenograft tumors], N [SN12C xenograft tu-                   duces the glycolytic capacity needed to supply the
mors]). However, despite effective inhibition of PI3K–               bioenergetics needs of the RCC cells. Importantly, this
AKT–mTOR signaling, the combination treatment did                    treatment-induced nutrient-depleted condition, while
not induce tumor regression.                                         suppressing proliferation, simultaneously promotes sur-
                                                                     vival by regulating NADPH homeostasis and maintaining
                                                                     mitochondrial-driven oxidation.
Metabolic reprogramming is supported by redox
homeostasis
                                                                     PI3K–AKT–mTOR treatment-induced autophagy
The lack of tumor regression despite effective inhibition
                                                                     promotes phospholipid metabolism
of PI3K–AKT–mTOR signaling led us to question whether
metabolic reprogramming may sustain the survival of the              Therefore, to comprehensively determine how autophagy
treated cancer cells. The PI3K–AKT–mTOR pathway reg-                 contributes to the metabolic needs, we performed global
ulates multiple steps in glucose uptake and metabolism               metabolic analysis using a liquid chromatography-tan-
(Duvel et al. 2010). Therefore, we hypothesized that                 dem mass spectrometry (LC-MS/MS)-based platform
CYT387 and MK2206 treatment singly and in combina-                   (Louie et al. 2016). These studies revealed that CYT387
tion would negatively impact glucose uptake, aerobic                 and MK2206, singly and in combination, effected changes
glycolysis, and, subsequently, biosynthetic pathways, re-            across multiple pathways (Fig. 4A; Supplemental Table
sulting in a drug-enforced reduction in glucose availability         14). Consistent with the role of the PI3K–AKT–mTOR
in the microenvironment. To determine the contribution               pathway in the regulation of glycolysis, treatment with
of CYT387 and MK2206 treatment on the regulation of                  these agents was accompanied by reductions in glucose,
glycolysis, we measured glucose uptake by 18F-fluoro-                glucose-6-phosphate, DG3P, PEP, pyruvate, and lactate,

2072         GENES & DEVELOPMENT
Downloaded from genesdev.cshlp.org on March 1, 2021 - Published by Cold Spring Harbor Laboratory Press
Metabolic reprogramming ensures cancer survival
Figure 3. The effects of treatment on metabolism. (A) The treatment effects of control, CYT387, MK2206, and CYT387+MK2206 on
glucose uptake over time, measured by 18FDG. (B) Glucose and lactate levels in culture medium were measured in control and treated
cells and normalized to cell number. (C ) Qualitative analysis of cell diameter changes of ACHN cells treated with CYT387, MK2206,
CYT387 + MK2206, or vehicle (DMSO). (∗ ) P < 0.02. (D) Glycolysis in ACHN cells was measured using a XF-96 extracellular flux analyzer
after preincubation with drugs or DMSO. Shown are ECAR means ± SD of experimental triplicates. (E) The effects of treatment on basal
ECAR, measured in real time and presented as change in milli-pH per unit time. Representative results are shown. n = 2. (F) Ratios of ox-
ygen consumption rate (OCR; an indicator of OXPHSO) to ECAR (an indicator of aerobic glycolysis at baseline) of treated ACHN cells.
Representative results are shown. n = 2. (G–J) Treatment activates p-AMPK and increases NADPH levels, maintains GSSG/GSH ratios,
and mitigates reactive oxygen species (ROS). (G) ACHN cells were treated with control, 2 µM CYT387, 10 µM MK2206, and CYT387
+MK2206 for 24 h and probed with the indicated antibodies. (H) NADP+/NADPH levels were measured. (I ) GSSG and GSH levels
were measured in lysates (n = 4) using liquid chromatography-tandem mass spectrometry (LC-MS/MS). (J) The normalized abundance
of these metabolites is shown. Cells were stained with the ROS sensor CellRox. n = 3; three independent experiments. P = ns.
consistent with the inhibition of glycolysis (Supplemental observation that the most significant metabolite changes
Fig. S4A), as described above and also concordant with the were in lipid intermediates, including phospholipids, tria-
gene expression data. Similarly, we also observed reduc- cylglycerol (TAG), cholesterol esters, diacylglycerol
tions in PPP intermediates, amino acids, tricarboxylic (DAG), and fatty acids (C16:0, C18:0, and C18:1) (Fig.
acid (TCA) cycle intermediates, and ribose biosynthesis 4A; Supplemental Fig. S4F; Kerner and Hoppel 2000; Ea-
and corresponding increases in purine breakdown prod- ton 2002; Finn and Dice 2006).
ucts guanine and hypoxanthine (Supplemental Fig. S4B– We further investigated the lipid substrates that were ca-
E). These findings are in keeping with a nutrient-deprived tabolized by autophagy to produce fatty acids for fatty acid
state (i.e., decreased anabolism) with subsequent in- oxidation. Steady-state metabolite profiling showed signif-
creased autophagic catabolism to maintain survival (Miz- icant increases in lysophospholipids and arachidonic acid
ushima et al. 2001). Cells adapt to glucose deprivation by (C20:4), with corresponding decreases in their phospholip-
subsisting on fatty acids—mobilized through glycerolipid id precursors (Fig. 4B). Phospholipids, which include phos-
remodeling—for oxidation, and this is consistent with our phatidylcholine (PC), phosphatidylethanolamine (PE),
GENES & DEVELOPMENT 2073Downloaded from genesdev.cshlp.org on March 1, 2021 - Published by Cold Spring Harbor Laboratory Press Lue et al. Figure 4. PI3K–AKT–mTOR signaling inhibition induces metabolic reprogramming. (A) Heat map of metabolomic profiling of treated cells (CYT387, MKK2206, and CYT387+MMK2206) compared with ACHN cells treated with vehicle (DMSO) using LC-MS/MS (see the Materials and Methods for details). Log fold changes of profiled metabolites are shown. Metabolites are ordered within each category: glycolysis, TCA cycle, PPP, nucleotide metabolism, amino acid metabolism, phospholipids, ether phospholipids, lysophospholipids, fatty acids, neutral lipids, acyl carnithines (AC), sphingolipids (SL), and n-acyl ethanolamines (NAE). (B) PLA2 catalyzes the hydrolysis of phos- pholipids to lysophospholipids and arachidonic acid. Waterfall plot demonstrating relative levels of phospholipids, lysophospholipids, and fatty acids in treated cells (CYT387, MK2206, and CYT387+MK2206) compared with ACHN cells treated with vehicle (DMSO). Asterisks denote a significant difference of treated cells compared with vehicle (t-test, P-value ≤ 0.05). phosphatidylserine (PS), phosphatidylglycerol (PG), and line (alkyl-LPC), and free fatty acids (Murakami et al. phosphatidylinositol (PI), are major structural compo- 2011). Accordingly, we found elevated levels of C16:0 nents of cellular membranes. PLA2 is the enzyme that cat- LPC, C18:0 LPC, C18:1 LPC, and C18-0 alkyl-LPC and cor- alyzes the hydrolysis of the phospholipid sn-2 ester bond responding decreases in their phospholipid precursors. No- with subsequent release of lysophospholipids; e.g., lyso- tably, we observed significant decreases in free fatty acids phosphatidylcholine (LPC), alkly-lysophosphatidylcho- (C16:0, C18:0, and C18:1), supporting the idea that 2074 GENES & DEVELOPMENT
Downloaded from genesdev.cshlp.org on March 1, 2021 - Published by Cold Spring Harbor Laboratory Press

                                                                                       Metabolic reprogramming ensures cancer survival

phospholipids are hydrolyzed to supply fatty acids for fatty       by ATG5 −/− and ATG5 +/+ MEFs when treated with
acid oxidation. Consistent with increased arachidonic acid         CYT387, MK2206, and the combination. We found that
levels in CYT387–MK2206-cotreated cells, we observed               CYT387–MK2206 cotreatment profoundly decreased the
increased levels of 14,15-EET, 11,12-EET, 8,9-EET, and 5-          ATG5 −/− MEFs’ mitochondrial OCR and spare respiratory
HETE, pointing to arachidonic acid P450-mediated gener-            capacity (SRC; the quantitative difference between the
ation of eicosanoids (Supplemental Fig. S5).                       maximal OCR and the initial basal OCR), indicating
                                                                   that ATG5 −/− MEFs function near their maximal rate
                                                                   and are unable to maintain an adequate level of mitochon-
PI3K–AKT–mTOR treatment-induced autophagy
                                                                   drial respiration with CYT387+MK2206 cotreatment due
facilitates lipid droplet (LD) formation and
                                                                   to a deficit in their metabolic compensatory mechanisms
mitochondrial respiration
                                                                   (Fig. 5G,H). In contrast, we observed no decrease in mito-
To protect cells from the destabilizing effects of excess          chondrial OCR and SRC in CYT387–MK2206-cotreated
lipids, free fatty acids mobilized by autophagy and des-           ATG5 +/+ MEFs.
tined for oxidation are stored in an intermediate intracel-           The extent of the metabolic difference between vehicle-
lular pool: LDs (Thiam et al. 2013). We reasoned that              treated ATG5 −/− and CYT387+MK2206-cotreated MEFs
the large changes in glycerolipid redistribution identified        was apparent in the overall ratio of OXPHOS to aerobic
by our metabolomics profiling of treated cells would re-           glycolysis (OCR/ECAR), which was twofold higher in
sult in an increased number of LDs to support fatty acid           vehicle-treated than in CYT387–MK2206-cotreated
oxidation, with subsequent mobilization of fatty acids to          ATG5 −/− MEFs, reflective of the need for autophagy to
mitochondria under these nutrient-depleted conditions              supply the nutrients to maintain mitochondrial OCR un-
(Rambold et al. 2015). Consistent with this, we observed           der treatment-enforced metabolic restrictions (Fig. 5I).
that CYT387 and MK2206 singly and in combination in-                  This is in line with a model in which autophagy of cel-
crementally and significantly increased the number and             lular organelles and membranes during nutrient depriva-
size of Bodipy 493/503-labeled (Fig. 5A–C, green) LDs. Ad-         tion produces fatty acids that supply the LD pool, where
ditionally, we incubated ACHN human RCC cells                      they are then transferred into mitochondria for β-oxida-
with Bodipy-C12-HPC (a phospholipid containing green               tion. In support of this, we observed that treated RCC cells
fluorescent long chain fatty acid) followed by treat-              had significantly increased numbers of mitochondria (Fig.
ment with vehicle or the CYT387–MK2206 combination.                5J). Accordingly, dual staining of treated ACHN cells with
CYT387–MK2206 cotreatment led to a greater degree of               a mitochondrial marker (Mitotracker orange) and LDs
incorporation of Bodipy-C12-labeled fatty acids into LDs           with Bodipy (Fig. 5K, green) revealed that the LDs were
relative to vehicle-treated cells. This suggests that              closely associated with the mitochondria, potentially en-
CYT387–MK2206 treatment-induced autophagy results                  abling the fatty acids released from LDs to traffic directly
in phospholipid hydrolysis that releases fatty acids, which        from LDs to mitochondria and maximizing the fatty acid
are subsequently incorporated into new LDs (Supplemen-             oxidation (Fig. 5K; Rambold et al. 2015).
tal Fig. S6).                                                         Importantly, cancer cells become increasingly depen-
   To determine whether the increase in LDs occurred in            dent on mitochondrial fatty acid oxidation in nutrient-de-
vivo, we stained the vehicle, CYT387, MK2206, and                  pleted conditions (Fig. 5L; Cabodevilla et al. 2013).
CYT387–MK2206-cotreated xenograft tumors for adipo-                Consistent with this, using the Mito Fuel Flex test, we
philin, which belongs to the perilipin family, members             found that human ACHN RCC cells’ dependence on fatty
of which coat intracellular lipid storage droplets and facil-      acid doubled with CYT387–MK2206 cotreatment (Fig.
itate metabolic interactions with mitochondria (Sztalryd           5M). Consequently, oxidation of endogenous fatty acids
and Kimmel 2014). Consistent with the in vitro data,               significantly contributed to the OXPHOS rate in
the number of adipophilin-positive LDs significantly and           MK2206+CYT387-cotreated cells compared with control
incrementally increased with treatment (as measured on             (>2.5-fold increase; P < 0.0001) (Fig. 5N). Consistent with
treatment day 40 in ACHN xenograft tumors;                         this, induction of fatty acid oxidation by CYT387–
CYT387
Downloaded from genesdev.cshlp.org on March 1, 2021 - Published by Cold Spring Harbor Laboratory Press
Lue et al.
Figure 5. Autophagy is required for LD growth
and fatty acid oxidation. (A) ACHN cells were
treated with control, CYT387, MK2206, and
CYT387+MK2206 for 24 h, and Bodipy 493/503
(green) was added to visualize LDs. Representative
images are shown. n = 5 experiments. (B,C) Bar
graphs quantify the increase in number (B) and
size (C ) of LDs, respectively. Data are expressed
as means ± SEM. (∗ ) P < 0.001 for control versus
CYT387, control versus MK2206, and control ver-
sus CYT387+MK2206. (D) Adipophilin staining in
xenograft tumors quantifies the increase in LDs in
vivo. n = 9. Data are expressed as means ± SEM. (∗ )
P < 0.01 for control versus CYT387 and control
versus MK2206, measured in tumors resected af-
ter 40 d of treatment. (E) ATG5 +/+ MEFs were
treated with 2 µM CYT387, 10 µM MK2206, and
the combination for 24 h. Bodipy was added, and
the LD number was measured. n = 500 cells. (∗ ) P
< 0.001 for control versus CYT387 and control ver-
sus CYT387+MK2206; P < 0.005 for control versus
MK2206. (F ) ATG5 −/− MEFs treated as in E. Bod-
ipy was added, and the LD number was measured.
n = 500 cells. P = NS (no significance between
treatment groups). (G) ATG5 +/+ and ATG5 −/−
MEFs were treated with DMSO (control),
CYT387, MK2206, and CYT387+MK2206 for 24
h, and then OCRs (indicator of OXPHOS) were de-
termined using a XF-96 extracellular flux analyzer
during sequential treatments (dotted vertical
lines) with oligomycin, FCCP, and rotenone/
anti-mycin (A+R). Spare respiratory capacity
(SCR) is the quantitative difference between max-
imal uncontrolled OCR (top horizontal dashed
line) and the initial basal OCR (bottom horizontal
dashed line). Shown are OCR means ± SD of exper-
imental triplicates. For ease of viewing, only con-
trol and CYT387 + MK2206 data are graphed. (H)
SRC (the percentage maximum OCR after FCCP
injection of baseline OCR) of ATG5 +/+ and
ATG5 −/− MEFs after the indicated treatments.
Shown are means ± SD of experimental triplicates. (I) Ratios of OCR to ECAR (indicator of aerobic glycolysis) at baseline of ATG5 +/+
and ATG5 −/− MEFs after the indicated treatments. (J) ACHN cells were treated with control, CYT387, MK2206, and YT387+MK2206
for 24 h, and Mitotracker orange was added to visualize mitochondria. Representative images are shown. n = 5 experiments. Mitochondria
number was measured, and data are expressed as means ± SEM. (∗ ) P < 0.001 for control versus CYT387, control versus MK2206, and con-
trol versus MK2206+CYT387. (K) Dual staining of Bodipy and Mitotracker orange demonstrate close proximity of LDs with mitochondria
in CYT387+MK2206-cotreated ACHN cells (a representative image is shown). (L) Global metabolite profiling reveals a preferential
decrease in lipids. (Decrease) AbundanceDownloaded from genesdev.cshlp.org on March 1, 2021 - Published by Cold Spring Harbor Laboratory Press
Metabolic reprogramming ensures cancer survival
(Fig. 6A,B). Since several isoforms of PLA2 exist, we deter- ptosis (Fig. 6H–J). Collectively, these data indicate that
mined their role in reducing LDs. We found that treatment-induced autophagy provides lysophospholipids
inhibition of calcium-sensitive PLA2 (with cPLA2i) and free fatty acids to maintain cancer cell survival de-
and calcium-insensitive PLA2 (with bromoenol lactone spite nutrient depletion.
[BEL]) was also able to reduce LD number, consistent
with the rate-limiting role of PLA2 in mediating phospho-
lipid hydrolysis (Supplemental Fig. S9). To document the Discussion
kinetics of the new pool of CYT387–MK2206-induced
LDs, we performed a time-course experiment to monitor It is now generally accepted that autophagy is cytoprotec-
the appearance of LDs following CYT387–MK2206 tive in the setting of cancer therapies by enabling cancer
cotreatment and ascertained that LDs appeared 2 h after cells to mitigate metabolic and therapeutic stresses,
treatment and then continuously increased in number thereby ensuring survival (Amaravadi et al. 2011; Sehgal
during the next 24 h of monitoring. In contrast, simul- et al. 2015; Rebecca and Amaravadi 2016). To date,
taneous addition of OOPEC to the CYT387–MK2206 the therapeutic reflex to block autophagy is to add anti-
combination at the start of treatment completely blocked malarial lysosomotropic inhibitors such as chloroquine.
the appearance of LDs. Similarly, addition of OOPEC However, the clinical responses to these have been under-
at 2 h after cotreatment with CYT387+MK2206 whelming (Goldberg et al. 2012; Shanware et al. 2013;
completely inhibited any further increase in LDs. Sub- Rosenfeld et al. 2014; Towers and Thorburn 2016). While
sequently, the addition of etomoxir at 8 h (which blocks the role of autophagy in tumor initiation and progression
the utilization of fatty acids) resulted in LD accumulation has been well-documented, little is known about how
in OOPEC+CYT387+MK2206-treated cells. These results treatment-induced autophagy mediates cytoprotection
demonstrate that PLA2 activity is required for LD gener- and resistance.
ation after CYT387–MK2206 cotreatment and that Our results demonstrate that cancer cells, when acutely
OOPEC is able to inhibit PLA2 activity (Supplemental exposed to small molecule inhibitors, activate the auto-
Fig. S10). phagic process to ensure early and lasting metabolic adap-
To directly test the metabolic impact of OOEPC treat- tations designed to enhance survival in a nutrient-
ment, we first assessed changes in the OCR. We observed depleted environment. We first observed the maintenance
a marked decrease in the basal OCR when OOEPC was of OXPHOS when glucose became limiting due to treat-
added to the CYT387–MK2206 combination. Important- ment. Likewise, the coordinate activation of AMPK sig-
ly, the addition of OOPEC profoundly reduced the SRC, naling ensures protective redox homeostasis to mitigate
indicating that the inhibition of PLA2 decreases mito- increased ROS produced by OXPHOS. Finally, we demon-
chondrial oxidation by reducing fatty acid supply and im- strated activation of autophagy-mediated membrane gly-
pedes the cells’ capacity to respond to increased energetic cerophospholipid metabolism with subsequent fatty acid
demands (Fig. 6C,D). The marked reduction in SRC was oxidation to generate energy. Accordingly, we found
similar to our earlier observations in CYT387–MK2206- that therapy-induced autophagy purposefully harnesses
treated ATG5 −/− MEFs and is consistent with the model core biological processes to secure tumor cell fitness and
in which autophagy-supplied LDs are required to support survival. Our experiments involving autophagy-incompe-
mitochondrial OCR in metabolically restricted environ- tent ATG5 −/− MEFs demonstrate that autophagy is re-
ments (Fig. 5G–I). Next, by plotting OCR versus ECAR, quired under conditions of nutrient depletion to
we determined the effect of PLA2 inhibition by OOEPC generate LDs and maintain mitochondrial OCR and
on CYT387–MK2206-treated tumors; this measurement SRC. It is not coincidental that LD depletion by pharma-
highlighted that untreated ACHN human RCC cells cological PLA2 inhibition achieved similar results. This
have higher OXPHOS and glycolysis compared with is consistent with the model that autophagic digestion
CYT387–MK2206-cotreated cells (Fig. 6E). The addition of phospholipids, with subsequent hydrolysis within the
of OOEPC markedly decreased OCR in ACHN cells, indi- autolysosome, provides LDs with a constant supply of lip-
cating that these treatments diminished the overall meta- ids, which can then be trafficked to the mitochondria to
bolic activity of the cancer cells. maintain mitochondrial respiration. The subsequent re-
This observed reduction in bioenergetic metabolism led lease of these fatty acids from LDs to fuel β-oxidation
us to determine whether PLA2 inhibition would have an may occur independently of lipophagy, as others have ob-
impact on proliferation and apoptosis. Cotreatment with served (Rambold et al. 2015). Additionally, another possi-
OOEPC had a minimal additional effect on proliferation ble source of fatty acids and amino acids may come from
(Fig. 6F). In contrast, the addition of OOEPC significantly extracellular lysophospholipids and proteins through
increased apoptosis, consistent with its ability to reverse macropinocytosis.
autophagy-supplied fatty acids that enable survival This study further addresses the wider question of how
(Fig. 6G). To further verify that PLA2 inhibition impacted cancer cells survive despite the inhibition of mTOR (an
cancer cell survival, we tested a distinct PLA2 inhibitor, evolutionarily conserved master regulator of cell metabo-
varespladib, which has been clinically developed for lism, proliferation, growth, and survival) and AKT (a com-
cardiovascular diseases (Rosenson et al. 2010). Similar mitted prosurvival kinase that positively regulates these
to OOEPC, the addition of varespladib to CYT387– same processes in both normal and cancer cells) (Manning
MK2206-treated cells decreased LDs and increased apo- and Cantley 2007; Laplante and Sabatini 2012).
GENES & DEVELOPMENT 2077Downloaded from genesdev.cshlp.org on March 1, 2021 - Published by Cold Spring Harbor Laboratory Press Figure 6. Hydrolysis of phospholipid supplies lysophospholipids and fatty acids for cancer cell survival. (A) ACHN cells were treated with control, OOEPC, CYT387, CYT387+OOEPC, MK2206, MK2206+OOEPC, CYT387+MK2206, and CYT387+MK2206+OOEPC for 24 h. Bodipy 493/503 (green) was added to visualize LDs. Representative images are shown. n = 3 experiments. (B) Bar graphs quantify the number of LDs. Data are expressed as means ± SEM. (∗ ) P < 0.0001 for CYT387 versus CYT387+OOEPC, MK2206 versus MK2206 +OOEPC, and CYT387+MK2206 versus CYT387+MK2206+OOEPC. (C,D) ACHN cells were treated with DMSO (control), OOEPC, CYT387, CYT387+OOEPC, MK2206, MK2206+OOEPC, CYT387+MK2206, and CYT387+MK2206+OOEPC for 24 h, and then OCR was determined using a XF-96 extracellular fux analyzer during sequential treatments with oligomycin, FCCP, and rotenone/anti-mycin (A+R). (D) Initial basal OCR, maximal OCR, SRC (the quantitative difference between maximal uncontrolled OCR and the initial basal OCR), and ATP production are depicted in the plot. Shown are OCR means ± SD of experimental triplicates. For ease of viewing, only con- trol, OOEPC, CYT387+MK2206, and CYT387+MK2206+OOEPC data are graphed. (E) OCR versus ECAR (means ± SEM, experimental triplicates) after the addition of OOEPC to the CYT387–MK2206 combination. (Con) Control; (O) OOEPC; (C+M) CYT387+MK2206; (C+M+O) CYT387+MK2206+OOEPC. (F,G) Cell viability (F ) and caspase 3/7 activity (G) with addition of OOEPC to CYT387, MK2206, and CYT387+MK2206. n = 3. Data are expressed as means ± SD. (F) P = ns for CYT387+MK2206 versus CYT387+MK2206 +OOEPC. (G) (∗ ) P < 0.001 for CYT387+MK2206 versus CYT387+MK2206+OOEPC. (H) The effect of adding varespladib, a distinct PLA2 inhibitor, to CYT387, MK2206, and CYT387+MK2206 on LD numbers was evaluated with Bodipy staining (I,J) Cell viability (I ) and caspase 3/7 activity (J) with the addition of varespladib, a distinct PLA2 inhibitor, to CYT387, MK2206, and CYT387+MK2206. n = 3. Data are expressed as means ± SD. (I ) (∗ ) P < 0.01 for CYT387+MK2206 versus CYT387+MK2206+varespladib. (J) (∗ ) P < 0.1 for CYT387+MK2206 versus CYT387+MK2206+varespladib. 2078 GENES & DEVELOPMENT
Downloaded from genesdev.cshlp.org on March 1, 2021 - Published by Cold Spring Harbor Laboratory Press

                                                                                         Metabolic reprogramming ensures cancer survival

Undoubtedly, the combination of attenuated proliferation           that balance target engagement with side effects. Howev-
signals, nutrient depletion, and metabolic competition for         er, most small molecule inhibitors have favorable toxicity
remaining nutrients kills many cells. Accordingly, our             profiles, and metabolic targets would be non-cross-resis-
data demonstrate that glucose, which is tightly regulated          tant and predicted to have different side effects that are
by the PI3K–AKT–mTOR pathway at multiple steps,                    not overlapping. The experience with infectious diseases
became limiting with treatment, with a resultant decrease          highlights the importance of combinations to achieve rap-
in glycolysis (Engelman et al. 2006; Yecies and Manning            id efficient cancer suppression; i.e., HAART (highly active
2011; Hu et al. 2016). However, the very same conditions           anti-retroviral therapy) in HIV, which is routinely used to
that give rise to these nutrient-deprived microenviron-            produce durable clinical responses and prevent the emer-
ments also induced autophagy. Consequently, the auto-              gence of resistance. Polytherapy in cancer is similarly jus-
phagic catabolism of membrane phospholipids provides a             tified and achievable, and here we outline the molecular
ready source of free fatty acids that maintains respiration        roadmap for interdicting signaling and metabolism to
in subpopulations of cancer cells, therefore enabling their        override treatment-induced autophagy.
survival in a low-glucose environment. The increase in fat-
ty acid oxidation and OXPHOS requires redox homeosta-
sis, and this is provided by the concomitant activation of         Materials and methods
AMPK, which increases NADPH, with a subsequent mit-
igation of ROS. Collectively, treatment-enforced metabol-          Cell lines
ic reprogramming supports cancer cell fitness by providing         ACHN, Caki-1, RCC10, SN12C, TK-10, U031, 786-0, UKE-1,
fatty acids and NADPH to maximize survival.                        SET-2, and HEL were used in this study and were obtained from
   Since the rate of autophagic release of fatty acids does        American Type Culture Collection. ATG5 +/+ and ATG5 −/−
not match the rate of mitochondrial consumption, these             MEFs were a kind gift from Jay Debnath (University of California
LDs serve a dual purpose: first, as a buffer to reduce lipo-       at San Francisco). Cell lines were maintained in Dulbecco’s mod-
toxicity by storing lipid intermediates and, second, to            ified Eagle’s medium (DMEM) supplemented with 10% fetal bo-
transport these lipids to the mitochondria (Singh et al.           vine serum (FBS) at 37°C in a 5% CO2 incubator.
2009; Unger et al. 2010; Rambold et al. 2015). Conse-
quently, these energy-strapped residual cancer cells in-
crease fatty acid oxidation, as it is the most energetically       Patient tumor ex vivo organotypic culture
efficient way to generate ATP. Long-lived cell types               Tumor tissue samples were collected at the time of surgical re-
such as cardiac myocytes and memory T cells (Pearce                moval from consented patients and transported in IMEM + FBS
et al. 2009; Chung et al. 2010) depend on fatty acid metab-        + PS. The tissue was sliced into thin sections using a surgical
olism for survival, and we see this as yet another example         knife. Sections were cultured on an organotypic insert (EMD,
of cancer cells hijacking normal physiological processes to        PICMORG50) for 24 h in IMEM, 10% FBS, 1% PS, and 50 µg/
their benefit.                                                     mL holo-transferrin with drug. A section of each tumor was im-
   Our screen identified several structurally different Ja-        mediately fixed in 10% buffered formalin to confirm tissue viabil-
                                                                   ity. After culture, treated tissue sections were fixed in 10%
nus family kinase inhibitors that inhibited mTORC1
                                                                   buffered formalin and embedded in paraffin. Paraffin-embedded
and induced autophagic flux. While serendipitous, these
                                                                   tumors were evaluated for morphology (H&E) and immunofluo-
findings are not unexpected, as small molecules inhibit            rescent signaling.
several kinases and would directly and/or indirectly inter-
dict the PI3K–AKT–mTOR pathway. To date, JAK inhibi-
tors have been approved for and/or are undergoing late             Cell viability and apoptosis analysis
stage clinical trials in MPN, including the focus of this
study, CYT387 (momelutinib) (Patel et al. 2016; Winton             Cell viability assays were performed by plating 3 × 10³ cells per
and Kota 2017). However, complete cytogenetic or molec-            well in 24-well plates in triplicate and treating them the following
                                                                   day with the indicated agents. The experiment was continued for
ular responses with JAK inhibitors have not been ob-
                                                                   5 d, and then the cells were fixed using 4% formaldehyde and
served, with clinical benefit mainly resulting from                stained for 1 h with Syto60. Fluorescence was measured and
improved performance status due to reduced cytokine lev-           quantified, and photographs were obtained using a LiCor Odyssey
els rather than the elimination of cancer cells (Verstovsek        infrared imager. The effect of CYT387, MK2206, and the CYT387
et al. 2012; Vannucchi et al. 2015). Therefore, our finding        +MK2206 combination on cell number was assessed as fold of
that JAK inhibitors induce autophagy in both solid tumors          DMSO-treated control cells. Experimental results are the average
and MPN cells, which then maintain residual disease po-            of at least three independent experiments. Apoptosis was deter-
tentially through the hydrolysis of phospholipids, may of-         mined using caspase 3/7 Glo assay kit (Promega) following the
fer an explanation of why this class of inhibitors has not         manufacturer’s instructions. Briefly, 2000 cells per well were
been able to eliminate drug-tolerant cancer cells and ef-          plated in 96-well plates and cultured for 72 h. Cells were treated
                                                                   with CYT387, MK2206, and the combination of CYT387 and
fect durable responses.
                                                                   MK2206 for 72 h, and then 100 µL of reagent was added to each
   Combination therapies come with the increased risk of           well and incubated for 30 min at room temperature. Caspase 3/
side effects. Notably, CYT387, MK2206, and varespladib             7 activity was measured using a luminometer. Luminescence val-
have all been tested in human clinical trials, and their           ues were normalized by cell numbers. The effect of CYT387,
maximum tolerated doses have been established; the chal-           MK2206, and the CYT387+MK2206 combination on caspase 3/
lenge ahead will be to develop optimal dosing schedules            7 activation was assessed as fold of DMSO-treated control cells.

                                                                                                    GENES & DEVELOPMENT            2079
You can also read