Generating a Mouse Model of Symptomatic and Asymptomatic Intracerebral Hemorrhage by Applying High-Pressure Focused Ultrasound
←
→
Page content transcription
If your browser does not render page correctly, please read the page content below
Generating a Mouse Model of Symptomatic and Asymptomatic Intracerebral

       Hemorrhage by Applying High-Pressure Focused Ultrasound

                        Crystal Marie Destiny Collier

                     Submitted in partial fulfillment of the
                         requirements for the degree of
                             Doctor of Philosophy
                        under the Executive Committee
                 of the Graduate School of Arts and Sciences

                        COLUMBIA UNIVERSITY

                                    2021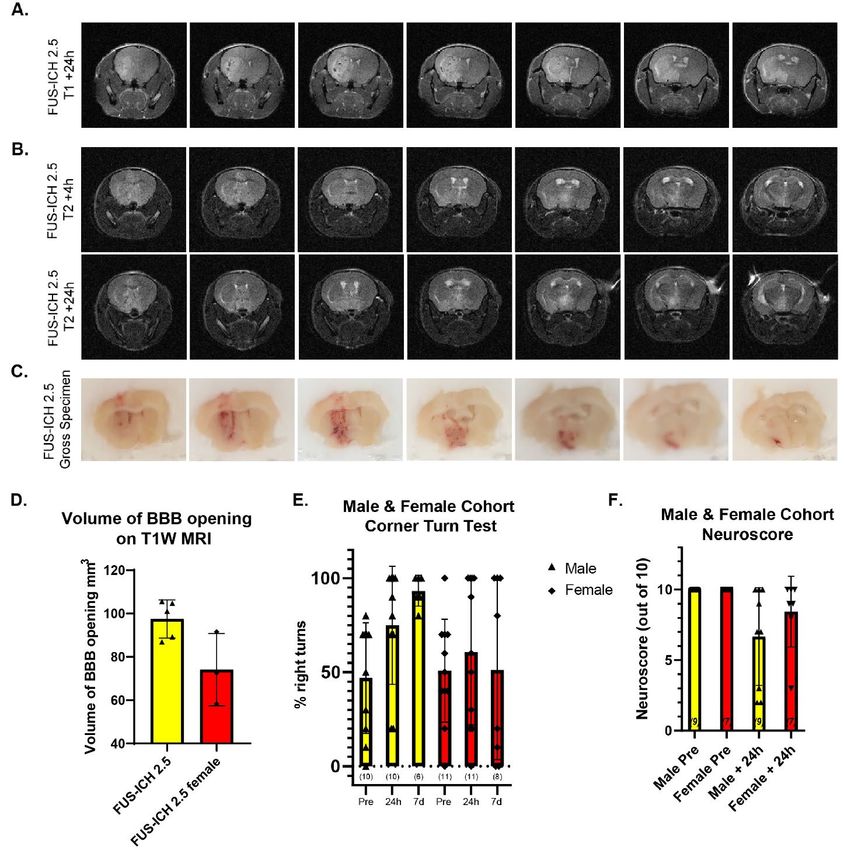
© 2021

Crystal Marie Destiny Collier

    All Rights Reserved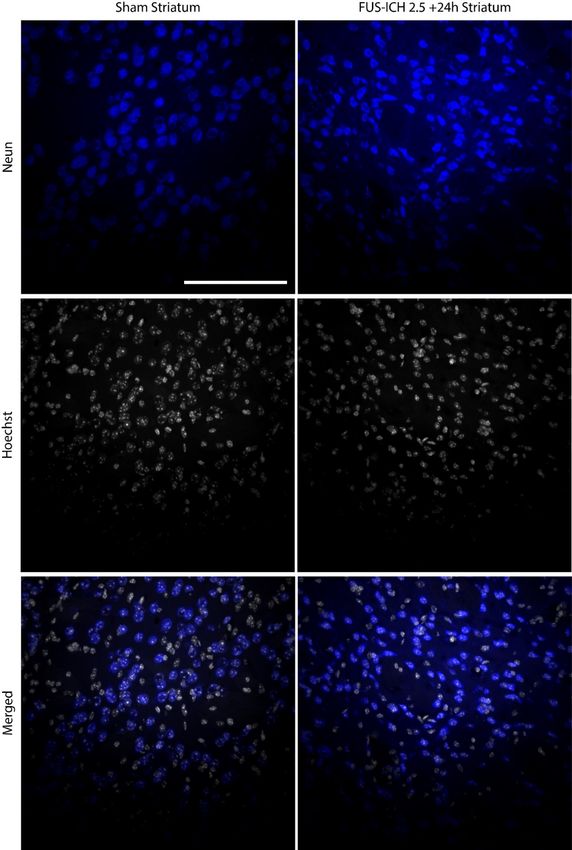
Abstract

  Generating a Mouse Model of Symptomatic and Asymptomatic Intracerebral Hemorrhage by

                          Applying High Pressure Focused Ultrasound

                                 Crystal Marie Destiny Collier

       Intracerebral hemorrhage defines a category of neurological disease that spans the full

range of possible clinical outcomes. At one end of the spectrum is hemorrhagic stroke, an

oftendebilitating neurologic condition with substantial morbidity and mortality while cerebral

microhemorrhage at the other end of the spectrum can go completely unnoticed as they are often

asymptomatic. Despite the distinct clinical outcomes both conditions share a common risk factor,

uncontrolled hypertension. Here we set out to generate a novel mouse model of intracerebral

hemorrhage with pressure as the mode of hemorrhage induction. To conduct our studies, we

utilize high pressure focused ultrasound in combination with injected microbubbles to cause

hemorrhage. We applied this technique at two different pressures resulting in striatal hemorrhage

induction with distinct phenotypic outcomes. Following induction at the higher-pressure, mice

show evidence of lateral motor deficit and other signs of impairment. Mice with hemorrhage

induced at the lower pressure show no behavioral signs of neurological deficit. We employ

immunofluorescence and western blotting to understand the cellular responses to intracerebral

hemorrhage in these mice. We find evidence of inflammation and cell death following high-

pressure induction of intracerebral hemorrhage. Lower pressure induction of intracerebral

hemorrhage lacks signs of cell death but shows apparent inflammation. We have created a novel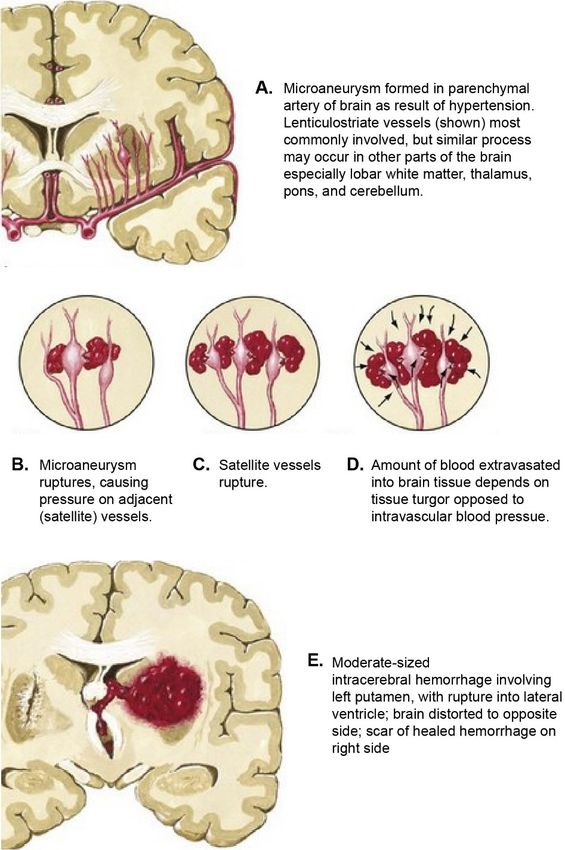
pressure-dependent mouse model of symptomatic and asymptomatic intracerebral hemorrhage

by applying high intensity focused ultrasound in combination with circulating microbubbles.
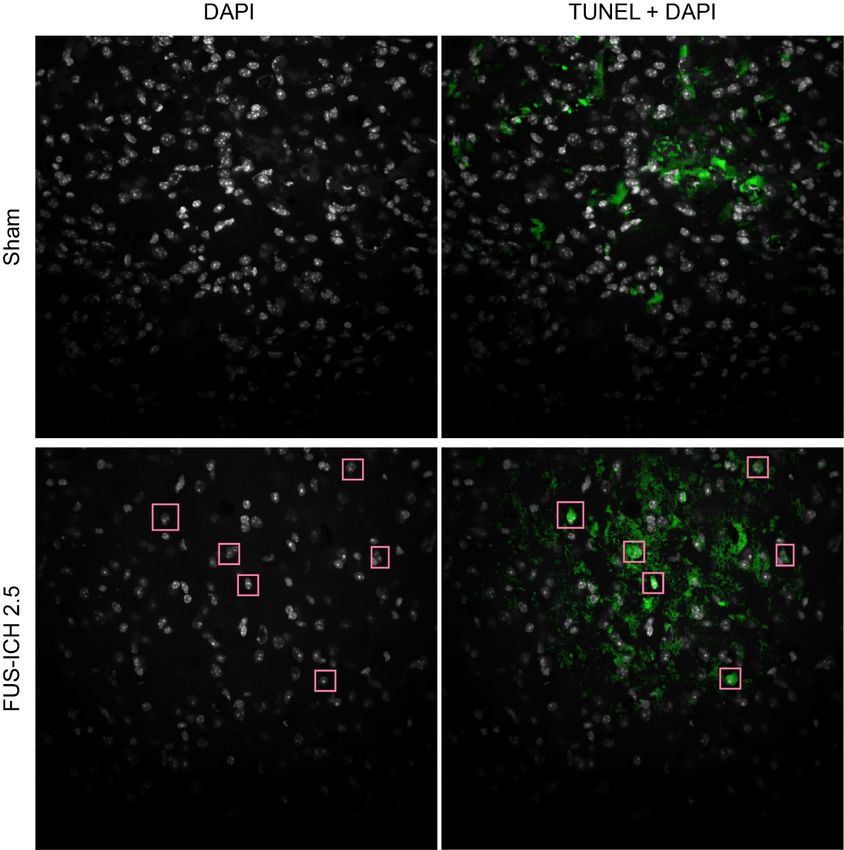
Table of Contents

List of Figures and Tables.............................................................................................................. iv

List of Abbreviations and Acronyms ............................................................................................. vi

Acknowledgments........................................................................................................................ viii

Dedication ...................................................................................................................................... ix

Chapter 1: Introduction ................................................................................................................... 1

           1.1 Neurologic disease: stroke ............................................................................................ 1

                      1.1.1 Intracerebral hemorrhage ............................................................................... 2

                      1.1.2 Hemorrhagic stroke therapies and clinical studies......................................... 5

                      1.1.3: Cerebral microbleed ...................................................................................... 7

                      1.1.4 Mouse models of intracerebral hemorrhage .................................................. 8

           1.2 Neuroinflammation: Microglia and Astrocytes .......................................................... 10

           1.3 Cell death pathways .................................................................................................... 13

           1.4 Focused Ultrasound .................................................................................................... 15

                      1.4.1 Applications: Therapeutic ............................................................................ 17

                      1.4.2 Applications: Disease Models...................................................................... 18

Chapter 2: Materials and Methods ................................................................................................ 19

           2.1 Mouse husbandry ........................................................................................................ 19

                      2.1.1 Intracardiac perfusion .................................................................................. 19

           2.2 Focused ultrasound Application ................................................................................. 19

           2.3 MRI ............................................................................................................................. 21

           2.4 Behavioral assays ........................................................................................................ 21

           2.5 Histochemistry ............................................................................................................ 22
                                                                         i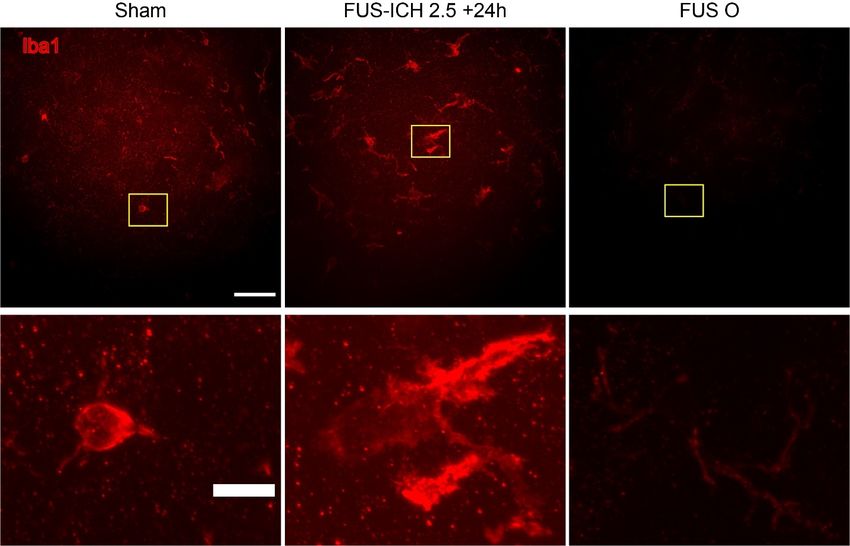
2.5.1 Immunofluorescence .................................................................................... 22
2.5.2 Hematoxylin and Eosin ................................................................................ 24
2.6 Biochemistry ............................................................................................................... 24
2.6.1 Western Blot ................................................................................................ 24
Chapter 3: FUS-ICH at 2.5 MPa Hemorrhage and Behavior ....................................................... 27
3.1: Introduction................................................................................................................ 27
3.2: FUS-ICH Procedure ................................................................................................... 28
3.3: Application of FUS-ICH results in large BBB opening by 1 hour ............................ 30
3.4: Changes apparent on T2 weighted MRI are dynamic over time ............................... 32
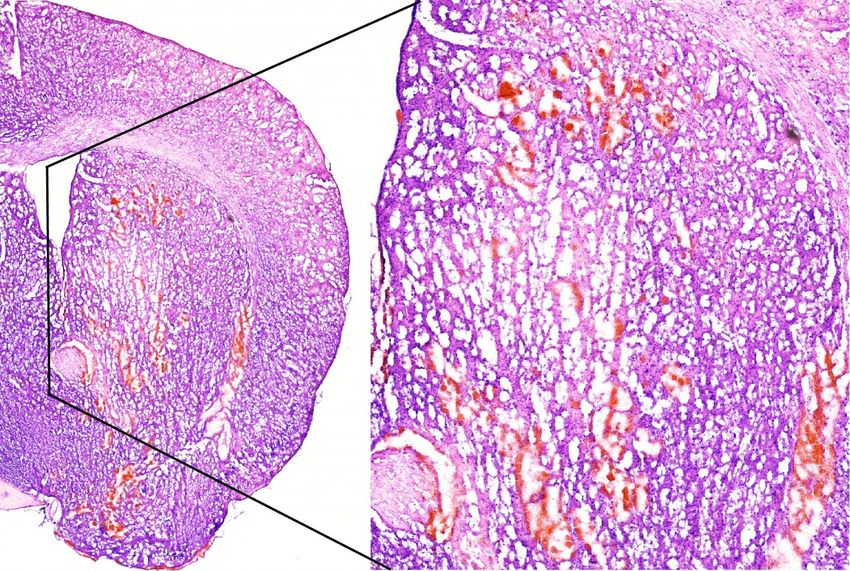
3.5 Hematoxylin and Eosin (H&E) ................................................................................... 34
3.6: Time course................................................................................................................ 35
3.7: Focused Ultrasound alone does not induce frank pathology ..................................... 36
3.8 Behavioral Analysis .................................................................................................... 37
3.9 Female mice show a more variable response to FUS-ICH ......................................... 39
3.10 Conclusions ............................................................................................................... 42
Chapter 4: FUS-ICH 2.5 Induces Cellular Responses Relevant to Intracerebral Hemorrhage .... 43
4.1 Inflammation ............................................................................................................... 43
4.1.1 Morphologic changes in Iba1 following FUS-ICH 2.5 ............................... 43
4.1.2 Results 2: CD 68 is increased in FUS-ICH 2.5 condition up to 3 days ....... 45
4.1.3 Results 3: Astrocytes show dynamic response to FUS-ICH 2.5 .................. 49
4.2 Cell death .................................................................................................................... 51
4.2.1 The presence of cell death in FUS-ICH 2.5 is shown with TUNEL............ 51
4.3 Conclusions ................................................................................................................. 54
ii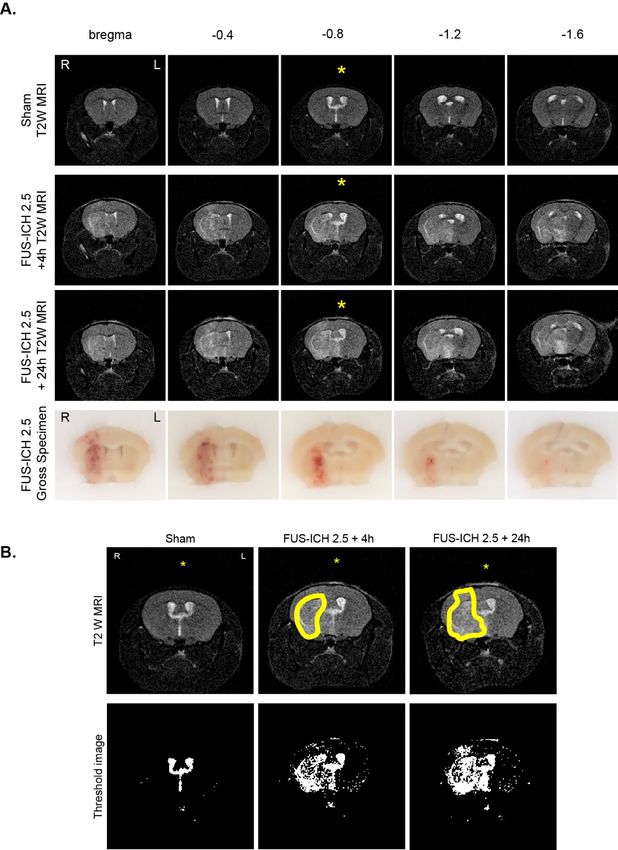
Chapter 5: FUS-ICH 1.5 MPa....................................................................................................... 55

           5.1 Introduction ................................................................................................................. 55

           5.2: BBB opening and Hematoma on MRI....................................................................... 56

           5.3 Hemorrhage is visible on gross specimen slices ......................................................... 58

           5.4: Behavioral analysis shows no significant deficit following FUS-ICH ...................... 58

           5.5 Inflammation is present 24 hours following FUS-ICH 1.5......................................... 61

           5.6 No neuron loss is observed in the perihematomal striatum 24 hours following

           FUS-ICH 1.5 ..................................................................................................................... 62

           5.7 Conclusions ................................................................................................................. 64

Chapter 6: Conclusions and Future Directions ............................................................................. 65

           6.1 Future studies of inflammation ................................................................................... 70

           6.2 Future studies of cell death ......................................................................................... 71

References ..................................................................................................................................... 73

Apendix 1: FUS-ICH 2.5 in Microglial Caspase 8 KO mice ....................................................... 86

                                                                       iii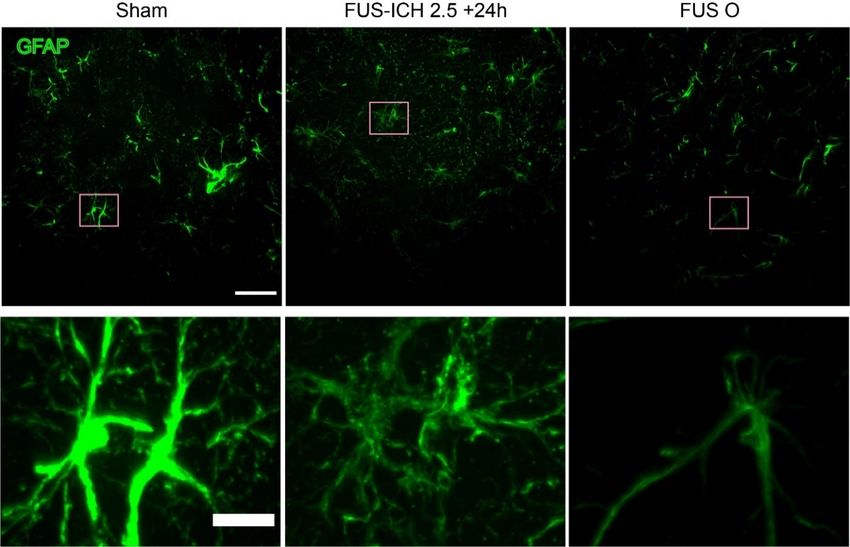
List of Figures and Tables

Chapter 1

Figure 1.1: Global Burden of Neurologic Disease

Figure 1.2: Pathophysiology of intracerebral hemorrhage

Figure 1.3: Cerebral microhemorrhage

Figure 1.4: Schematic of microglial activation states

Chapter 2

Table 2.1 Antibody Catalogue

Chapter 3

Figure 3.1: FUS-ICH Schematic

Figure 3.2: Gadolinium enhanced T1 weighted MRI following FUS-ICH 2.5

Figure 3.3: T2 weighted MRI

Figure 3.4: H&E Imaging of FUS-ICH 2.5 +24 h

Figure 3.5: T2 weighted MRI and gross specimen timecourse

Figure 3.6: FUS Only

Figure 3.7: Behavioral analysis

Figure 3.8: FUS-ICH in female mice

Chapter 4

Figure 4.1: Striatal Microglial Hypertrophy following FUS-ICH 2.5 is not seen in FUSO

Figure 4.2: Perihematomal Microglial Morphology time course

                                               iv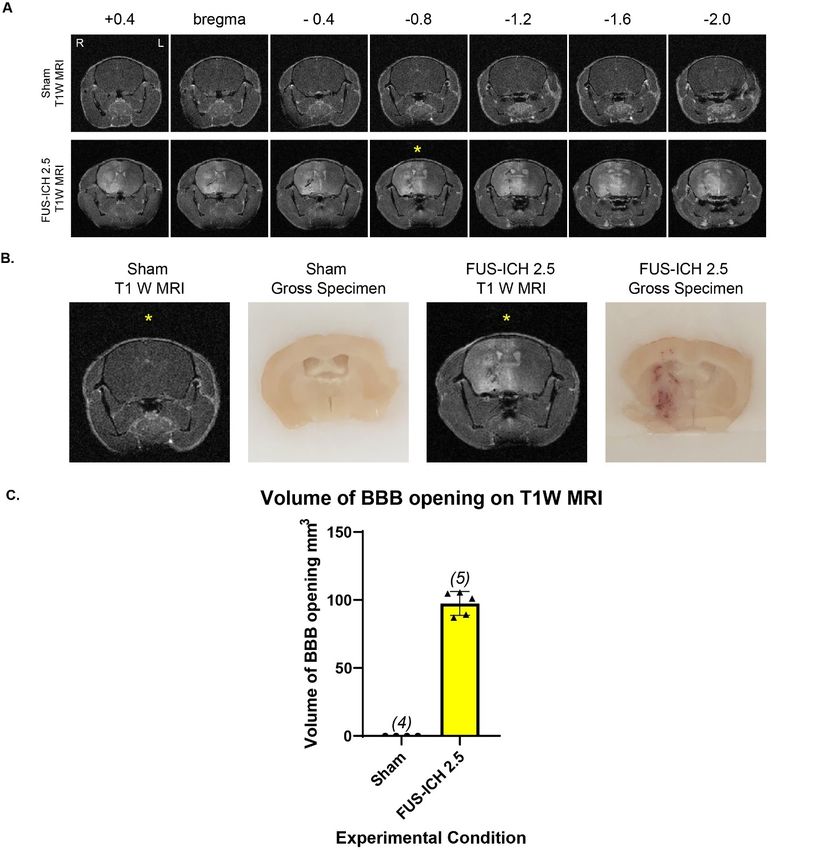
Figure 4.3: Striatal CD68 is increased in FUS-ICH 2.5 and reduced in FUSO

Figure 4.4: No difference in CD68 protein levels in Sham, FUS-ICH 2.5, and FUSO

Figure 4.5: Perihematomal CD68 increases up to 3 days post FUS-ICH 2.5

Figure 4.5: Striatal GFAP shows reduced intensity and morphologic changes in FUS-ICH and

FUSO

Figure 4.6: Perihematomal GFAP is low at 1-hour post FUS-ICH with profound increase by 3

days

Figure 4.7: TUNEL positivity in FUS-ICH 2.5 + 24h

Figure 4.8: Cl casp3 and pMLKL are seen at similar levels in FUS-ICH 2.5 as sham

Chapter 5

Figure 5.1: FUS-ICH induces blood brain barrier opening and hemorrhage appreciable on MRI

Figure 5.2: Hemorrhage visible on gross specimen

Figure 5.3: Behavioral testing reveals no lateral motor deficit following FUS-ICH 1.5

Figure 5.4: Iba1 morphology altered 24 h after FUS-ICH 1.5 perihematomally

Figure 5.5: No reduction in NeuN positive cells following FUS-ICH 1.5 in the perihematomal

region

Appendix 1

Figure A1: FUS-ICH 2.5 with reduced hemorrhage in Microglial Caspase 8 KO mice

                                               v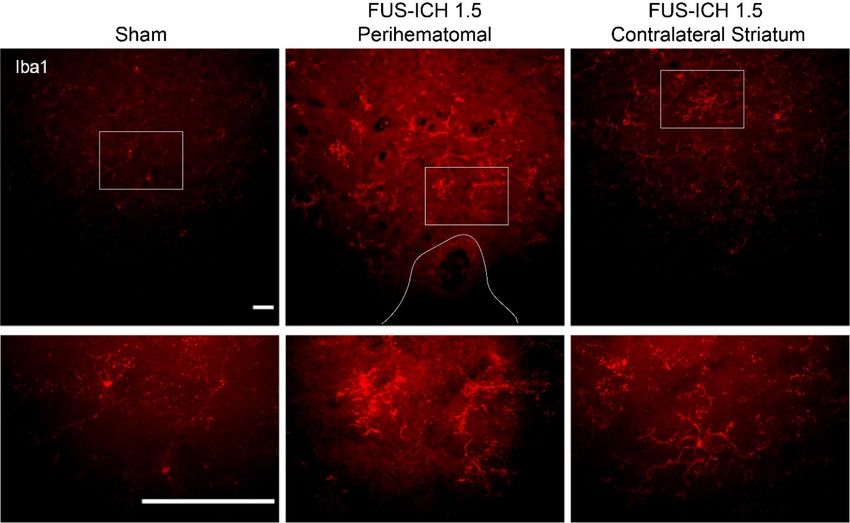
List of Abbreviations and Acronyms

APAF1: apoptotic protease activating factor 1

ATACH: Antihypertensive Treatment of Acute Cerebral Hemorrhage Trial

ATACH II: Antihypertensive Treatment of Acute Cerebral Hemorrhage II Trial

BME: beta mercaptoethanol

cl casp 3: Cleaved caspase 3

CT: Computed Tomography

DAM: disease associated microglia

FUS-ICH: Focused Ultrasound-Induced Intracerebral hemorrhage

FUS-ICH 1.5: Focused Ultrasound-Induced Intracerebral hemorrhage at 1.5 MPa

FUS-ICH 2.5: Focused Ultrasound-Induced Intracerebral hemorrhage at 2.5 MPa

FUSO: Focused Ultrasound Only

GD: gadolinium

GFAP: Glial Fibrillary Acidic Protein

H&E: Hematoxylin and Eosin

IAPs: inhibitors of apoptosis

i-DEF: The Deferoxamine mesylate in patients with intracerebral hemorrhage Trial

LAMP: lysosomal associated membrane protein

MRI: Magnet Resonance Imaging

PBS: Phosphate Buffer Solution

PL: Pulse length

pMLKL: phosphorylated Mixed Linkage Kinase domain Like pseudokinase

PRF: Pulse repetition Frequency

                                                vi
ROS: reactive oxygen species
STICH: The Surgical Treatment of Intracerebral Hemorrhage Trial
T1W MRI: T1 Weighted MRI
T2W MRI: T2 weighted Magnet Resonance Imaging
TBS: Tris-Buffered Saline
TPA: Tissue plasminogen antigen
TUNEL: Terminal dUTP Nick End Labeling
viiAcknowledgments
Many are deserving of acknowledgement for their support during the execution of this work. I
would like to acknowledge my mentor Dr. Carol Troy, the members of the Troy lab, Dr. Yuji
Mishina, Dr. Haoxing Xu, Dr. Hilda Hutcherson, the MSTP Coordinators, my Thesis Committee
Members Dr. Dritan Agalliu, Dr. James Goldman, Dr. E. Sander Connolly, Dr. Elisa Konofagou,
the Konofagou lab, and my family Timothy Collier Sr., Charline Collier, Timothy Collier Jr.,
Gabrielle Collier, Maya Collier, Layla Collier, and Michael Ashley.
viiiDedication
To Maya Simone Destiny Collier and Layla Jean Collier
Always know that there are no limits
to what you can achieve.
ixChapter 1: Introduction
1.1 Neurologic disease: stroke
Stroke, the broad term referring to compromised blood flow within a region of the brain
resulting in acute focal neurologic impairment, is also referred to as a cerebrovascular
accident[1]. Originally identified symptomatically, imaging such as Computed Tomography
(CT) and Magnetic Resonance Imaging (MRI) have allowed further identification of what is
broadly considered stroke into categories based on mechanism of brain injury[1-4]. These
categories include ischemic and hemorrhagic stroke. Hemorrhagic stroke is further
subcategorized into subarachnoid hemorrhage and intracerebral hemorrhage based on the site of
origin of the hemorrhage[2].
The predominant subtype of stroke is ischemic, accounting for approximately 80% of
stroke incidence[1]. Ischemic stroke is a condition in which an artery within the brain is occluded
either by thrombus or embolism resulting in a lack of perfusion to the brain region supplied by
the affected artery[1]. If the blockage of the blood vessel is transient, the result may be a
transient ischemic attack defined as a focal neurologic deficit lasting up to 24 hours[1]. More
long-lasting blockages can cause ischemic stroke. The presentation depends on the blood vessel
that is blocked, and which brain region is impaired. Outcomes can include hemiparesis and
hemiparalysis, hemineglect, speech difficulty, blindness, and loss of coordination for blockages
affecting the cerebral cortex, and cerebellum respectively[5].
Risk factors for stroke include advanced age, hypertension, diabetes, and smoking[1, 6-
8]. Ischemic stroke is a neurologic emergency requiring rapid identification and treatment[9].
Prolonged duration of cerebral hypoperfusion is associated with increased cellular death and
neurologic dysfunction[1]. Potential treatment modalities include pharmacologic and mechanical
1interventions. Tissue plasminogen antigen (TPA) has been long appreciated for the ability to
reverse the effects of ischemic stroke if administered within the treatment window [9].
Endovascular interventions to remove clots involved in ischemic stroke have gained
popularity[10].
Hemorrhagic transformation represents a critical complication of ischemic stroke
previously seen in up to 43% of ischemic stroke patients[11, 12]. Hemorrhagic transformation is
associated with worsened outcomes therefore a fine balance must be achieved between the
prevention of excessive coagulation and the prevention of hemorrhage[9, 13, 14]. This
complication limits options for ischemic stroke treatment and prevention of recurrence as
interventions to eliminate clots and reduce coagulation have substantial potential to promote
hemorrhage[9, 11, 15-18]. Due to the relationship between treatment of ischemic stroke and
induction of hemorrhage, an improved understanding of intracerebral hemorrhage poses potential
beneficial for treatment and secondary prevention of ischemic stroke.
1.1.1 Intracerebral hemorrhage
Intracerebral hemorrhage includes hemorrhagic stroke, subarachnoid hemorrhage and
cerebral microbleed[2]. Although less prevalent than ischemic stroke, hemorrhagic stroke
accounts for a large portion of stroke mortality and morbidity and has been determined to be a
major contribution to neurologic disease burden globally[19, 20]. For these reasons the
understanding of hemorrhagic stroke and the development of new therapeutic options are of high
interest.
2Figure 1.1: Global Burden of Neurologic Disease
Contribution of specific causes to the combined burden of neurologic disorders and cerebrovascular disease
(percent of total disability-adjusted life-years)
Source: GBD 2010 Results by Cause 1990–2010.
Global burden of neurologic disease by disability adjusted life-years shows 35.7% of the burden
of neurologic is caused by hemorrhagic stroke. Adapted from [19]
Although hemorrhagic stroke has been a subject of intense study for decades, there exist
few treatment options for patients suffering from this stroke subtype[21-23]. The
pathophysiology of hemorrhagic stroke remains incompletely understood however clues from
risk factors have informed current beliefs about the origin of spontaneous intracerebral
hemorrhages[2, 24].
The pathophysiology of primary spontaneous hemorrhagic stroke is believed to begin
with prolonged elevated intravascular pressure within the intracerebral arteries[25]. Under the
constant pressure, the walls of the blood vessels weaken and subsequently rupture sending blood
products into the brain parenchyma[25]. This leads to the formation of a hematoma that may
compress brain structures resulting in a mass effect, known as the primary injury. The hematoma
and surrounding edema also may compress the surrounding vasculature causing a region of
ischemia[24]. The breach of the blood brain barrier triggers inflammation and cell death within
3the region affected by the hemorrhage contributing to pathology known as the secondary
injury[26].
Figure 1.2: Pathophysiology of intracerebral hemorrhage
Schematic representation of the pathophysiology of intracerebral hemorrhage.
Adapted from [25]
Hemorrhagic stroke is classified as primary or secondary depending on an origin that is
spontaneous or due to a pre-existing condition respectively[1, 24]. The majority of hemorrhagic
4stroke cases are of the primary subtype occurring within the deep structures of the brain such as
the striatum[27]. Predisposing factors for primary hemorrhagic stroke include age, hypertension,
and geographic location[8, 20]. The rising use of anticoagulation is also believed to contribute to
the prevalence of intracerebral hemorrhage[14].
Sex differences have been noted in intracerebral hemorrhage incidence with females
showing a lower incidence than males within most stratified age groups[28]. Estrogen has been
noted to reduce edema resulting from iron exposure and poses a potential mechanism for
neuroprotection in females[29].
Outcomes following intracerebral hemorrhage are predicted by factors including the
initial hemorrhage volume, hematoma location, hematoma expansion, the Glasgow Coma Score,
the presence of intraventricular hemorrhage and age of the patient[1, 2, 12, 22]. Clinical
evaluation of intracerebral hemorrhage includes imaging with Computed Tomography (CT) or
Magnet Resonance Imaging (MRI)[3, 22]. On contrast enhanced CT there may be a focal region
of hyperdensity corresponding to contrast extravasation. This finding, referred to as the spot sign,
is associated with hematoma expansion[12]. Hematoma expansion, defined as an increase of
hematoma volume by 33% from initial imaging, is associated with increased mortality and
morbidity following hemorrhagic stroke[30]. On MRI, the appearance of intracerebral
hemorrhage varies over time due to changes in the magnetic properties of the hematoma[31].
1.1.2 Hemorrhagic stroke therapies and clinical studies
Hemorrhagic stroke is a clinical emergency requiring immediate evaluation and
intervention[24]. The mass effect following hemorrhagic stroke has the potential to cause
herniation of brain structures resulting in severe neurologic dysfunction and death[22, 32, 33].
Clinical management of intracerebral hemorrhage involves initial diagnosis via clinical suspicion
5confirmed by imaging with either MRI or CT[2, 21, 22]. Current therapies for hemorrhagic
stroke are largely supportive including blood pressure correction and monitoring of intracranial
pressure[21-23, 34].
The approach to treatment of intracerebral hemorrhage is informed by numerous clinical
studies on the subject[33, 35, 36]. Over 280 clinical trials have been reported involving
intracerebral hemorrhage with the goal of developing a better understanding of disease
progression and testing potential therapeutic interventions. Key trials that influence modern
understanding and treatment of intracerebral hemorrhage include the Antihypertensive Treatment
of Acute Cerebral Hemorrhage (ATACH) trial and the Surgical Treatment of Intracerebral
Hemorrhage (STICH) trial[35, 37].
Since the initial finding of the ATACH trial that early blood pressure control is beneficial
to patients, there have been various additional trials and subgroup analyses seeking to address the
optimal timing, populations, and goals of blood pressure control in ICH patients[35, 36, 38-40].
The ATACH II trial compared an intensive blood pressure goal (systolic blood pressure of 110-
139) to standard control (systolic blood pressure of 140-179) finding no difference in mortality
or disability between the two groups[36]. Subgroup analysis of the ATACH-2 trial demonstrates
a reduction of hematoma expansion and overall hematoma size following spontaneous basal
ganglia ICH however the functional outcomes were not altered[27]. There is interest in utilizing
the spot sign to stratify patients likely to benefit from treatments such as intensive blood pressure
control[41].
Surgical removal of the hematoma was shown to have little benefit when applied broadly
to ICH populations in the STICH trial[37]. Surgical treatment in intracerebral hemorrhage
remains an active area of study with the goal of identifying patients likely to benefit[42-45].
6Various neuroprotective agents have been targeted following promising results in
preclinical studies including minocycline and deferoxamine[46-48]. However further studies are
needed to determine potential efficacy in humans. Deferoxamine, an iron chelator has been
shown to be beneficial in animal studies of intracerebral hemorrhage[49]. Clinical trials however
have not seen the same success thus far. The Deferoxamine mesylate in patients with
intracerebral hemorrhage (i-DEF) trial found safety in administration of deferoxamine in ICH
patients but did not find sufficient efficacy to warrant a phase III trial[47]. The disconnect
between the development of promising treatment options in preclinical research often conducted
with rodent studies and the lack of efficacy in human trials details a need to better understand the
key contributors of the disease to pathology as well as to understand how the models compare to
human disease. There exists the need for additional animal models of intracerebral hemorrhage
to facilitate understanding of critical elements of intracerebral hemorrhage pathophysiology
1.1.3: Cerebral microbleed
A cerebral microbleed is defined as one or more circular or elliptical areas of hemorrhage
of 2-10mm in diameter on MRI imaging[50]. The increased use of cerebral imaging in addition
to the application of more sensitive MRI sequences to imaging protocols have led to an increased
appreciation for the prevalence of cerebral microhemorrhage[50]. Cerebral microbleeds are
associated with vascular disease including hypertension and cerebral amyloid angiography[3, 50,
51]. They are also considered to be a predisposing factor for the development of intracerebral
hemorrhage, ischemic stroke, and dementia. Inflammation has been found in cerebral
microhemorrhage[52]. Although cerebral microhemorrhage is often asymptomatic, the
prevalence of cerebral microbleeds in the setting of neurologic disease demonstrates the
importance of understanding the associated pathology.
7Figure 1.3: Cerebral microhemorrhages
Axial MRI with numerous cerebral microhemorrhages.
Adapted from [53]
1.1.4 Mouse models of intracerebral hemorrhage
Animal models have been critical to our understanding of the pathophysiology of various
diseases[54]. Categories of animal models of focal neurologic disease include inducible and
spontaneous. In inducible models, pathology is directly caused by an intervention. Spontaneous
models of disease often rely on replicating risk factors of the disease of interest predisposing
mice to develop pathology.
Multiple rodent models of intracerebral hemorrhage have been created to probe the
cellular and molecular pathways involved in intracerebral hemorrhage pathology[55]. The
striatal balloon inflation technique initially described by Sinar et. al. involves the injection of a
syringe surrounded by a balloon with subsequent inflation[56]. This model recreates the primary
8effect of the pressure of the hematoma on the parenchymal structures resulting in cerebral blood
vessel compression and ischemia however there is no blood toxicity or secondary injury of
intracerebral hemorrhage[56]. This model is used less frequently as other models of hemorrhagic
stroke have become increasingly favored.
Autologous blood injection was described by Ropper et al.[57]. This model is generated
by obtaining blood and injecting it into the target region. The autologous blood injection model
causes a mass effect and reproduces the effects of blood toxicity on the brain. The autologous
blood injection model does not involve vascular damage[55, 57].
The collagenase injection model of hemorrhagic stroke described by Rosenberg et. al. is
achieved by injecting bacterial collagenase into the target region[58]. The collagenase degrades
the extracellular matrix leading to blood vessel rupture. This model induces the mass effect, toxic
effects of blood and vascular rupture but does not involve increased intravascular pressure[55].
Spontaneous models of intracerebral hemorrhage exist that generate long standing
hypertension in the mice and result in spontaneous intracerebral hemorrhage. Renal artery
ligation in addition to a high salt diet are techniques employed to induce chronic hypertension in
mice[55]. This technique is likely to closely replicate the pathophysiology of human
intracerebral hemorrhage as the predisposing factor of prolonged elevated blood pressure is
involved in both. The spontaneous nature of the development of intracerebral hemorrhage poses
challenges for studying the development of pathology within these models. As the hemorrhage
occurs spontaneously, it is difficult to know the time of hemorrhage onset.
There are both spontaneous and inducible models of cerebral microbleed[59]. Non-
spontaneous induction of cerebral microhemorrhage involves laser-induced vessel ablation under
the guidance of two photon imaging for vessel localization[60]. This model induces a single
9microhemorrhage targeted to a vessel of interest[60]. The laser-induced cerebral microbleed
model requires creation of a cranial window for two photon imaging of the target vessel. Due to
the requirement of two photon imaging for identifying a target vessel, this technique is only
applicable to cortical regions[59]. Spontaneous cerebral microbleeds are created via genetic
overexpression of APP creating a model of CAA. Hypertensive mice are also used as a model of
spontaneous intracerebral hemorrhage[59].
Although various mouse models of intracerebral hemorrhage exist, there remains a need
for the development of additional models to further facilitate intracerebral hemorrhage research.
The American Heart Association highlights areas of particular interest for novel models of
intracerebral hemorrhage including inducible models, hemorrhage enlargement and resolution,
with the ability to target different regions of the brain[61].
1.2 Neuroinflammation: Microglia and Astrocytes
Microglia are the resident immune cells of the central nervous system. Derived from cells
in the myeloid lineage, microglia represent a unique cell type within the brain[62]. During
homeostasis microglia exhibit a ramified morphology with a small cell body and numerous long
processes with many branches[63]. This morphology facilitates constant surveillance of the
surrounding environment[64].
Activation of microglia has been an active area of investigation. Morphological changes
have been observed in microglia confronting a neurological insult[63]. Microglia in pathologic
states have been found to have a more amoeboid morphology with fewer branches[63].
Additional assays of microglia have provided more detailed understanding of microglial
reactions to neurologic pathology. CD68 is a lysosomal associated protein found in microglia
thought to be associated with phagocytic activity within the microglia[65]. CD68 is found to
10increase in microglia responding to disease states[65, 66]. RNA sequencing has allowed for
further characterization of microglia in multiple states including the recognition of disease
associated microglia (DAM)[67-71].
Figure 1.4 Schematic of microglial activation states
Representation of progressively activated Microglial states. Adapted from [72]
Early descriptions of the activation state of microglia described two distinct forms: M1
and M2 that promote increased inflammation or repair respectively[73, 74]. The accuracy of this
microglial polarization paradigm has come into question. RNA sequencing and other methods of
study have provided a more detailed understanding of the various microglial populations in
existence replacing the M1 vs M2 classification scheme[68-70, 75].
Cultured microglia have been utilized to gain an understanding of the functions of this
cell type in a more controlled environment. In culture microglia have been shown to require
caspase 8 activity for activation[76]. Downstream caspases including caspase 7 and caspase 3 are
11also required[76]. The response of microglia to hemorrhage has also been addressed. Animal
models have demonstrated microglial response to intracerebral hemorrhage[77].
Microglia rely on constant colony stimulating factor CSF1 and CSF1R interaction for
survival[78, 79]. Therefore, inhibition of CSF1R with compounds such as plx3397 create near
complete depletion following treatment[80, 81]. Models of intracerebral hemorrhage in which
microglia have been depleted prior to induction of intracerebral hemorrhage demonstrate a
reduction in the size of the hematoma[80]. This finding suggests that the role of microglia in the
pathophysiology of intracerebral hemorrhage goes beyond hematoma clearance and is capable of
contributing to the development of larger rather than smaller hematomas. The suggestion of an
adverse impact of microglia has led to an interest in reducing the effect of microglia on
intracerebral hemorrhage with the goal of reducing the size of the hematoma and improving
outcomes[82]. Animal models have demonstrated benefit in potential therapeutic options that
show reduced microglial activation including minocycline and pioglitazone[83, 84].
Astrocytes are an abundant cell type within the brain now recognized for having various
essential roles within the central nervous system[85]. Astrocyte end feet form a critical
component of the blood-brain barrier[86]. Astrocytes have been found to be involved in various
disease processes including stroke, multiple sclerosis, and Alzheimer’s Disease[82, 85, 87, 88].
Similar to microglia, there have been studies assessing the differences between astrocytes in the
healthy brain and astrocytes in disease states[85]. Astrocytes are noted to undergo morphological
changes in the setting of pathology appreciable by labeling with the astrocyte marker GFAP[89].
In physiologic conditions, astrocytes show a highly branched, stellate, morphology[90]. Disease
states have shown shift toward hypertrophic astrocytes and upregulation of GFAP[90].
121.3 Cell death pathways
The regulation of cell death is a critical function to maintain the integrity of an
organism[91]. While excessive cell death is a contributing factor to diseases such as
neurodegeneration, inadequate cell death can facilitate uncontrolled cellular proliferation, a
feature of cancer pathogenesis[91, 92]. Therefore the appropriate balance must be achieved in
order to ensure the health of the organism.
Long studied forms of cell death include necrosis and apoptosis[91, 93]. Lately cell death
pathways with differing components and hallmarks have been identified including pyroptosis,
necroptosis, and ferroptosis[92, 94-99].
Apoptosis
Apoptosis is a highly regulated form of cell death. Cell death via apoptosis results in little
impact on the surrounding environment of the cell[91]. Cells enter apoptosis through one of two
major pathways termed the intrinsic and the extrinsic pathway[91]. Cytotoxic signals trigger a
cascade of protein changes within the mitochondria. Critical components include cytochrome C,
apoptotic protease activating factor 1(APAF1), inhibitors of apoptosis (IAPs), and caspases 9, 3,
6, and 7[91]. The extrinsic pathway of apoptosis is ligand dependent and is thus known as the
death receptor pathway. Fas ligand binds to FAS. Induction of caspase 8 dimerization and
autocleavage leads to downstream activation of executioner caspases and cell death[91].
Morphologic characteristics of cells that have undergone apoptosis include DNA fragmentation,
nuclear pore formation, and increased attraction of phagocytic cells[91].
13Necrosis
The uncontrolled pathway of cell death is termed necrosis. This cell death form notably
causes regional damage and inflammation due to exposure of the surrounding area to the
contents of the dying cell[91]. Causes of necrosis include hypoxia and inflammation[91].
Necroptosis
In 2005, a form of cell death exhibiting features of necrosis through a regulated induction
pathway was described[100]. Necroptosis shows features similar to the extrinsic pathway of
apoptosis considering the involvement of receptor-mediated cell death[98]. Necroptosis involves
the phosphorylation of Mixed Linkage Kinase domain Like pseudokinase (pMLKL) with
subsequent oligomerization and translocation to the cell membrane inducing pore formation, cell
permeabilization, and cell death with the release of intracellular contents into the surrounding
area[98]. This process is inhibited by necrostatin-1[101]. Necroptosis has been shown to be
involved in cell death in response to blood toxicity suggesting a role in intracerebral
hemorrhage[101].
Pyroptosis
Pyroptosis is a form of inflammatory cell death involving cleavage of caspase 1 with
downstream activation of IL-1 beta[94]. Features of pyroptosis include a combination of cell
death with release of inflammatory cytokines[94, 96]. This form of programmed cell death has
been suggested to play a role in the pathophysiology of neurologic disease including Alzheimer’s
Disease and stroke[88, 102, 103]. As various neurologic conditions involve a robust
inflammatory response, pyroptosis may contribute broadly to neurologic disease.
14Ferroptosis
Ferroptosis was initially described in 2012 as an iron dependent non-apoptotic form of
cell death[95]. This cell death pathway has been an active area of study for cancer and
neurologic disease[104-109]. Early studies of this cell death pathway evolved from the discovery
that erastin was capable of inducing a unique form of cell death that is modulated by intracellular
iron levels and involves increases in reactive oxygen species (ROS)[95, 110]. The ferroptotic
pathway involves activity of the iron-dependent enzyme lipoxygenase which promotes
downstream lipid peroxidation and cell death[111-114]. Ferroptosis is inhibited by the iron
chelator deferoxamine as well as by antioxidant treatment and ferrostatin 1[95]. As intracerebral
hemorrhage involves the presence of both elevated iron and reactive oxygen species, the role of
ferroptosis following cerebral hemorrhage is an active area of investigation[101, 104, 106].
1.4 Focused Ultrasound
In 1880 Jacques and Pierre Curie published an essential observation; in certain crystals,
physical energy such as mechanical compression is converted into an electrical current[115]. The
phenomenon they described is now known as the piezoelectric effect which forms the basis of
ultrasound technology[116]. The possibility of altering the shape of the crystal to generate
differential properties of ultrasound was demonstrated in 1935 by shaving the quartz crystal into
a convex shape resulting in a focusing of the ultrasound waves to a target point[116].
Numerous parameters describe the character of both planar (unfocused) and focused
ultrasound. Changing any of these parameters will result in ultrasound that exhibits distinct
features[117].
Amplitude describes the pressure differential of the ultrasound. The difference between
the peak pressure (or minimum pressure) and the average pressure is the amplitude[117].
15Ultrasound is a mechanical pressure that has two phases a compressive phase applying a positive
pressure on the target of ultrasound and a rarefactional phase imposing a negative pressure.
Amplitude, described in units of decibels, is modifiable and can be manipulated by the operator
to generate differential effects of ultrasound.
Ultrasound power, reported in Watts, is calculated as the square of the amplitude[117].
The power per unit area of the targeted region is termed the intensity of ultrasound and is
reported as Watts/cm2.This is the primary parameter utilized to describe the safety of ultrasound
and predict resultant biological effects[117].
The biological effects of focused ultrasound were reported in the 1920s[118]. These
reports described the effect of ultrasound on cells indicating the potential for ultrasound to be
applied to and alter animal cells and tissues. In addition to mechanical effects induced by focused
ultrasound, the biological changes in tissues subjected to focused ultrasound are dependent on
factors such as thermal and neuromodulatory effects[119-124].
Thermal: Focused ultrasound has been found to induce heating in the target tissue[119,
121-123]. The heating is a result of ultrasound absorption by tissues with the conversion from
mechanical energy to thermal[117]. The temperatures achieved with focused ultrasound can be
of a sufficient level to cause tissue ablation. This is a component of the mechanism of focused-
ultrasound tumor ablation[122].
Neuromodulation: Low frequency focused ultrasound has been found to cause
alterations in neuronal activity[124, 125]. Both increases and decreases in neuronal firing have
been observed following focused ultrasound. This technique has therapeutic potential to diseases
involving of aberrant neuronal firing such as epilepsy[126].
161.4.1 Applications: Therapeutic
Focused ultrasound has been extensively studied for transient opening of the blood-brain
barrier[127-132]. An essential regulator for maintaining the integrity of the brain, the blood-brain
barrier restricts the transit of circulating components into the brain parenchyma[86]. This barrier
poses a challenge for therapeutics that are targeted to the brain parenchyma restricting access
from the vasculature to the brain. The safe and reversible opening of the blood brain barrier with
focused ultrasound has been reproducibly achieved[128, 130]. Ultrasound generates a physical
disturbance of materials. Classically gas particles within liquids are particularly susceptible to
alteration under the pressure of the ultrasound beam in a process called cavitation[133].
Cavitation is defined as stable involving oscillation of the gas bubbles, or inertial involving
collapse of gas bubbles sending shockwaves into surrounding material[134]. Injection of
circulating microbubbles facilitates cavitation by introducing additional gaseous inclusions to the
system[135, 136]. The safe reversible opening of the blood-brain barrier involves predominantly
stable cavitation with limitations to parameters including peak rarefactional pressure, ultrasound
intensity, and microbubble dose[129, 135, 137].
Focused ultrasound has been found to lead to an activation of microglia with parameters
capable of inducing blood-brain barrier opening[129, 138, 139]. This observation led to the
application of focused ultrasound for microglial priming[140, 141]. This is the idea that
microglia can be prepared for a biological insult if they are first activated via the application of
focused ultrasound. This is an area of investigation for diseases including Alzheimer’s disease in
which microglial priming may result in enhanced plaque clearance[140].
An exciting potential application for focused ultrasound is clot thrombolysis[142]. This
application is quite intriguing for ischemic stroke which involves the blockage of an artery in the
17brain leading to hypoperfusion and impaired function of the affected brain region[1]. Mechanical
thrombolysis via endovascular surgery is an accepted treatment for ischemic stroke[10]. Focused
ultrasound has been studied for stroke treatment both alone and in combination with
pharmaceutical thrombolysis[143-145]. Further investigation with increasingly physiologic
conditions will be required to determine and optimize the benefit of focused ultrasound
application to clot lysis.
1.4.2 Applications: Disease Models
The ability to use focused ultrasound to model and study disease states dates back as far
as the 1940s[146]. At Columbia University, studies by Lynn and Putnam demonstrated
behavioral deficits correlating to the region exposed to focused ultrasound. They observed
temporary blindness following focused ultrasound to the occipital lobe, ataxia following
cerebellar focused ultrasound, and paralysis and loss of sensation following spinal cord damage
via the use of focused ultrasound. At the time of the study, it was realized that this could aid in
the understanding of human neurologic disease. Later studies of high intensity focused
ultrasound replicated additional pathologies including neuronal destruction and lung
hemorrhage[147, 148]. Animal models of disease are a key contributor to our understanding of
the human condition. Focused ultrasound has been successfully applied to generate damage
similar to that seen in human disease thus providing a promising system for the creation of
animal models.
18Chapter 2: Materials and Methods
2.1 Mouse husbandry
All experiments were conducted in accordance with IACUC and AAALAC regulations.
C57BL/6J mice (stock number 000664) were ordered from Jackson Laboratories and
housed in a barrier facility for at least 72 hours prior to experiments. Mice are provided with a
standard diet and water ad libitum with biweekly cage changes. Mice are on a 12-hour light-dark
cycle with light from 6am-6pm. Experiments were conducted on mice age 16-20 weeks of age.
Female mice were housed together for two weeks to synchronize estrus cycles.
2.1.1 Intracardiac perfusion
Mice are given a mixture of Ketamine and Xylazine 75-95 mg/kg and 5-7 mg/kg
respectively diluted in normal saline via intraperitoneal injection. Following injection mice are
assessed every 5 minutes for respiration and extinction of the toe pinch reflex. Once the level of
anesthesia is adequate shown by extinction of the toe pinch reflex and slowed breathing fur is
removed from the chest. The transthoracic cavity is exposed, and the right atrium is clipped. A
needle is inserted into the left ventricle and ice-cold saline is pumped into the circulation at a rate
of 6 ml/minute. A total of 12 ml of saline are infused. For immunohistochemical analysis 12 ml
of 4% paraformaldehyde are infused following the saline infusion.
2.2 Focused ultrasound Application
Prior to use lab-manufactured microbubbles are activated with 20 second alternating
cycles of vacuum and decafluorobutane then mixed thoroughly for even microbubble
distribution. Degassed water is inserted into the head of a 1.5 MHz ultrasound transducer
ensuring that no bubbles are present. The transducer is covered with a latex membrane.
19Anesthesia is induced with isoflurane at 2.75% in an induction chamber. Mice are
transferred to a warming pad and placed within the stereotactic apparatus with 1.5 to 2.75%
isoflurane continuously supplied via nose cone. Cranial fur is removed first with clippers then
with depilatory cream. Lubricating ointment is applied to both eyes. Ultrasound gel is applied to
the scalp and a chamber of degassed water is placed upon the scalp and gel with a grid placed
within the degassed water chamber directly above the lambda suture.
Targeting: Ultrasound is used to image the metal grid and position the focus of the
ultrasound directly above the lambda suture. Once targeting is complete the transducer is moved
5.5 mm anterior and 1.5 mm to the right of the lambda suture.
FUS-ICH 2.5: For Focused Ultrasound-Induced Intracerebral Hemorrhage at 2.5 MPa
(FUS-ICH 2.5), microbubbles are introduced via tail vein immediately preceding application of
focused ultrasound. Focused ultrasound is applied with a 1.5 MHz transducer, pulse length (PL)
of 10,000 cycles, pulse repetition frequency (PRF) of 5 and a peak rarefactional pressure is 2500
kPa, total duration 60 seconds[149, 150]. Cavitation results are recorded during the focused
ultrasound application. Once the procedure is complete, mice are placed on a warming pad as
they recover from anesthesia with continuous monitoring until full recovery is achieved.
FUS-ICH 1.5: For FUS-ICH at 1.5 MPa (FUS-ICH 1.5), mice are subjected to the
procedure as described for FUS-ICH 2.5 with a peak rarefactional pressure of 1500kPa rather
than 2500kPa[149, 150].
FUSO: For Focused Ultrasound Only (FUSO), mice are prepared as described FUS-ICH
2.5 but no microbubbles are injected prior to the application of focused ultrasound[150].
Sham: Mice are placed in the anesthesia induction chamber with 2.75% isoflurane. Once
sufficient induction of anesthesia is achieved, mice are transferred to a warming pad within a
20stereotactic apparatus with continuous 1.5 to 2.75% isoflurane supplied via nose cone. Cranial
fur is removed with clippers and depilatory cream. Mice are allowed to recover from anesthesia
on a warming pad with continuous monitoring until full recovery is achieved[149, 150].
2.3 MRI
Induction of anesthesia is achieved with 2.5% isoflurane. Once anesthetized, mice are
placed into a chamber and inserted vertically into the Bruker 9.7T Magnet. Anesthesia is
maintained at 2% continuously administered via nose cone. Images are obtained using Paravision
software.
T2 weighted MRI (T2W MRI): Images were acquired using the following parameters:
echo time (TE) 30 ms, repetition time (TR) 2500 ms, 6 averages, 1 repetition, echo spacing 10
ms, rare factor 8, slice thickness 0.4 mm. T2 images were acquired prior to injection with
gadolinium.
Gadolinium enhancement: 200 microliters of gadolinium (Omniscan) is injected into
the intraperitoneal cavity of mice at least 20 minutes prior to imaging.
T1 Weighted MRI (T1W MRI): Gadolinium enhanced T1 weighted images were
acquired using the following settings: TE 3ms, TR 230ms, 6 averages, 70 degree flip angle, slice
thickness 0.4 mm.
2.4 Behavioral assays
Neuroscore: Mice are provided a score correlating to physical condition based upon
whether they are circling, their level of motility, and general appearance. A high neuroscore
correlates to a normal mouse and a low neuroscore represents a mouse with severe neurologic
impairment. Circling is scored with a maximum of 4 points for no circling behavior, 3 points for
spontaneous large diameter circling, 2 points for spontaneous small diameter circling, 1 point for
21circling when pulled by tail, and 0 points for no movement. Motility is scored with a maximum
of 3 points for a normally and actively moving mouse, 2 points for a mouse that is actively
moving but with an unsteady gait, 1 point for a mouse that is reluctant to move, and 0 points for
a mouse with no spontaneous movement. General appearance has a maximum score of 3 points
for a normal well-groomed mouse, 2 points for a well-appearing mouse with at least 5% weight
loss, 1 point for a well-groomed mouse with hunched posture, 0 points for a mouse with hunched
posture and evidence of decreased grooming.
Corner Turn Test: Motor function of mice is assessed using the corner turn test. Mice
are placed into a plexiglass corner with glass panes angled to 30 degrees with a .5 cm space
between the two panes. Once the mouse is inserted into the corner it is observed for a turn
completion. Only turns in which the mouse rears fully onto one side of the apparatus before
turning are counted. The test is run for 10 trials. The corner turn test apparatus is cleaned
thoroughly with ethanol between mice.
2.5 Histochemistry
2.5.1 Immunofluorescence
20-micron sections: Brains following perfusion are post fixed in 4% paraformaldehyde
overnight at 4 degrees Celsius. Tissues are washed 3 times with 1X Phosphate Buffer Solution
(1X PBS) then incubated in 30% sucrose for at least 24 hours prior to embedding in OCT on dry
ice. Sections 20 microns in depth are achieved with a cryostat.
Slides are washed with PBS 3 times, permeabilized in blocking buffer with 0.1% triton
for 30 minutes, then incubated in blocking buffer (10% NGS, 1% BSA, in PBS) for 1.5 hours at
room temperature. After blocking, slides are incubated in primary antibody diluted in blocking
22buffer over night at 4 degrees Celsius. Antibody concentrations and details are provided in
antibody table.
Slides are washed 3 times with 1X PBS then incubated in secondary antibody and
directly labeled primary antibodies for 2 hours at room temperature followed by 3 washes with
1X PBS. Hoechst stain is applied for 5 minutes (dilution, 1:1000) then slides washed 3 times
with 1X PBS Mounted onto a microscope slide with mounting media and coverslip is applied.
150-micron sections: Brains following perfusion are post fixed in 4% paraformaldehyde
overnight at 4 degrees Celsius. Tissues are washed 3 times with Phosphate Buffer Solution and
stored in Phosphate Buffer solution prior to sectioning. Sections 150 microns in depth are
achieved using a vibratome. Slices are stored in Phosphate Buffer Solution with 0.1% sodium
azide until use.
Sections are stained free floating. Tissues are washed with 1X PBS 3 times and
permeabilized in blocking buffer with 1% Triton for 1 hour at room temperature then incubated
in blocking buffer for 2 hours at room temperature. Tissues are incubated in primary antibody
diluted in blocking buffer over 48 hours. Tissues are washed 5 times for 10 minutes each then
incubated in secondary antibody and directly labeled primary antibodies overnight. Brains are
washed 5 times for 10 minutes each. A Hoechst stain is applied for 15 minutes (dilution, 1:1000).
Sections are mounted onto a microscope slide with mounting media and coverslip is applied.
TUNEL: Terminal dUTP nick end labeling is achieved using the assay kit from
Promega. Slides with 20-micron thick brain slices are washed with PBS followed by 10 minute
incubation in proteinase K at room temperature. Following an additional wash with PBS, slides
are incubated in equilibration buffer for 10 minutes at room temperature then incubated in
reaction mixture consisting of fluorescently labeled nucleotides and the rTDT enzyme for 1 hour
23at 37 degrees. The reaction is stopped with 2X SCC for 15 minutes at room temperature then
washed with PBS. Immunofluorescence co-staining follows with the typical protocol described
above.
To generate a positive control, the proteinase K permeabilization step is followed by
incubation with DNase buffer (40mM Tris-HCL, 10mM NaCl, 6mM MgCl2, 10mM CaCl2 in
deionized water) for 5 minutes and incubation with DNase (10 units) in DNase buffer.
A negative control is achieved by following the TUNEL procedure with the exclusion of
the rTDT enzyme from the reaction mixture.
2.5.2 Hematoxylin and Eosin
Slides with 20-micron sections are used. Hematoxylin and Eosin (H&E) staining is
performed by the Columbia University histology core.
2.6 Biochemistry
2.6.1 Western Blot
Following perfusion with ice cold saline brains are collected and dissected. The right
hemisphere from 2mm-6mm anterior to lambda is collected and further dissected into medial and
lateral halves. The medial portion is used for experiments. Dissected brain tissue is flash frozen
in liquid nitrogen then transferred to -20 degree Celsius until lysis. Tissues lysed with Abcam
cell lysis buffer with added phosphatase and protease inhibitors. Tissues are homogenized with a
mechanical homogenizer. Lysates are sonicated then centrifuged at 12,000 rpm for 20 minutes at
4 degrees Celsius. The supernatant is collected into a fresh tube.
Protein from brain lysates is quantified via BCA assay and 30 micrograms of protein are
prepared with Laemmli buffer with 20% beta mercaptoethanol (BME). BME is excluded from
24the preparation of samples to be probed with CD68. The protein solutions are then heated at 100
degrees Celcius for 5 minutes and allowed to cool to room temperature prior to loading.
Samples are run on Novex 10-20% tris-glycine gels at 160 mV for 30 minutes followed
by 120 mV for one hour.
Proteins are transferred to a PVDF membrane following membrane activation with 100%
methanol for 30 seconds and equilibration in transfer buffer. Transfer is conducted at 0.3 amps
for 2 hours.
Membranes are incubated in Revert total protein stain solution for 5 minutes followed by
30 seconds in Revert wash solution. Total protein staining is imaged with the Licor Odyssey
system using image studio software. Membranes are then incubated in Licor blocking buffer for
1 hour at room temperature then incubated in primary antibody diluted in Licor blocking buffer
overnight. Antibody dilutions are listed in the antibody table. Membranes are then washed 3
times with 1x Tris-Buffered Saline (TBS) with 0.1% Triton then incubated in Licor secondary
antibody (1:10,000 dilution). Washes with 1x TBS with 0.1% Triton are removed, the
membranes are placed in 1x TBS then imaged in the Licor Odyssey system.
25Table 2.1: Antibody Catalogue
Antibody Company Catalog Species Concentration Application
Number
CD68 Proteintech 25747-1-AP Rabbit 1:500 WB
CD68 BioRad MCA1957GA Rat 1:500 IF
Cl Casp 3 Cell Signaling 9661 Rabbit 1:1000 WB
GFAP Aves AB_2313547 Chicken 1:1000 IF
Iba1 Biocare CP29013 Rabbit 1:300 IF
NeuN Millipore MAB3777 Mouse 1:4000 IF
pMLKL Abcam Ab196436 Rabbit 1:500 WB
26Chapter 3: FUS-ICH at 2.5 MPa Hemorrhage and Behavior
3.1: Introduction
The understanding of human intracerebral hemorrhage relies on the study of animal
models. Intracerebral hemorrhage is modeled in a number of ways including direct injection of
autologous blood from a mouse’s tail artery or injection of bacterial collagenase into the target
region of the brain[55]. The autologous blood injection model reproduces the effects of blood
toxicity within the brain as well as the mass effect[55]. The collagenase injection method induces
vessel rupture through the destruction of the extracellular matrix and induces blood toxicity and
the mass effect. There remains a need for additional models of intracerebral hemorrhage
according to the American heart association round table discussion[61]. As hypertension is an
essential risk factor for the development of intracerebral hemorrhage, the involvement of
mechanical intravascular pressure in an inducible model is of interest[1]. Of specific interest
within models of intracerebral hemorrhage is the induction of a dynamic hematoma that expands
and resolves over time as both hematoma expansion and resolution have been observed in human
intracerebral hemorrhages and are believed to contribute to human intracerebral hemorrhage
pathophysiology[61].
Focused ultrasound is a technique capable of inducing transient BBB opening[128, 130].
This ability has led to numerous studies probing therapeutic benefits of FUS[127, 128, 131, 132,
142, 143]. However, FUS has been noted to cause vessel rupture at pressures above the
therapeutic threshold[130]. This finding raises the possibility of utilization of focused ultrasound
technology for induction of vascular damage incited by a mechanical pressure-dependent insult.
27You can also read