Economic Impact Assessment of the Rivers District Revitalization in Calgary - Understanding the role and economic impact of the proposed Rivers ...
←
→
Page content transcription
If your browser does not render page correctly, please read the page content below
Economic Impact
Assessment of the
Rivers District
Revitalization in
Calgary
Understanding the role and economic impact
of the proposed Rivers District projects

                                         Report Date: January 25, 2019
                                                Report Authors: EY LLP

  1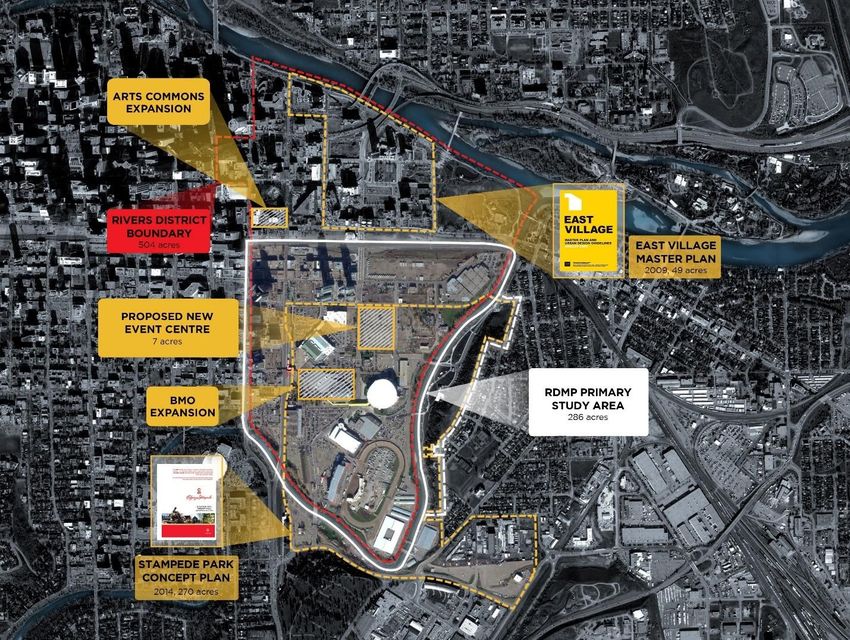
Table of Contents
Executive Summary ............................................................................................. 2

1.     Introduction and Scope ................................................................................ 5

2.     The Rivers District and Calgary Today .......................................................... 8

3.     Rivers District Revitalization ...................................................................... 10

4.     Description and Methodology of an EIA ....................................................... 16

5.     Overview of Inputs into the I-O Model ......................................................... 24

6.     Economic Impact Results ........................................................................... 32

7.     Literature Review ...................................................................................... 35

8.     Jurisdictional Comparisons ........................................................................ 38

9.     Other Impacts within Surrounding Areas ..................................................... 54

10. Conclusion and Considerations ................................................................... 61

Appendix ........................................................................................................... 62

1
Executive Summary
Recent years have proven to be both challenging and exciting for Calgarians. Except for 2009, Calgary
experienced 24 years of sustained economic growth from 1990 – 2014.1 From 2004 to 2014 the city's
economy expanded by almost 45%.2 However, the rapid decline in the price of oil beginning in 2014
brought over two years of economic decline and a slower pace of growth.

To build a more resilient economy with the goal of once again leading growth in Canada, the city adopted
“Calgary in the New Economy, the Economic Strategy for Calgary” in June 2018. This strategy strives
to uphold Calgary's vision of being 'A great place to make a living, a great place to make a life' and
enhance the reputation and image of the city as a great place to live, work and play. The Rivers District
Revitalization (“RDR”) is a comprehensive plan consisting of three major projects that work in concert
with each other, as well as an overall master planning document (Rivers District Master Plan, “RDMP”)
to redevelop and revitalize the Rivers District. These plans are a key component of the city’s plans to
achieve its new strategy.

Today, the East Village portion of the Rivers District has seen a significant level of development through
nearly $400 million in infrastructure investment that has attracted approximately $3 billion of planned,
private investment. In contrast to East Village, the east Victoria Park portion of the Rivers District is
underutilized and development has remained stagnant. The RDMP was developed to create an integrated
vision that guides development so that it is conducted in a deliberate and coordinated manner and
optimizes both investment spending and overall citizen experience.

As part of this plan, three key infrastructure projects have been identified as being catalysts to
revitalization: an expansion of Arts Commons; an expansion to the BMO Centre and the construction of
a new Event Centre. Ernst & Young LLP (EY) has been engaged to perform an economic impact
assessment (“EIA”) of the proposed projects to the city of Calgary. The intent of this report is not to
provide a recommendation for the proposed projects but to simply inform citizens and decision-makers
within the city about the potential impacts of the developments. It is important to note that this report
focuses on the impacts of these projects in aggregate and does not consider funding scenarios or
implications, opportunity costs of alternative uses of funds or land development, or more generally, an
assessment of the net cost-benefit of the proposed projects. The assessment is focused on the direct and
indirect economic impacts and has taken a more conservative approach where possible.

To understand the impacts, relevant data was obtained from primary stakeholders which was then used
to drive modelling efforts and enable directional projections on factors such as local GDP, job creation,
labour income and output. After analyzing the impact of operational and capital expenditures related to

1 Calgary Economic Development (CED)

2 Ibid.

2
these three projects, there is a substantial positive impact related to jobs, labour income, GDP and
output, as seen in the table below:
Table 1. Summary of Economic Impacts from Expenditures
Expenditure Person-Year Wages ($ mn.) GDP ($ mn.) Output ($ mn.)
Type FTEs
Capital
Expenditures 4,750 413 602 1,701
(2019 to 2026)
Operational
Expenditures 1,536 161 168 297
(annually,
starting 2024)
Notes: Capital expenditures are one time contributions to the local economy as they relate to the duration of the
construction activities which are from 2019 to 2026.
Operating expenditures are annual contributions to the local economy, and the associated FTEs are indicative of
the ability to sustain those jobs annually. The values presented above for operational expenditures represent the
expected annual impact starting in 2024.
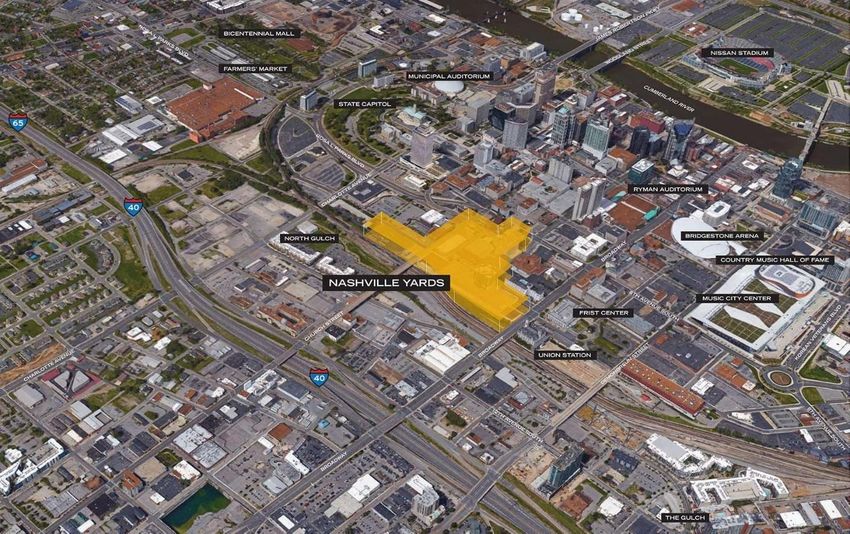
To drive further insights on realized and projected outcomes from other notable economic development
projects in cities that have undergone similar development transformations, four comparator
jurisdictions were also examined, including: the Ice District in Edmonton, Union Station in Denver, the
Arena District in Columbus, and Nashville Yards. The economic impact projections for the Rivers District
Revitalization in Calgary are directionally consistent with those observed in these four jurisdictions. A
key component of success for similar developments is the effective utilization of a master plan, which
ensures key projects are planned such that they establish synergies with each other, allowing for an
effect where the sum is greater than the parts. In all cases examined, after the initial investment had
been made, the comparator jurisdictions experienced significant levels of follow on private investment
related to restaurants, hotels, retail and commercial opportunities. The magnitude of follow on private
investments in each jurisdiction was several hundred million dollars.
To be as comprehensive as possible, this report also examines the impact on cultural, social, connectivity
and tourism impacts. These are the additional impacts (both positive and negative) that can also be
expected. Overall, the RDR would be expected to have a positive impact on city and its residents when
assessing qualitative factors. For example, the project will support arts and culture that is likely to
improve the quality of life for Calgarians, as well as the overall improvement on the perception of the
city, which would help drive tourism and potential employment. Connectivity and accessibility may also
improve because of several planned infrastructure investments that are part of the proposed
development plan.
3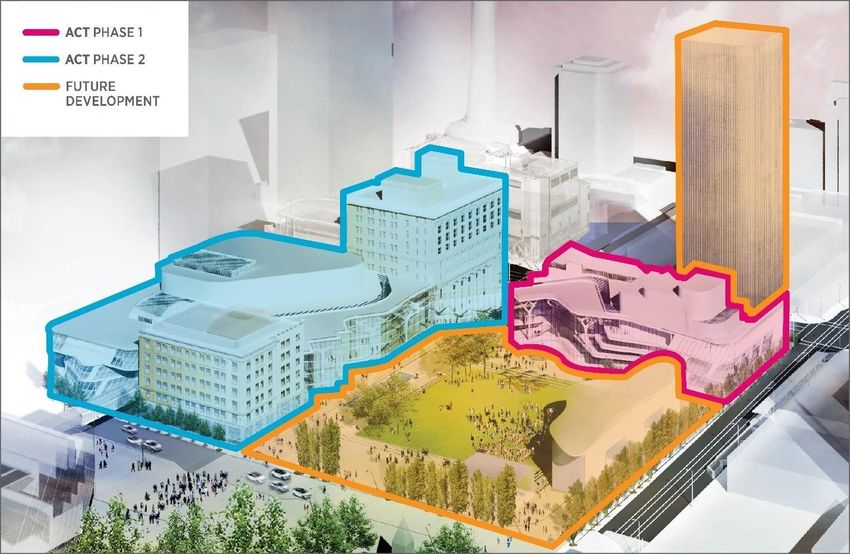
Finally, to complement both the quantitative and qualitative analysis and consider other impacts that
would not be captured in the economic model, an extensive review of relevant academic, industry, and
government literature and research was performed. The results of the literature review are inconclusive
as various groups differ in presenting a positive, neutral or negative impact of similar developments.

Taking all of this into account, the quantitative analysis suggests that there is a positive economic impact
to the city based on completing these three projects as part of the Rivers District Revitalization.
Qualitative and comparator analyses also indicate that the proposed developments can enhance the
social and cultural foundation of the city, providing facilities and public places for all Calgarians to use
and enjoy.

4
1. Introduction and Scope
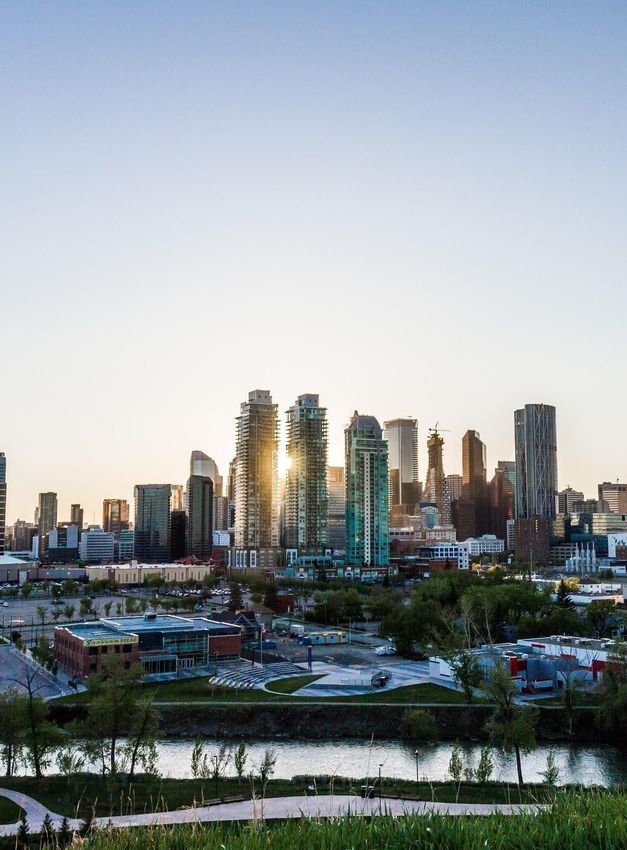
The Rivers District poses an intriguing opportunity to kick-start urban development in Calgary’s
downtown core and help develop the city centre as the heart of a world-class city where people want to
live. Calgary Economic Development (CED), in partnership with Calgary Municipal Land Corporation
(CMLC), has engaged EY to work with key stakeholders to understand the economic impact of building
the proposed culture and entertainment district in the Rivers District on the city of Calgary.
Key Geographic Terms and Uses
This report is intended to evaluate the impact of the Rivers District Revitalization on the city of Calgary.
For this, it is important to understand several key terms used throughout the report:
• Rivers District: Refers to the 504-acre district and CRL boundary that lies at the confluence of
the Bow and Elbow rivers and includes several distinct areas such as East Village, Fort Calgary
and east Victoria Park.
• Rivers District Master Plan (“RDMP”): Refers to the master plan developed by Calgary Municipal
Land Corporation (“CMLC”) encompassing a smaller 286-acre subset of the Rivers District, also
known as east Victoria Park.
• Rivers District Revitalization (“RDR”): Refers to the scope of this EIA which includes
developments within the RDMP and the three proposed major projects: the expansion Arts
Commons, the expansion of the BMO Convention Centre and the construction of a new Event
Centre.
Refer to Figure 1 for a better understanding of the differentiation between these terms.
5
Figure 1: Boundaries of the Rivers District, RDMP study area, and Rivers District Revitalization

Description of the Rivers District Revitalization
The Rivers District lies at the confluence of the Bow and Elbow rivers and is conveniently located close
to downtown Calgary. The District has long been known as the centre of Calgary’s culture and
entertainment scene and encompasses some of the Calgary’s most notable landmarks including the
Calgary Stampede, BMO Centre and the Saddledome. Although the area draws over 3 million visitors per
year, the Rivers District today is an underutilized portion of real estate with the potential to become a
world-class culture and entertainment district. The RDR considers a substantial investment in the district,
including three significant construction projects:
    •   Expansion of Arts Commons
    •   Expansion of the BMO Centre
    •   Construction of a new Event Centre

The results of this investment would be lively, high-density, mixed-use district that draws on the spirit
of entertainment and contributes to a culturally vibrant and healthy community in Calgary.

6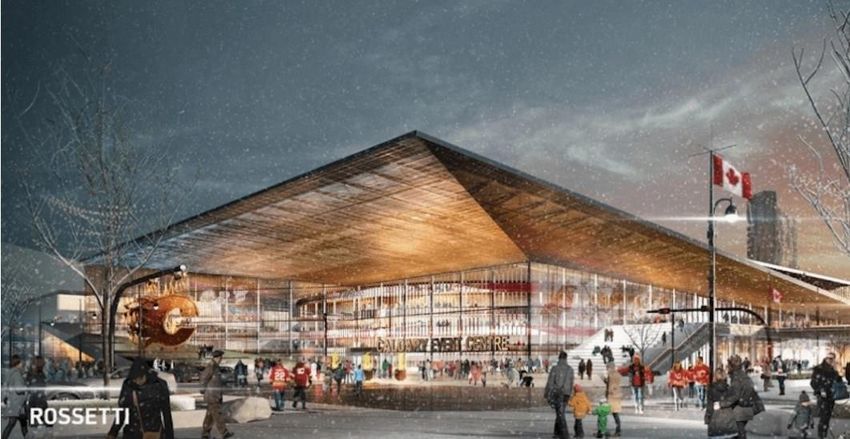
Scope of the Report
The scope of this report is focused on the three primary projects mentioned above (expansion of Arts
Commons, expansion of BMO Centre and construction of a new Event Centre). The primary areas
considered when looking at impacts are those within the Rivers District Master Plan (“RDMP”) study
area, and potential impacts on adjacent neighborhoods are noted where appropriate.

Out of Scope Items
Any considerations and analysis related to funding structures or arrangements, such as public
subsidization of any of the facilities, are out of scope. Additionally, all cost-benefit analysis or
opportunity-cost analysis is also out of scope.

Key Questions Addressed
This report looks to answer several key questions, including:
    •   What impact will the revitalization of the Rivers District have on the local economy?
    •   How will these investments contribute to GDP, labour income, employment and output?
    •   Will there be spillover effects to other sectors of the economy in Calgary? How significant?
    •   What could the value of a thriving cultural and entertainment sector be for the community?
    •   How will the Rivers District Revitalization contribute to the goal of establishing Calgary as a
        vibrant culture and entertainment destination in Canada and around the world?
    •   What impacts have other jurisdictions experienced when completing similar developments?

Key Stakeholders
It is important to critically evaluate the potential impact of any investment in the community to ensure
that all concerned stakeholders have all the relevant information. The stakeholders involved as part of
this analysis include:
    •   Arts Commons
    •   Calgary Arts Development
    •   Calgary Economic Development
    •   Calgary Municipal Land Corporation (CMLC)
    •   Calgary Sports and Entertainment Corp.
    •   Calgary Stampede

Key Message: The purpose of this report is to assess the economic and qualitative impacts of the
proposed Rivers District Revitalization, including the (1) expansion of Arts Commons, (2) expansion
of the BMO Centre, and (3) construction of a new Event Centre.

7
2. The Rivers District and Calgary Today
    2.1.        East Victoria Park Today
East Victoria Park has long stood as the city’s entertainment epicentre, and is home to some of Calgary’s
most iconic landmarks, such as the Calgary Stampede and Saddledome. As the city’s oldest
neighbourhood, the area has long been neglected despite its character and interesting architecture that
includes several heritage buildings. Except for certain events throughout the year, the area today is
generally underutilized and covered in large part by surface parking lots. The RDR is an opportunity to
build on the neighbourhood’s heritage to create a successful culture and entertainment district that
stimulates private investment and will ultimately change the perception of both the area and the city.

    2.2.        Surrounding Areas Today
While the primary focus of this assessment was to evaluate the impact of the Revitalization on the RDMP
study area, the projects under consideration would likely cause spillover effects into the surrounding
areas. These spillover effects could be either positive or negative and would influence factors such as
property values, wages, the environment, employment, as well as having impacts on culture, society,
connectivity and tourism in the city of Calgary.

One surrounding area of note is East Village, which lies to the north of the RDMP study area. Like the
RDMP study area, East Village was formerly one of Calgary’s most underdeveloped districts and its
reputation as such left it unable to attract private investment. In response to this, CMLC was formed with
the mandate to revitalize the Rivers District starting with East Village. Since that time, several large
investments in the area have been made, including building the RiverWalk, revitalizing St. Patrick’s Island
and constructing the recently completed and globally renowned new Central Library. This intervention
has proven to be highly successful as evidenced by the major private, follow-on investments that have
occurred in the area, including the construction of numerous high-rise residential condominium units,
small and medium sized retailers and restaurants. The significant momentum has increased the
perception and popularity of East Village, changing the demographic profile and attracting new residents
and visitors.

Table 2 presents some information about the areas in and around east Victoria Park (including East
Village) that are likely to capture these spillover effects. For a more in-depth discussion on potential
spillover effects, see section 9 of this report.

8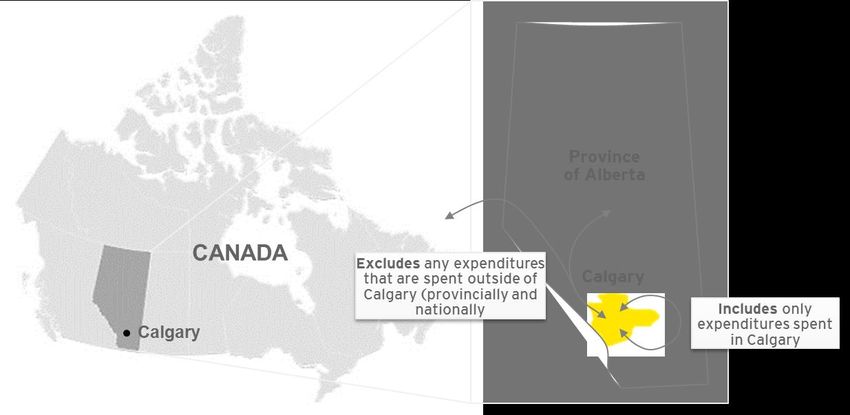
Table 2: Details of Surrounding Areas

     Details                      East Village         Ramsay            Inglewood            Beltline         Mission             Erlton              Core

     2018
                                      3,543              2,187              4072              24,887             4,673             1,303               8,464
     Population

     Change from
                                        9%                 3%                 5%                13%                5%                 4%               - 3%
     2016

     Demographics (approximate, based on 2016 population distributions)

     65+                               684                173                355               1,622              657                120               737
     20-64                            2,662              1,660              3,072             21,193             3,904             1,049               6,749
     15-19                             117                 65                 87                369                25                 24               127
     5-14                               26                140                223                468                32                 43               308

     0-4                                53                150                334               1234                55                 68               543

     No. Residences                   3,203              1,145              2,403           18,029               3,486               731               5,686

     Residential
                                       7.9%               4.2%               5.1%               8.5%             4.5%               4.9%               7.9%
     Vacancy Rate
     Median
     Household                      $48,913            $84,011            $86,101            $76,408           $79,433           $146,148             $54,502
     IncomeA
     Change from
     2010 (Before-                  $28,198            $38,903            $17,549            $19,117           $16,352            $40,334             $12,080
     Tax Levels B,3,4,5
Note:               Difference between median household incomes in 2015 and 2010 not adjusted for inflation. Numbers have been
                    rounded.
                    A: Source – 2016 Federal Census. Indicates before-tax income in 2015 dollars
                    B: Indicates before-tax income in 2010 dollars
Source:             EY calculations.

Key Message: The RDR has the potential to transform an underutilized portion of the city of Calgary
as well as have impacts on the surrounding areas.

3
    City of Calgary. “Census by Community 2018.” Calgary Civic Census, 2018.

4
    Statistics Canada. “2016 Federal Census.”

5
    City of Calgary. “Community profiles.” < http://www.calgary.ca/CSPS/CNS/Pages/Research-and-strategy/Community-profiles/Community-Profiles.aspx>

9
3. Rivers District Revitalization
The RDMP is a proposed mixed-use development project located in the east Victoria Park region of
downtown Calgary. The plan outlines the development of 4,000,000 sq. ft. of mixed-use development
space, with the intention of attracting over 8,000 new residents to the area. CMLC envisions this space
as a vibrant, high-density, mixed-use community that attracts tourists from across the globe, and
establishes Calgary as a premier destination for arts, culture, and entertainment. The Rivers District
Revitalization includes three mega-projects with these being: the expansion and renovation of Arts
Commons; the expansion of the BMO Centre; and the construction of a new Event Centre. Note that the
projects are listed alphabetically and the order does not indicate prioritization or importance.
3.1. Arts Commons Expansion
Arts Commons (“AC”) currently serves as the arts and cultural hub for the city of Calgary. Today, it
includes a collection of performance spaces, rehearsal halls, theatre workshops, offices, meetings rooms
as well as a café and display areas for art work. As the home of six resident organizations (including
Alberta Theatre Projects, Arts Commons Presents, Calgary Philharmonic Orchestra, Downstage, One
Yellow Rabbit and Theatre Calgary) that promote the arts, it provides a much-needed space to foster
creative expression in Calgary. The expansion and renovation of Arts Commons will be carried out in two
phases. The first phase will convert approximately 440,000 sq. ft. of land into cultural space designed
to house three mixed-use venues: a 1,200-seat proscenium theatre; a 350-seat black box theatre; and a
smaller 100-seat black box theatre. The second phase of the project will involve renovating the existing
33-year-old AC structure into a modern space for arts and community events.
10Figure 2: Rendering of the proposed Arts Commons Expansion
The transformed Arts Commons will also include an active park space inside Olympic Plaza, a residential
complex, and a parkade. The space will be designed to accommodate the diverse needs of a world-class
city, and align both Calgary’s and Alberta’s long-term strategic objective to build a culturally vibrant and
healthy community.
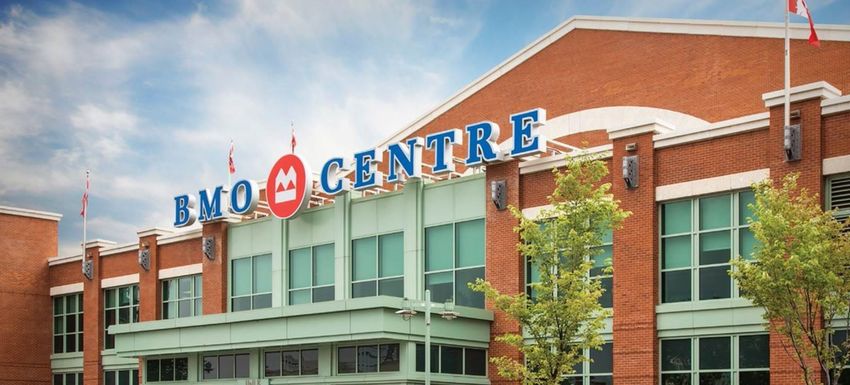
3.2. BMO Convention Centre Expansion
The BMO Centre today is Calgary’s largest convention and exhibition space with approximately 270,000
sq. ft. of rentable space – 250,000 sq. ft. of which is classified as exhibition space. It is a Tier 2
convention facility by Canadian standards. The BMO Centre today is primarily associated with consumer
shows and is not considered as an ideal venue for many other business-related events due to a lack of
meeting and breakout space, these being drivers for out of town meetings and conventions. The BMO
Centre’s exhibit space utilization is greater than 70% therefore not allowing for larger meetings and
conventions to choose Calgary as their destination. (A utilization rate this high is considered to be at
maximum capacity by industry norms.)
11Figure 3: Exterior of the BMO Convention Centre today
The BMO Centre expansion project calls for the expansion of the BMO Convention Centre to become a
Tier 1 facility that can compete with Toronto, Montreal and Vancouver for large meetings and
conventions. By adding over 500,000 sq. ft. the BMO Centre will almost double in size. In addition to the
expansion, it is also expected that there will be construction of a new hotel in the vicinity to accommodate
the new visitors.
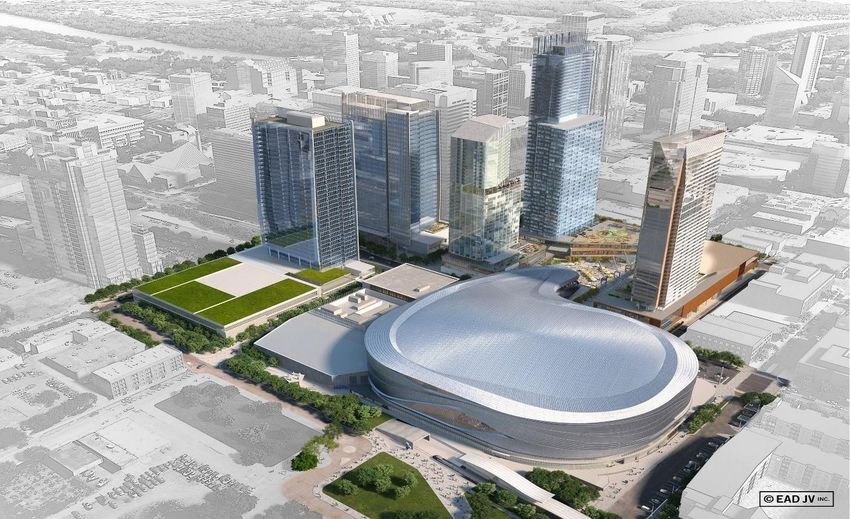
3.3. New Event Centre
The third major project includes the construction of a new Event Centre to replace the aging Scotiabank
Saddledome. The Event Centre would have the capacity to seat approximately 18,000 people, and would
cover approximately 600,000 sq. ft. More than just a hockey arena, the Event Centre would be used for
sporting events, concerts, and other forms of entertainment and is designed to interact with the public
space surrounding it to create a community space open to all citizens, regardless of their attendance at
hockey games. Furthermore, the Event Centre would support an active Festival Street, retail at street-
level and dynamic programming around it to become part of the new culture and entertainment district.
12Figure 4: Rendering of the proposed Event Centre
In addition to the major projects outlined above, the RDMP also calls for other notable developments,
including:
• Retail/Commercial Space: Over the approximated 20-year revitalization period, the potential
space created by new developments within east Victoria Park would have the capacity to
accommodate over 150,000 sq. ft. of new retail and commercial space. This would include coffee
shops, clothing stores, hotels, and more.
• Residential Space: The planned developments for the Rivers District have the potential to
accommodate approximately 4 million sq. ft. of residential space. This would include the
construction of enough residential units to accommodate up to 8,000 residents.
• Stampede Trail & 17th Avenue Promenade: Building on the culture of the 10-day event,
Stampede Trail will become a place for local and independent retailers to thrive while also serving
as a designated festival street that can be closed to vehicular traffic when required. A 17th
Avenue connection will be built to improve the connectivity between Calgary’s exciting Beltline
communities and the proposed cultural and entertainment district. Improving access for
pedestrians as well as those taking transit will increase the walkability and connectivity of
Calgary’s downtown.
• Public Space Development: The RDMP outlines how an integrated open space plan is delivered
within the community to create a variety of spaces and places of different sizes and scales that
integrate with pedestrian streets, lanes, plazas and parks. It is designed to link existing
neighbourhoods along with existing and future entertainment destinations. The future Green
13Line LRT station will anchor the north boundary of the district between 4th and 5th Street SE and
provide an important transit connection to the area.
• 5th Street Underpass: The RDMP examines the critical connections necessary to reconnect the
district into its surrounding neighbours and ensure that as development progresses, access for
pedestrians, cyclists and vehicles meets the needs of a growing community. The 5 th Street
Underpass will provide a critical north – south connection into east Victoria Park while also
allowing for the establishment of the Festival Street along 4th Street SE.
3.4. Alignment with Calgary’s Economic Strategy
In 2018, city Council adopted “Calgary in the New Economy”, the economic strategy for Calgary. The
strategy identified four key areas of focus (Talent, Innovation, Place and Business Environment) targeted
at turning the city’s vision for the future economy into reality: “Calgary is the city of choice in Canada
for the world’s best entrepreneurs. We embrace innovation and create solutions to meet the world’s
needs in food, health, energy and transportation.”
Figure 5: Focus Areas for Calgary’s Economic Strategy
The RDR has the potential to be a key catalyst to delivering the “Place” element of the strategy, the
mandate of which is “Making Calgary Canada’s most livable city”. The key initiatives outlined in the
strategy are to:
• Accelerate urbanization and connectivity in the Core;
• Expand and enhance tourism, cultural and recreational assets; and
• Actively support diversity and inclusion
The overarching goal of this focus area is to make Calgary a more attractive place to live, work and play
which should result in the city, and downtown, being able to attract new employers, young professionals
and top talent as well as enticing organizations already here to grow and expand locally. Today, the
perception of Calgary is that cultural and arts experiences are limited, and individuals for whom these
experiences are a priority, may feel the need to leave the city to find them. The RDR presents an
opportunity to change this perception by developing a strong arts, culture and entertainment district to
improve the citizen experience. Additionally, the area would also create a central focal point that will
help attract tourists to the city.
14Key Message: The RDR is a proposed mix-use development project located in the east Victoria Park region of Calgary. The master plan outlines development of 4,000,000 sq. ft. of mixed-use space, with the intention of attracting over 8,000 new residents to the area. It is directly supportive of enhancing the “Place” component of Calgary’s economic strategy. 15
4. Description and Methodology of an EIA
     4.1.         Assessing Economic Impacts
An economic impact assessment (“EIA”) is a tool that economists use to quantify the effects of a certain
event on the level of activity within a given area. EIAs estimate the impacts of these events on key,
economic indicators and categorize them into the three distinct categories of direct economic impacts,
indirect economic impacts, and induced economic impacts (defined in section 4.2 below).

This EIA for the Rivers District Revitalization examines the economic footprint associated with the
current and projected capital and operational activities of the three major projects. The assessment will
estimate the impacts on the following economic indicators (defined in section 4.4 below):
     •   GDP (or local value added);
     •   Labour income;
     •   Employment
     •   Output

To estimate these impacts, EY used a successful and proven methodology based on sound economic
principles. This approach has been carefully considered and customized to the unique needs of the Rivers
District Revitalization, and employs a methodology that will enable comparisons to other EIAs. An
overview of the approach and additional details are outlined below, however, it is important to note that
some of the steps are conducted in a parallel or overlapping fashion and are not necessarily sequential.

16
Step Description
Performed a detailed review of the existing literature from industry, government,
and academic sources. The review included developing an understanding of
economic outcomes of several types of investments relevant to the RDR including:
• Community revitalization;
Review of • Development of mixed-use communities; and
Literature • Construction of mega-projects as a catalyst for development.
Obtained background data on the proposed investments in the RDR, including capital
and operational expenditures for the projects to determine the local economic
impacts to the city of Calgary. This data and information provides the basis for:
• Evaluating the landscape of the Rivers District, including area information
and usage of potential facilities;
Review of • Assessing the current and future economic state of the Rivers District; and
Background • Developing the economic model to determine impacts of the investments on
Material GDP, employment, labour income, and output.
Note: EY signed a non-disclosure agreement (NDA) and therefore details of capital
and operating expenditures for the facilities are not shared within this report.
Using data gathered in the previous step, employed Statistic Canada’s provincial
2014 Input-Output (“I-O”) Model to assess direct and indirect impacts of the RDR on
Calgary’s economy including effects on:
• GDP
• Labour income
• Job creation
Model • Output
Economic This information was also supplemented with an in-depth qualitative analysis based
Impacts on the current (and projected) landscape of the city of Calgary.
Note: For reasons described in section 4.3, our analysis excludes induced impacts
associated with the RDR.
Developed criteria to identify comparator jurisdictions that underwent, or are in the
process of, constructing developments like the RDR to understand potential:
• Changes in economic activity and effects on indicators like employment,
median income and wages, property values etc.;
• Further redevelopment opportunities and follow on investments; and
• Impact on the branding of the city.
Analyze After thorough analysis, final selected jurisdictions were:
Comparative • ICE District in Edmonton;
Jurisdictions • Arena District in Columbus;
• Nashville Yards in Nashville; and
• Union Station in Denver.
Develop a comprehensive report detailing the impacts of the proposed RDR.
Summarize
Results
174.2. Approach for Detailed Literature Review
As an initial step to the assessment, EY conducted a thorough review of existing academic and industry
research to inform three important areas of analysis relevant to the Rivers District Revitalization:
• Critiques and limitations of the I-O, and other, economic models: Research on this topic
informed several adjustments to the specific methodology used to estimate the economic
impacts e.g. the risk of overstating impacts due to the inclusion of induced impacts (refer to
section 4.3).
• Value of mixed-use developments: Research on this topic heavily informed considerations used
in conducting the qualitative analysis including spillover effects.
• Outcomes from other community revitalization projects: Research on this topic informed both
the qualitative analysis, as well as the jurisdictional analysis.
In addition to references to research that are included throughout this report, a summary is included in
section 7.
4.3. Definitions of Direct, Indirect, and Induced Impacts
Although EIAs can use any one of several models, for the purposes of the Rivers District Revitalization,
EY determined that Statistics Canada’s Input-Output model was most appropriate as it is able to balance
economic rigour with easily understood outputs. This framework categorizes the effects of an event, the
three mega-projects in this case, into three distinct types of impacts: direct, indirect, and induced
impacts. These impacts individually, as well as collectively, represent how the activities within the District
ripple throughout the economy (see Figure 6).
Figure 6: Direct, Indirect and Induced Impacts of the Rivers District Revitalization
Source: EY illustration.
Before reviewing details of the I-O methodology, it is important to understand the definitions of each of
these types of impacts:
18• Direct impact includes the economic impact supported directly by the proposed capital
investment costs and post-construction operation costs. This represents the value-added to
Calgary’s economy as a direct result of the capital spending on new and existing facilities as well
as operational expenditures.
• Indirect impact includes the economic impact from business activities supporting the business
operations of the Rivers District Revitalization. The indirect impacts include, among other things,
the impacts from suppliers’ spending when purchasing goods and services from other suppliers
in the area. For the Rivers District, this includes the expenditures by general contractors on
goods and services such as lumber, equipment, and general labour.
• Induced impact includes the economic impact that occurs when employees that benefit from the
economic activity in the Rivers District (including those directly employed) spend their incomes
on goods and services throughout the Calgary economy. The induced activities are assumed to
be primarily in service or consumer-related industries such as retail, transportation,
accommodation, restaurants, housing and finance. The jobs and income that result from these
consumer expenditures are also considered induced impacts. Induced impacts can be estimated
based on any number of rounds or iterations of recycling income into increased spending,
economic activity, and additional income. Induced impacts are often estimated based on infinite
iterations of these activities (closed model) and as a result, can overstate the magnitude of
economic impacts, especially when the assumptions made in the model are not realized e.g. if a
significant amount of the additional income is not spent in the region then the positive bias is
amplified with every iteration. Although induced impacts are real economic impacts, they can be
difficult to quantify and their inclusion can potentially overstate the overall impact of an event.
Therefore, in line with the conservative approach adopted for this EIA, induced economic
impacts have been excluded from consideration.
4.4. Methodology for Measuring Economic Impacts
To analyse the economic impacts for both the capital investments and post-construction operating costs
associated with the River District Revitalization, we performed a comprehensive EIA using data provided
by key stakeholders (i.e., Arts Commons, CADA, CED, CMLC, CSEC, and Stampede), publicly available
data, Statistics Canada, and combined these with our own proprietary EY economic model tools (i.e.,
economic models founded on the principles of Statistics Canada’s Input-Output Model). As such, our
analysis will allow us to capture the direct and indirect economic impacts of the Rivers District
Revitalization on the city of Calgary.
For the purposes of this EIA, Statistics Canada’s Input-Output (“I-O”) model was selected. The I-O model
uses economic multipliers specific to provinces and regions to translate the direct impacts of capital and
operational expenditures into indirect impacts, which will collectively define the total estimated economic
impact of the RDR. We will express the economic impacts in terms of the following economic indicators:
• Full-time equivalent employment (“FTEs”): This refers to the total number of employee jobs that
are converted to full-time equivalence based on the overall average full-time hours worked in
either a business or government sector. Note here that this measure does not account for those
who are self-employed. This is a better estimate as it does not overstate or understate the
19number of jobs created. Further, the FTE job metric is measured in “person-years”, as in the
number of hours needed for individuals to work in order be classified as such.
• Wages or labour income: A component of the local value-added that measures the total
employee compensation (value of wages and benefits) and proprietor income.
• Gross Domestic Product (“GDP”): GDP, or local value added, is a measure of the value of all final
goods and services produced in a specific region (i.e. the city of Calgary).
• Gross Output: The total economic activity of new goods and services within the City of Calgary.
It is important to note that these impacts are all expressed in gross terms, as opposed to net. Whereas
net impacts would indicate the incremental value of new construction, gross impacts indicate the total
value of the capital and operational expenditures including the impact of current operations.
To estimate the total economic impact of the RDR, we rely on using Statistics Canada’s most recent 2014
economic multipliers that reflects the proposed construction and expansion of the three facilities. These
multipliers reflect how Statistics Canada tracks the interdependency between different sectors in the
economy. Each of these multipliers is a number that describes the size of the total economic impact for
a given level of spending. For example, a multiplier of 1.2 suggests that the total economic impact for
every dollar spent on the Rivers District Revitalization adds an additional 20 cents to the economy. In
other words, for every dollar spent, the economic activity from supporting businesses and consumers
generates an additional 20 cents for the local economy. Statistics Canada’s I-O model is used by both
public and private sector organizations as well as researchers, and is based on a widely accepted
methodology for estimating these types of economic linkages. Please refer to Appendix A.1 for a more
detailed description of the I-O model and its underlying assumptions and restrictions.
4.5. Adjustments
To assess the RDR’s economic impact, we adjust the estimated capital and operating costs to only include
those that are specific to the city of Calgary and represent value-added to the local economy. The
Statistics Canada Input-Output model used for this analysis is constructed only for the national and
provincial economies, but not for sub-regions. Thus, an adjustment must be made to estimate regional
impacts to the city of Calgary. Here, we separate expenditures that are locally sourced versus those that
are sourced from outside the city of Calgary (e.g. how much of the labour costs are paid to employees
residing in Calgary compared to outside, and what proportion of the expenditures are spent on purchases
of goods and services located in Calgary compared to outside of Calgary – Figure 7 below). This
distinction between local and external expenditure is critical for the size of the directional impact analysis
and must be considered when assessing the direct and indirect impacts. An example of this is line items
associated with purchases from retail or wholesale suppliers that would not be fully realized within the
city of Calgary, as a large percentage would be sourced from outside of the city.
20Figure 7: Adjusting Impacts only to Consider Regional Effects
Source: EY illustration.
More specifically, we would adjust the impacts to consider, among other things, the following:
• Businesses supporting the operations of the facilities (i.e. Arts Commons, the BMO Centre and
the Event Centre) within the Rivers District that are located outside of the city of Calgary.
• Wages and salaries paid to employees of the facilities within the Rivers District that may not
reside within the city of Calgary, and are likely to spend their labour incomes outside the city’s
boundaries.
• Expenditures paid to general contractors hired during the construction phases of the RDR that
are not located within the city of Calgary.
These adjustments are made by considering the traded or local nature of the industries in the Statistics
Canada I-O model and the city’s relative specialization in each industry. Relative specialization is
assessed by calculating the ratio of employment of a certain sector in Calgary to the total employment
of that same sector in the province. This provides a reasonable proxy to assess the concentration of
sectors within Calgary and adjust the total economic impacts for each industry that is likely affected from
the operations of the RDR. Given that the I-O model provides a detailed description of which industries
are predicted to be impacted from the collective expenditures of the RDR, we would then be able to adjust
each industry individually based on the concentration of sectors within the city of Calgary. This would
provide adjusted indirect impacts specific to the city.
214.6. Boundaries
When carrying out any EIA, it is important to clearly define the geographical scope of the area of interest.
In this case, the area of consideration is the jurisdiction in which the activity or project is taking place,
which could be at the neighbourhood, city, provincial, or national level. This is to ensure that the area of
direct influence is captured to properly account for those individuals and groups that are directly
affected. It is also important to properly define the geographical scope of the analysis so that the
distributional impacts on surrounding areas can be properly assessed. This ensures that both qualitative
and quantitative benefits and consequences to these regions are considered. For the purposes of this
EIA, boundaries used were those defined by the developing organization within their own materials and
literature.
4.7. Limitations of Economic Impact Assessments
While the I-O methodology outlined above is widely accepted for carrying out EIA, it does have
shortcomings. Brief descriptions of notable limitations are below, with a more detailed description
provided in Appendix A.1:
1. I-O models assume that there is an unlimited supply of workers available for production. It
does not consider that expanding production in one industry could result in a redistribution of
labour as opposed to an increase in employment in another. More specifically, the numbers
provided by the I-O model in terms of FTEs may not necessarily imply an incremental change in
total workers, but rather an upper limit as to what is expected.
2. I-O models do not take into consideration the alternative uses or opportunity costs associated
with allocating funds towards one project vs. another. For example, in the case of the RDR,
public funds allocated towards the construction of Arts Commons, the BMO Centre or the Event
Centre could go towards other uses. Allocating these funds towards alternative areas will
produce their own economic impacts, which could be larger or smaller than the outcomes from
the RDR. Moreover, there is a cost associated with raising funds through public means that is not
considered in economic impact analyses. In general, the analysis does not adjust for or separate
expenditures by private or public funding.
3. Results from the model should not be interpreted as causal, meaning that the numbers
produced by the I-O model may not be solely attributable to the RDR. Assume for instance that
the I-O model revealed that because of the capital and operational expenditures associated with
the RDR, X amount jobs would be created. In this case, we cannot assume that all X jobs would
be a result of these expenditures. It could be the case that general contractors hired to construct
portions of the project added additional workers to address potential labour shortage issues, and
that it just so happened to coincide with the period in which the revitalization was occurring.
4. The model assumes that all spending will generate positive impacts. In this case, all multipliers
in the model are greater than zero, suggesting that any level of spending will generate positive
economic impacts, which is not the case in all circumstances. Some studies have shown that
22when accounting for macroeconomic shocks, the indirect impacts from government spending
have been negative in the long run.6
5. The I-O model assumes constant returns to scale, meaning that an increase of X in inputs should
lead to the same X increase in output. More formally, an increase in inputs causes the same
proportional increase in outputs. For instance, if a manufacturing plant increases its labour force
by say 10 units, then the output produced by that facility will also increase by 10 units. More
intuitively, the ratio of inputs and outputs is always equal to 1.
6. The model does not account for substitution amongst inputs, and that each industry in the
model is regarded as having a single static production process. Further, the model does not
account for any technology shocks that may occur, or consider that businesses likely become
more efficient over time.
7. The impact of visitors and tourism is not considered. In this case, the I-O model used to carry
out our analysis does not account for the impacts associated with both the number and spending
propensities of visitors to the Rivers District. As a result, the economic impacts may be
understated.
Another important point to note is the difference between an EIA and a cost-benefit analysis (“CBA”). A
CBA is based on the principles of welfare economics, and is an economic efficiency model that measures
the economic advantages and disadvantages of an event or policy by assessing its cost and benefits to
calculate net changes in welfare. In other words, it identifies net benefits (i.e. benefits less costs) for
relevant stakeholders by disaggregating inputs of an EIA (i.e. capital and operational expenditures) into
categories of costs and benefits. As an example, in a CBA, wages paid to workers for the Arts Commons,
BMO Centre and Event Centre would be treated as a benefit for the individual worker, but also as a cost
for each of the businesses. In contrast, an EIA would treat these wages as simply an input within the
model, without differentiating between costs and benefits. Additionally, unlike EIAs, CBAs also account
for opportunity costs, and explicitly comparing the “status quo” baseline scenario to evaluate incremental
changes. CBAs look at the broader question of societal gains and losses due to a policy or project, while
an EIA looks only at economic benefits. Further, EIAs are based on the concept of multiplier analysis, and
as mentioned previously, are carried out using standard I-O modelling. EIAs examine the effect of an event
or project on the economy within a specified area, and typically measure changes in key indicators such
as jobs, labour income, GDP and gross output.
Key Message: EY followed a proven methodology for the EIA using Statistics Canada’s Input-Output
model and evaluated direct and indirect impacts. Economic impacts are expressed in terms of FTE
employment, labour income, GDP and output. The model has taken a conservative approach as it
does not include induced impacts.
6
Grandy, P., & Muller, R.A, “On the Use and Misuse of Input-Output Based Impact Analysis in Evaluation.” The Canadian Journal of Program Evaluation, 3, no.2 (1988): 49-
61.
235. Overview of Inputs into the I-O Model
Statistics Canada’s Input-Output model uses economic multipliers specific to provinces and regions to
understand the direct and indirect impacts of specific inputs into the area. For the Rivers District
Revitalization, the inputs under consideration are the capital and operating expenditures associated with
the major projects within the district including both phases of Arts Commons, the expansion of the BMO
Convention Centre, and construction of the Event Centre. Details of these inputs as they were provided
for the purposes of this report are provided below and may be subject to revision if construction plans
are changed.
5.1. Capital Expenditures of the Rivers District
Revitalization
Over the entire lifecycle of the three projects, estimated capital expenditures are more than CAD $1.37
billion and are similar in magnitude to analogous projects (for the development of entertainment
districts) that have been or are in the process of being constructed. For an overview of the estimated
capital expenditures associated with these projects, please refer to Figure 8 below. Note that dollar
values shown below are those used in the economic model and were normalized to 2017 dollars.
Nominal dollar values, which match the publicly released figures for the projects, are listed in
brackets.
Figure 8: Major Project Capital Expenditures in 2017 Real $ (Nominal $ in brackets)
Total $1.37 bn. ($1.52 bn).
Arts Commons (Phase 1 & 2) $ 376 mn. ($418 mn.)
BMO Expansion $ 449 mn. ($500mn.).
Event Centre $ 547 mn. ($604 mn.)
Millions 100 400 700 1000 1300 1600 1900
Note: Total capital expenditures have been rounded and are based on information provided to EY by key stakeholders.
Bn. stands for billions and mn. stands for millions. Numbers are reported in 2017 dollars. Capital expenditures
include hard-costs, soft-costs, and other related capital expenditures.
Source: EY calculations.
24The expenditures outlined above can be broken down into:
• Hard-costs: any construction related expenditures for labour, material and general contracting;
• Soft-costs: payments towards consultants for architectural design, engineering, geotechnical,
or other related services; and
• Other-costs: reflect expenditures on project contingencies, administrative work associated with
the construction of the project, equipment expenditures, etc.
For both phases of Arts Commons, 73% of the total capital expenditures are for hard-costs, 14% are
related to soft-costs, and the remaining 13% is attributable to other capital costs (See Figure 9 below).
Figure 9: Breakdown of Capital Expenditures by Type of Cost for Arts Commons
Other Costs
13%
Soft Costs
14% Hard Costs
73%
$376 mn.
(Total)
Note: Percentages have been rounded and are based on data provided by key stakeholders. mn. represented millions.
Numbers are reported in 2017 dollars. Accounts for both phase 1 and phase 2 capital expenditures.
Source: EY calculations.
25For the BMO Centre expansion, 73% of the total capital expenditures are hard-cost related, 16% are soft-
cost related, and the remaining 11% are associated with other capital related costs. (See Figure 10
below).
Figure 10: Breakdown of BMO Centre Expansion Capital Expenditures by Type of Cost
Other Costs
11 %
Soft Costs
16 % Hard Costs
73 %
$449 mn.
(Total)
Note: Percentages have been rounded and are based on data provided by key stakeholders. mn. represented millions.
Numbers reported in 2017 dollars.
Source: EY calculations.
For the Event Centre, of the approximate CAD $547 million in capital expenditures, 67% of these are
hard related costs, 27% are soft related costs, and the remaining 6% are allocated to other-costs (see
Figure 11 below).
Figure 11: Breakdown of Event Centre Capital Expenditures by Type of Cost
Other Costs
6%
Soft Costs Hard Costs
27% 67%
$547 mn.
(Total)
Note: Percentages have been rounded and are based on data provided by third party groups. mn. represented millions.
Numbers reported in 2017 dollars.
Source: EY calculations.
265.2. Operational Expenditures of the Rivers District
Revitalization
Beyond capital investments required to construct these projects, there are also substantial costs
associated with operating them. Operating expenditures refer to the day-to-day maintenance and
administrative costs of running a business such as accounting and legal fees, bank charges, wages and
salaries, travel expenses, office supply costs, rent, utility expenses, repair and maintenance costs, etc.
Operating expenditures can be categorized into three distinct groups:
• Fixed Costs: costs that do not change over time, and must be paid regardless of the businesses
activities or performance. An example of this would be rent paid for a manufacturing facility
where, regardless of company production or earnings, this must still be paid. Other examples of
fixed costs include overhead costs, insurance, and equipment costs.
• Variable Costs: costs that vary (i.e., change) over time with production. The relationship
between variable costs and production are positively correlated with one another, indicating
that as production increases so too do these costs. Examples of variable costs include raw
material costs, payroll, utilities, etc.
• “Semi-Variable” or “Semi-Fixed” Costs: costs that have criteria that satisfy both variable and
fixed costs. These costs vary in part with increases or decreases in production, but still exist
when production is zero.
The economic model uses forecasted operating expenditures for each of the three facilities from 2024-
2028 because it is assumed that all three facilities will be operational by 2024. Of the total operating
expenditures for this period, it is assumed that 5% will come from Arts Commons, 7% of these are from
the BMO Centre and the remaining 88% will be from the Event Centre. Figure 12 outlines the average
percentage of total operating expenditures forecasted for each facility.
Figure 12: Forecasted Percentage of Total OPEX by Project (2024-2028)
Arts
Commons,
5%
BMO
Centre, 7%
Event
Centre,
88%
Note: Percentages have been rounded and were derived using data provided by key stakeholders and
assumptions made by EY.
Source: EY calculations.
27To protect sensitive data related to operational expenditures for the key stakeholders, additional line
item details are not included in this report, and the model results have been included in aggregate for
the three projects.
5.3. Timeline of District Renovations and Expenditures
The projects planned for the Rivers District Revitalization are assumed to be completed over a six-year
period, beginning in 2019 and ending in 2026.
Phase 1 of the Arts Commons expansion project is set to begin in 2019, and is expected to be completed
by 2024. Similarly, phase 2 of the project will begin in 2021, and is expected to be completed by 2026.
Using data obtained from key stakeholders, as well as careful considerations and assumptions made by
EY, for both phases, 6% of the funds delegated to construction will be used in year 1, while 22% will be
used in years 2 and 3, 21% would be used in years 4 and 5. Finally, the remaining 7% of these costs will
be used in the final year of construction (See Figure 13 below). A breakdown of the Arts Commons project
lifecycle by dollar amounts is also presented (see Figure 14 below).
Figure 13: Percentage Breakdown of Arts Commons Construction Life Cycle
25%
22% 22% 22% 22%
21% 21% 21% 21%
20%
15%
10%
7% 7%
6% 6%
5%
0%
2019 2020 2021 2022 2023 2024 2025 2026
Note: Percentages have been rounded and were derived using data provided by key stakeholders and assumptions
made by EY.
Source: EY calculations.
28Figure 14. Dollar Breakdown of Arts Commons Construction Life Cycle
$million per year
70.0
60 59 Total = $274mn
60.0
50.0
38 31 40
30
40.0
30 29
8
30.0
30
20.0
8 30 30 10
29 29 29
10.0
8 10 10
0.0
2019 2020 2021 2022 2023 2024 2025 2026
Phase 1 Phase 2
Notes: Numbers have been rounded and only reflect hard related costs. Values were derived using data provided
from key stakeholders. Construction costs account for both phase 1 and phase 2. Numbers reported in 2017
dollars. Total hard-cost related to both phases of the arts commons ~CAD $274 million (~CAD $136 million
for phase 1 and ~CAD 138 million for phase 2).
Source: EY calculations.
For the expansion of the BMO Centre, a portion of the building, known as Hall F, will commence in 2019.
However, for the purposes of the economic model and this report, it was assumed that the project would
take four years to complete and that 25% of the costs would be spent in each year (See Figure 16 below).
Figure 15. Percentage Breakdown of BMO Centre Expansion Construction Life Cycle
30%
25% 25% 25% 25%
25%
20%
15%
10%
5%
0%
2021 2022 2023 2024
Note: Percentages have been rounded and were derived using data provided by key stakeholders and assumptions
made by EY personnel.
Source: EY calculations.
29Figure 16. Dollar Breakdown of BMO Centre Expansion Construction Life Cycle
350
300 327
250
$million per year
200
150
100
50 84 83 81 79
0
2021 2022 2023 2024 Total
Notes: Numbers have been rounded and only reflect hard related costs. Numbers were derived using data provided by
key stakeholders. Numbers reported in 2017 dollars.
Source: EY calculations.
For the construction of the Event Centre, construction was assumed to begin in 2021, and is scheduled
to take approximately three years to complete. The life cycle of the construction phase is presented in
Figure 17 below. It was assumed that 34% of the construction costs would be accrued in year 1, while
33% of the construction costs would be accrued in years 2 and 3 respectively. The total dollar amounts
allocated to each year of construction are shown in Figure 18.
Figure 17. Percentage Breakdown of Event Centre Construction Life Cycle
40%
35%
34%
33% 33%
30%
25%
20%
15%
10%
2021 2022 2023
Note: Percentages have been rounded and were derived using data provided by third party groups and assumptions
made by EY personnel.
Source: EY calculations.
30Figure 18. Dollar Breakdown of Event Centre Construction Life Cycle
$million per year
400
350
365
300
250
200
150
100 127 120 118
50
0
2021 2022 2023 Total
Construction Costs
Notes: Numbers have been rounded and only reflect hard related costs. Data provided by third party groups. Numbers
reported in 2017 dollars.
Source: EY calculations.
Key Message: The overall timeframe for completion of the proposed RDR projects is from 2019 – 2026,
and the projects require significant operational and capital expenditures over this period. Total capital
construction and development costs for the three projects are estimated to be ~$1.5 bn. (nominal).
31You can also read